Casey County, KY Map & Demographics
Casey County Overview
$22,970
PER CAPITA INCOME
$49,986
AVG FAMILY INCOME
$42,190
AVG HOUSEHOLD INCOME
29.4%
WAGE / INCOME GAP [ % ]
70.6¢/ $1
WAGE / INCOME GAP [ $ ]
$10,533
FAMILY INCOME DEFICIT
0.48
INEQUALITY / GINI INDEX
15,942
TOTAL POPULATION
7,713
MALE POPULATION
8,229
FEMALE POPULATION
93.73
MALES / 100 FEMALES
106.69
FEMALES / 100 MALES
41.9
MEDIAN AGE
3.2
AVG FAMILY SIZE
2.6
AVG HOUSEHOLD SIZE
6,138
LABOR FORCE [ PEOPLE ]
48.1%
PERCENT IN LABOR FORCE
10.4%
UNEMPLOYMENT RATE
Casey County Area Codes
Income in Casey County
Income Overview in Casey County
Per Capita Income in Casey County is $22,970, while median incomes of families and households are $49,986 and $42,190 respectively.
| Characteristic | Number | Measure |
| Per Capita Income | 15,942 | $22,970 |
| Median Family Income | 3,957 | $49,986 |
| Mean Family Income | 3,957 | $69,383 |
| Median Household Income | 6,029 | $42,190 |
| Mean Household Income | 6,029 | $58,686 |
| Income Deficit | 3,957 | $10,533 |
| Wage / Income Gap (%) | 15,942 | 29.44% |
| Wage / Income Gap ($) | 15,942 | 70.56¢ per $1 |
| Gini / Inequality Index | 15,942 | 0.48 |
Earnings by Sex in Casey County
Average Earnings in Casey County are $26,227, $30,230 for men and $21,329 for women, a difference of 29.4%.
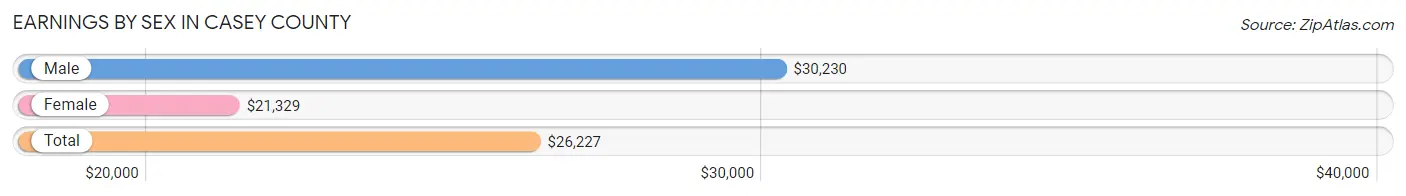
| Sex | Number | Average Earnings |
| Male | 3,562 (53.1%) | $30,230 |
| Female | 3,140 (46.9%) | $21,329 |
| Total | 6,702 (100.0%) | $26,227 |
Earnings by Sex by Income Bracket in Casey County
The most common earnings brackets in Casey County are $30,000 to $34,999 for men (323 | 9.1%) and $2,499 or less for women (359 | 11.4%).
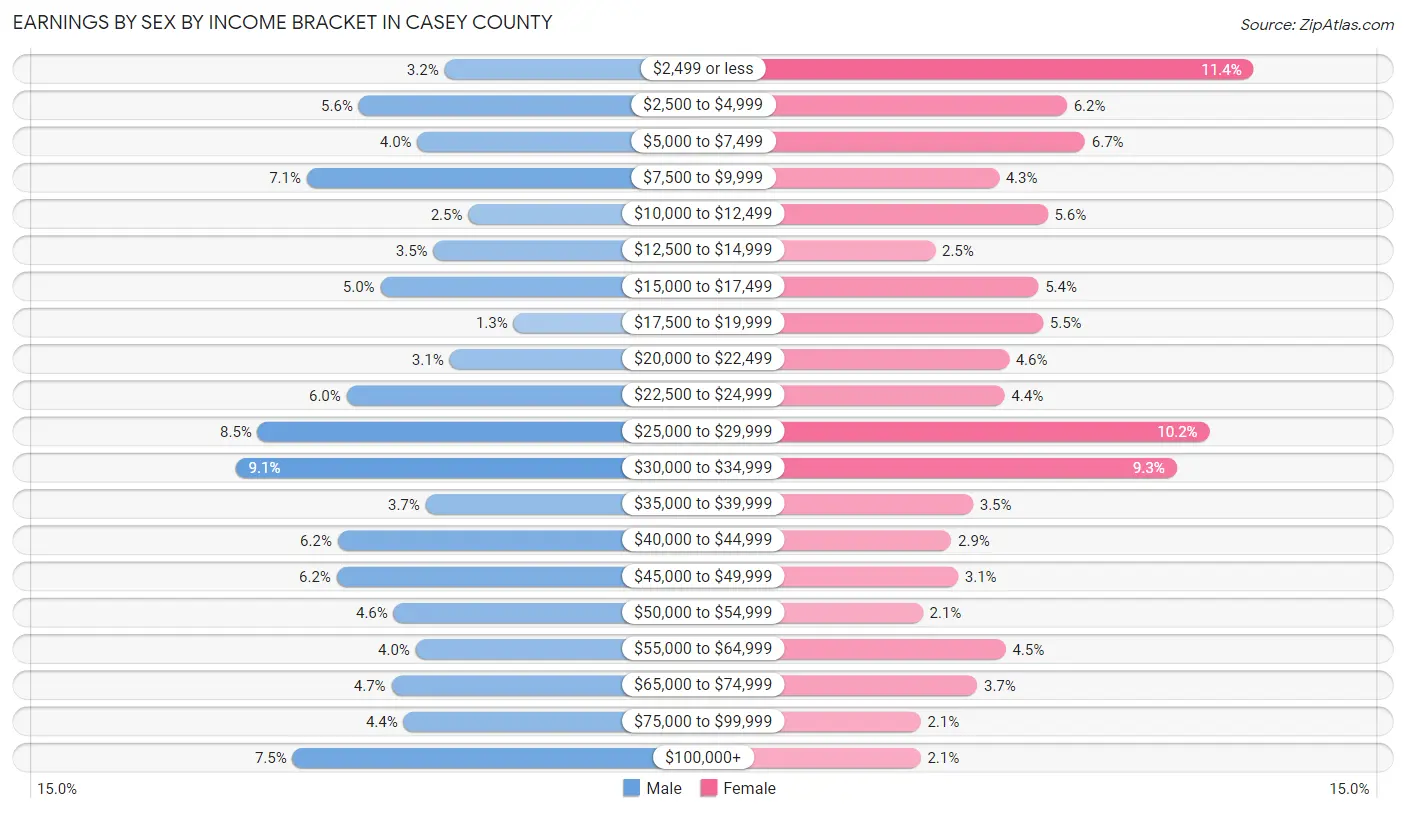
| Income | Male | Female |
| $2,499 or less | 114 (3.2%) | 359 (11.4%) |
| $2,500 to $4,999 | 200 (5.6%) | 194 (6.2%) |
| $5,000 to $7,499 | 141 (4.0%) | 210 (6.7%) |
| $7,500 to $9,999 | 252 (7.1%) | 134 (4.3%) |
| $10,000 to $12,499 | 90 (2.5%) | 177 (5.6%) |
| $12,500 to $14,999 | 125 (3.5%) | 78 (2.5%) |
| $15,000 to $17,499 | 178 (5.0%) | 169 (5.4%) |
| $17,500 to $19,999 | 45 (1.3%) | 173 (5.5%) |
| $20,000 to $22,499 | 109 (3.1%) | 143 (4.5%) |
| $22,500 to $24,999 | 212 (5.9%) | 139 (4.4%) |
| $25,000 to $29,999 | 301 (8.5%) | 320 (10.2%) |
| $30,000 to $34,999 | 323 (9.1%) | 291 (9.3%) |
| $35,000 to $39,999 | 133 (3.7%) | 111 (3.5%) |
| $40,000 to $44,999 | 221 (6.2%) | 92 (2.9%) |
| $45,000 to $49,999 | 222 (6.2%) | 98 (3.1%) |
| $50,000 to $54,999 | 165 (4.6%) | 67 (2.1%) |
| $55,000 to $64,999 | 143 (4.0%) | 140 (4.5%) |
| $65,000 to $74,999 | 167 (4.7%) | 115 (3.7%) |
| $75,000 to $99,999 | 155 (4.3%) | 65 (2.1%) |
| $100,000+ | 266 (7.5%) | 65 (2.1%) |
| Total | 3,562 (100.0%) | 3,140 (100.0%) |
Earnings by Sex by Educational Attainment in Casey County
Average earnings in Casey County are $32,683 for men and $24,268 for women, a difference of 25.8%. Men with an educational attainment of graduate degree enjoy the highest average annual earnings of $59,922, while those with less than high school education earn the least with $20,857. Women with an educational attainment of graduate degree earn the most with the average annual earnings of $46,818, while those with less than high school education have the smallest earnings of $9,318.
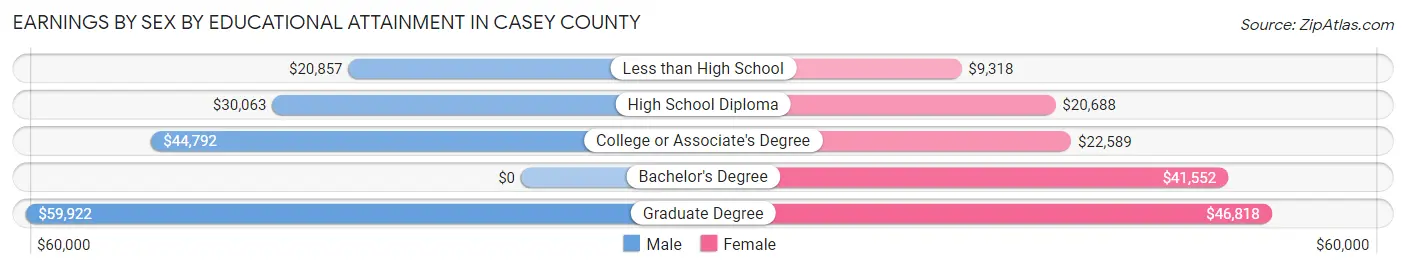
| Educational Attainment | Male Income | Female Income |
| Less than High School | $20,857 | $9,318 |
| High School Diploma | $30,063 | $20,688 |
| College or Associate's Degree | $44,792 | $22,589 |
| Bachelor's Degree | - | - |
| Graduate Degree | $59,922 | $46,818 |
| Total | $32,683 | $24,268 |
Family Income in Casey County
Family Income Brackets in Casey County
According to the Casey County family income data, there are 803 families falling into the $35,000 to $49,999 income range, which is the most common income bracket and makes up 20.3% of all families. Conversely, the $150,000 to $199,999 income bracket is the least frequent group with only 103 families (2.6%) belonging to this category.
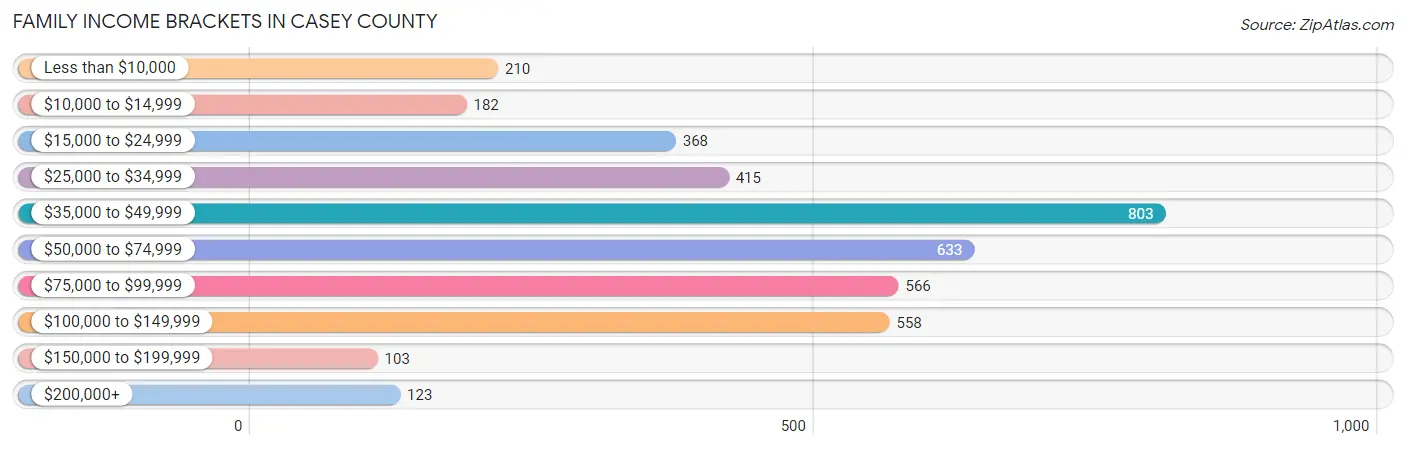
| Income Bracket | # Families | % Families |
| Less than $10,000 | 210 | 5.3% |
| $10,000 to $14,999 | 182 | 4.6% |
| $15,000 to $24,999 | 368 | 9.3% |
| $25,000 to $34,999 | 415 | 10.5% |
| $35,000 to $49,999 | 803 | 20.3% |
| $50,000 to $74,999 | 633 | 16.0% |
| $75,000 to $99,999 | 566 | 14.3% |
| $100,000 to $149,999 | 558 | 14.1% |
| $150,000 to $199,999 | 103 | 2.6% |
| $200,000+ | 123 | 3.1% |
Family Income by Famaliy Size in Casey County
4-person families (484 | 12.2%) account for the highest median family income in Casey County with $71,985 per family, while 3-person families (849 | 21.5%) have the highest median income of $22,599 per family member.
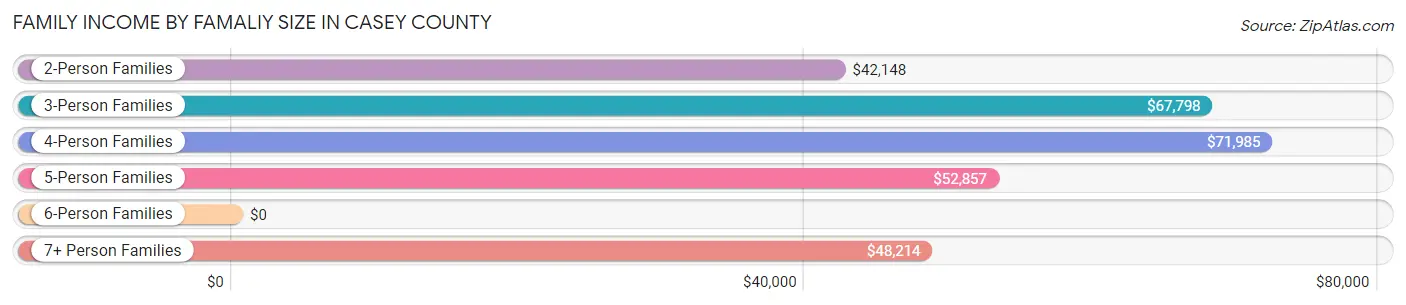
| Income Bracket | # Families | Median Income |
| 2-Person Families | 1,995 (50.4%) | $42,148 |
| 3-Person Families | 849 (21.5%) | $67,798 |
| 4-Person Families | 484 (12.2%) | $71,985 |
| 5-Person Families | 328 (8.3%) | $52,857 |
| 6-Person Families | 123 (3.1%) | $0 |
| 7+ Person Families | 178 (4.5%) | $48,214 |
| Total | 3,957 (100.0%) | $49,986 |
Family Income by Number of Earners in Casey County
The median family income in Casey County is $49,986, with families comprising 3+ earners (377) having the highest median family income of $94,688, while families with no earners (1,081) have the lowest median family income of $34,926, accounting for 9.5% and 27.3% of families, respectively.
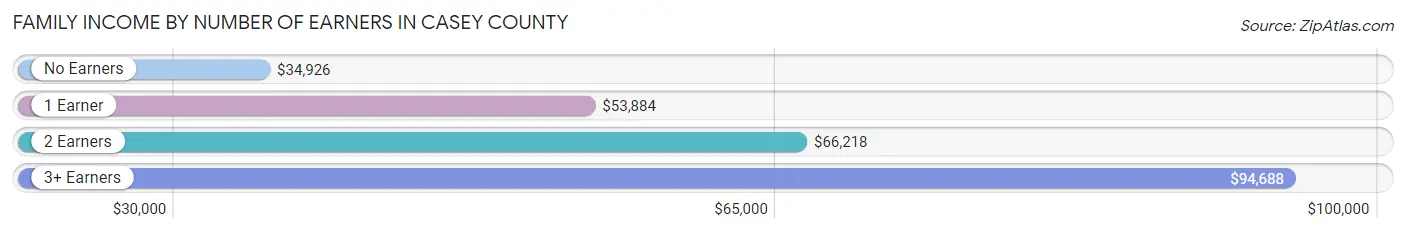
| Number of Earners | # Families | Median Income |
| No Earners | 1,081 (27.3%) | $34,926 |
| 1 Earner | 1,313 (33.2%) | $53,884 |
| 2 Earners | 1,186 (30.0%) | $66,218 |
| 3+ Earners | 377 (9.5%) | $94,688 |
| Total | 3,957 (100.0%) | $49,986 |
Household Income in Casey County
Household Income Brackets in Casey County
With 1,139 households falling in the category, the $35,000 to $49,999 income range is the most frequent in Casey County, accounting for 18.9% of all households. In contrast, only 121 households (2.0%) fall into the $150,000 to $199,999 income bracket, making it the least populous group.
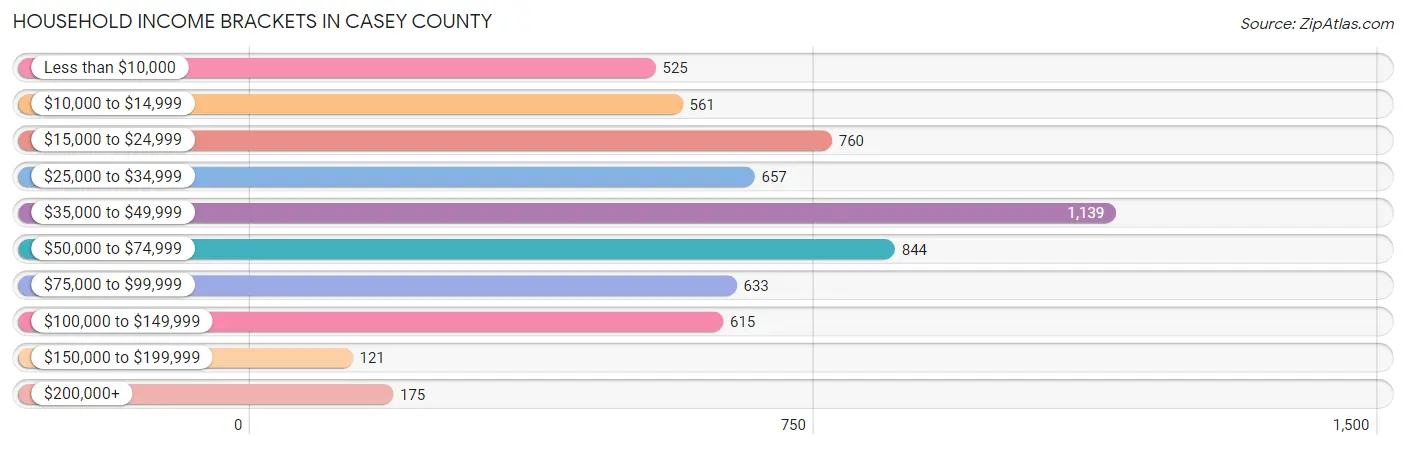
| Income Bracket | # Households | % Households |
| Less than $10,000 | 525 | 8.7% |
| $10,000 to $14,999 | 561 | 9.3% |
| $15,000 to $24,999 | 760 | 12.6% |
| $25,000 to $34,999 | 657 | 10.9% |
| $35,000 to $49,999 | 1,139 | 18.9% |
| $50,000 to $74,999 | 844 | 14.0% |
| $75,000 to $99,999 | 633 | 10.5% |
| $100,000 to $149,999 | 615 | 10.2% |
| $150,000 to $199,999 | 121 | 2.0% |
| $200,000+ | 175 | 2.9% |
Household Income by Householder Age in Casey County
The median household income in Casey County is $42,190, with the highest median household income of $48,023 found in the 25 to 44 years age bracket for the primary householder. A total of 1,498 households (24.8%) fall into this category. Meanwhile, the 65+ years age bracket for the primary householder has the lowest median household income of $38,046, with 2,054 households (34.1%) in this group.
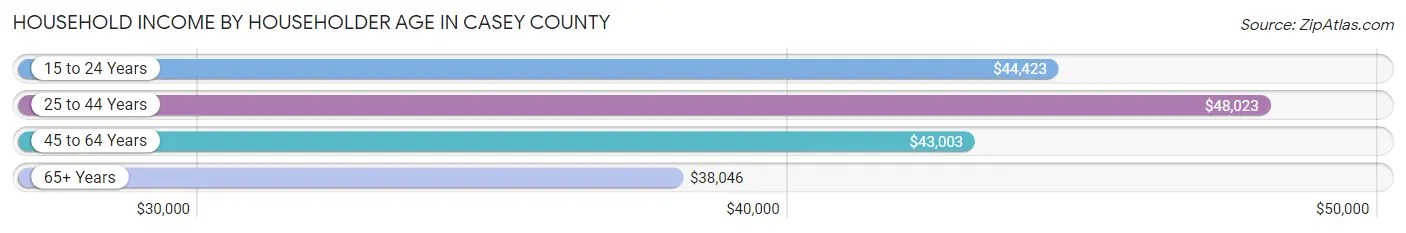
| Income Bracket | # Households | Median Income |
| 15 to 24 Years | 246 (4.1%) | $44,423 |
| 25 to 44 Years | 1,498 (24.8%) | $48,023 |
| 45 to 64 Years | 2,231 (37.0%) | $43,003 |
| 65+ Years | 2,054 (34.1%) | $38,046 |
| Total | 6,029 (100.0%) | $42,190 |
Poverty in Casey County
Income Below Poverty by Sex and Age in Casey County
With 24.3% poverty level for males and 27.8% for females among the residents of Casey County, 16 and 17 year old males and 15 year old females are the most vulnerable to poverty, with 118 males (45.9%) and 53 females (69.7%) in their respective age groups living below the poverty level.
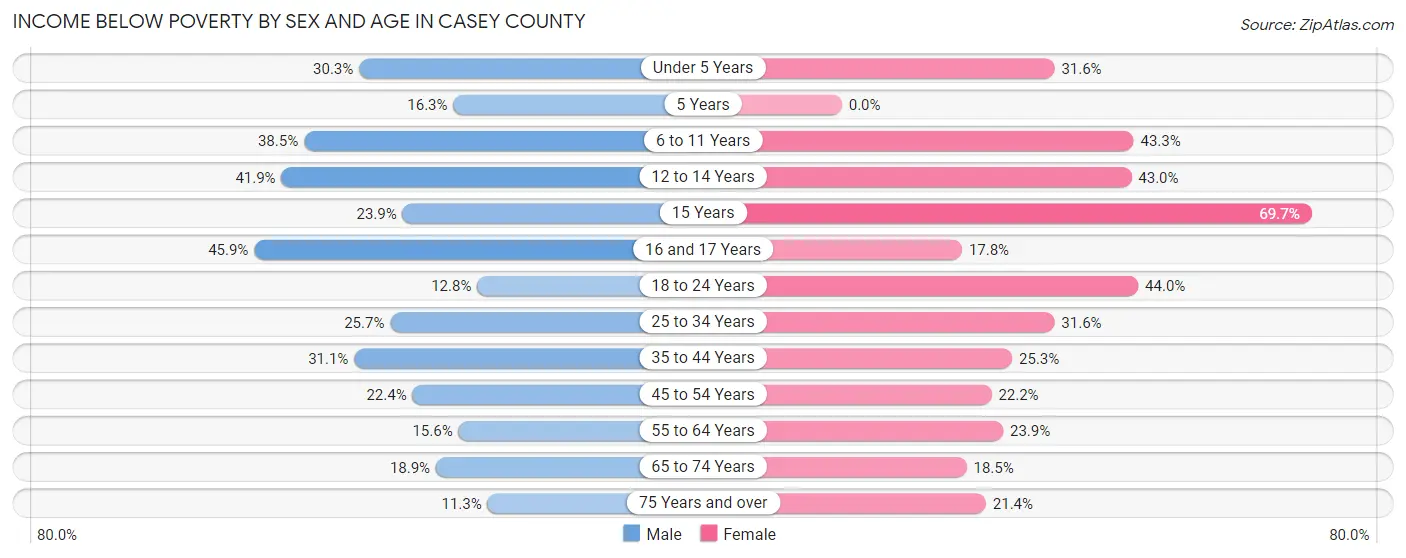
| Age Bracket | Male | Female |
| Under 5 Years | 138 (30.3%) | 186 (31.6%) |
| 5 Years | 8 (16.3%) | 0 (0.0%) |
| 6 to 11 Years | 248 (38.5%) | 243 (43.3%) |
| 12 to 14 Years | 126 (41.9%) | 132 (43.0%) |
| 15 Years | 16 (23.9%) | 53 (69.7%) |
| 16 and 17 Years | 118 (45.9%) | 38 (17.8%) |
| 18 to 24 Years | 83 (12.8%) | 246 (44.0%) |
| 25 to 34 Years | 207 (25.7%) | 275 (31.6%) |
| 35 to 44 Years | 273 (31.1%) | 221 (25.3%) |
| 45 to 54 Years | 224 (22.4%) | 216 (22.2%) |
| 55 to 64 Years | 161 (15.6%) | 265 (23.9%) |
| 65 to 74 Years | 171 (18.9%) | 178 (18.5%) |
| 75 Years and over | 55 (11.3%) | 178 (21.4%) |
| Total | 1,828 (24.3%) | 2,231 (27.8%) |
Income Above Poverty by Sex and Age in Casey County
According to the poverty statistics in Casey County, males aged 75 years and over and females aged 5 years are the age groups that are most secure financially, with 88.7% of males and 100.0% of females in these age groups living above the poverty line.
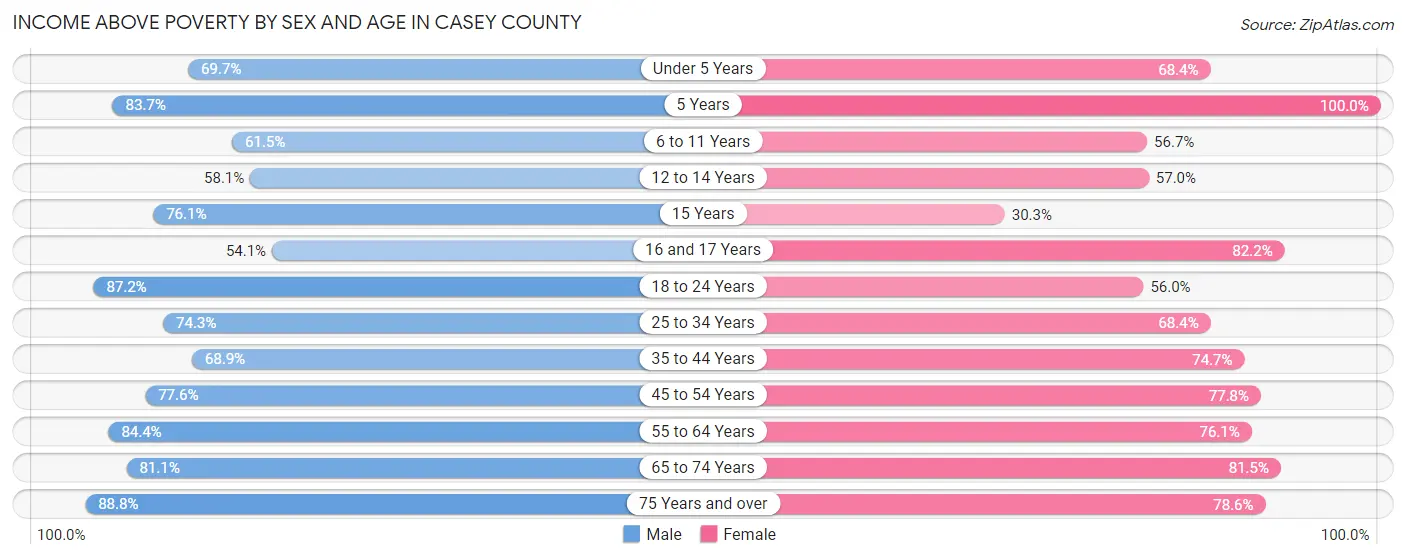
| Age Bracket | Male | Female |
| Under 5 Years | 317 (69.7%) | 403 (68.4%) |
| 5 Years | 41 (83.7%) | 95 (100.0%) |
| 6 to 11 Years | 396 (61.5%) | 318 (56.7%) |
| 12 to 14 Years | 175 (58.1%) | 175 (57.0%) |
| 15 Years | 51 (76.1%) | 23 (30.3%) |
| 16 and 17 Years | 139 (54.1%) | 175 (82.2%) |
| 18 to 24 Years | 566 (87.2%) | 313 (56.0%) |
| 25 to 34 Years | 598 (74.3%) | 596 (68.4%) |
| 35 to 44 Years | 606 (68.9%) | 653 (74.7%) |
| 45 to 54 Years | 776 (77.6%) | 756 (77.8%) |
| 55 to 64 Years | 873 (84.4%) | 842 (76.1%) |
| 65 to 74 Years | 733 (81.1%) | 783 (81.5%) |
| 75 Years and over | 434 (88.7%) | 654 (78.6%) |
| Total | 5,705 (75.7%) | 5,786 (72.2%) |
Income Below Poverty Among Married-Couple Families in Casey County
The poverty statistics for married-couple families in Casey County show that 11.9% or 343 of the total 2,889 families live below the poverty line. Families with 5 or more children have the highest poverty rate of 69.3%, comprising of 70 families. On the other hand, families with 1 or 2 children have the lowest poverty rate of 3.7%, which includes 29 families.
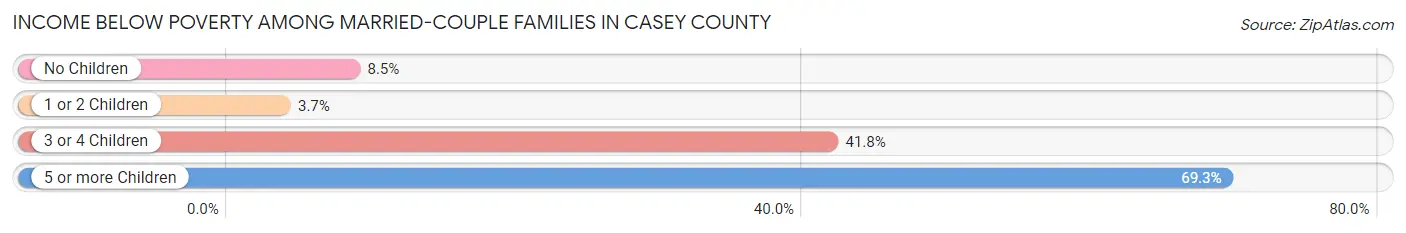
| Children | Above Poverty | Below Poverty |
| No Children | 1,630 (91.5%) | 152 (8.5%) |
| 1 or 2 Children | 757 (96.3%) | 29 (3.7%) |
| 3 or 4 Children | 128 (58.2%) | 92 (41.8%) |
| 5 or more Children | 31 (30.7%) | 70 (69.3%) |
| Total | 2,546 (88.1%) | 343 (11.9%) |
Income Below Poverty Among Single-Parent Households in Casey County
According to the poverty data in Casey County, 24.5% or 61 single-father households and 47.6% or 390 single-mother households are living below the poverty line. Among single-father households, those with 1 or 2 children have the highest poverty rate, with 25 households (27.8%) experiencing poverty. Likewise, among single-mother households, those with 3 or 4 children have the highest poverty rate, with 42 households (84.0%) falling below the poverty line.
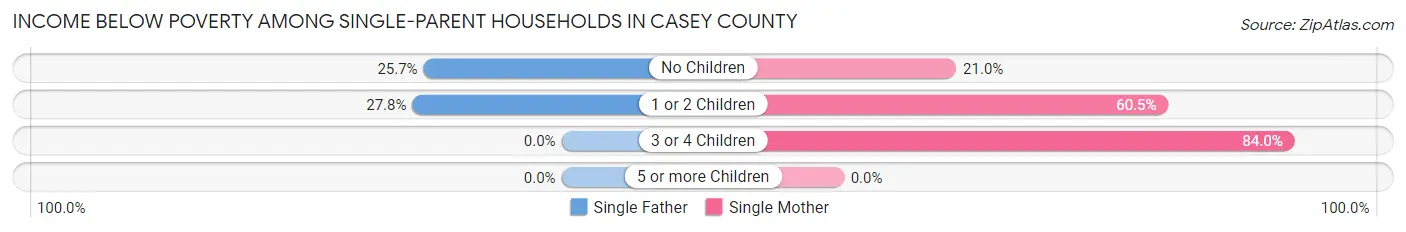
| Children | Single Father | Single Mother |
| No Children | 36 (25.7%) | 62 (20.9%) |
| 1 or 2 Children | 25 (27.8%) | 286 (60.5%) |
| 3 or 4 Children | 0 (0.0%) | 42 (84.0%) |
| 5 or more Children | 0 (0.0%) | 0 (0.0%) |
| Total | 61 (24.5%) | 390 (47.6%) |
Income Below Poverty Among Married-Couple vs Single-Parent Households in Casey County
The poverty data for Casey County shows that 343 of the married-couple family households (11.9%) and 451 of the single-parent households (42.2%) are living below the poverty level. Within the married-couple family households, those with 5 or more children have the highest poverty rate, with 70 households (69.3%) falling below the poverty line. Among the single-parent households, those with 3 or 4 children have the highest poverty rate, with 42 household (84.0%) living below poverty.
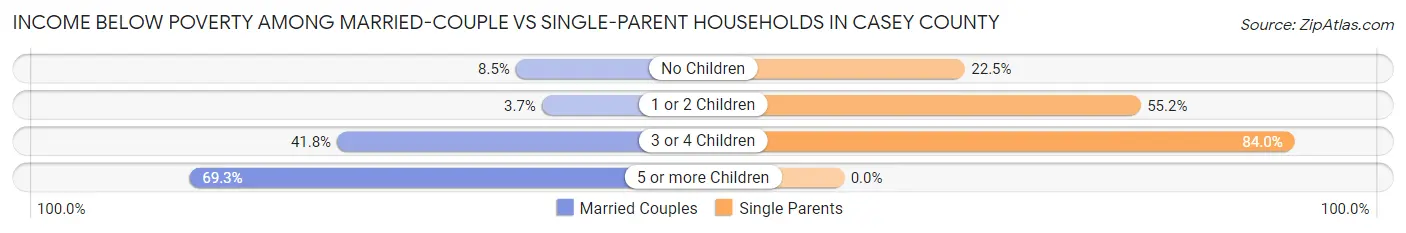
| Children | Married-Couple Families | Single-Parent Households |
| No Children | 152 (8.5%) | 98 (22.5%) |
| 1 or 2 Children | 29 (3.7%) | 311 (55.2%) |
| 3 or 4 Children | 92 (41.8%) | 42 (84.0%) |
| 5 or more Children | 70 (69.3%) | 0 (0.0%) |
| Total | 343 (11.9%) | 451 (42.2%) |
Race in Casey County
The most populous races in Casey County are White / Caucasian (15,228 | 95.5%), Hispanic or Latino (488 | 3.1%), and Two or more Races (328 | 2.1%).
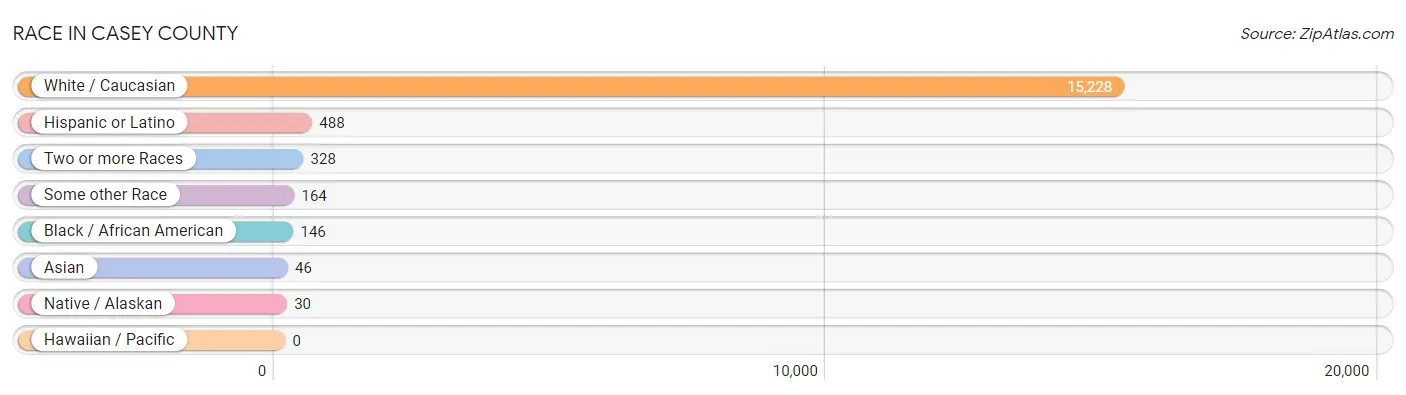
| Race | # Population | % Population |
| Asian | 46 | 0.3% |
| Black / African American | 146 | 0.9% |
| Hawaiian / Pacific | 0 | 0.0% |
| Hispanic or Latino | 488 | 3.1% |
| Native / Alaskan | 30 | 0.2% |
| White / Caucasian | 15,228 | 95.5% |
| Two or more Races | 328 | 2.1% |
| Some other Race | 164 | 1.0% |
| Total | 15,942 | 100.0% |
Ancestry in Casey County
The most populous ancestries reported in Casey County are American (4,387 | 27.5%), English (1,727 | 10.8%), German (1,152 | 7.2%), Irish (817 | 5.1%), and Mexican (422 | 2.6%), together accounting for 53.3% of all Casey County residents.
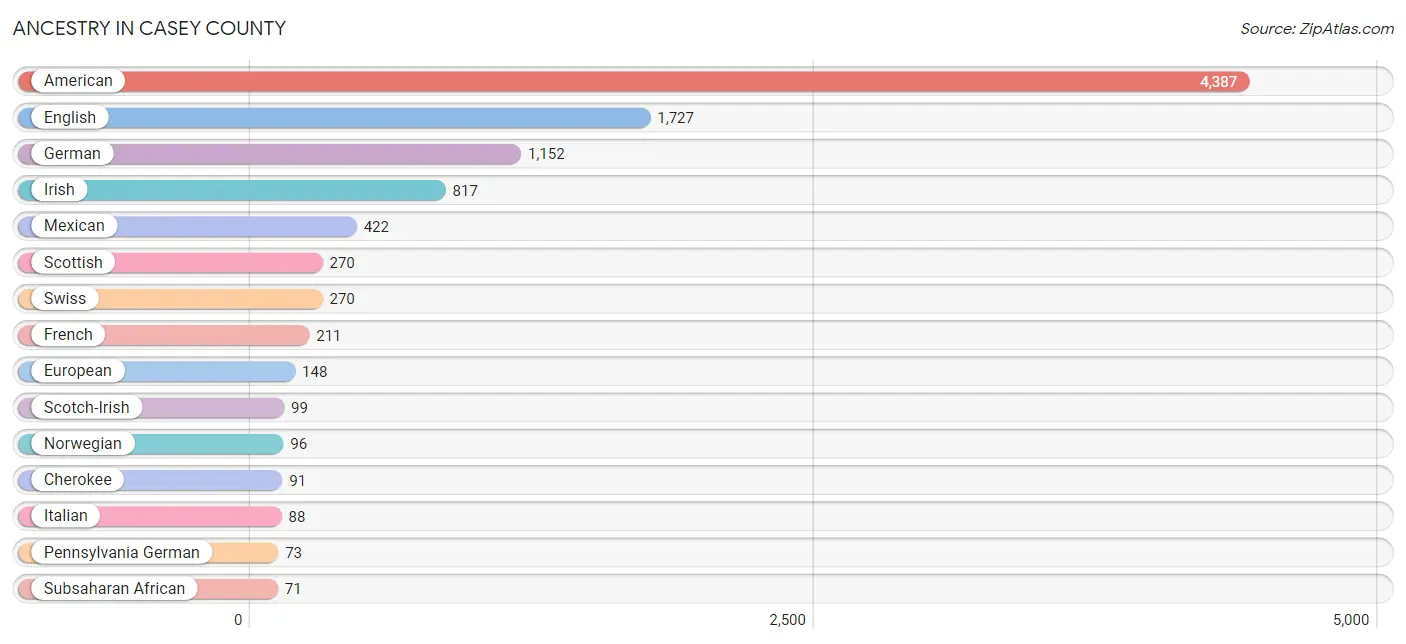
| Ancestry | # Population | % Population |
| African | 58 | 0.4% |
| Alaska Native | 5 | 0.0% |
| American | 4,387 | 27.5% |
| Arab | 1 | 0.0% |
| Bhutanese | 29 | 0.2% |
| Blackfeet | 16 | 0.1% |
| British | 25 | 0.2% |
| Canadian | 3 | 0.0% |
| Central American | 29 | 0.2% |
| Cherokee | 91 | 0.6% |
| Cuban | 1 | 0.0% |
| Danish | 11 | 0.1% |
| Dutch | 41 | 0.3% |
| English | 1,727 | 10.8% |
| European | 148 | 0.9% |
| French | 211 | 1.3% |
| French Canadian | 13 | 0.1% |
| German | 1,152 | 7.2% |
| Guatemalan | 29 | 0.2% |
| Hungarian | 1 | 0.0% |
| Irish | 817 | 5.1% |
| Italian | 88 | 0.5% |
| Korean | 15 | 0.1% |
| Mexican | 422 | 2.6% |
| Northern European | 5 | 0.0% |
| Norwegian | 96 | 0.6% |
| Pakistani | 31 | 0.2% |
| Palestinian | 1 | 0.0% |
| Pennsylvania German | 73 | 0.5% |
| Polish | 55 | 0.4% |
| Portuguese | 8 | 0.1% |
| Puerto Rican | 36 | 0.2% |
| Russian | 17 | 0.1% |
| Scandinavian | 13 | 0.1% |
| Scotch-Irish | 99 | 0.6% |
| Scottish | 270 | 1.7% |
| Slovak | 11 | 0.1% |
| Subsaharan African | 71 | 0.4% |
| Swedish | 68 | 0.4% |
| Swiss | 270 | 1.7% |
| Ugandan | 13 | 0.1% |
| Welsh | 62 | 0.4% | View All 42 Rows |
Immigrants in Casey County
The most numerous immigrant groups reported in Casey County came from Latin America (101 | 0.6%), Central America (100 | 0.6%), Mexico (92 | 0.6%), Africa (23 | 0.1%), and Asia (16 | 0.1%), together accounting for 2.1% of all Casey County residents.
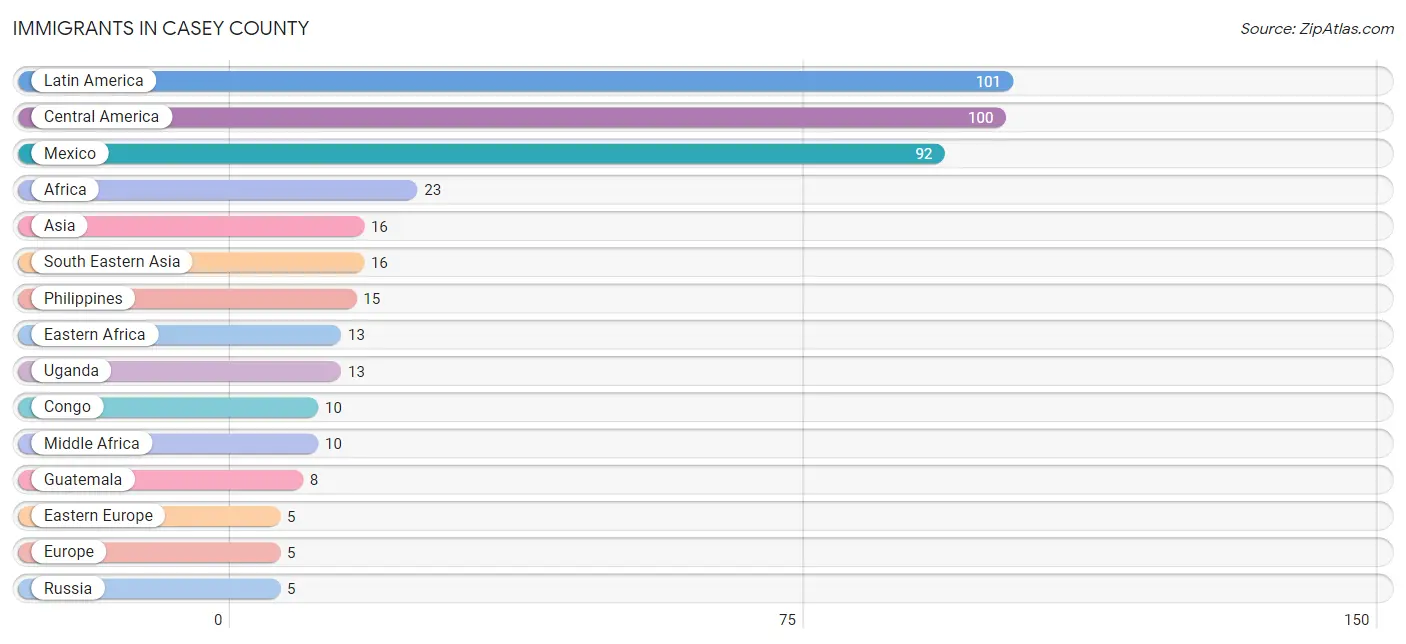
| Immigration Origin | # Population | % Population |
| Africa | 23 | 0.1% |
| Asia | 16 | 0.1% |
| Caribbean | 1 | 0.0% |
| Central America | 100 | 0.6% |
| Congo | 10 | 0.1% |
| Cuba | 1 | 0.0% |
| Eastern Africa | 13 | 0.1% |
| Eastern Europe | 5 | 0.0% |
| Europe | 5 | 0.0% |
| Guatemala | 8 | 0.1% |
| Latin America | 101 | 0.6% |
| Mexico | 92 | 0.6% |
| Middle Africa | 10 | 0.1% |
| Philippines | 15 | 0.1% |
| Russia | 5 | 0.0% |
| South Eastern Asia | 16 | 0.1% |
| Thailand | 1 | 0.0% |
| Uganda | 13 | 0.1% | View All 18 Rows |
Sex and Age in Casey County
Sex and Age in Casey County
The most populous age groups in Casey County are 15 to 19 Years (554 | 7.2%) for men and 60 to 64 Years (689 | 8.4%) for women.
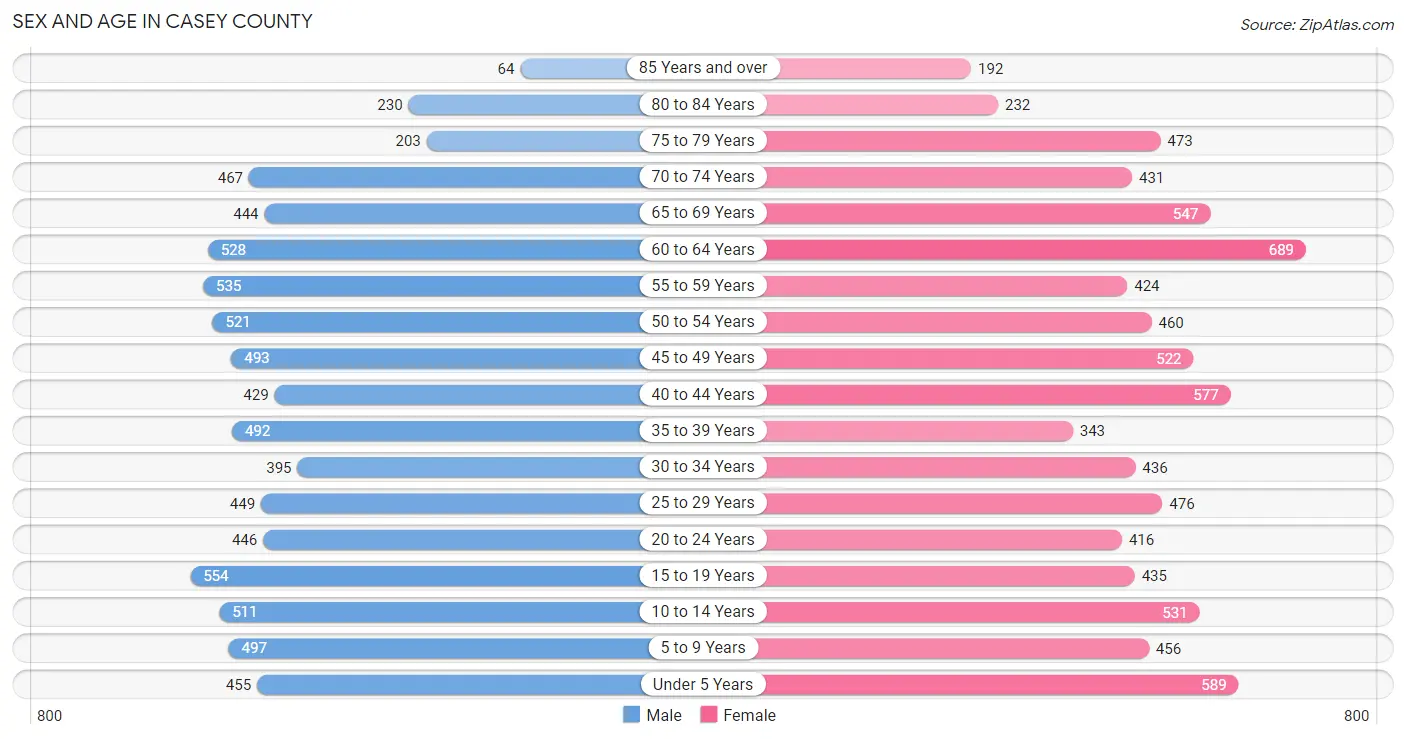
| Age Bracket | Male | Female |
| Under 5 Years | 455 (5.9%) | 589 (7.2%) |
| 5 to 9 Years | 497 (6.4%) | 456 (5.5%) |
| 10 to 14 Years | 511 (6.6%) | 531 (6.5%) |
| 15 to 19 Years | 554 (7.2%) | 435 (5.3%) |
| 20 to 24 Years | 446 (5.8%) | 416 (5.1%) |
| 25 to 29 Years | 449 (5.8%) | 476 (5.8%) |
| 30 to 34 Years | 395 (5.1%) | 436 (5.3%) |
| 35 to 39 Years | 492 (6.4%) | 343 (4.2%) |
| 40 to 44 Years | 429 (5.6%) | 577 (7.0%) |
| 45 to 49 Years | 493 (6.4%) | 522 (6.3%) |
| 50 to 54 Years | 521 (6.8%) | 460 (5.6%) |
| 55 to 59 Years | 535 (6.9%) | 424 (5.1%) |
| 60 to 64 Years | 528 (6.9%) | 689 (8.4%) |
| 65 to 69 Years | 444 (5.8%) | 547 (6.7%) |
| 70 to 74 Years | 467 (6.0%) | 431 (5.2%) |
| 75 to 79 Years | 203 (2.6%) | 473 (5.8%) |
| 80 to 84 Years | 230 (3.0%) | 232 (2.8%) |
| 85 Years and over | 64 (0.8%) | 192 (2.3%) |
| Total | 7,713 (100.0%) | 8,229 (100.0%) |
Families and Households in Casey County
Median Family Size in Casey County
The median family size in Casey County is 3.21 persons per family, with married-couple families (2,889 | 73.0%) accounting for the largest median family size of 3.29 persons per family. On the other hand, single male/father families (249 | 6.3%) represent the smallest median family size with 2.94 persons per family.
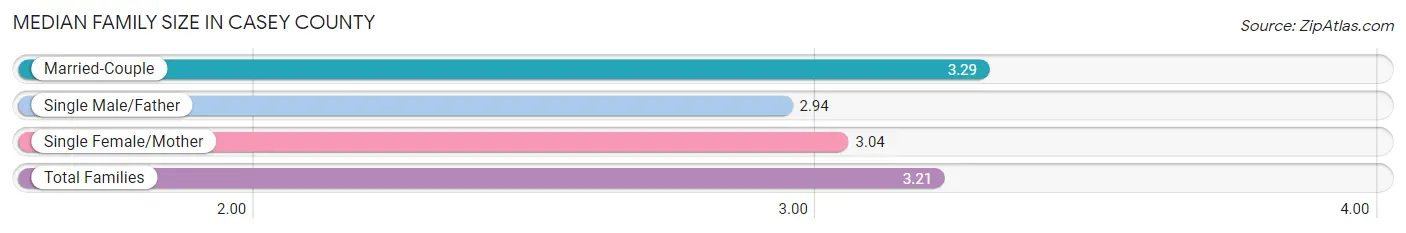
| Family Type | # Families | Family Size |
| Married-Couple | 2,889 (73.0%) | 3.29 |
| Single Male/Father | 249 (6.3%) | 2.94 |
| Single Female/Mother | 819 (20.7%) | 3.04 |
| Total Families | 3,957 (100.0%) | 3.21 |
Median Household Size in Casey County
The median household size in Casey County is 2.57 persons per household, with married-couple households (2,889 | 47.9%) accounting for the largest median household size of 3.34 persons per household. non-family households (2,072 | 34.4%) represent the smallest median household size with 1.17 persons per household.
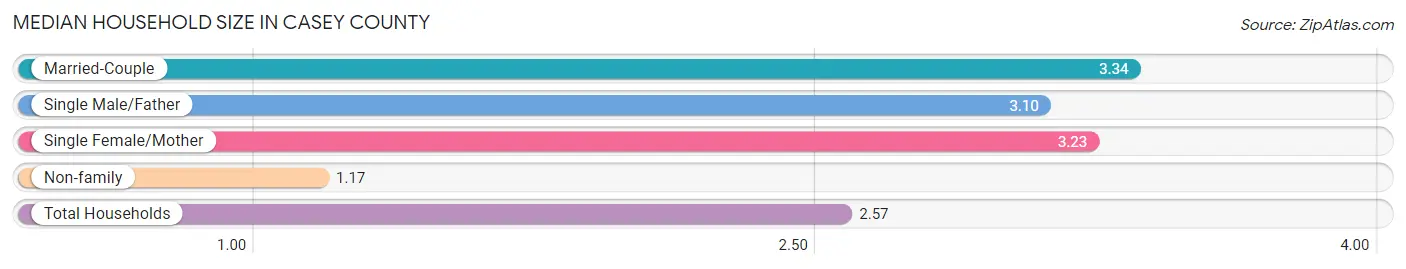
| Household Type | # Households | Household Size |
| Married-Couple | 2,889 (47.9%) | 3.34 |
| Single Male/Father | 249 (4.1%) | 3.10 |
| Single Female/Mother | 819 (13.6%) | 3.23 |
| Non-family | 2,072 (34.4%) | 1.17 |
| Total Households | 6,029 (100.0%) | 2.57 |
Household Size by Marriage Status in Casey County
Out of a total of 6,029 households in Casey County, 3,957 (65.6%) are family households, while 2,072 (34.4%) are nonfamily households. The most numerous type of family households are 2-person households, comprising 1,870, and the most common type of nonfamily households are 1-person households, comprising 1,751.
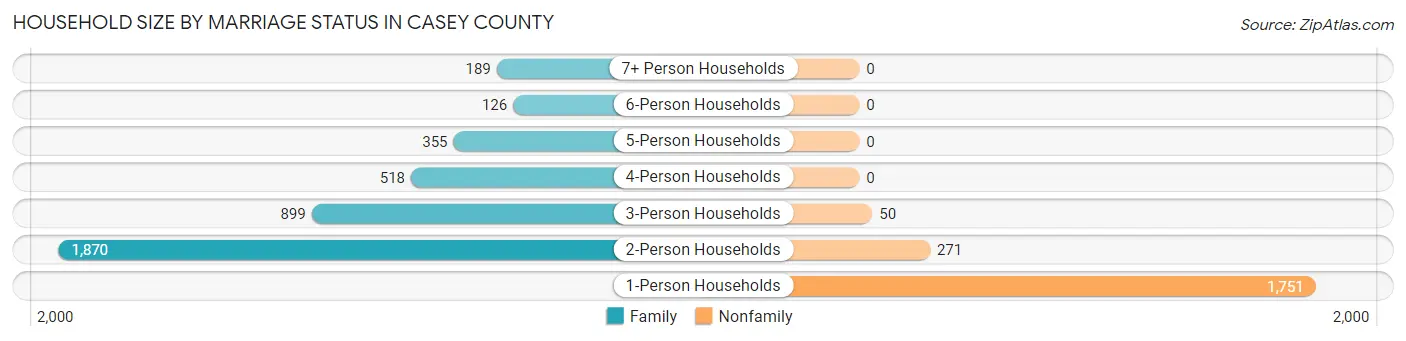
| Household Size | Family Households | Nonfamily Households |
| 1-Person Households | - | 1,751 (29.0%) |
| 2-Person Households | 1,870 (31.0%) | 271 (4.5%) |
| 3-Person Households | 899 (14.9%) | 50 (0.8%) |
| 4-Person Households | 518 (8.6%) | 0 (0.0%) |
| 5-Person Households | 355 (5.9%) | 0 (0.0%) |
| 6-Person Households | 126 (2.1%) | 0 (0.0%) |
| 7+ Person Households | 189 (3.1%) | 0 (0.0%) |
| Total | 3,957 (65.6%) | 2,072 (34.4%) |
Female Fertility in Casey County
Fertility by Age in Casey County
Average fertility rate in Casey County is 88.0 births per 1,000 women. Women in the age bracket of 20 to 34 years have the highest fertility rate with 156.0 births per 1,000 women. Women in the age bracket of 20 to 34 years acount for 73.1% of all women with births.
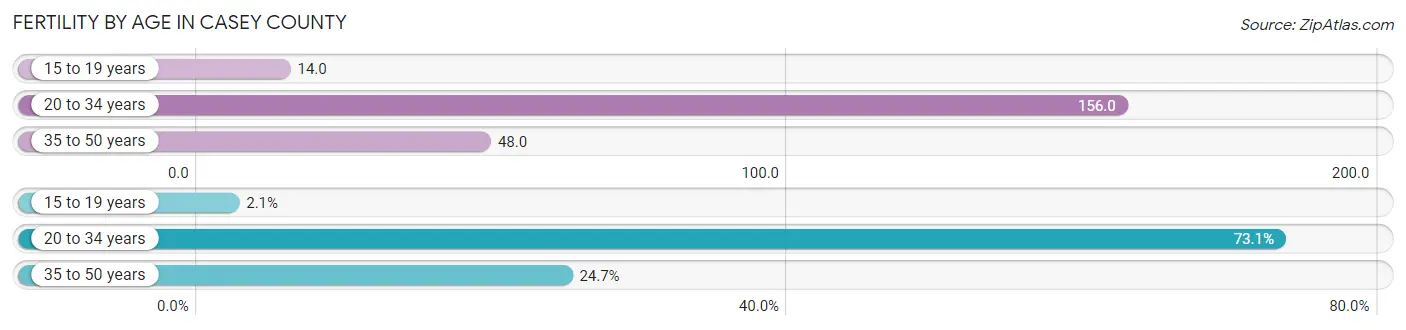
| Age Bracket | Women with Births | Births / 1,000 Women |
| 15 to 19 years | 6 (2.1%) | 14.0 |
| 20 to 34 years | 207 (73.1%) | 156.0 |
| 35 to 50 years | 70 (24.7%) | 48.0 |
| Total | 283 (100.0%) | 88.0 |
Fertility by Age by Marriage Status in Casey County
72.1% of women with births (283) in Casey County are married. The highest percentage of unmarried women with births falls into 15 to 19 years age bracket with 100.0% of them unmarried at the time of birth, while the lowest percentage of unmarried women with births belong to 35 to 50 years age bracket with 0.0% of them unmarried.
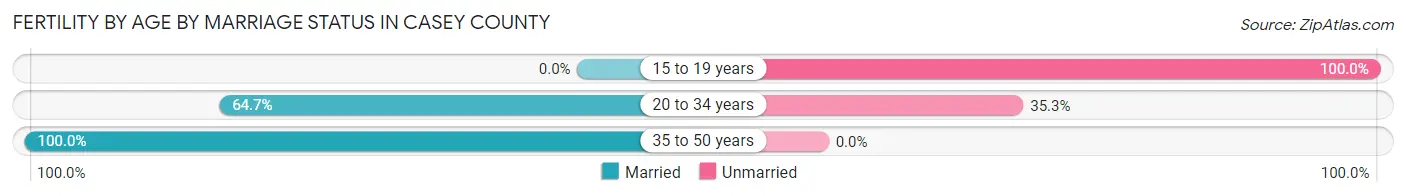
| Age Bracket | Married | Unmarried |
| 15 to 19 years | 0 (0.0%) | 6 (100.0%) |
| 20 to 34 years | 134 (64.7%) | 73 (35.3%) |
| 35 to 50 years | 70 (100.0%) | 0 (0.0%) |
| Total | 204 (72.1%) | 79 (27.9%) |
Fertility by Education in Casey County
Average fertility rate in Casey County is 88.0 births per 1,000 women. Women with the education attainment of bachelor's degree have the highest fertility rate of 262.0 births per 1,000 women, while women with the education attainment of graduate degree have the lowest fertility at 34.0 births per 1,000 women. Women with the education attainment of less than high school represent 34.3% of all women with births.
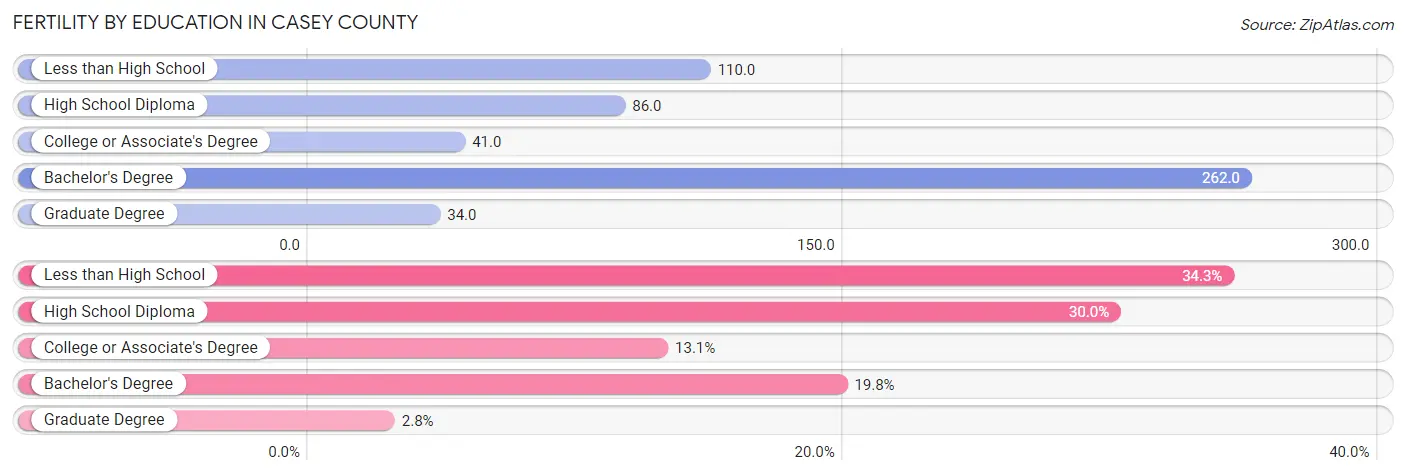
| Educational Attainment | Women with Births | Births / 1,000 Women |
| Less than High School | 97 (34.3%) | 110.0 |
| High School Diploma | 85 (30.0%) | 86.0 |
| College or Associate's Degree | 37 (13.1%) | 41.0 |
| Bachelor's Degree | 56 (19.8%) | 262.0 |
| Graduate Degree | 8 (2.8%) | 34.0 |
| Total | 283 (100.0%) | 88.0 |
Fertility by Education by Marriage Status in Casey County
27.9% of women with births in Casey County are unmarried. Women with the educational attainment of college or associate's degree are most likely to be married with 100.0% of them married at childbirth, while women with the educational attainment of less than high school are least likely to be married with 69.1% of them unmarried at childbirth.
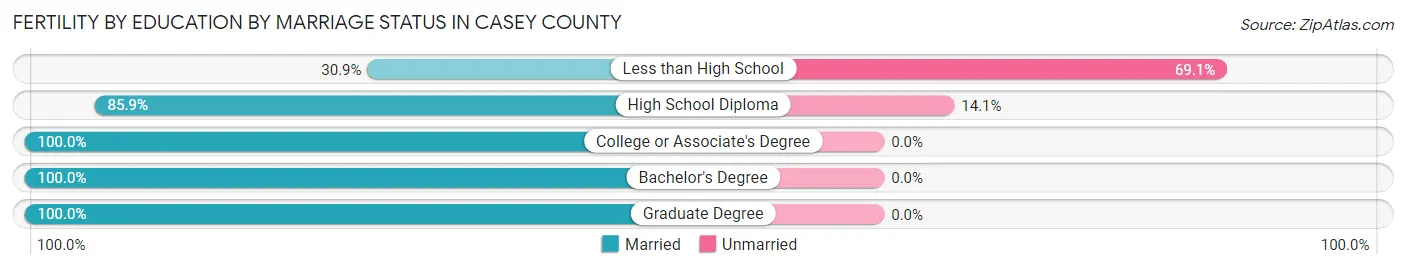
| Educational Attainment | Married | Unmarried |
| Less than High School | 30 (30.9%) | 67 (69.1%) |
| High School Diploma | 73 (85.9%) | 12 (14.1%) |
| College or Associate's Degree | 37 (100.0%) | 0 (0.0%) |
| Bachelor's Degree | 56 (100.0%) | 0 (0.0%) |
| Graduate Degree | 8 (100.0%) | 0 (0.0%) |
| Total | 204 (72.1%) | 79 (27.9%) |
Employment Characteristics in Casey County
Employment by Class of Employer in Casey County
Among the 5,331 employed individuals in Casey County, private company employees (3,572 | 67.0%), self-employed (not incorporated) (526 | 9.9%), and local government employees (330 | 6.2%) make up the most common classes of employment.
| Employer Class | # Employees | % Employees |
| Private Company Employees | 3,572 | 67.0% |
| Self-Employed (Incorporated) | 77 | 1.4% |
| Self-Employed (Not Incorporated) | 526 | 9.9% |
| Not-for-profit Organizations | 286 | 5.4% |
| Local Government Employees | 330 | 6.2% |
| State Government Employees | 324 | 6.1% |
| Federal Government Employees | 105 | 2.0% |
| Unpaid Family Workers | 111 | 2.1% |
| Total | 5,331 | 100.0% |
Employment Status by Age in Casey County
According to the labor force statistics for Casey County, out of the total population over 16 years of age (12,760), 48.1% or 6,138 individuals are in the labor force, with 10.4% or 638 of them unemployed. The age group with the highest labor force participation rate is 20 to 24 years, with 76.9% or 663 individuals in the labor force. Within the labor force, the 16 to 19 years age range has the highest percentage of unemployed individuals, with 24.1% or 97 of them being unemployed.
| Age Bracket | In Labor Force | Unemployed |
| 16 to 19 Years | 401 (47.4%) | 97 (24.1%) |
| 20 to 24 Years | 663 (76.9%) | 112 (16.9%) |
| 25 to 29 Years | 652 (70.5%) | 125 (19.2%) |
| 30 to 34 Years | 471 (56.7%) | 11 (2.3%) |
| 35 to 44 Years | 1,151 (62.5%) | 157 (13.6%) |
| 45 to 54 Years | 1,289 (64.6%) | 85 (6.6%) |
| 55 to 59 Years | 557 (58.1%) | 19 (3.4%) |
| 60 to 64 Years | 525 (43.1%) | 26 (5.0%) |
| 65 to 74 Years | 349 (18.5%) | 7 (2.0%) |
| 75 Years and over | 72 (5.2%) | 0 (0.0%) |
| Total | 6,138 (48.1%) | 638 (10.4%) |
Employment Status by Educational Attainment in Casey County
According to labor force statistics for Casey County, 59.8% of individuals (4,646) out of the total population between 25 and 64 years of age (7,769) are in the labor force, with 9.1% or 423 of them being unemployed. The group with the highest labor force participation rate are those with the educational attainment of bachelor's degree or higher, with 89.8% or 833 individuals in the labor force. Within the labor force, individuals with less than high school education have the highest percentage of unemployment, with 22.8% or 147 of them being unemployed.
| Educational Attainment | In Labor Force | Unemployed |
| Less than High School | 646 (39.8%) | 370 (22.8%) |
| High School Diploma | 1,959 (57.8%) | 295 (8.7%) |
| College / Associate Degree | 1,208 (66.1%) | 117 (6.4%) |
| Bachelor's Degree or higher | 833 (89.8%) | 30 (3.2%) |
| Total | 4,646 (59.8%) | 707 (9.1%) |
Employment Occupations by Sex in Casey County
Management, Business, Science and Arts Occupations
The most common Management, Business, Science and Arts occupations in Casey County are Management (562 | 10.2%), Community & Social Service (513 | 9.3%), Health Diagnosing & Treating (402 | 7.3%), Education Instruction & Library (386 | 7.0%), and Health Technologists (316 | 5.8%).
Management, Business, Science and Arts Occupations by Sex
Within the Management, Business, Science and Arts occupations in Casey County, the most male-oriented occupations are Computers & Mathematics (79.2%), Computers, Engineering & Science (78.2%), and Management (77.9%), while the most female-oriented occupations are Health Diagnosing & Treating (85.8%), Health Technologists (82.0%), and Education Instruction & Library (74.6%).
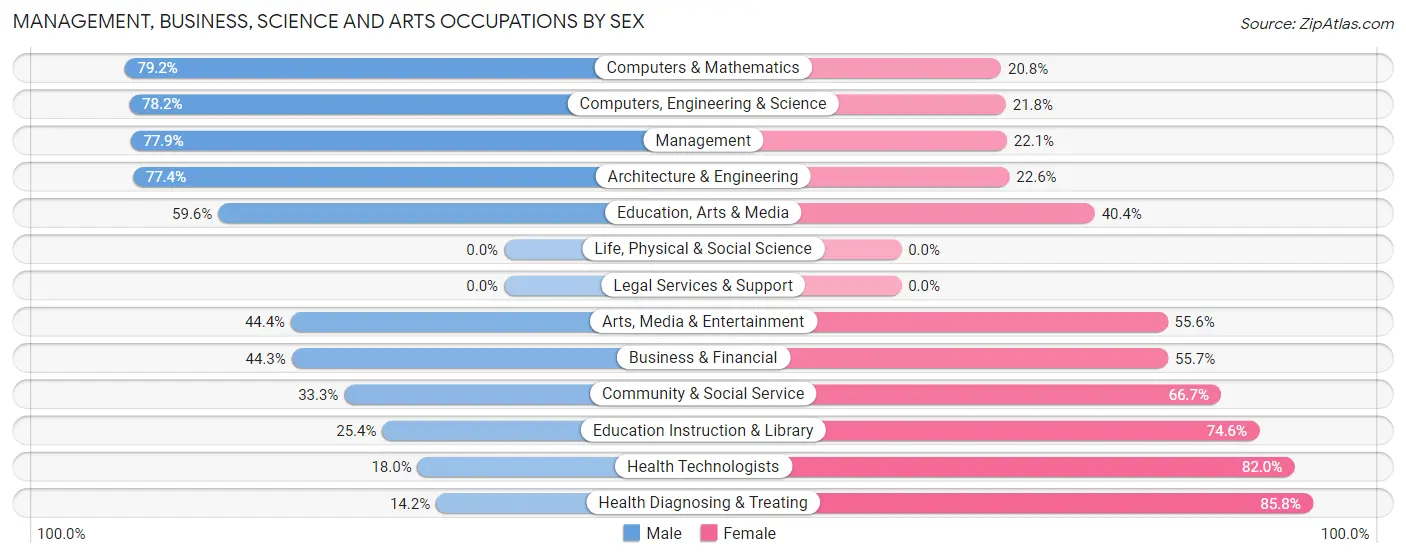
| Occupation | Male | Female |
| Management | 438 (77.9%) | 124 (22.1%) |
| Business & Financial | 39 (44.3%) | 49 (55.7%) |
| Computers, Engineering & Science | 43 (78.2%) | 12 (21.8%) |
| Computers & Mathematics | 19 (79.2%) | 5 (20.8%) |
| Architecture & Engineering | 24 (77.4%) | 7 (22.6%) |
| Life, Physical & Social Science | 0 (0.0%) | 0 (0.0%) |
| Community & Social Service | 171 (33.3%) | 342 (66.7%) |
| Education, Arts & Media | 65 (59.6%) | 44 (40.4%) |
| Legal Services & Support | 0 (0.0%) | 0 (0.0%) |
| Education Instruction & Library | 98 (25.4%) | 288 (74.6%) |
| Arts, Media & Entertainment | 8 (44.4%) | 10 (55.6%) |
| Health Diagnosing & Treating | 57 (14.2%) | 345 (85.8%) |
| Health Technologists | 57 (18.0%) | 259 (82.0%) |
| Total (Category) | 748 (46.2%) | 872 (53.8%) |
| Total (Overall) | 3,042 (55.4%) | 2,448 (44.6%) |
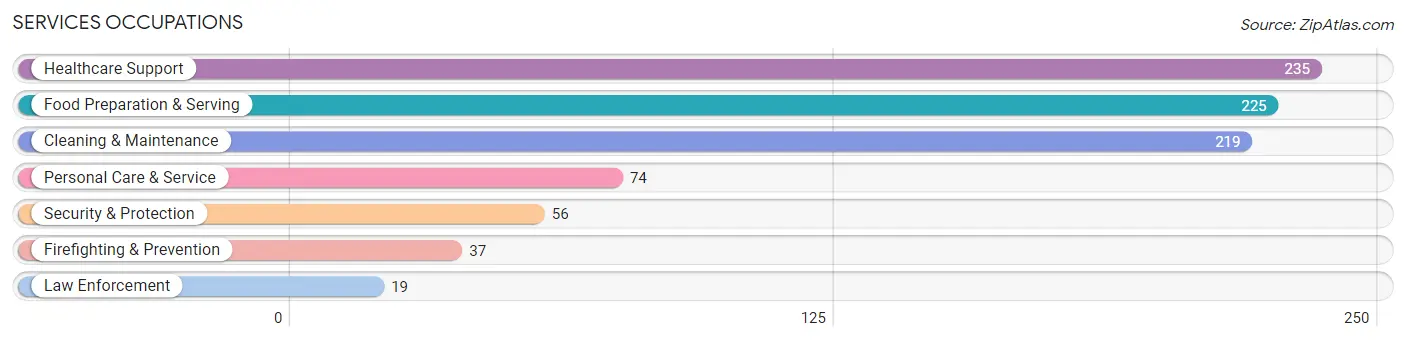
Services Occupations
The most common Services occupations in Casey County are Healthcare Support (235 | 4.3%), Food Preparation & Serving (225 | 4.1%), Cleaning & Maintenance (219 | 4.0%), Personal Care & Service (74 | 1.3%), and Security & Protection (56 | 1.0%).
Services Occupations by Sex
Within the Services occupations in Casey County, the most male-oriented occupations are Security & Protection (100.0%), Firefighting & Prevention (100.0%), and Law Enforcement (100.0%), while the most female-oriented occupations are Personal Care & Service (100.0%), Food Preparation & Serving (93.8%), and Healthcare Support (91.1%).
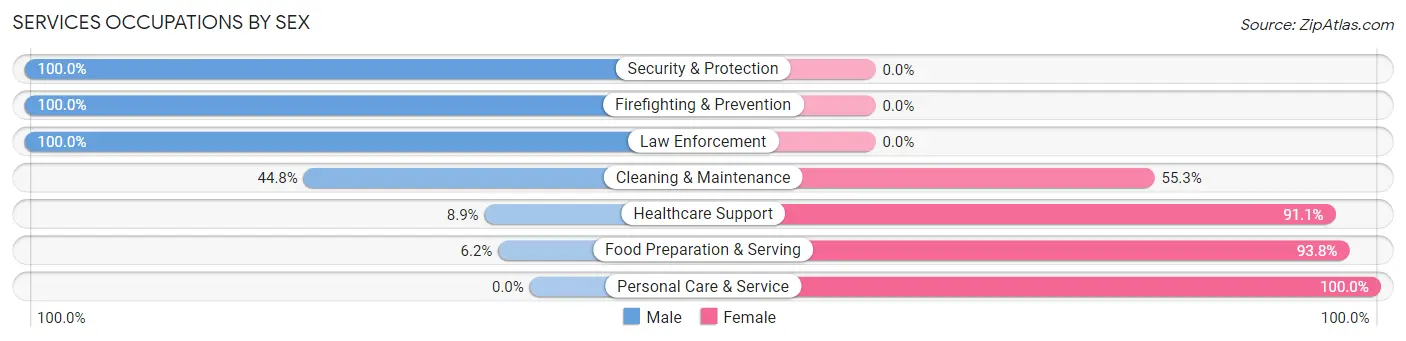
| Occupation | Male | Female |
| Healthcare Support | 21 (8.9%) | 214 (91.1%) |
| Security & Protection | 56 (100.0%) | 0 (0.0%) |
| Firefighting & Prevention | 37 (100.0%) | 0 (0.0%) |
| Law Enforcement | 19 (100.0%) | 0 (0.0%) |
| Food Preparation & Serving | 14 (6.2%) | 211 (93.8%) |
| Cleaning & Maintenance | 98 (44.8%) | 121 (55.2%) |
| Personal Care & Service | 0 (0.0%) | 74 (100.0%) |
| Total (Category) | 189 (23.4%) | 620 (76.6%) |
| Total (Overall) | 3,042 (55.4%) | 2,448 (44.6%) |
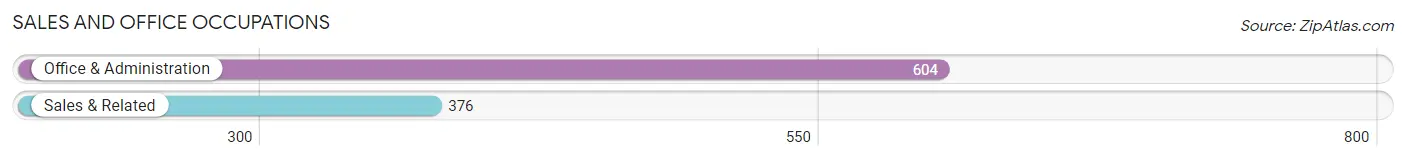
Sales and Office Occupations
The most common Sales and Office occupations in Casey County are Office & Administration (604 | 11.0%), and Sales & Related (376 | 6.9%).
Sales and Office Occupations by Sex
| Occupation | Male | Female |
| Sales & Related | 175 (46.5%) | 201 (53.5%) |
| Office & Administration | 123 (20.4%) | 481 (79.6%) |
| Total (Category) | 298 (30.4%) | 682 (69.6%) |
| Total (Overall) | 3,042 (55.4%) | 2,448 (44.6%) |
Natural Resources, Construction and Maintenance Occupations
The most common Natural Resources, Construction and Maintenance occupations in Casey County are Construction & Extraction (428 | 7.8%), Installation, Maintenance & Repair (226 | 4.1%), and Farming, Fishing & Forestry (99 | 1.8%).
Natural Resources, Construction and Maintenance Occupations by Sex
| Occupation | Male | Female |
| Farming, Fishing & Forestry | 84 (84.9%) | 15 (15.1%) |
| Construction & Extraction | 418 (97.7%) | 10 (2.3%) |
| Installation, Maintenance & Repair | 226 (100.0%) | 0 (0.0%) |
| Total (Category) | 728 (96.7%) | 25 (3.3%) |
| Total (Overall) | 3,042 (55.4%) | 2,448 (44.6%) |
Production, Transportation and Moving Occupations
The most common Production, Transportation and Moving occupations in Casey County are Production (708 | 12.9%), Material Moving (366 | 6.7%), and Transportation (254 | 4.6%).
Production, Transportation and Moving Occupations by Sex
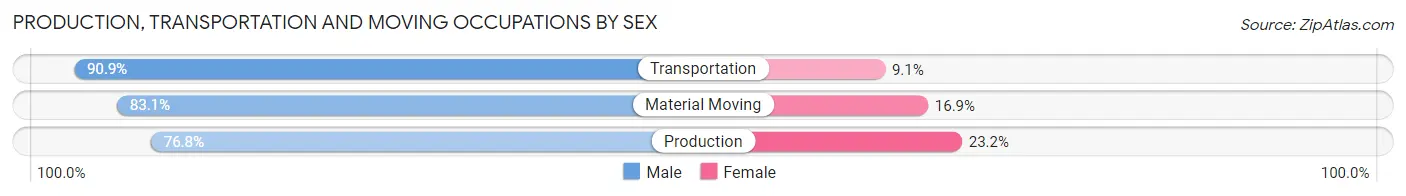
| Occupation | Male | Female |
| Production | 544 (76.8%) | 164 (23.2%) |
| Transportation | 231 (90.9%) | 23 (9.1%) |
| Material Moving | 304 (83.1%) | 62 (16.9%) |
| Total (Category) | 1,079 (81.2%) | 249 (18.8%) |
| Total (Overall) | 3,042 (55.4%) | 2,448 (44.6%) |
Employment Industries by Sex in Casey County
Employment Industries in Casey County
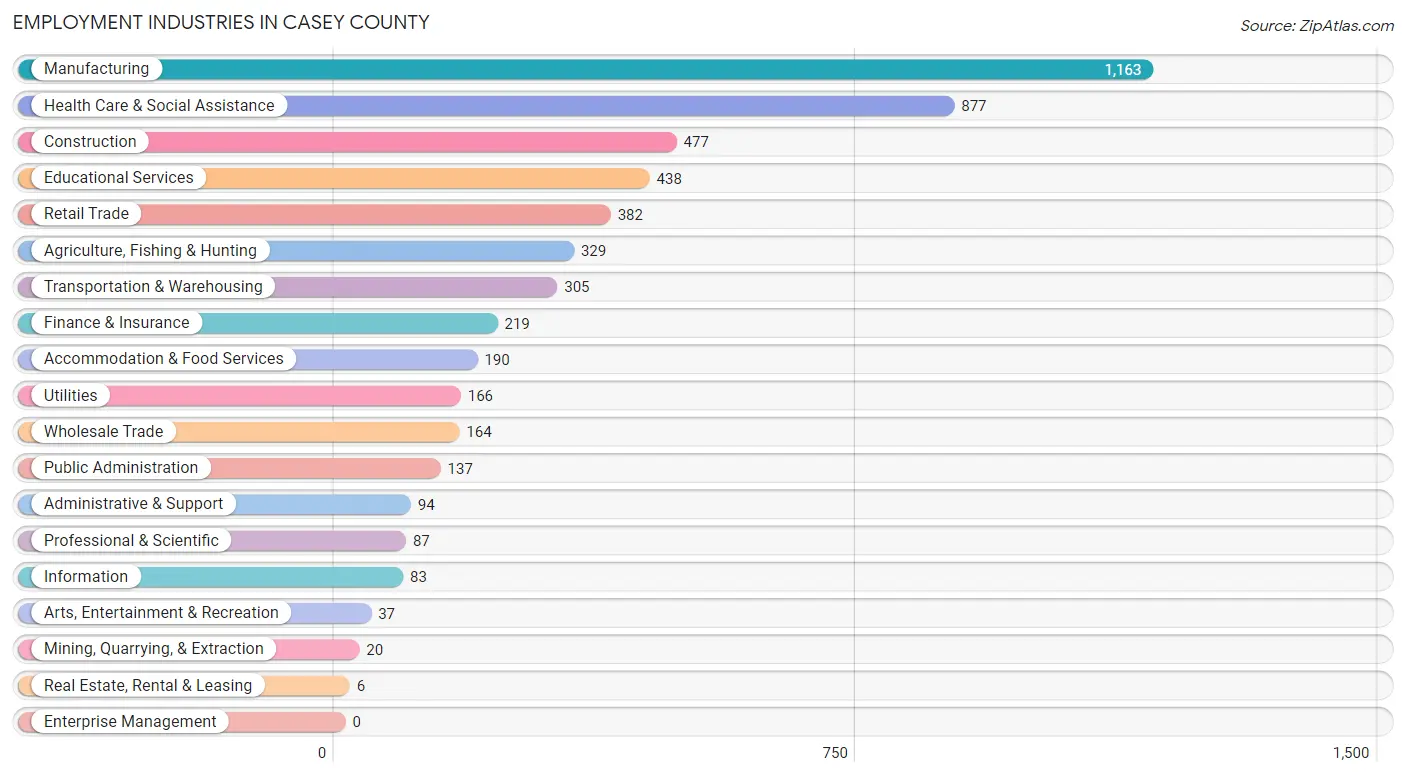
The major employment industries in Casey County include Manufacturing (1,163 | 21.2%), Health Care & Social Assistance (877 | 16.0%), Construction (477 | 8.7%), Educational Services (438 | 8.0%), and Retail Trade (382 | 7.0%).
Employment Industries by Sex in Casey County
The Casey County industries that see more men than women are Mining, Quarrying, & Extraction (100.0%), Real Estate, Rental & Leasing (100.0%), and Agriculture, Fishing & Hunting (97.0%), whereas the industries that tend to have a higher number of women are Health Care & Social Assistance (84.8%), Accommodation & Food Services (77.9%), and Educational Services (74.2%).
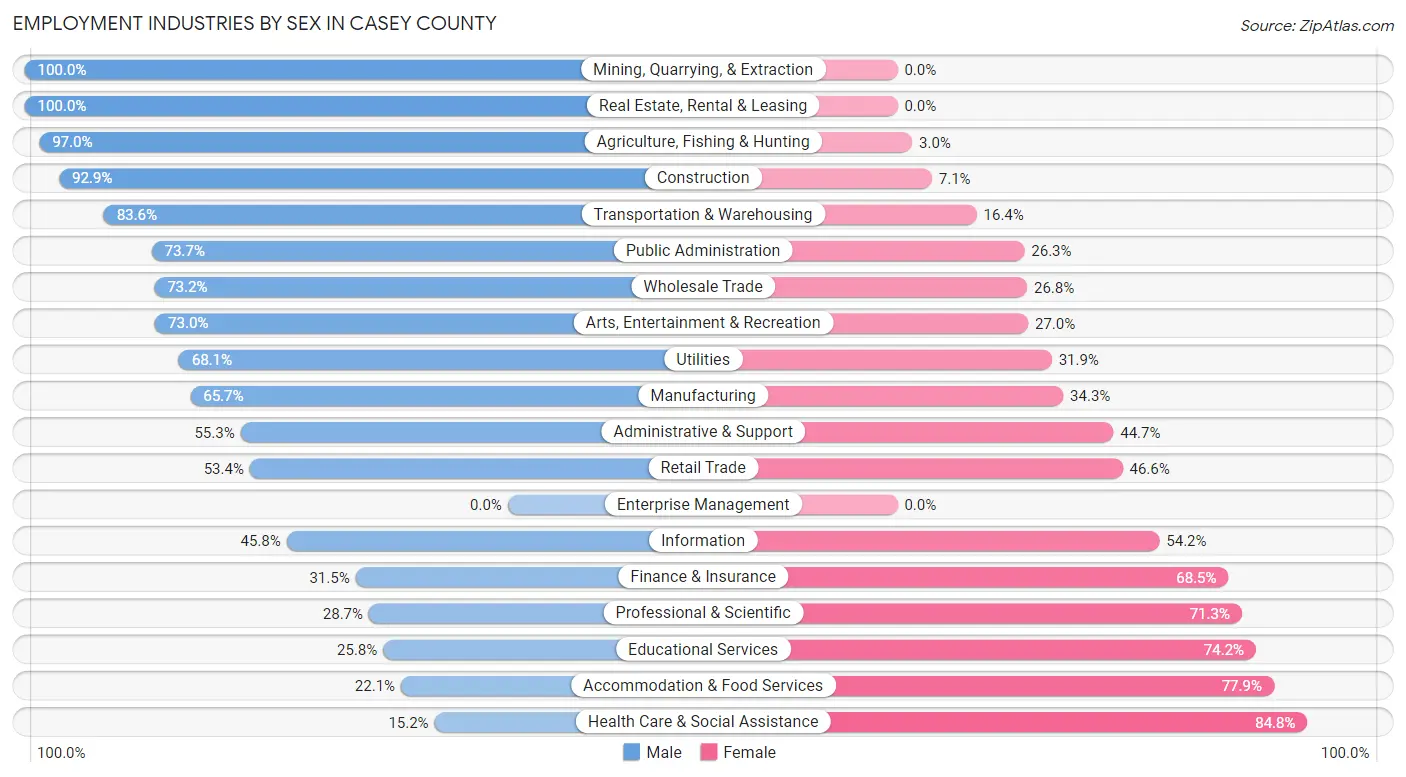
| Industry | Male | Female |
| Agriculture, Fishing & Hunting | 319 (97.0%) | 10 (3.0%) |
| Mining, Quarrying, & Extraction | 20 (100.0%) | 0 (0.0%) |
| Construction | 443 (92.9%) | 34 (7.1%) |
| Manufacturing | 764 (65.7%) | 399 (34.3%) |
| Wholesale Trade | 120 (73.2%) | 44 (26.8%) |
| Retail Trade | 204 (53.4%) | 178 (46.6%) |
| Transportation & Warehousing | 255 (83.6%) | 50 (16.4%) |
| Utilities | 113 (68.1%) | 53 (31.9%) |
| Information | 38 (45.8%) | 45 (54.2%) |
| Finance & Insurance | 69 (31.5%) | 150 (68.5%) |
| Real Estate, Rental & Leasing | 6 (100.0%) | 0 (0.0%) |
| Professional & Scientific | 25 (28.7%) | 62 (71.3%) |
| Enterprise Management | 0 (0.0%) | 0 (0.0%) |
| Administrative & Support | 52 (55.3%) | 42 (44.7%) |
| Educational Services | 113 (25.8%) | 325 (74.2%) |
| Health Care & Social Assistance | 133 (15.2%) | 744 (84.8%) |
| Arts, Entertainment & Recreation | 27 (73.0%) | 10 (27.0%) |
| Accommodation & Food Services | 42 (22.1%) | 148 (77.9%) |
| Public Administration | 101 (73.7%) | 36 (26.3%) |
| Total | 3,042 (55.4%) | 2,448 (44.6%) |
Education in Casey County
School Enrollment in Casey County
The most common levels of schooling among the 2,979 students in Casey County are elementary school (850 | 28.5%), high school (672 | 22.6%), and middle school (662 | 22.2%).
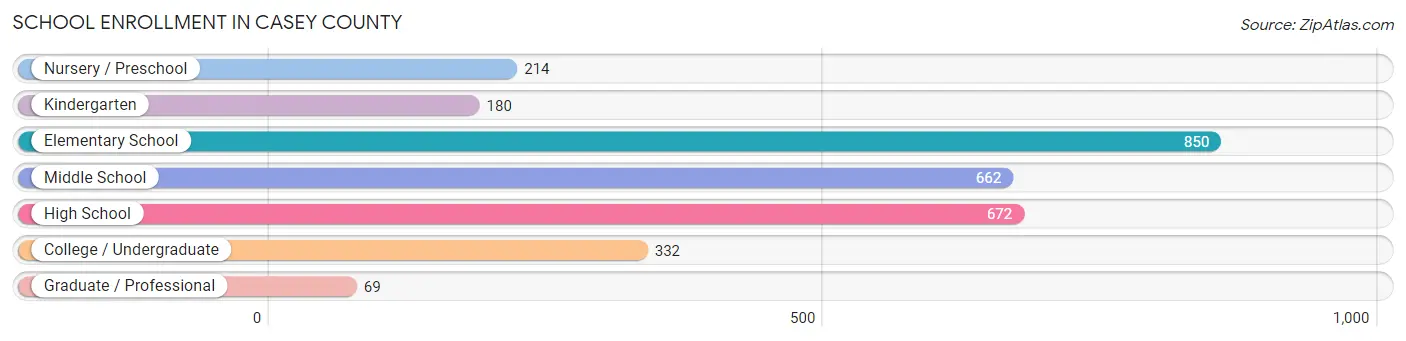
| School Level | # Students | % Students |
| Nursery / Preschool | 214 | 7.2% |
| Kindergarten | 180 | 6.0% |
| Elementary School | 850 | 28.5% |
| Middle School | 662 | 22.2% |
| High School | 672 | 22.6% |
| College / Undergraduate | 332 | 11.1% |
| Graduate / Professional | 69 | 2.3% |
| Total | 2,979 | 100.0% |
School Enrollment by Age by Funding Source in Casey County
Out of a total of 2,979 students who are enrolled in schools in Casey County, 772 (25.9%) attend a private institution, while the remaining 2,207 (74.1%) are enrolled in public schools. The age group of 10 to 14 year olds has the highest likelihood of being enrolled in private schools, with 369 (38.0% in the age bracket) enrolled. Conversely, the age group of 25 to 34 year olds has the lowest likelihood of being enrolled in a private school, with 68 (91.9% in the age bracket) attending a public institution.
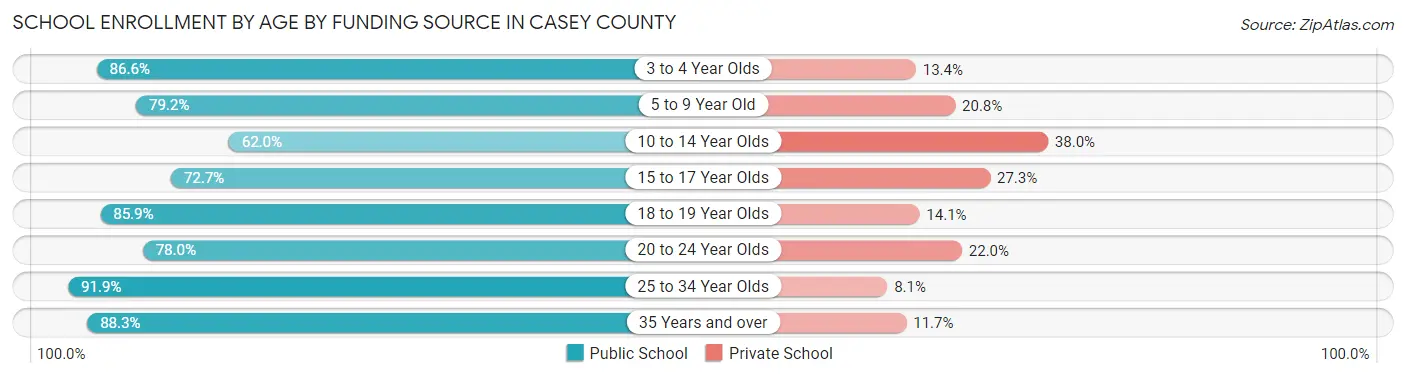
| Age Bracket | Public School | Private School |
| 3 to 4 Year Olds | 174 (86.6%) | 27 (13.4%) |
| 5 to 9 Year Old | 649 (79.2%) | 170 (20.8%) |
| 10 to 14 Year Olds | 601 (62.0%) | 369 (38.0%) |
| 15 to 17 Year Olds | 344 (72.7%) | 129 (27.3%) |
| 18 to 19 Year Olds | 140 (85.9%) | 23 (14.1%) |
| 20 to 24 Year Olds | 124 (78.0%) | 35 (22.0%) |
| 25 to 34 Year Olds | 68 (91.9%) | 6 (8.1%) |
| 35 Years and over | 106 (88.3%) | 14 (11.7%) |
| Total | 2,207 (74.1%) | 772 (25.9%) |
Educational Attainment by Field of Study in Casey County
Education (421 | 29.7%), business (304 | 21.4%), science & technology (273 | 19.3%), bio, nature & agricultural (102 | 7.2%), and arts & humanities (78 | 5.5%) are the most common fields of study among 1,417 individuals in Casey County who have obtained a bachelor's degree or higher.
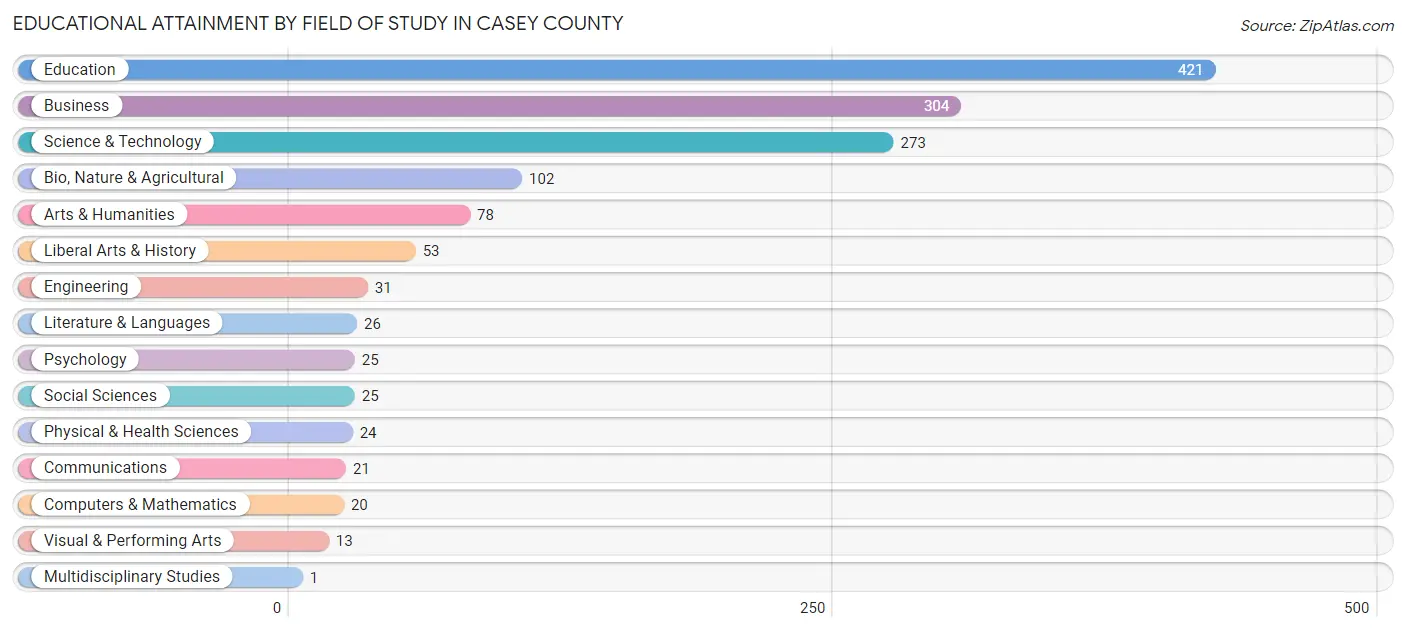
| Field of Study | # Graduates | % Graduates |
| Computers & Mathematics | 20 | 1.4% |
| Bio, Nature & Agricultural | 102 | 7.2% |
| Physical & Health Sciences | 24 | 1.7% |
| Psychology | 25 | 1.8% |
| Social Sciences | 25 | 1.8% |
| Engineering | 31 | 2.2% |
| Multidisciplinary Studies | 1 | 0.1% |
| Science & Technology | 273 | 19.3% |
| Business | 304 | 21.4% |
| Education | 421 | 29.7% |
| Literature & Languages | 26 | 1.8% |
| Liberal Arts & History | 53 | 3.7% |
| Visual & Performing Arts | 13 | 0.9% |
| Communications | 21 | 1.5% |
| Arts & Humanities | 78 | 5.5% |
| Total | 1,417 | 100.0% |
Transportation & Commute in Casey County
Vehicle Availability by Sex in Casey County
The most prevalent vehicle ownership categories in Casey County are males with 2 vehicles (1,042, accounting for 35.7%) and females with 2 vehicles (835, making up 43.4%).
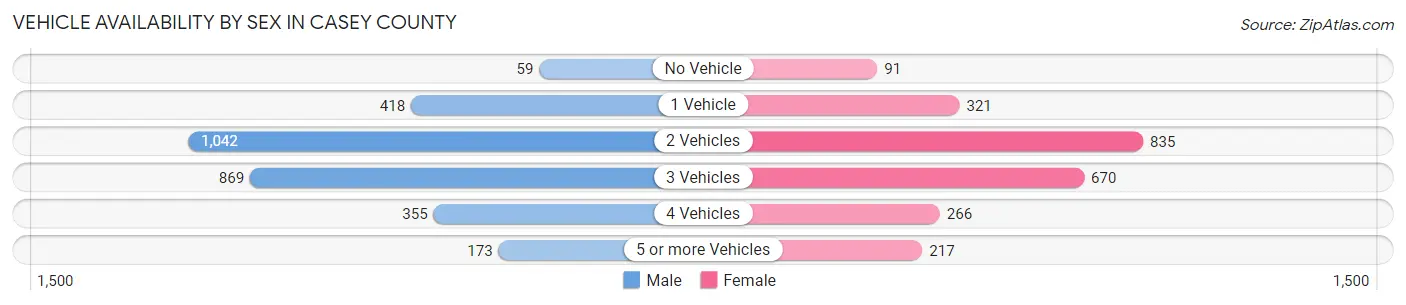
| Vehicles Available | Male | Female |
| No Vehicle | 59 (2.0%) | 91 (3.8%) |
| 1 Vehicle | 418 (14.3%) | 321 (13.4%) |
| 2 Vehicles | 1,042 (35.7%) | 835 (34.8%) |
| 3 Vehicles | 869 (29.8%) | 670 (27.9%) |
| 4 Vehicles | 355 (12.2%) | 266 (11.1%) |
| 5 or more Vehicles | 173 (5.9%) | 217 (9.0%) |
| Total | 2,916 (100.0%) | 2,400 (100.0%) |
Commute Time in Casey County
The most frequently occuring commute durations in Casey County are 20 to 24 minutes (769 commuters, 15.4%), 15 to 19 minutes (703 commuters, 14.1%), and 5 to 9 minutes (505 commuters, 10.1%).
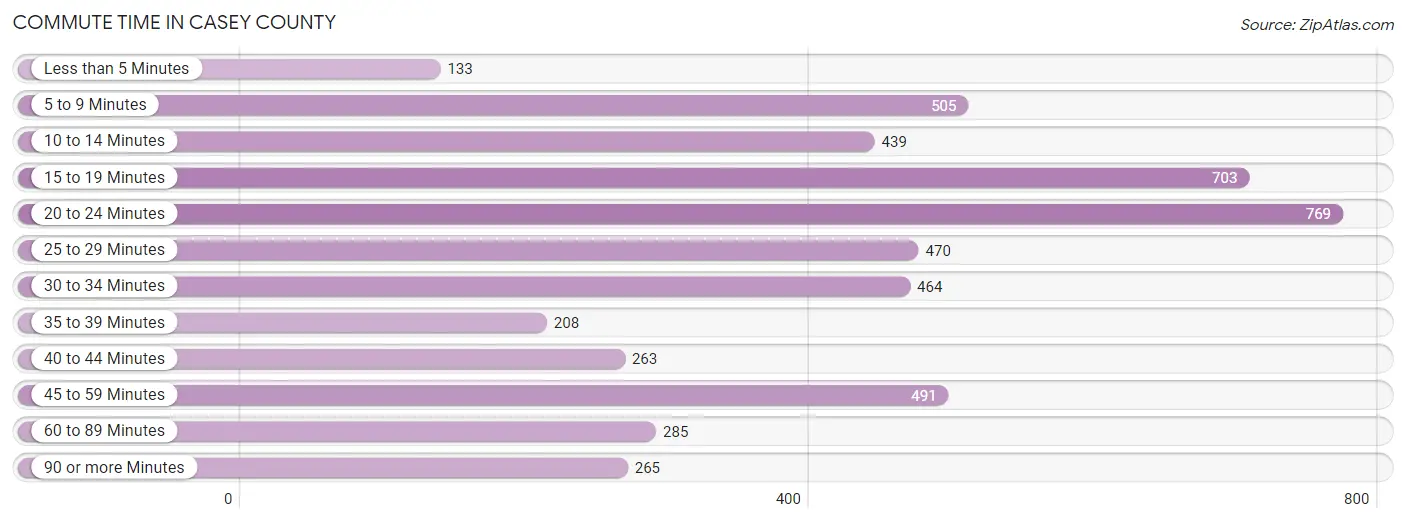
| Commute Time | # Commuters | % Commuters |
| Less than 5 Minutes | 133 | 2.7% |
| 5 to 9 Minutes | 505 | 10.1% |
| 10 to 14 Minutes | 439 | 8.8% |
| 15 to 19 Minutes | 703 | 14.1% |
| 20 to 24 Minutes | 769 | 15.4% |
| 25 to 29 Minutes | 470 | 9.4% |
| 30 to 34 Minutes | 464 | 9.3% |
| 35 to 39 Minutes | 208 | 4.2% |
| 40 to 44 Minutes | 263 | 5.3% |
| 45 to 59 Minutes | 491 | 9.8% |
| 60 to 89 Minutes | 285 | 5.7% |
| 90 or more Minutes | 265 | 5.3% |
Commute Time by Sex in Casey County
The most common commute times in Casey County are 20 to 24 minutes (398 commuters, 14.4%) for males and 20 to 24 minutes (371 commuters, 16.6%) for females.
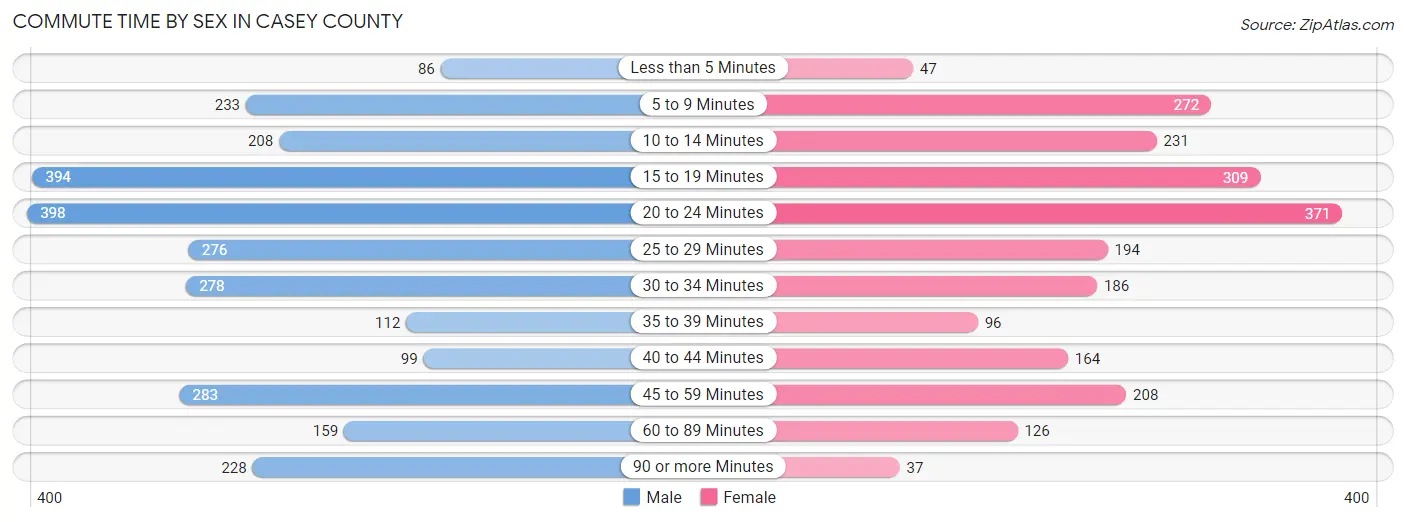
| Commute Time | Male | Female |
| Less than 5 Minutes | 86 (3.1%) | 47 (2.1%) |
| 5 to 9 Minutes | 233 (8.5%) | 272 (12.1%) |
| 10 to 14 Minutes | 208 (7.5%) | 231 (10.3%) |
| 15 to 19 Minutes | 394 (14.3%) | 309 (13.8%) |
| 20 to 24 Minutes | 398 (14.4%) | 371 (16.6%) |
| 25 to 29 Minutes | 276 (10.0%) | 194 (8.7%) |
| 30 to 34 Minutes | 278 (10.1%) | 186 (8.3%) |
| 35 to 39 Minutes | 112 (4.1%) | 96 (4.3%) |
| 40 to 44 Minutes | 99 (3.6%) | 164 (7.3%) |
| 45 to 59 Minutes | 283 (10.3%) | 208 (9.3%) |
| 60 to 89 Minutes | 159 (5.8%) | 126 (5.6%) |
| 90 or more Minutes | 228 (8.3%) | 37 (1.7%) |
Time of Departure to Work by Sex in Casey County
The most frequent times of departure to work in Casey County are 7:00 AM to 7:29 AM (526, 19.1%) for males and 7:30 AM to 7:59 AM (518, 23.1%) for females.
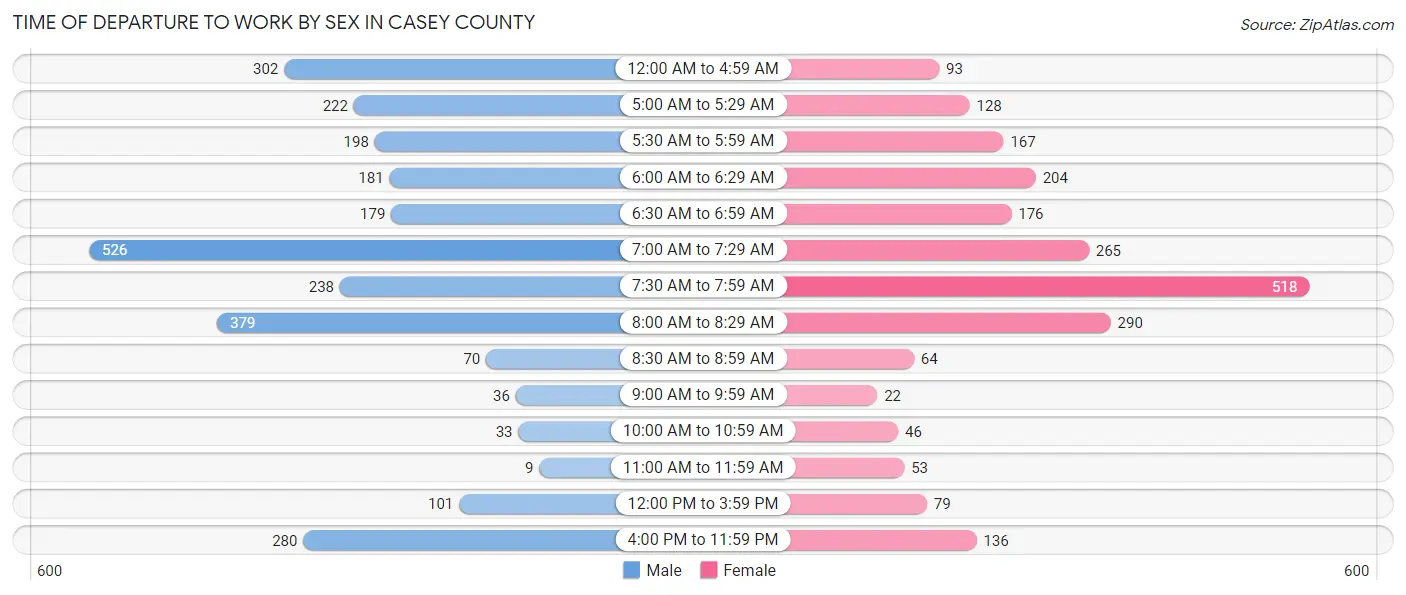
| Time of Departure | Male | Female |
| 12:00 AM to 4:59 AM | 302 (11.0%) | 93 (4.2%) |
| 5:00 AM to 5:29 AM | 222 (8.1%) | 128 (5.7%) |
| 5:30 AM to 5:59 AM | 198 (7.2%) | 167 (7.4%) |
| 6:00 AM to 6:29 AM | 181 (6.6%) | 204 (9.1%) |
| 6:30 AM to 6:59 AM | 179 (6.5%) | 176 (7.9%) |
| 7:00 AM to 7:29 AM | 526 (19.1%) | 265 (11.8%) |
| 7:30 AM to 7:59 AM | 238 (8.6%) | 518 (23.1%) |
| 8:00 AM to 8:29 AM | 379 (13.8%) | 290 (12.9%) |
| 8:30 AM to 8:59 AM | 70 (2.5%) | 64 (2.9%) |
| 9:00 AM to 9:59 AM | 36 (1.3%) | 22 (1.0%) |
| 10:00 AM to 10:59 AM | 33 (1.2%) | 46 (2.1%) |
| 11:00 AM to 11:59 AM | 9 (0.3%) | 53 (2.4%) |
| 12:00 PM to 3:59 PM | 101 (3.7%) | 79 (3.5%) |
| 4:00 PM to 11:59 PM | 280 (10.2%) | 136 (6.1%) |
| Total | 2,754 (100.0%) | 2,241 (100.0%) |
Housing Occupancy in Casey County
Occupancy by Ownership in Casey County
Of the total 6,029 dwellings in Casey County, owner-occupied units account for 4,568 (75.8%), while renter-occupied units make up 1,461 (24.2%).
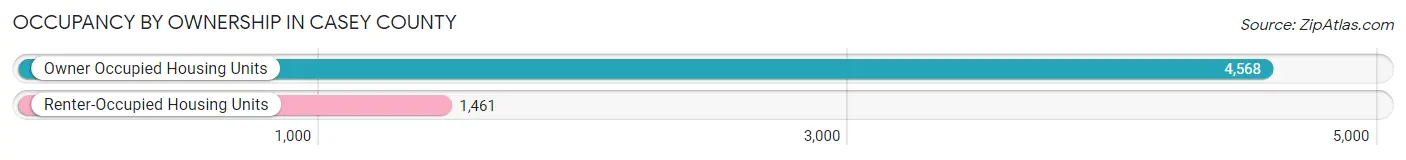
| Occupancy | # Housing Units | % Housing Units |
| Owner Occupied Housing Units | 4,568 | 75.8% |
| Renter-Occupied Housing Units | 1,461 | 24.2% |
| Total Occupied Housing Units | 6,029 | 100.0% |
Occupancy by Household Size in Casey County
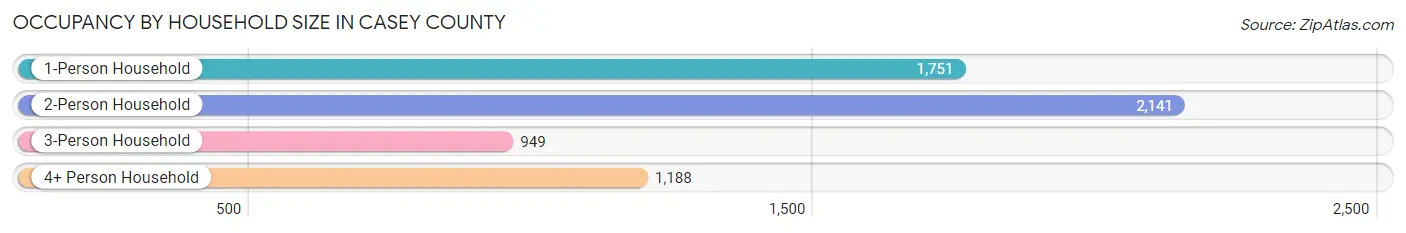
| Household Size | # Housing Units | % Housing Units |
| 1-Person Household | 1,751 | 29.0% |
| 2-Person Household | 2,141 | 35.5% |
| 3-Person Household | 949 | 15.7% |
| 4+ Person Household | 1,188 | 19.7% |
| Total Housing Units | 6,029 | 100.0% |
Occupancy by Ownership by Household Size in Casey County
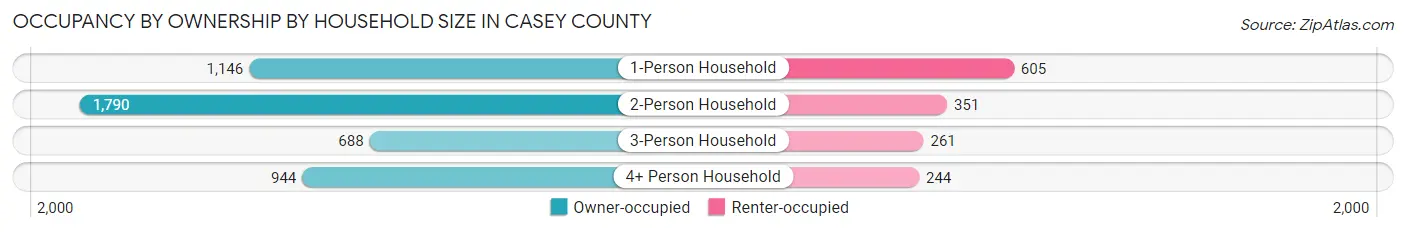
| Household Size | Owner-occupied | Renter-occupied |
| 1-Person Household | 1,146 (65.4%) | 605 (34.5%) |
| 2-Person Household | 1,790 (83.6%) | 351 (16.4%) |
| 3-Person Household | 688 (72.5%) | 261 (27.5%) |
| 4+ Person Household | 944 (79.5%) | 244 (20.5%) |
| Total Housing Units | 4,568 (75.8%) | 1,461 (24.2%) |
Occupancy by Educational Attainment in Casey County
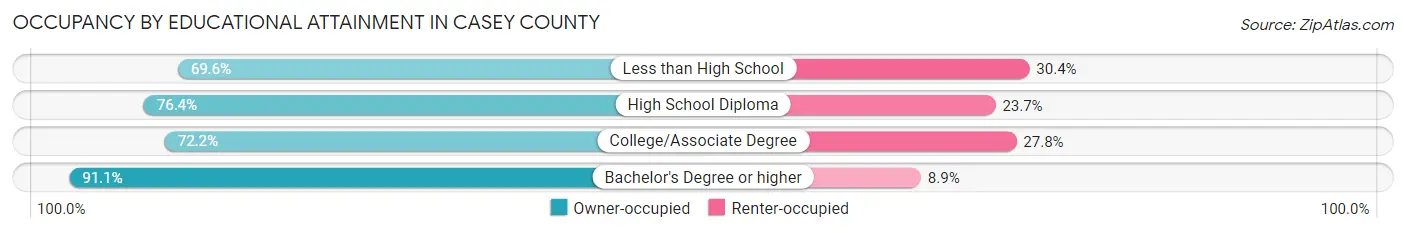
| Household Size | Owner-occupied | Renter-occupied |
| Less than High School | 919 (69.6%) | 401 (30.4%) |
| High School Diploma | 1,834 (76.3%) | 568 (23.6%) |
| College/Associate Degree | 1,096 (72.2%) | 422 (27.8%) |
| Bachelor's Degree or higher | 719 (91.1%) | 70 (8.9%) |
Occupancy by Age of Householder in Casey County
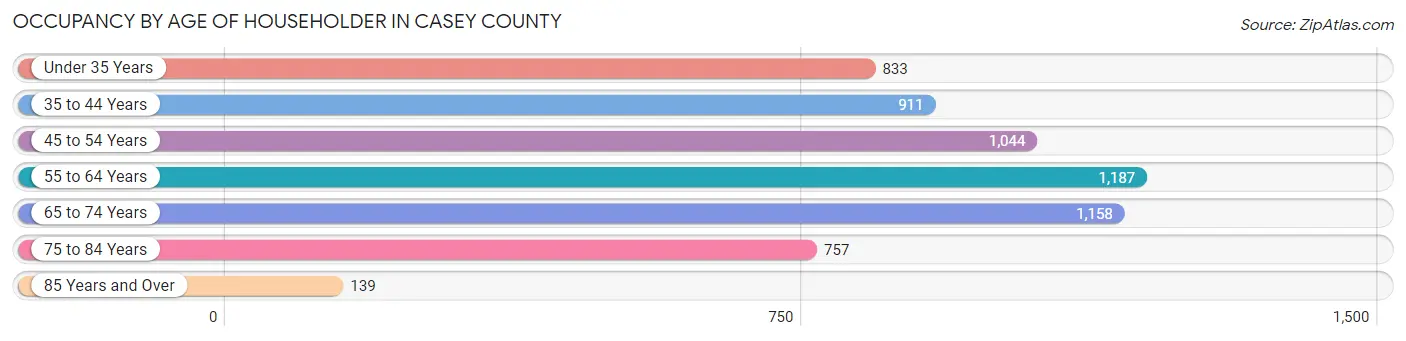
| Age Bracket | # Households | % Households |
| Under 35 Years | 833 | 13.8% |
| 35 to 44 Years | 911 | 15.1% |
| 45 to 54 Years | 1,044 | 17.3% |
| 55 to 64 Years | 1,187 | 19.7% |
| 65 to 74 Years | 1,158 | 19.2% |
| 75 to 84 Years | 757 | 12.6% |
| 85 Years and Over | 139 | 2.3% |
| Total | 6,029 | 100.0% |
Housing Finances in Casey County
Median Income by Occupancy in Casey County
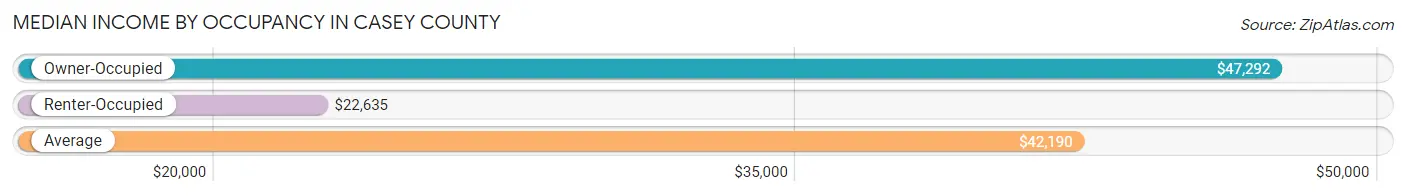
| Occupancy Type | # Households | Median Income |
| Owner-Occupied | 4,568 (75.8%) | $47,292 |
| Renter-Occupied | 1,461 (24.2%) | $22,635 |
| Average | 6,029 (100.0%) | $42,190 |
Occupancy by Householder Income Bracket in Casey County
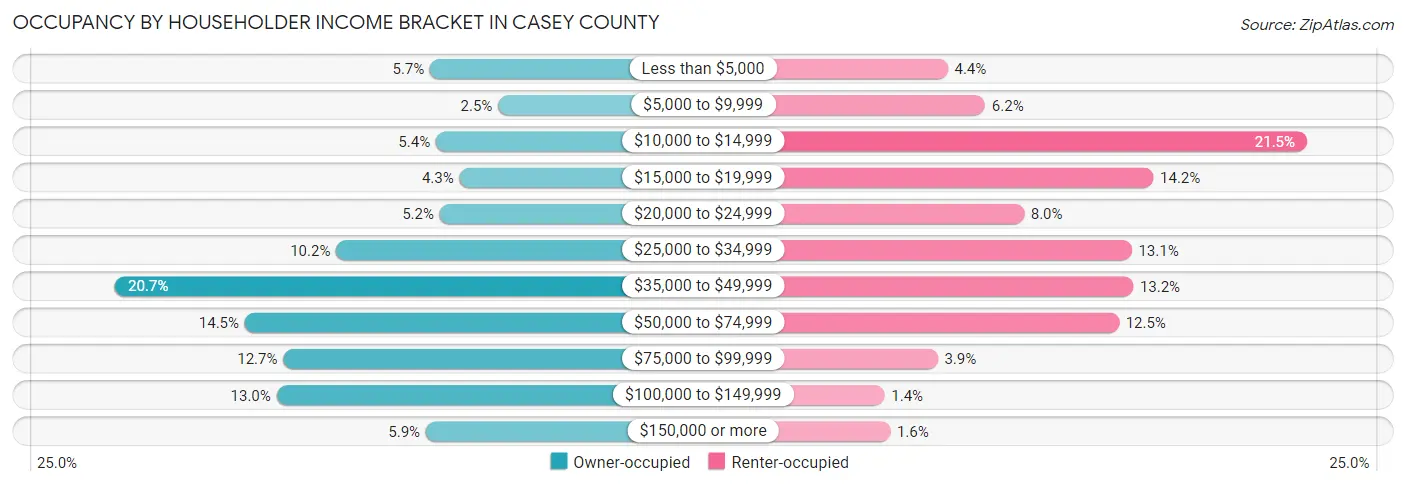
| Income Bracket | Owner-occupied | Renter-occupied |
| Less than $5,000 | 260 (5.7%) | 64 (4.4%) |
| $5,000 to $9,999 | 112 (2.5%) | 90 (6.2%) |
| $10,000 to $14,999 | 247 (5.4%) | 314 (21.5%) |
| $15,000 to $19,999 | 196 (4.3%) | 207 (14.2%) |
| $20,000 to $24,999 | 239 (5.2%) | 117 (8.0%) |
| $25,000 to $34,999 | 464 (10.2%) | 192 (13.1%) |
| $35,000 to $49,999 | 945 (20.7%) | 193 (13.2%) |
| $50,000 to $74,999 | 663 (14.5%) | 183 (12.5%) |
| $75,000 to $99,999 | 579 (12.7%) | 57 (3.9%) |
| $100,000 to $149,999 | 594 (13.0%) | 20 (1.4%) |
| $150,000 or more | 269 (5.9%) | 24 (1.6%) |
| Total | 4,568 (100.0%) | 1,461 (100.0%) |
Monthly Housing Cost Tiers in Casey County
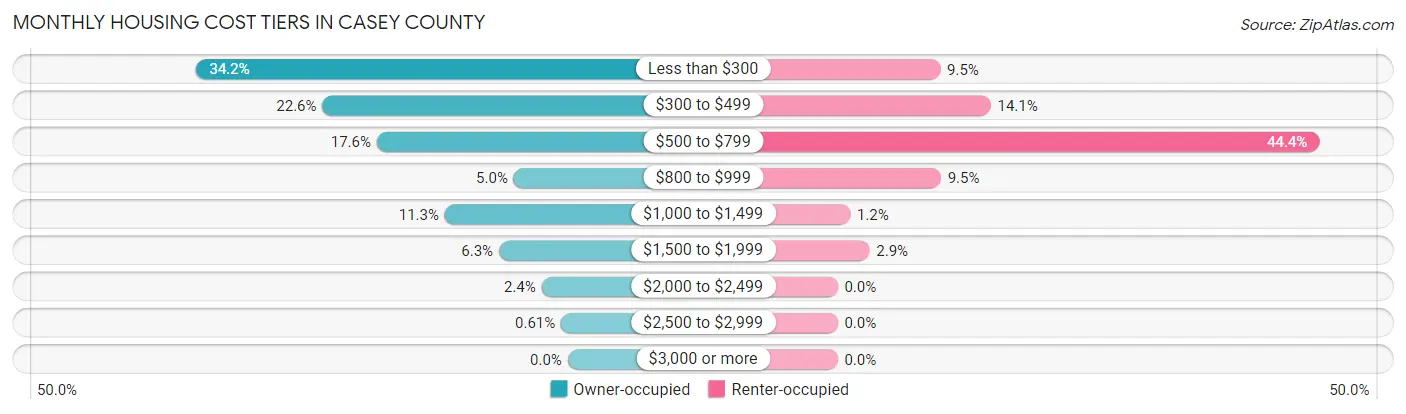
| Monthly Cost | Owner-occupied | Renter-occupied |
| Less than $300 | 1,562 (34.2%) | 138 (9.5%) |
| $300 to $499 | 1,032 (22.6%) | 206 (14.1%) |
| $500 to $799 | 803 (17.6%) | 648 (44.4%) |
| $800 to $999 | 227 (5.0%) | 139 (9.5%) |
| $1,000 to $1,499 | 517 (11.3%) | 17 (1.2%) |
| $1,500 to $1,999 | 289 (6.3%) | 43 (2.9%) |
| $2,000 to $2,499 | 110 (2.4%) | 0 (0.0%) |
| $2,500 to $2,999 | 28 (0.6%) | 0 (0.0%) |
| $3,000 or more | 0 (0.0%) | 0 (0.0%) |
| Total | 4,568 (100.0%) | 1,461 (100.0%) |
Physical Housing Characteristics in Casey County
Housing Structures in Casey County
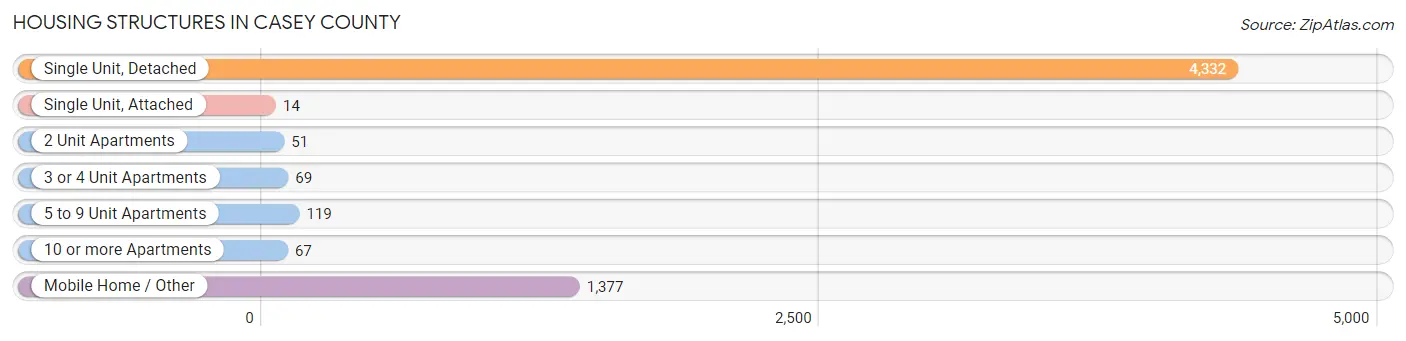
| Structure Type | # Housing Units | % Housing Units |
| Single Unit, Detached | 4,332 | 71.9% |
| Single Unit, Attached | 14 | 0.2% |
| 2 Unit Apartments | 51 | 0.9% |
| 3 or 4 Unit Apartments | 69 | 1.1% |
| 5 to 9 Unit Apartments | 119 | 2.0% |
| 10 or more Apartments | 67 | 1.1% |
| Mobile Home / Other | 1,377 | 22.8% |
| Total | 6,029 | 100.0% |
Housing Structures by Occupancy in Casey County
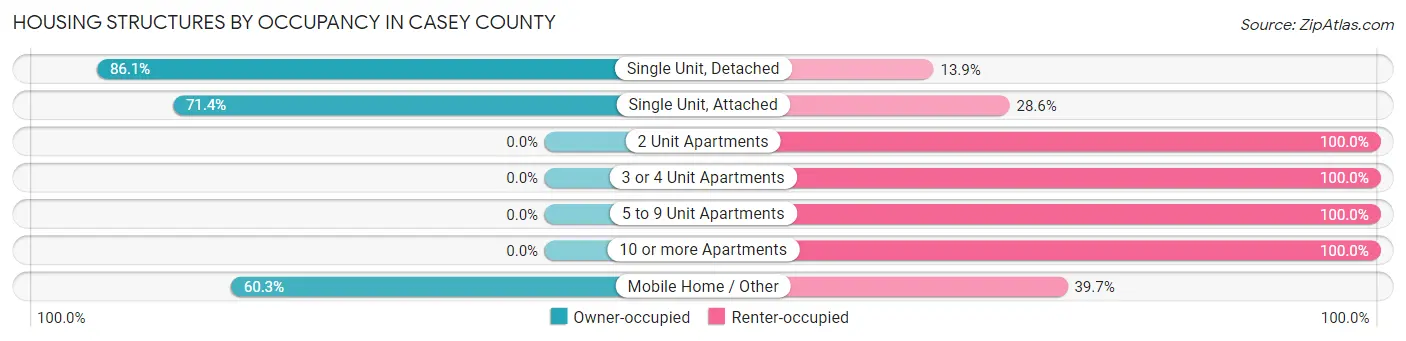
| Structure Type | Owner-occupied | Renter-occupied |
| Single Unit, Detached | 3,728 (86.1%) | 604 (13.9%) |
| Single Unit, Attached | 10 (71.4%) | 4 (28.6%) |
| 2 Unit Apartments | 0 (0.0%) | 51 (100.0%) |
| 3 or 4 Unit Apartments | 0 (0.0%) | 69 (100.0%) |
| 5 to 9 Unit Apartments | 0 (0.0%) | 119 (100.0%) |
| 10 or more Apartments | 0 (0.0%) | 67 (100.0%) |
| Mobile Home / Other | 830 (60.3%) | 547 (39.7%) |
| Total | 4,568 (75.8%) | 1,461 (24.2%) |
Housing Structures by Number of Rooms in Casey County
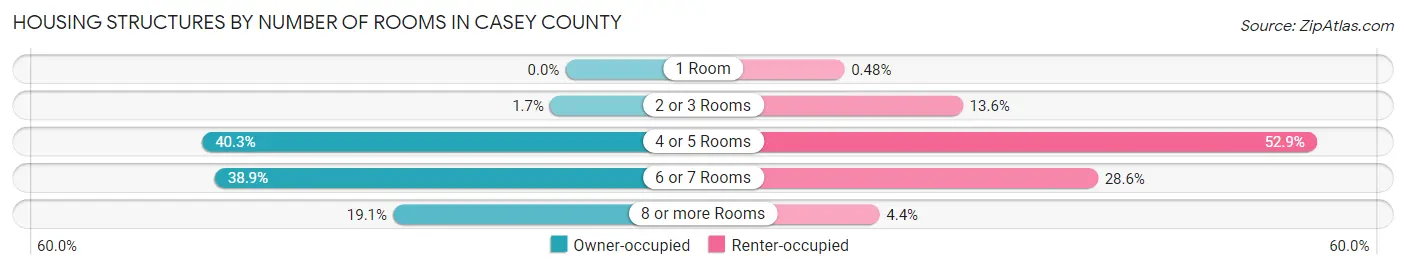
| Number of Rooms | Owner-occupied | Renter-occupied |
| 1 Room | 0 (0.0%) | 7 (0.5%) |
| 2 or 3 Rooms | 78 (1.7%) | 199 (13.6%) |
| 4 or 5 Rooms | 1,840 (40.3%) | 773 (52.9%) |
| 6 or 7 Rooms | 1,776 (38.9%) | 418 (28.6%) |
| 8 or more Rooms | 874 (19.1%) | 64 (4.4%) |
| Total | 4,568 (100.0%) | 1,461 (100.0%) |
Housing Structure by Heating Type in Casey County
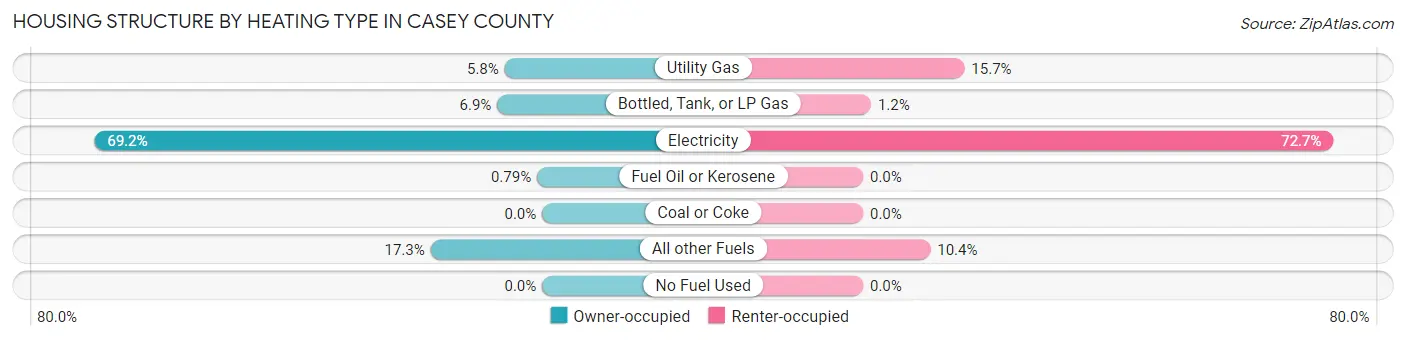
| Heating Type | Owner-occupied | Renter-occupied |
| Utility Gas | 265 (5.8%) | 229 (15.7%) |
| Bottled, Tank, or LP Gas | 317 (6.9%) | 18 (1.2%) |
| Electricity | 3,162 (69.2%) | 1,062 (72.7%) |
| Fuel Oil or Kerosene | 36 (0.8%) | 0 (0.0%) |
| Coal or Coke | 0 (0.0%) | 0 (0.0%) |
| All other Fuels | 788 (17.2%) | 152 (10.4%) |
| No Fuel Used | 0 (0.0%) | 0 (0.0%) |
| Total | 4,568 (100.0%) | 1,461 (100.0%) |
Household Vehicle Usage in Casey County
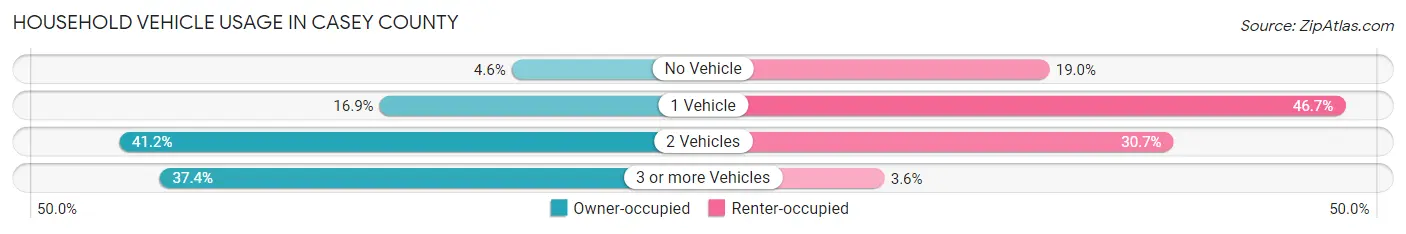
| Vehicles per Household | Owner-occupied | Renter-occupied |
| No Vehicle | 208 (4.5%) | 278 (19.0%) |
| 1 Vehicle | 771 (16.9%) | 682 (46.7%) |
| 2 Vehicles | 1,881 (41.2%) | 448 (30.7%) |
| 3 or more Vehicles | 1,708 (37.4%) | 53 (3.6%) |
| Total | 4,568 (100.0%) | 1,461 (100.0%) |
Real Estate & Mortgages in Casey County
Real Estate and Mortgage Overview in Casey County
| Characteristic | Without Mortgage | With Mortgage |
| Housing Units | 2,872 | 1,696 |
| Median Property Value | $101,700 | $167,100 |
| Median Household Income | $40,861 | $154 |
| Monthly Housing Costs | $283 | $0 |
| Real Estate Taxes | $530 | $14 |
Property Value by Mortgage Status in Casey County
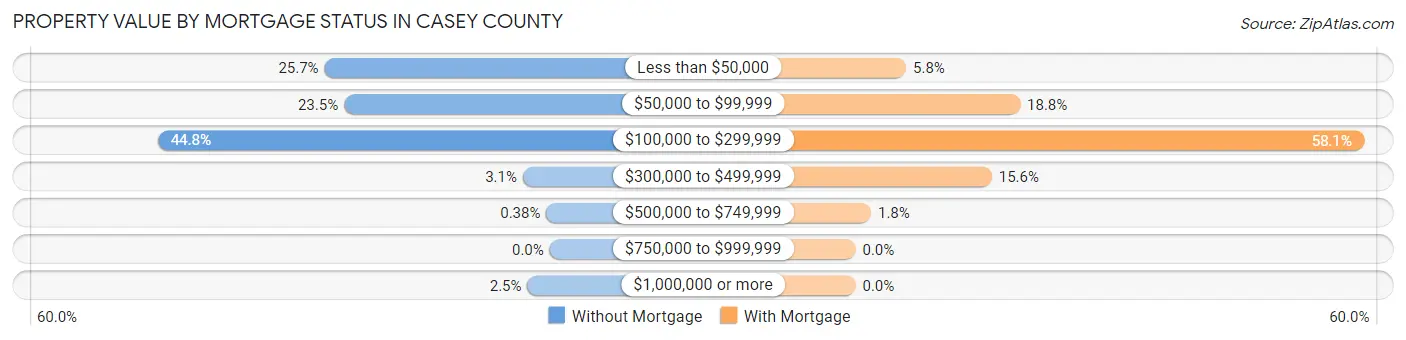
| Property Value | Without Mortgage | With Mortgage |
| Less than $50,000 | 739 (25.7%) | 98 (5.8%) |
| $50,000 to $99,999 | 675 (23.5%) | 319 (18.8%) |
| $100,000 to $299,999 | 1,286 (44.8%) | 985 (58.1%) |
| $300,000 to $499,999 | 88 (3.1%) | 264 (15.6%) |
| $500,000 to $749,999 | 11 (0.4%) | 30 (1.8%) |
| $750,000 to $999,999 | 0 (0.0%) | 0 (0.0%) |
| $1,000,000 or more | 73 (2.5%) | 0 (0.0%) |
| Total | 2,872 (100.0%) | 1,696 (100.0%) |
Household Income by Mortgage Status in Casey County
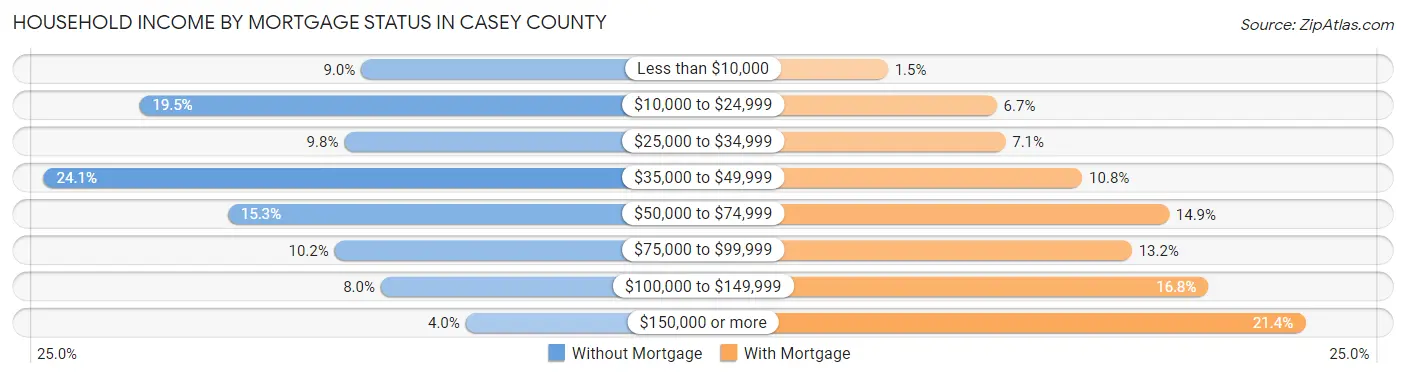
| Household Income | Without Mortgage | With Mortgage |
| Less than $10,000 | 258 (9.0%) | 26 (1.5%) |
| $10,000 to $24,999 | 561 (19.5%) | 114 (6.7%) |
| $25,000 to $34,999 | 281 (9.8%) | 121 (7.1%) |
| $35,000 to $49,999 | 692 (24.1%) | 183 (10.8%) |
| $50,000 to $74,999 | 440 (15.3%) | 253 (14.9%) |
| $75,000 to $99,999 | 294 (10.2%) | 223 (13.2%) |
| $100,000 to $149,999 | 231 (8.0%) | 285 (16.8%) |
| $150,000 or more | 115 (4.0%) | 363 (21.4%) |
| Total | 2,872 (100.0%) | 1,696 (100.0%) |
Property Value to Household Income Ratio in Casey County
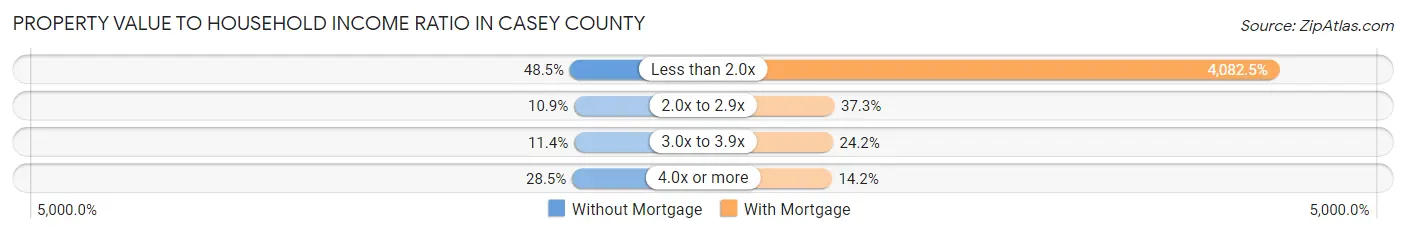
| Value-to-Income Ratio | Without Mortgage | With Mortgage |
| Less than 2.0x | 1,392 (48.5%) | 69,239 (4,082.5%) |
| 2.0x to 2.9x | 312 (10.9%) | 632 (37.3%) |
| 3.0x to 3.9x | 327 (11.4%) | 411 (24.2%) |
| 4.0x or more | 817 (28.4%) | 241 (14.2%) |
| Total | 2,872 (100.0%) | 1,696 (100.0%) |
Real Estate Taxes by Mortgage Status in Casey County
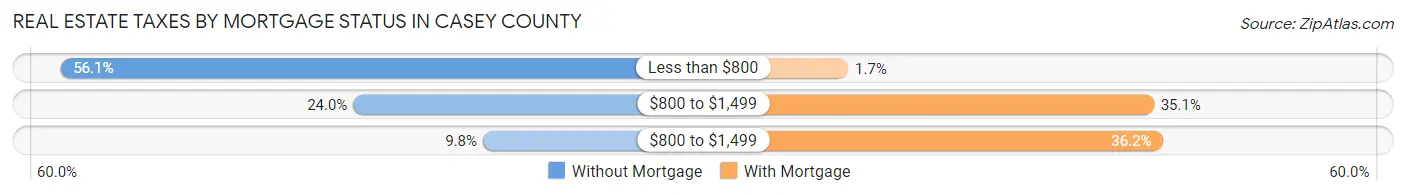
| Property Taxes | Without Mortgage | With Mortgage |
| Less than $800 | 1,611 (56.1%) | 28 (1.7%) |
| $800 to $1,499 | 689 (24.0%) | 596 (35.1%) |
| $800 to $1,499 | 281 (9.8%) | 614 (36.2%) |
| Total | 2,872 (100.0%) | 1,696 (100.0%) |
Health & Disability in Casey County
Health Insurance Coverage by Age in Casey County
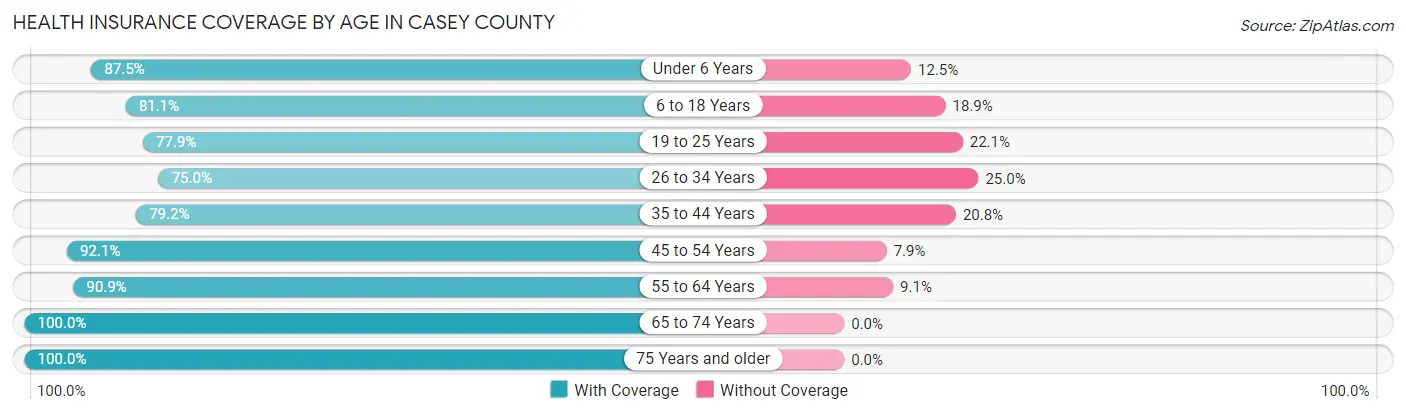
| Age Bracket | With Coverage | Without Coverage |
| Under 6 Years | 1,040 (87.5%) | 148 (12.5%) |
| 6 to 18 Years | 2,183 (81.1%) | 508 (18.9%) |
| 19 to 25 Years | 804 (77.9%) | 228 (22.1%) |
| 26 to 34 Years | 1,214 (75.0%) | 405 (25.0%) |
| 35 to 44 Years | 1,388 (79.2%) | 365 (20.8%) |
| 45 to 54 Years | 1,816 (92.1%) | 156 (7.9%) |
| 55 to 64 Years | 1,946 (90.9%) | 195 (9.1%) |
| 65 to 74 Years | 1,865 (100.0%) | 0 (0.0%) |
| 75 Years and older | 1,321 (100.0%) | 0 (0.0%) |
| Total | 13,577 (87.1%) | 2,005 (12.9%) |
Health Insurance Coverage by Citizenship Status in Casey County
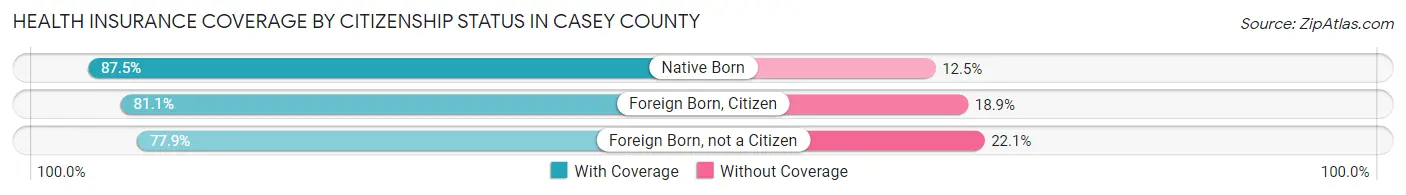
| Citizenship Status | With Coverage | Without Coverage |
| Native Born | 1,040 (87.5%) | 148 (12.5%) |
| Foreign Born, Citizen | 2,183 (81.1%) | 508 (18.9%) |
| Foreign Born, not a Citizen | 804 (77.9%) | 228 (22.1%) |
Health Insurance Coverage by Household Income in Casey County
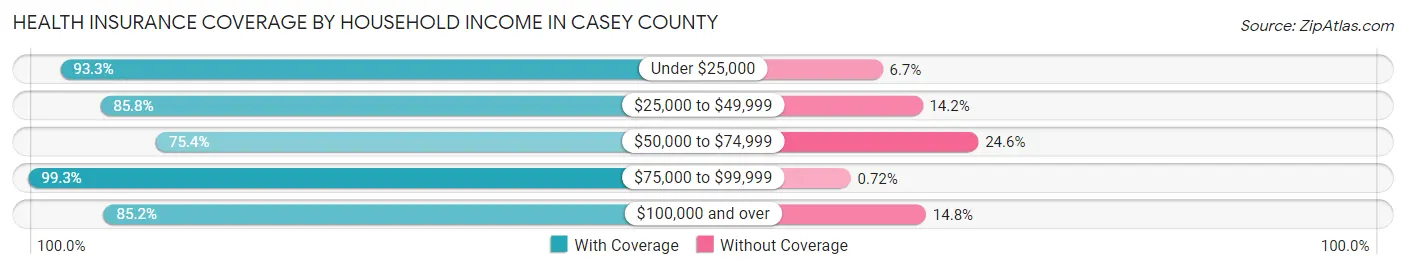
| Household Income | With Coverage | Without Coverage |
| Under $25,000 | 3,084 (93.3%) | 221 (6.7%) |
| $25,000 to $49,999 | 4,256 (85.8%) | 703 (14.2%) |
| $50,000 to $74,999 | 1,845 (75.4%) | 603 (24.6%) |
| $75,000 to $99,999 | 1,795 (99.3%) | 13 (0.7%) |
| $100,000 and over | 2,535 (85.2%) | 441 (14.8%) |
Public vs Private Health Insurance Coverage by Age in Casey County
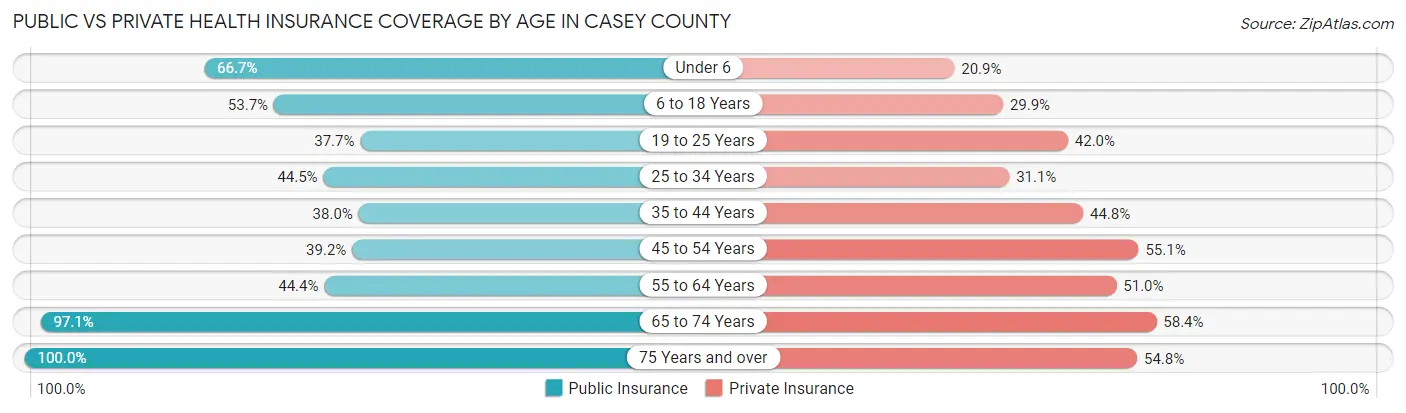
| Age Bracket | Public Insurance | Private Insurance |
| Under 6 | 792 (66.7%) | 248 (20.9%) |
| 6 to 18 Years | 1,446 (53.7%) | 805 (29.9%) |
| 19 to 25 Years | 389 (37.7%) | 433 (42.0%) |
| 25 to 34 Years | 721 (44.5%) | 503 (31.1%) |
| 35 to 44 Years | 666 (38.0%) | 785 (44.8%) |
| 45 to 54 Years | 773 (39.2%) | 1,086 (55.1%) |
| 55 to 64 Years | 950 (44.4%) | 1,091 (51.0%) |
| 65 to 74 Years | 1,810 (97.1%) | 1,089 (58.4%) |
| 75 Years and over | 1,321 (100.0%) | 724 (54.8%) |
| Total | 8,868 (56.9%) | 6,764 (43.4%) |
Disability Status by Sex by Age in Casey County
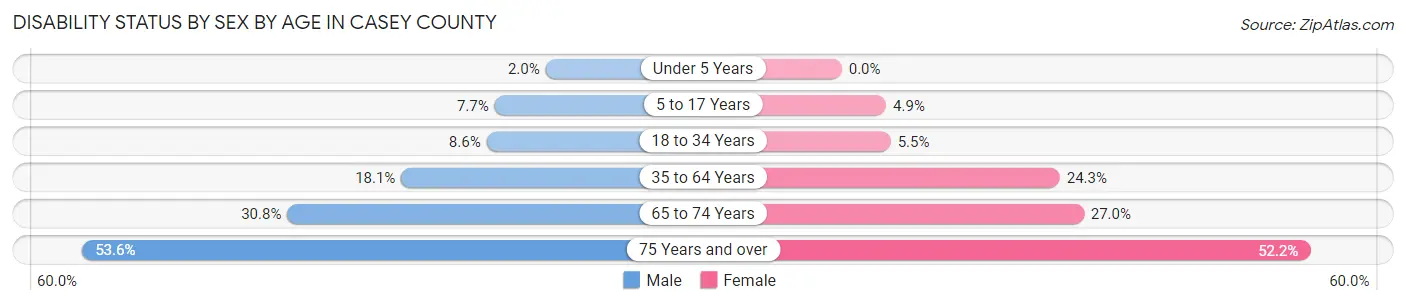
| Age Bracket | Male | Female |
| Under 5 Years | 9 (2.0%) | 0 (0.0%) |
| 5 to 17 Years | 102 (7.7%) | 63 (4.9%) |
| 18 to 34 Years | 124 (8.6%) | 78 (5.4%) |
| 35 to 64 Years | 526 (18.1%) | 717 (24.3%) |
| 65 to 74 Years | 278 (30.7%) | 259 (27.0%) |
| 75 Years and over | 262 (53.6%) | 434 (52.2%) |
Disability Class by Sex by Age in Casey County
Disability Class: Hearing Difficulty
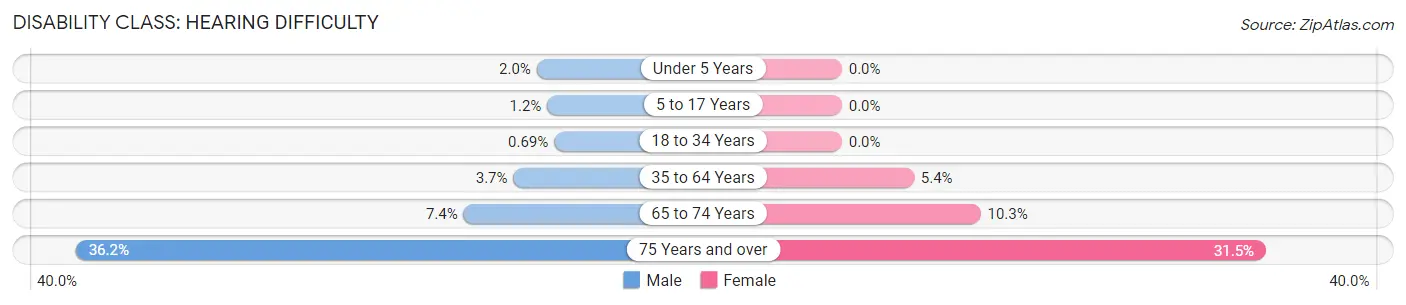
| Age Bracket | Male | Female |
| Under 5 Years | 9 (2.0%) | 0 (0.0%) |
| 5 to 17 Years | 16 (1.2%) | 0 (0.0%) |
| 18 to 34 Years | 10 (0.7%) | 0 (0.0%) |
| 35 to 64 Years | 108 (3.7%) | 158 (5.3%) |
| 65 to 74 Years | 67 (7.4%) | 99 (10.3%) |
| 75 Years and over | 177 (36.2%) | 262 (31.5%) |
Disability Class: Vision Difficulty
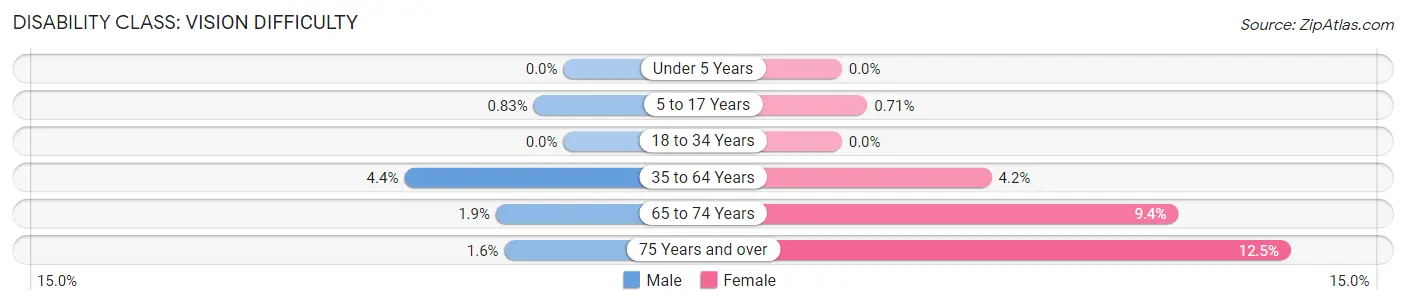
| Age Bracket | Male | Female |
| Under 5 Years | 0 (0.0%) | 0 (0.0%) |
| 5 to 17 Years | 11 (0.8%) | 9 (0.7%) |
| 18 to 34 Years | 0 (0.0%) | 0 (0.0%) |
| 35 to 64 Years | 129 (4.4%) | 123 (4.2%) |
| 65 to 74 Years | 17 (1.9%) | 90 (9.4%) |
| 75 Years and over | 8 (1.6%) | 104 (12.5%) |
Disability Class: Cognitive Difficulty
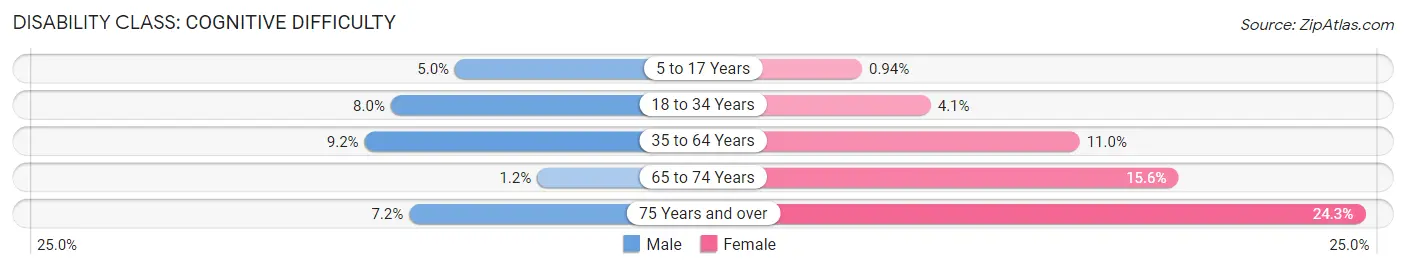
| Age Bracket | Male | Female |
| 5 to 17 Years | 67 (5.0%) | 12 (0.9%) |
| 18 to 34 Years | 116 (8.0%) | 59 (4.1%) |
| 35 to 64 Years | 269 (9.2%) | 326 (11.0%) |
| 65 to 74 Years | 11 (1.2%) | 150 (15.6%) |
| 75 Years and over | 35 (7.2%) | 202 (24.3%) |
Disability Class: Ambulatory Difficulty
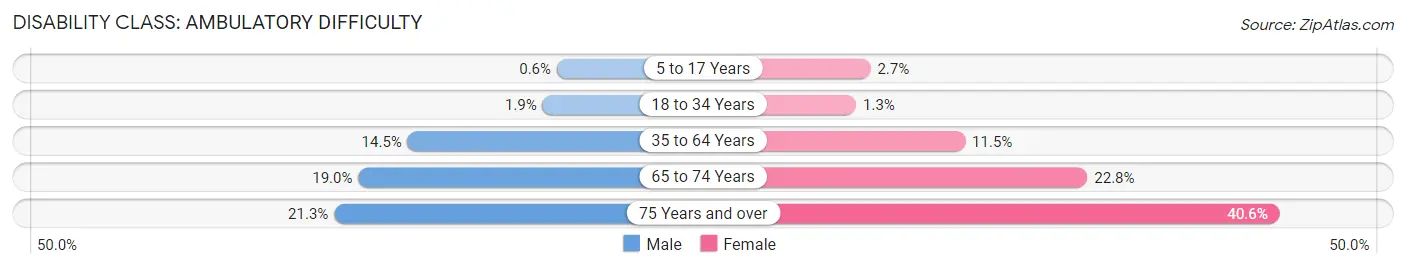
| Age Bracket | Male | Female |
| 5 to 17 Years | 8 (0.6%) | 34 (2.7%) |
| 18 to 34 Years | 28 (1.9%) | 19 (1.3%) |
| 35 to 64 Years | 421 (14.4%) | 338 (11.5%) |
| 65 to 74 Years | 172 (19.0%) | 219 (22.8%) |
| 75 Years and over | 104 (21.3%) | 338 (40.6%) |
Disability Class: Self-Care Difficulty
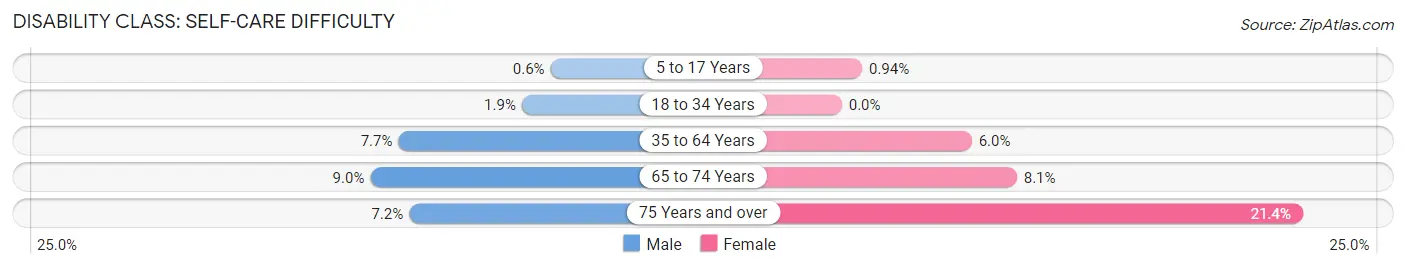
| Age Bracket | Male | Female |
| 5 to 17 Years | 8 (0.6%) | 12 (0.9%) |
| 18 to 34 Years | 28 (1.9%) | 0 (0.0%) |
| 35 to 64 Years | 223 (7.7%) | 178 (6.0%) |
| 65 to 74 Years | 81 (9.0%) | 78 (8.1%) |
| 75 Years and over | 35 (7.2%) | 178 (21.4%) |
Technology Access in Casey County
Computing Device Access in Casey County
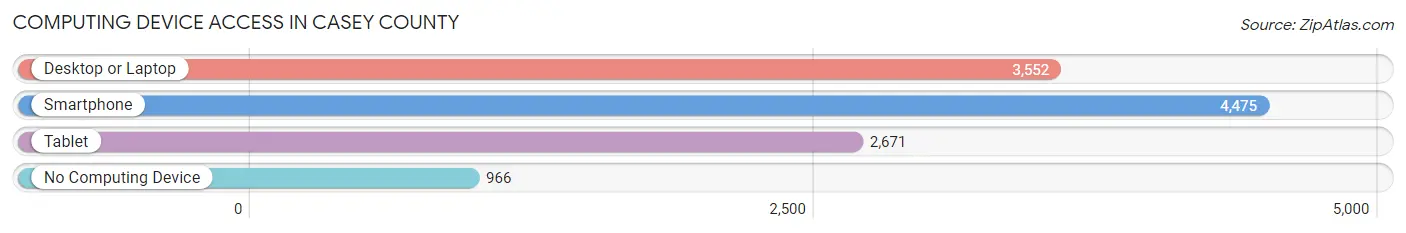
| Device Type | # Households | % Households |
| Desktop or Laptop | 3,552 | 58.9% |
| Smartphone | 4,475 | 74.2% |
| Tablet | 2,671 | 44.3% |
| No Computing Device | 966 | 16.0% |
| Total | 6,029 | 100.0% |
Internet Access in Casey County
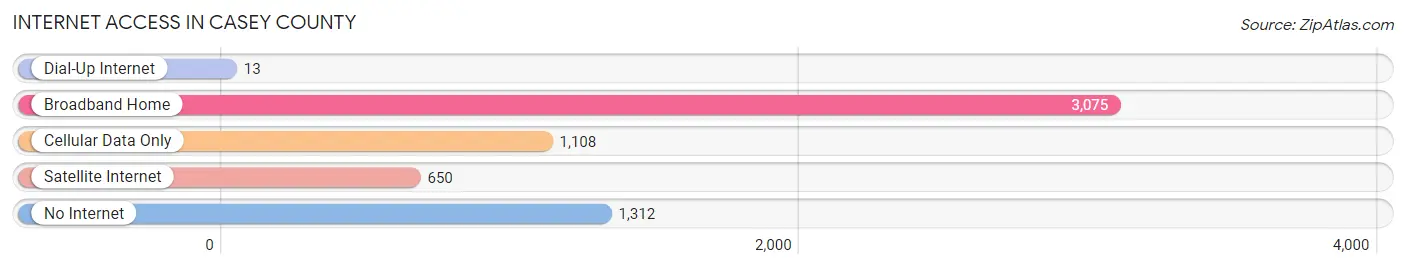
| Internet Type | # Households | % Households |
| Dial-Up Internet | 13 | 0.2% |
| Broadband Home | 3,075 | 51.0% |
| Cellular Data Only | 1,108 | 18.4% |
| Satellite Internet | 650 | 10.8% |
| No Internet | 1,312 | 21.8% |
| Total | 6,029 | 100.0% |
Casey County Summary
Casey County is a county located in the south-central region of the U.S. state of Kentucky. As of the 2010 census, the population was 15,955. Its county seat is Liberty. The county was formed in 1806 and named for Colonel William Casey, an early settler.
Geography
Casey County is located in south-central Kentucky, in the Pennyroyal region of the state. It is bordered by Adair County to the north, Russell County to the east, Pulaski County to the south, and Lincoln County to the west. The county is located in the Eastern Coal Field region of the state.
The county is mostly composed of rolling hills, with the highest point being at the top of the ridge line in the northern part of the county, at an elevation of 890 feet (271 m). The Green River forms the western border of the county, and the Middle Fork of the Kentucky River forms the eastern border.
The county has a total area of 441 square miles (1,140 km2), of which 439 square miles (1,140 km2) is land and 2.2 square miles (5.7 km2) (0.5%) is water.
Demographics
As of the 2010 United States Census, there were 15,955 people, 6,541 households, and 4,619 families residing in the county. The population density was 36.3 inhabitants per square mile (14.0/km2). There were 7,541 housing units at an average density of 17.1 per square mile (6.6/km2). The racial makeup of the county was 97.7% white, 0.7% black or African American, 0.2% Asian, 0.2% American Indian, 0.3% from other races, and 0.9% from two or more races. Those of Hispanic or Latino origin made up 1.0% of the population.
In terms of ancestry, 16.7% were American, 11.7% were Irish, 11.3% were German, and 8.7% were English. Of the 6,541 households, 32.3% had children under the age of 18 living with them, 54.2% were married couples living together, 11.3% had a female householder with no husband present, 29.2% were non-families, and 25.2% of all households were made up of individuals. The average household size was 2.43 and the average family size was 2.88. The median age was 41.2 years.
Economy
The economy of Casey County is largely based on agriculture and manufacturing. The county is home to several large farms, as well as several small family farms. The county is also home to several manufacturing plants, including a large furniture factory and a large automotive parts plant.
The county is also home to several small businesses, including restaurants, retail stores, and service businesses. The county is also home to several tourist attractions, including the Casey County Apple Festival, the Casey County Fair, and the Liberty Antique Festival.
The county is served by two major highways, US 127 and KY 70. The county is also served by several smaller roads, including KY 914, KY 915, KY 916, and KY 917.
Conclusion
Casey County is a rural county located in south-central Kentucky. The county is home to several large farms, as well as several small family farms. The county is also home to several manufacturing plants, as well as several small businesses. The county is served by two major highways, US 127 and KY 70, as well as several smaller roads. The county is home to several tourist attractions, including the Casey County Apple Festival, the Casey County Fair, and the Liberty Antique Festival.
Common Questions
What is Per Capita Income in Casey County?
Per Capita income in Casey County is $22,970.
What is the Median Family Income in Casey County?
Median Family Income in Casey County is $49,986.
What is the Median Household income in Casey County?
Median Household Income in Casey County is $42,190.
What is Income or Wage Gap in Casey County?
Income or Wage Gap in Casey County is 29.4%.
Women in Casey County earn 70.6 cents for every dollar earned by a man.
What is Family Income Deficit in Casey County?
Family Income Deficit in Casey County is $10,533.
Families that are below poverty line in Casey County earn $10,533 less on average than the poverty threshold level.
What is Inequality or Gini Index in Casey County?
Inequality or Gini Index in Casey County is 0.48.
What is the Total Population of Casey County?
Total Population of Casey County is 15,942.
What is the Total Male Population of Casey County?
Total Male Population of Casey County is 7,713.
What is the Total Female Population of Casey County?
Total Female Population of Casey County is 8,229.
What is the Ratio of Males per 100 Females in Casey County?
There are 93.73 Males per 100 Females in Casey County.
What is the Ratio of Females per 100 Males in Casey County?
There are 106.69 Females per 100 Males in Casey County.
What is the Median Population Age in Casey County?
Median Population Age in Casey County is 41.9 Years.
What is the Average Family Size in Casey County
Average Family Size in Casey County is 3.2 People.
What is the Average Household Size in Casey County
Average Household Size in Casey County is 2.6 People.
How Large is the Labor Force in Casey County?
There are 6,138 People in the Labor Forcein in Casey County.
What is the Percentage of People in the Labor Force in Casey County?
48.1% of People are in the Labor Force in Casey County.
What is the Unemployment Rate in Casey County?
Unemployment Rate in Casey County is 10.4%.