Carter County, KY Map & Demographics
Carter County Map
Carter County Overview
$24,949
PER CAPITA INCOME
$60,536
AVG FAMILY INCOME
$47,004
AVG HOUSEHOLD INCOME
33.1%
WAGE / INCOME GAP [ % ]
66.9¢/ $1
WAGE / INCOME GAP [ $ ]
$11,956
FAMILY INCOME DEFICIT
0.51
INEQUALITY / GINI INDEX
26,671
TOTAL POPULATION
13,343
MALE POPULATION
13,328
FEMALE POPULATION
100.11
MALES / 100 FEMALES
99.89
FEMALES / 100 MALES
41.9
MEDIAN AGE
3.2
AVG FAMILY SIZE
2.7
AVG HOUSEHOLD SIZE
9,758
LABOR FORCE [ PEOPLE ]
45.4%
PERCENT IN LABOR FORCE
6.0%
UNEMPLOYMENT RATE
Carter County Area Codes
Income in Carter County
Income Overview in Carter County
Per Capita Income in Carter County is $24,949, while median incomes of families and households are $60,536 and $47,004 respectively.
| Characteristic | Number | Measure |
| Per Capita Income | 26,671 | $24,949 |
| Median Family Income | 6,652 | $60,536 |
| Mean Family Income | 6,652 | $82,027 |
| Median Household Income | 9,778 | $47,004 |
| Mean Household Income | 9,778 | $67,304 |
| Income Deficit | 6,652 | $11,956 |
| Wage / Income Gap (%) | 26,671 | 33.07% |
| Wage / Income Gap ($) | 26,671 | 66.93¢ per $1 |
| Gini / Inequality Index | 26,671 | 0.51 |
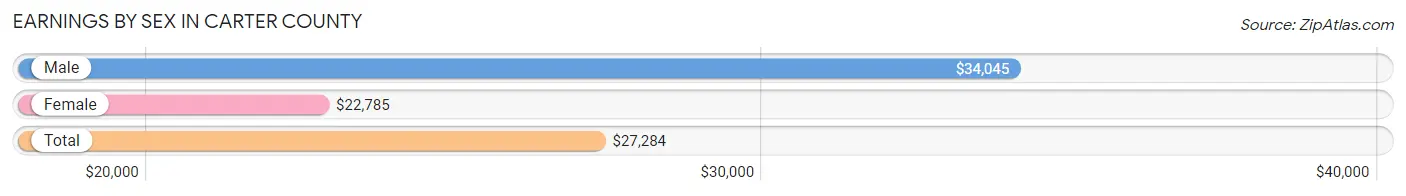
Earnings by Sex in Carter County
Average Earnings in Carter County are $27,284, $34,045 for men and $22,785 for women, a difference of 33.1%.
| Sex | Number | Average Earnings |
| Male | 5,646 (53.7%) | $34,045 |
| Female | 4,873 (46.3%) | $22,785 |
| Total | 10,519 (100.0%) | $27,284 |
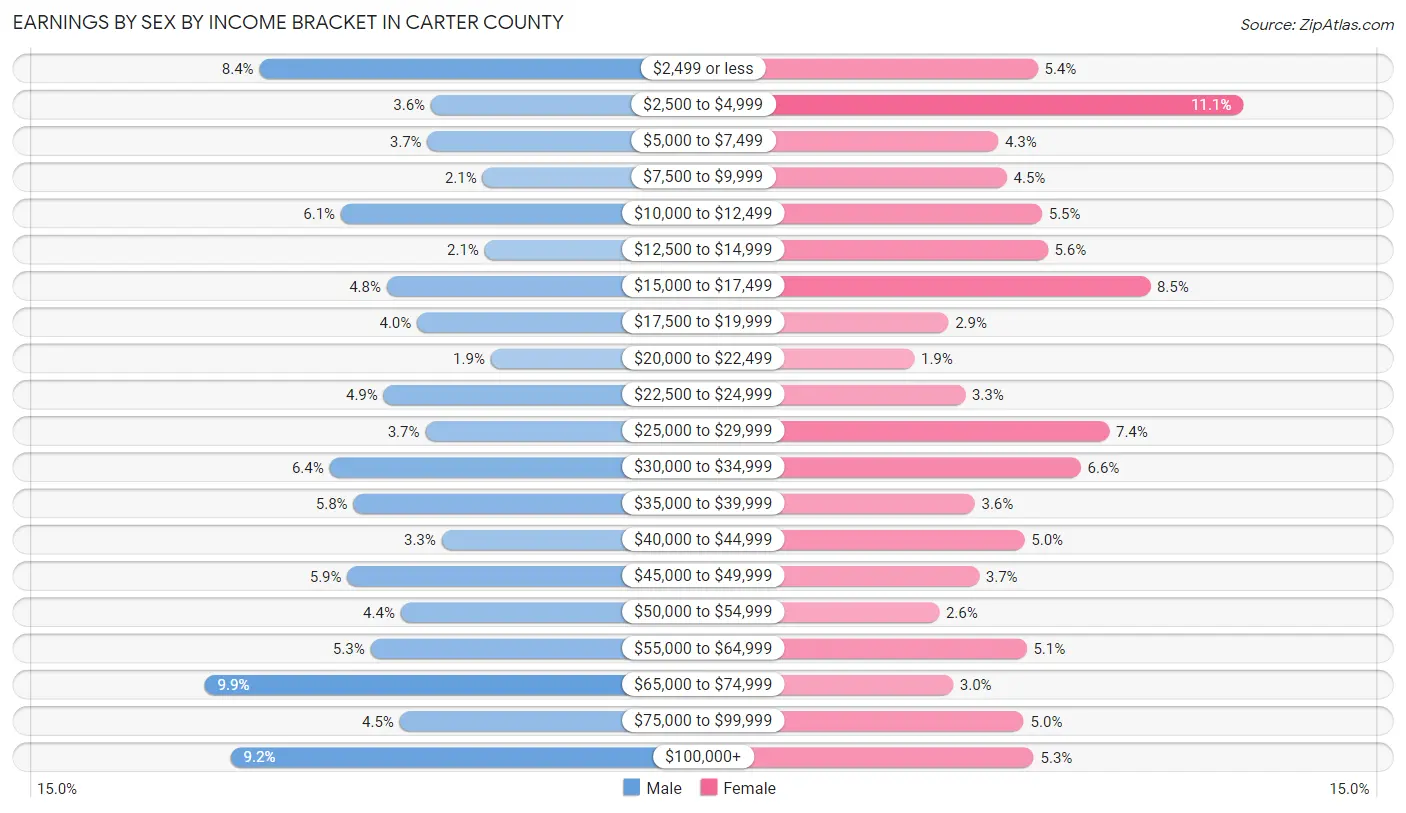
Earnings by Sex by Income Bracket in Carter County
The most common earnings brackets in Carter County are $65,000 to $74,999 for men (561 | 9.9%) and $2,500 to $4,999 for women (543 | 11.1%).
| Income | Male | Female |
| $2,499 or less | 474 (8.4%) | 261 (5.4%) |
| $2,500 to $4,999 | 202 (3.6%) | 543 (11.1%) |
| $5,000 to $7,499 | 208 (3.7%) | 207 (4.3%) |
| $7,500 to $9,999 | 120 (2.1%) | 219 (4.5%) |
| $10,000 to $12,499 | 345 (6.1%) | 267 (5.5%) |
| $12,500 to $14,999 | 117 (2.1%) | 275 (5.6%) |
| $15,000 to $17,499 | 272 (4.8%) | 415 (8.5%) |
| $17,500 to $19,999 | 224 (4.0%) | 139 (2.9%) |
| $20,000 to $22,499 | 107 (1.9%) | 92 (1.9%) |
| $22,500 to $24,999 | 277 (4.9%) | 162 (3.3%) |
| $25,000 to $29,999 | 211 (3.7%) | 359 (7.4%) |
| $30,000 to $34,999 | 363 (6.4%) | 320 (6.6%) |
| $35,000 to $39,999 | 325 (5.8%) | 175 (3.6%) |
| $40,000 to $44,999 | 185 (3.3%) | 243 (5.0%) |
| $45,000 to $49,999 | 335 (5.9%) | 181 (3.7%) |
| $50,000 to $54,999 | 250 (4.4%) | 126 (2.6%) |
| $55,000 to $64,999 | 298 (5.3%) | 246 (5.1%) |
| $65,000 to $74,999 | 561 (9.9%) | 145 (3.0%) |
| $75,000 to $99,999 | 252 (4.5%) | 242 (5.0%) |
| $100,000+ | 520 (9.2%) | 256 (5.2%) |
| Total | 5,646 (100.0%) | 4,873 (100.0%) |
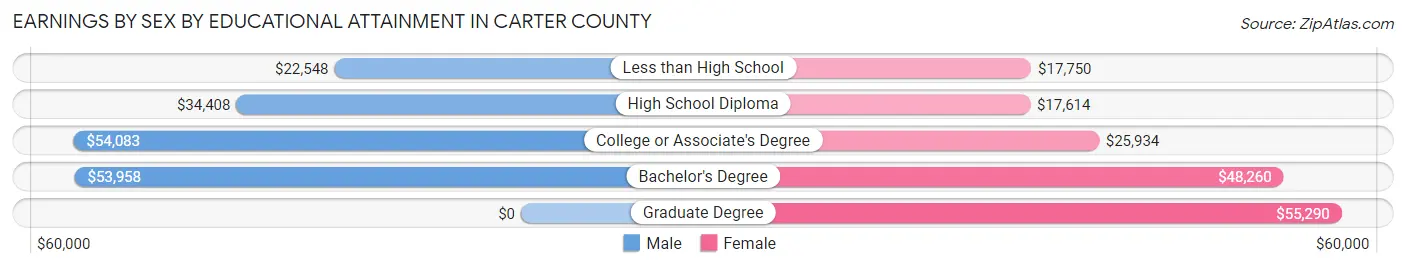
Earnings by Sex by Educational Attainment in Carter County
Average earnings in Carter County are $40,964 for men and $26,322 for women, a difference of 35.7%. Men with an educational attainment of college or associate's degree enjoy the highest average annual earnings of $54,083, while those with less than high school education earn the least with $22,548. Women with an educational attainment of graduate degree earn the most with the average annual earnings of $55,290, while those with high school diploma education have the smallest earnings of $17,614.
| Educational Attainment | Male Income | Female Income |
| Less than High School | $22,548 | $17,750 |
| High School Diploma | $34,408 | $17,614 |
| College or Associate's Degree | $54,083 | $25,934 |
| Bachelor's Degree | $53,958 | $48,260 |
| Graduate Degree | - | - |
| Total | $40,964 | $26,322 |
Family Income in Carter County
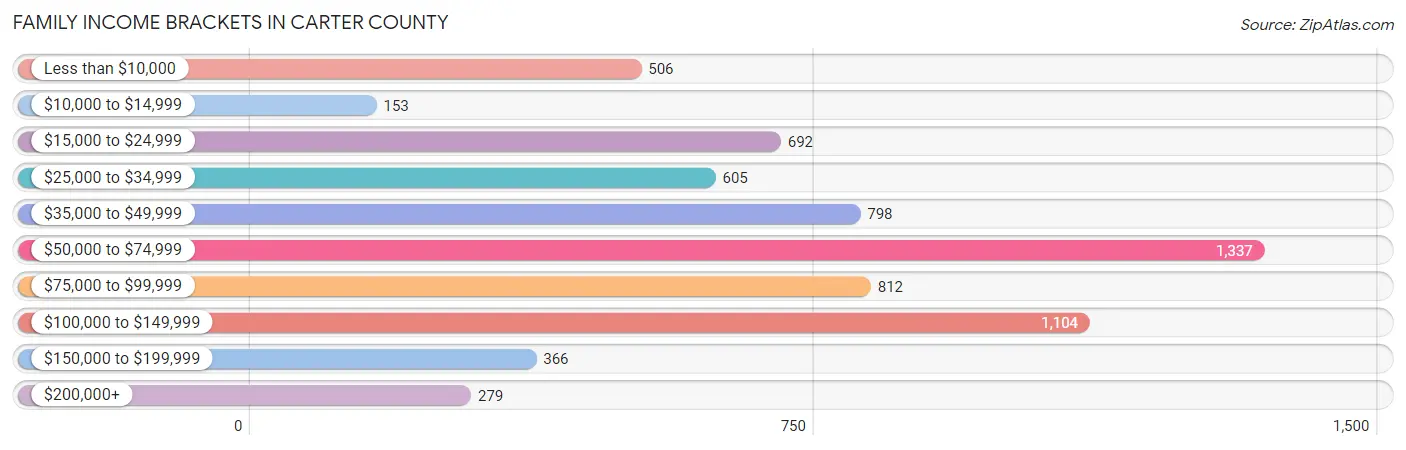
Family Income Brackets in Carter County
According to the Carter County family income data, there are 1,337 families falling into the $50,000 to $74,999 income range, which is the most common income bracket and makes up 20.1% of all families. Conversely, the $10,000 to $14,999 income bracket is the least frequent group with only 153 families (2.3%) belonging to this category.
| Income Bracket | # Families | % Families |
| Less than $10,000 | 506 | 7.6% |
| $10,000 to $14,999 | 153 | 2.3% |
| $15,000 to $24,999 | 692 | 10.4% |
| $25,000 to $34,999 | 605 | 9.1% |
| $35,000 to $49,999 | 798 | 12.0% |
| $50,000 to $74,999 | 1,337 | 20.1% |
| $75,000 to $99,999 | 812 | 12.2% |
| $100,000 to $149,999 | 1,104 | 16.6% |
| $150,000 to $199,999 | 366 | 5.5% |
| $200,000+ | 279 | 4.2% |
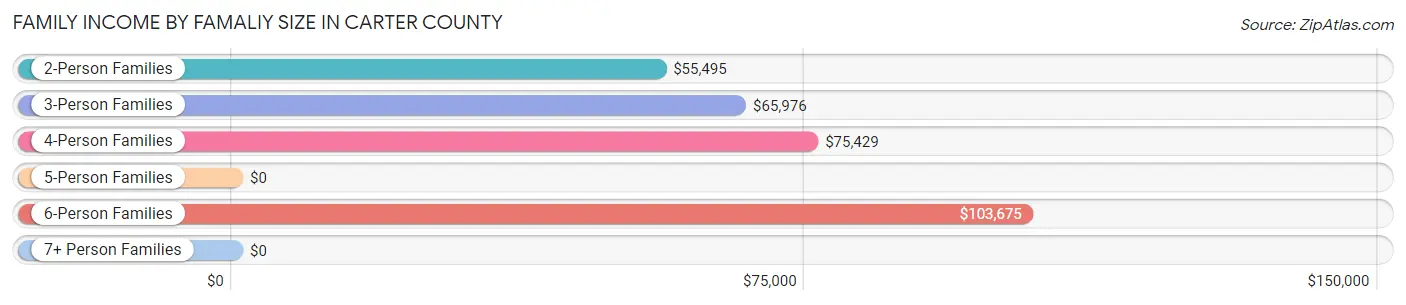
Family Income by Famaliy Size in Carter County
6-person families (141 | 2.1%) account for the highest median family income in Carter County with $103,675 per family, while 2-person families (3,238 | 48.7%) have the highest median income of $27,748 per family member.
| Income Bracket | # Families | Median Income |
| 2-Person Families | 3,238 (48.7%) | $55,495 |
| 3-Person Families | 1,686 (25.4%) | $65,976 |
| 4-Person Families | 848 (12.8%) | $75,429 |
| 5-Person Families | 555 (8.3%) | $0 |
| 6-Person Families | 141 (2.1%) | $103,675 |
| 7+ Person Families | 184 (2.8%) | $0 |
| Total | 6,652 (100.0%) | $60,536 |
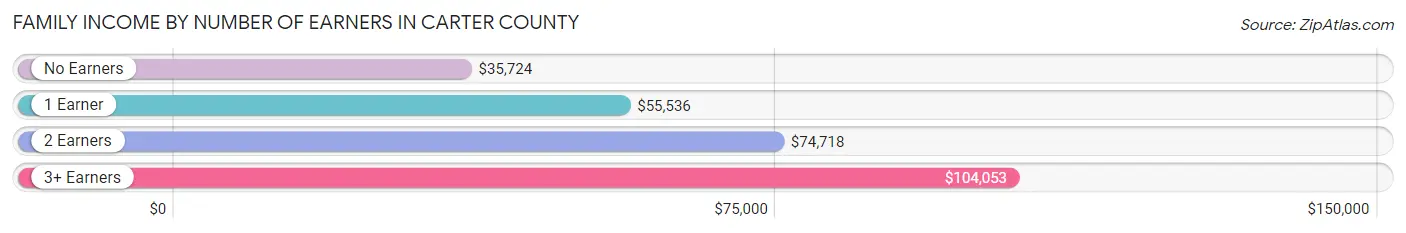
Family Income by Number of Earners in Carter County
The median family income in Carter County is $60,536, with families comprising 3+ earners (666) having the highest median family income of $104,053, while families with no earners (2,007) have the lowest median family income of $35,724, accounting for 10.0% and 30.2% of families, respectively.
| Number of Earners | # Families | Median Income |
| No Earners | 2,007 (30.2%) | $35,724 |
| 1 Earner | 2,168 (32.6%) | $55,536 |
| 2 Earners | 1,811 (27.2%) | $74,718 |
| 3+ Earners | 666 (10.0%) | $104,053 |
| Total | 6,652 (100.0%) | $60,536 |
Household Income in Carter County
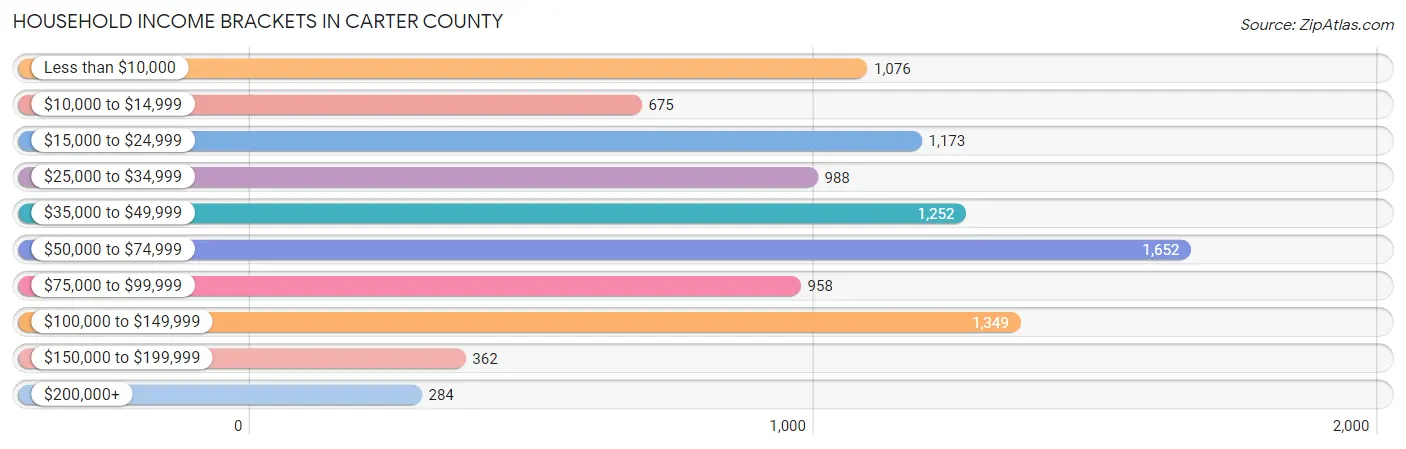
Household Income Brackets in Carter County
With 1,652 households falling in the category, the $50,000 to $74,999 income range is the most frequent in Carter County, accounting for 16.9% of all households. In contrast, only 284 households (2.9%) fall into the $200,000+ income bracket, making it the least populous group.
| Income Bracket | # Households | % Households |
| Less than $10,000 | 1,076 | 11.0% |
| $10,000 to $14,999 | 675 | 6.9% |
| $15,000 to $24,999 | 1,173 | 12.0% |
| $25,000 to $34,999 | 988 | 10.1% |
| $35,000 to $49,999 | 1,252 | 12.8% |
| $50,000 to $74,999 | 1,652 | 16.9% |
| $75,000 to $99,999 | 958 | 9.8% |
| $100,000 to $149,999 | 1,349 | 13.8% |
| $150,000 to $199,999 | 362 | 3.7% |
| $200,000+ | 284 | 2.9% |
Household Income by Householder Age in Carter County
The median household income in Carter County is $47,004, with the highest median household income of $57,536 found in the 25 to 44 years age bracket for the primary householder. A total of 2,570 households (26.3%) fall into this category. Meanwhile, the 65+ years age bracket for the primary householder has the lowest median household income of $36,934, with 3,150 households (32.2%) in this group.
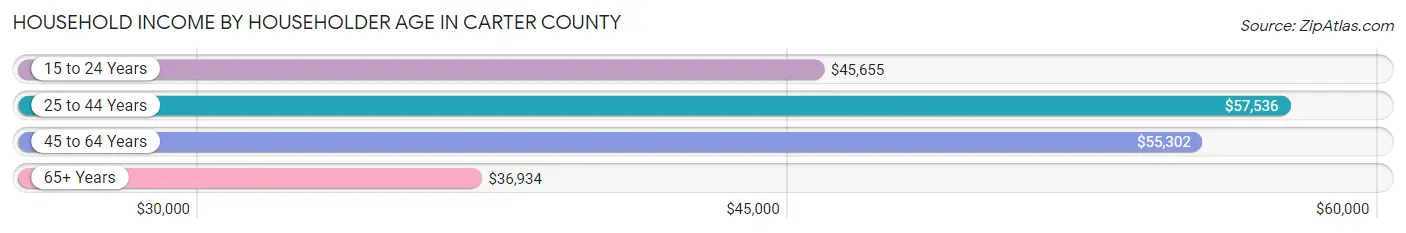
| Income Bracket | # Households | Median Income |
| 15 to 24 Years | 237 (2.4%) | $45,655 |
| 25 to 44 Years | 2,570 (26.3%) | $57,536 |
| 45 to 64 Years | 3,821 (39.1%) | $55,302 |
| 65+ Years | 3,150 (32.2%) | $36,934 |
| Total | 9,778 (100.0%) | $47,004 |
Poverty in Carter County
Income Below Poverty by Sex and Age in Carter County
With 22.0% poverty level for males and 25.8% for females among the residents of Carter County, 15 year old males and 15 year old females are the most vulnerable to poverty, with 112 males (50.9%) and 137 females (61.4%) in their respective age groups living below the poverty level.
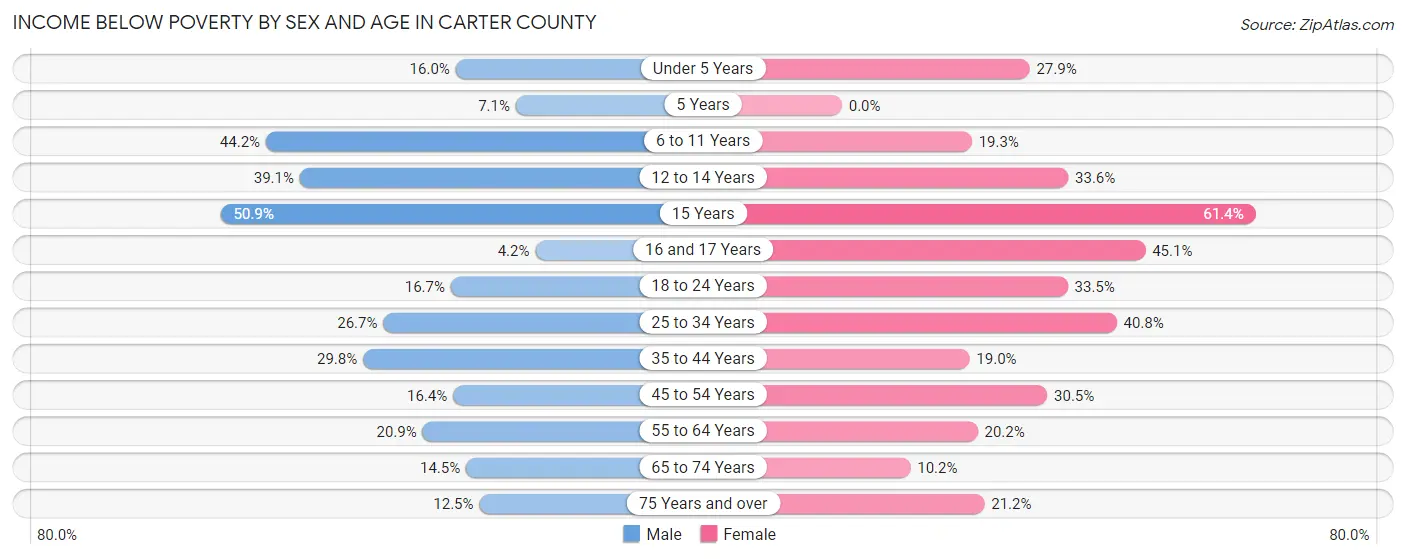
| Age Bracket | Male | Female |
| Under 5 Years | 129 (16.0%) | 204 (27.9%) |
| 5 Years | 12 (7.1%) | 0 (0.0%) |
| 6 to 11 Years | 364 (44.2%) | 196 (19.3%) |
| 12 to 14 Years | 236 (39.1%) | 164 (33.6%) |
| 15 Years | 112 (50.9%) | 137 (61.4%) |
| 16 and 17 Years | 20 (4.2%) | 105 (45.1%) |
| 18 to 24 Years | 176 (16.7%) | 343 (33.5%) |
| 25 to 34 Years | 376 (26.7%) | 610 (40.8%) |
| 35 to 44 Years | 437 (29.7%) | 278 (19.0%) |
| 45 to 54 Years | 290 (16.4%) | 551 (30.5%) |
| 55 to 64 Years | 367 (20.9%) | 356 (20.2%) |
| 65 to 74 Years | 218 (14.4%) | 161 (10.2%) |
| 75 Years and over | 109 (12.5%) | 244 (21.2%) |
| Total | 2,846 (22.0%) | 3,349 (25.8%) |
Income Above Poverty by Sex and Age in Carter County
According to the poverty statistics in Carter County, males aged 16 and 17 years and females aged 5 years are the age groups that are most secure financially, with 95.8% of males and 100.0% of females in these age groups living above the poverty line.

| Age Bracket | Male | Female |
| Under 5 Years | 678 (84.0%) | 528 (72.1%) |
| 5 Years | 158 (92.9%) | 14 (100.0%) |
| 6 to 11 Years | 460 (55.8%) | 820 (80.7%) |
| 12 to 14 Years | 367 (60.9%) | 324 (66.4%) |
| 15 Years | 108 (49.1%) | 86 (38.6%) |
| 16 and 17 Years | 461 (95.8%) | 128 (54.9%) |
| 18 to 24 Years | 877 (83.3%) | 680 (66.5%) |
| 25 to 34 Years | 1,030 (73.3%) | 885 (59.2%) |
| 35 to 44 Years | 1,032 (70.3%) | 1,189 (81.0%) |
| 45 to 54 Years | 1,480 (83.6%) | 1,256 (69.5%) |
| 55 to 64 Years | 1,388 (79.1%) | 1,410 (79.8%) |
| 65 to 74 Years | 1,291 (85.6%) | 1,422 (89.8%) |
| 75 Years and over | 765 (87.5%) | 909 (78.8%) |
| Total | 10,095 (78.0%) | 9,651 (74.2%) |
Income Below Poverty Among Married-Couple Families in Carter County
The poverty statistics for married-couple families in Carter County show that 14.0% or 743 of the total 5,325 families live below the poverty line. Families with 3 or 4 children have the highest poverty rate of 39.4%, comprising of 146 families. On the other hand, families with 5 or more children have the lowest poverty rate of 1.0%, which includes 1 families.
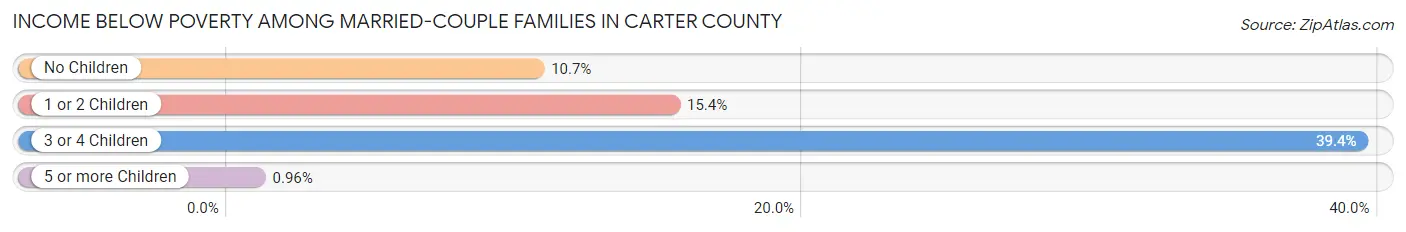
| Children | Above Poverty | Below Poverty |
| No Children | 2,841 (89.3%) | 339 (10.7%) |
| 1 or 2 Children | 1,413 (84.6%) | 257 (15.4%) |
| 3 or 4 Children | 225 (60.7%) | 146 (39.4%) |
| 5 or more Children | 103 (99.0%) | 1 (1.0%) |
| Total | 4,582 (86.1%) | 743 (14.0%) |
Income Below Poverty Among Single-Parent Households in Carter County
According to the poverty data in Carter County, 42.1% or 157 single-father households and 37.2% or 355 single-mother households are living below the poverty line. Among single-father households, those with 3 or 4 children have the highest poverty rate, with 41 households (83.7%) experiencing poverty. Likewise, among single-mother households, those with 3 or 4 children have the highest poverty rate, with 48 households (100.0%) falling below the poverty line.
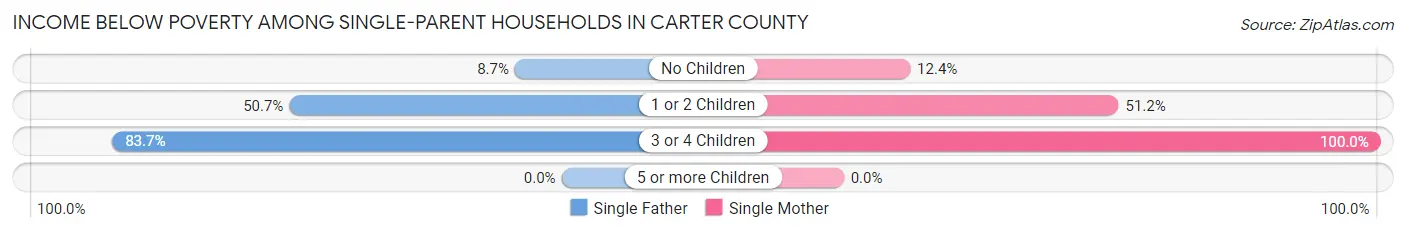
| Children | Single Father | Single Mother |
| No Children | 10 (8.7%) | 50 (12.4%) |
| 1 or 2 Children | 106 (50.7%) | 257 (51.2%) |
| 3 or 4 Children | 41 (83.7%) | 48 (100.0%) |
| 5 or more Children | 0 (0.0%) | 0 (0.0%) |
| Total | 157 (42.1%) | 355 (37.2%) |
Income Below Poverty Among Married-Couple vs Single-Parent Households in Carter County
The poverty data for Carter County shows that 743 of the married-couple family households (14.0%) and 512 of the single-parent households (38.6%) are living below the poverty level. Within the married-couple family households, those with 3 or 4 children have the highest poverty rate, with 146 households (39.4%) falling below the poverty line. Among the single-parent households, those with 3 or 4 children have the highest poverty rate, with 89 household (91.7%) living below poverty.
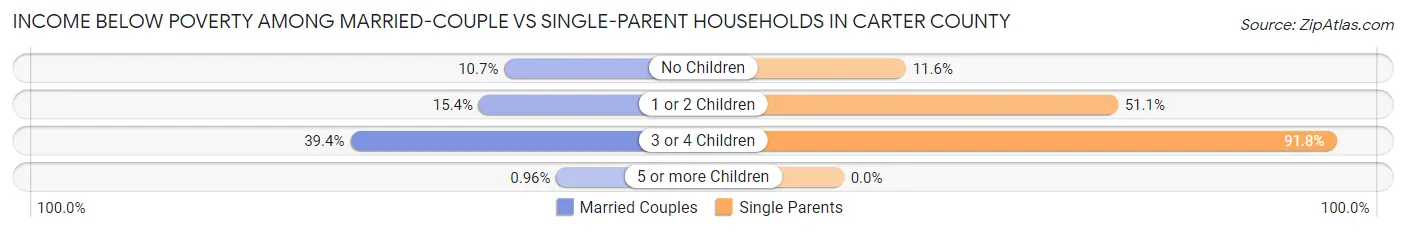
| Children | Married-Couple Families | Single-Parent Households |
| No Children | 339 (10.7%) | 60 (11.6%) |
| 1 or 2 Children | 257 (15.4%) | 363 (51.0%) |
| 3 or 4 Children | 146 (39.4%) | 89 (91.7%) |
| 5 or more Children | 1 (1.0%) | 0 (0.0%) |
| Total | 743 (14.0%) | 512 (38.6%) |
Race in Carter County
The most populous races in Carter County are White / Caucasian (25,518 | 95.7%), Two or more Races (941 | 3.5%), and Hispanic or Latino (265 | 1.0%).
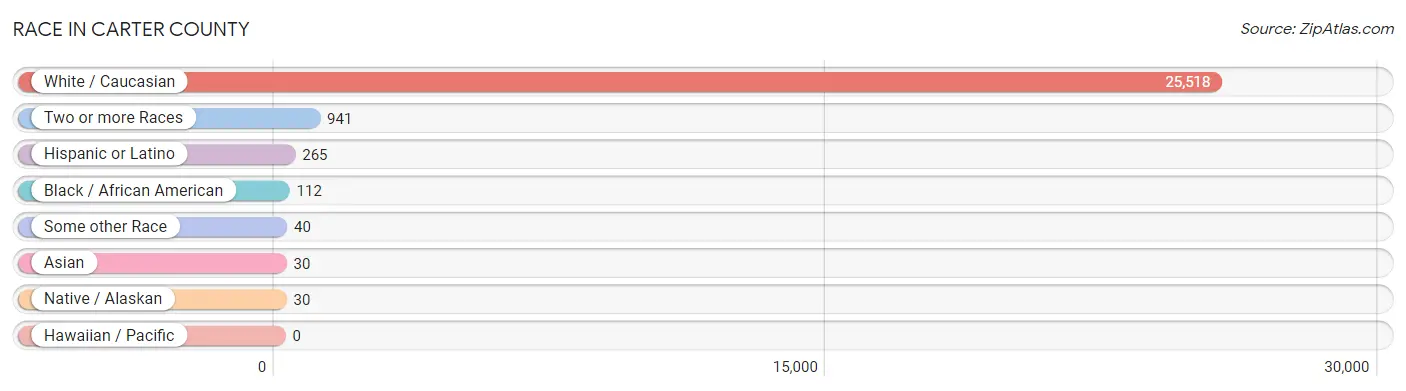
| Race | # Population | % Population |
| Asian | 30 | 0.1% |
| Black / African American | 112 | 0.4% |
| Hawaiian / Pacific | 0 | 0.0% |
| Hispanic or Latino | 265 | 1.0% |
| Native / Alaskan | 30 | 0.1% |
| White / Caucasian | 25,518 | 95.7% |
| Two or more Races | 941 | 3.5% |
| Some other Race | 40 | 0.2% |
| Total | 26,671 | 100.0% |
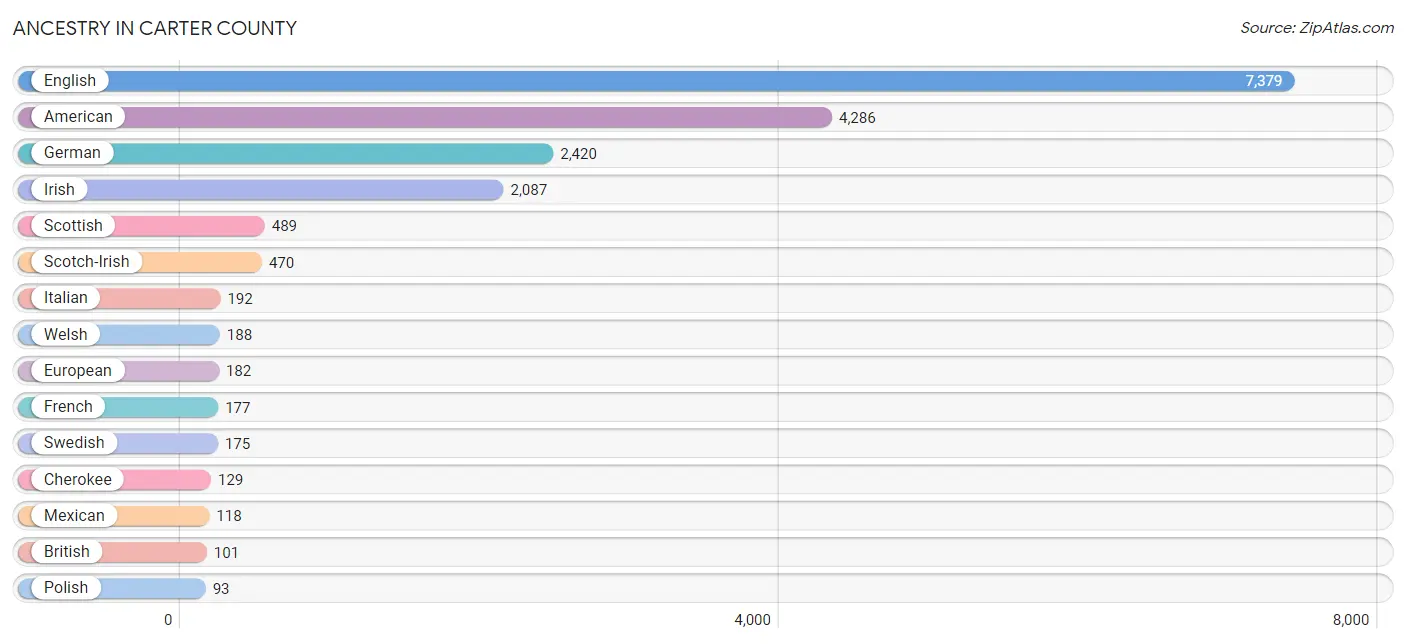
Ancestry in Carter County
The most populous ancestries reported in Carter County are English (7,379 | 27.7%), American (4,286 | 16.1%), German (2,420 | 9.1%), Irish (2,087 | 7.8%), and Scottish (489 | 1.8%), together accounting for 62.5% of all Carter County residents.
| Ancestry | # Population | % Population |
| African | 5 | 0.0% |
| American | 4,286 | 16.1% |
| Arab | 4 | 0.0% |
| Bahamian | 3 | 0.0% |
| Blackfeet | 3 | 0.0% |
| British | 101 | 0.4% |
| Burmese | 91 | 0.3% |
| Canadian | 23 | 0.1% |
| Cherokee | 129 | 0.5% |
| Czechoslovakian | 30 | 0.1% |
| Danish | 10 | 0.0% |
| Dutch | 62 | 0.2% |
| English | 7,379 | 27.7% |
| European | 182 | 0.7% |
| French | 177 | 0.7% |
| French Canadian | 48 | 0.2% |
| German | 2,420 | 9.1% |
| Haitian | 16 | 0.1% |
| Hungarian | 43 | 0.2% |
| Irish | 2,087 | 7.8% |
| Israeli | 6 | 0.0% |
| Italian | 192 | 0.7% |
| Mexican | 118 | 0.4% |
| Native Hawaiian | 15 | 0.1% |
| Northern European | 19 | 0.1% |
| Norwegian | 82 | 0.3% |
| Polish | 93 | 0.4% |
| Portuguese | 55 | 0.2% |
| Puerto Rican | 27 | 0.1% |
| Romanian | 4 | 0.0% |
| Scandinavian | 15 | 0.1% |
| Scotch-Irish | 470 | 1.8% |
| Scottish | 489 | 1.8% |
| Subsaharan African | 5 | 0.0% |
| Swedish | 175 | 0.7% |
| Swiss | 46 | 0.2% |
| Ukrainian | 65 | 0.2% |
| Welsh | 188 | 0.7% | View All 38 Rows |
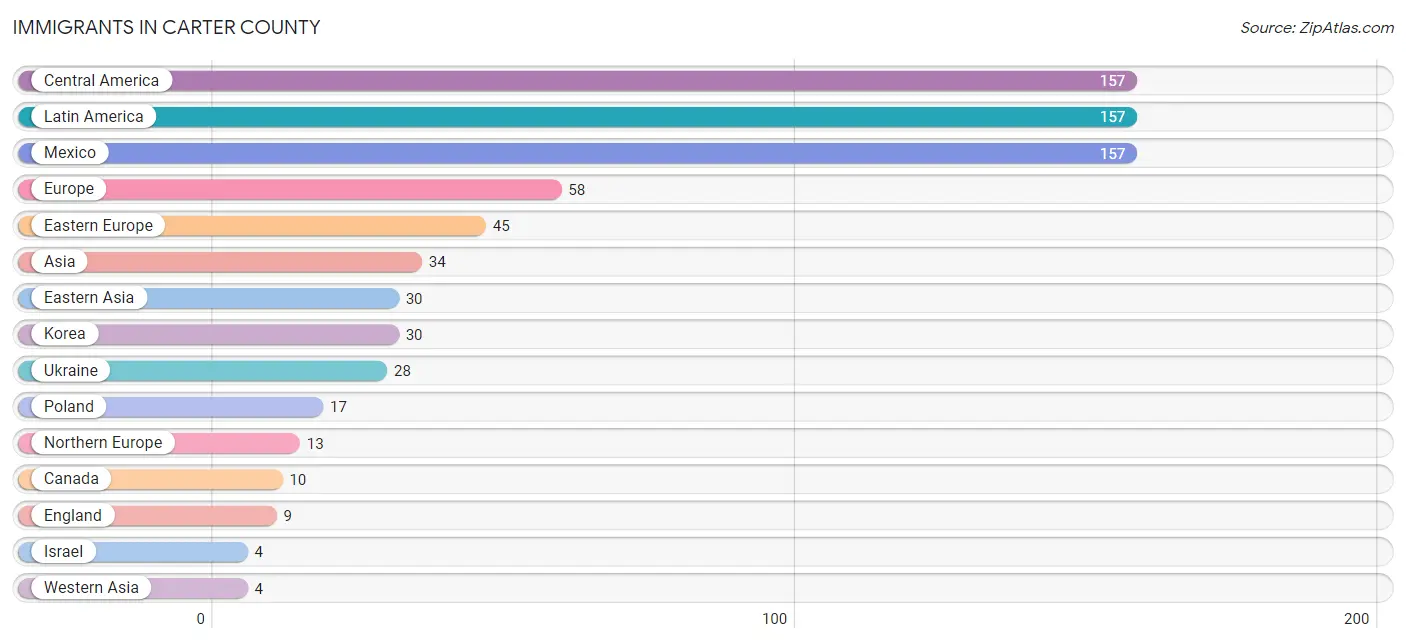
Immigrants in Carter County
The most numerous immigrant groups reported in Carter County came from Central America (157 | 0.6%), Latin America (157 | 0.6%), Mexico (157 | 0.6%), Europe (58 | 0.2%), and Eastern Europe (45 | 0.2%), together accounting for 2.2% of all Carter County residents.
| Immigration Origin | # Population | % Population |
| Asia | 34 | 0.1% |
| Canada | 10 | 0.0% |
| Central America | 157 | 0.6% |
| Eastern Asia | 30 | 0.1% |
| Eastern Europe | 45 | 0.2% |
| England | 9 | 0.0% |
| Europe | 58 | 0.2% |
| Israel | 4 | 0.0% |
| Korea | 30 | 0.1% |
| Latin America | 157 | 0.6% |
| Mexico | 157 | 0.6% |
| Northern Europe | 13 | 0.1% |
| Poland | 17 | 0.1% |
| Ukraine | 28 | 0.1% |
| Western Asia | 4 | 0.0% | View All 15 Rows |
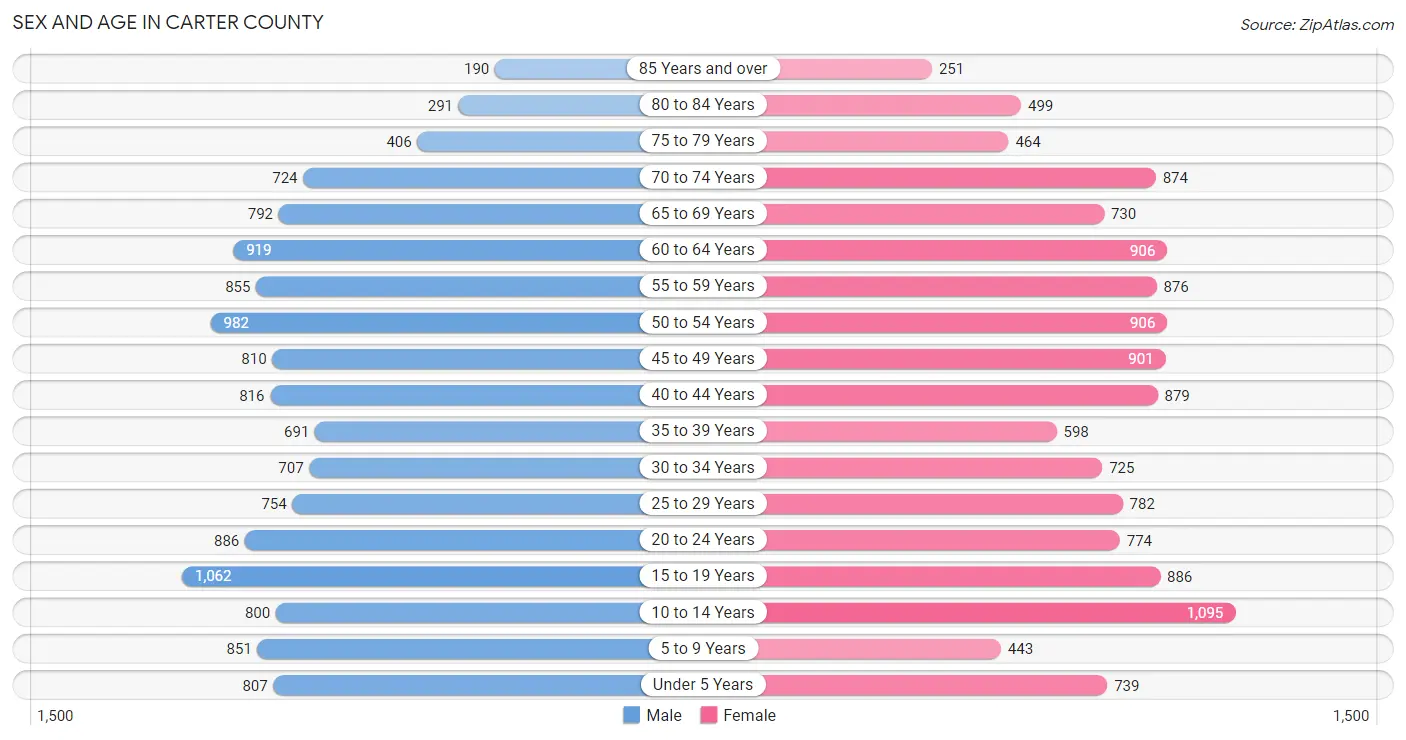
Sex and Age in Carter County
Sex and Age in Carter County
The most populous age groups in Carter County are 15 to 19 Years (1,062 | 8.0%) for men and 10 to 14 Years (1,095 | 8.2%) for women.
| Age Bracket | Male | Female |
| Under 5 Years | 807 (6.0%) | 739 (5.5%) |
| 5 to 9 Years | 851 (6.4%) | 443 (3.3%) |
| 10 to 14 Years | 800 (6.0%) | 1,095 (8.2%) |
| 15 to 19 Years | 1,062 (8.0%) | 886 (6.7%) |
| 20 to 24 Years | 886 (6.6%) | 774 (5.8%) |
| 25 to 29 Years | 754 (5.7%) | 782 (5.9%) |
| 30 to 34 Years | 707 (5.3%) | 725 (5.4%) |
| 35 to 39 Years | 691 (5.2%) | 598 (4.5%) |
| 40 to 44 Years | 816 (6.1%) | 879 (6.6%) |
| 45 to 49 Years | 810 (6.1%) | 901 (6.8%) |
| 50 to 54 Years | 982 (7.4%) | 906 (6.8%) |
| 55 to 59 Years | 855 (6.4%) | 876 (6.6%) |
| 60 to 64 Years | 919 (6.9%) | 906 (6.8%) |
| 65 to 69 Years | 792 (5.9%) | 730 (5.5%) |
| 70 to 74 Years | 724 (5.4%) | 874 (6.6%) |
| 75 to 79 Years | 406 (3.0%) | 464 (3.5%) |
| 80 to 84 Years | 291 (2.2%) | 499 (3.7%) |
| 85 Years and over | 190 (1.4%) | 251 (1.9%) |
| Total | 13,343 (100.0%) | 13,328 (100.0%) |
Families and Households in Carter County
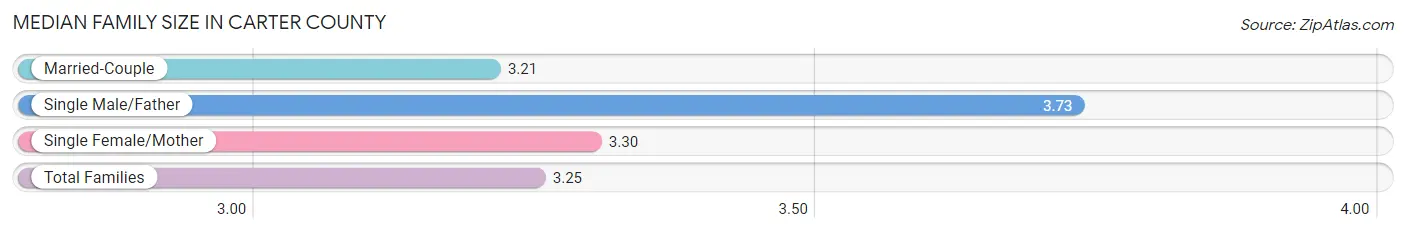
Median Family Size in Carter County
The median family size in Carter County is 3.25 persons per family, with single male/father families (373 | 5.6%) accounting for the largest median family size of 3.73 persons per family. On the other hand, married-couple families (5,325 | 80.0%) represent the smallest median family size with 3.21 persons per family.
| Family Type | # Families | Family Size |
| Married-Couple | 5,325 (80.0%) | 3.21 |
| Single Male/Father | 373 (5.6%) | 3.73 |
| Single Female/Mother | 954 (14.3%) | 3.30 |
| Total Families | 6,652 (100.0%) | 3.25 |
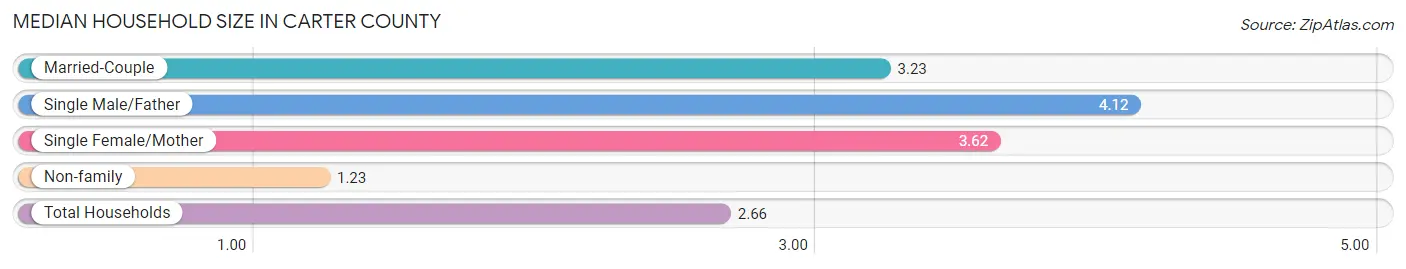
Median Household Size in Carter County
The median household size in Carter County is 2.66 persons per household, with single male/father households (373 | 3.8%) accounting for the largest median household size of 4.12 persons per household. non-family households (3,126 | 32.0%) represent the smallest median household size with 1.23 persons per household.
| Household Type | # Households | Household Size |
| Married-Couple | 5,325 (54.5%) | 3.23 |
| Single Male/Father | 373 (3.8%) | 4.12 |
| Single Female/Mother | 954 (9.8%) | 3.62 |
| Non-family | 3,126 (32.0%) | 1.23 |
| Total Households | 9,778 (100.0%) | 2.66 |
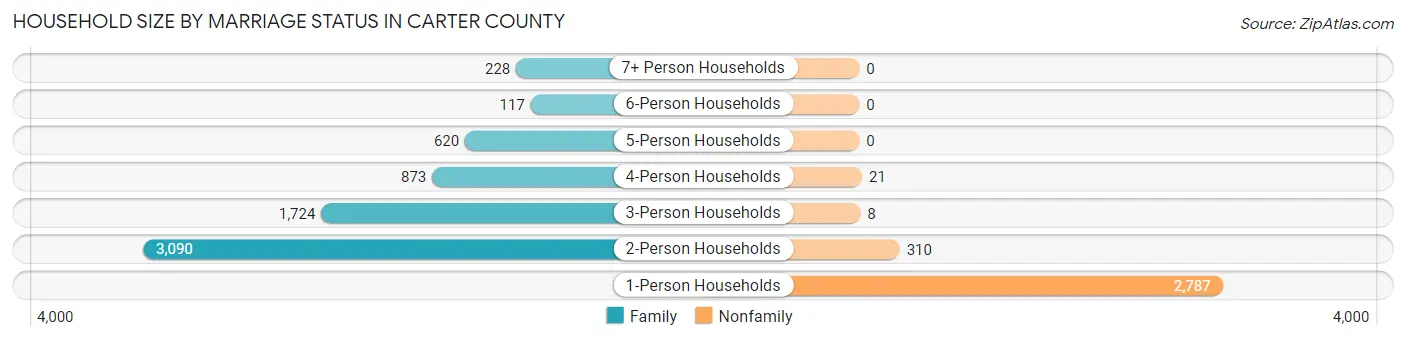
Household Size by Marriage Status in Carter County
Out of a total of 9,778 households in Carter County, 6,652 (68.0%) are family households, while 3,126 (32.0%) are nonfamily households. The most numerous type of family households are 2-person households, comprising 3,090, and the most common type of nonfamily households are 1-person households, comprising 2,787.
| Household Size | Family Households | Nonfamily Households |
| 1-Person Households | - | 2,787 (28.5%) |
| 2-Person Households | 3,090 (31.6%) | 310 (3.2%) |
| 3-Person Households | 1,724 (17.6%) | 8 (0.1%) |
| 4-Person Households | 873 (8.9%) | 21 (0.2%) |
| 5-Person Households | 620 (6.3%) | 0 (0.0%) |
| 6-Person Households | 117 (1.2%) | 0 (0.0%) |
| 7+ Person Households | 228 (2.3%) | 0 (0.0%) |
| Total | 6,652 (68.0%) | 3,126 (32.0%) |
Female Fertility in Carter County
Fertility by Age in Carter County
Average fertility rate in Carter County is 45.0 births per 1,000 women. Women in the age bracket of 20 to 34 years have the highest fertility rate with 109.0 births per 1,000 women. Women in the age bracket of 20 to 34 years acount for 95.4% of all women with births.
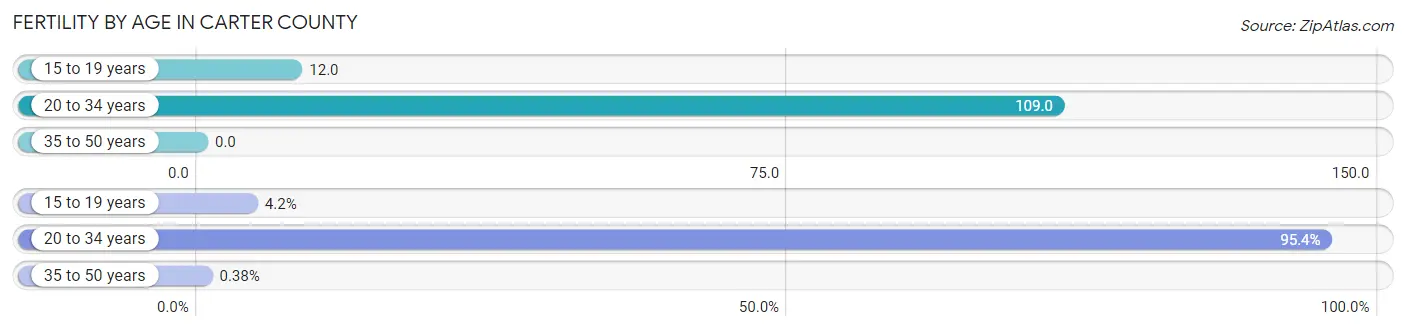
| Age Bracket | Women with Births | Births / 1,000 Women |
| 15 to 19 years | 11 (4.2%) | 12.0 |
| 20 to 34 years | 248 (95.4%) | 109.0 |
| 35 to 50 years | 1 (0.4%) | 0.0 |
| Total | 260 (100.0%) | 45.0 |
Fertility by Age by Marriage Status in Carter County
84.6% of women with births (260) in Carter County are married. The highest percentage of unmarried women with births falls into 20 to 34 years age bracket with 16.1% of them unmarried at the time of birth, while the lowest percentage of unmarried women with births belong to 15 to 19 years age bracket with 0.0% of them unmarried.
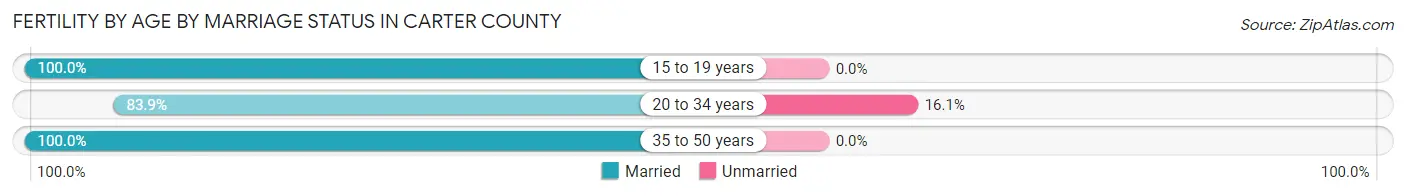
| Age Bracket | Married | Unmarried |
| 15 to 19 years | 11 (100.0%) | 0 (0.0%) |
| 20 to 34 years | 208 (83.9%) | 40 (16.1%) |
| 35 to 50 years | 1 (100.0%) | 0 (0.0%) |
| Total | 220 (84.6%) | 40 (15.4%) |
Fertility by Education in Carter County
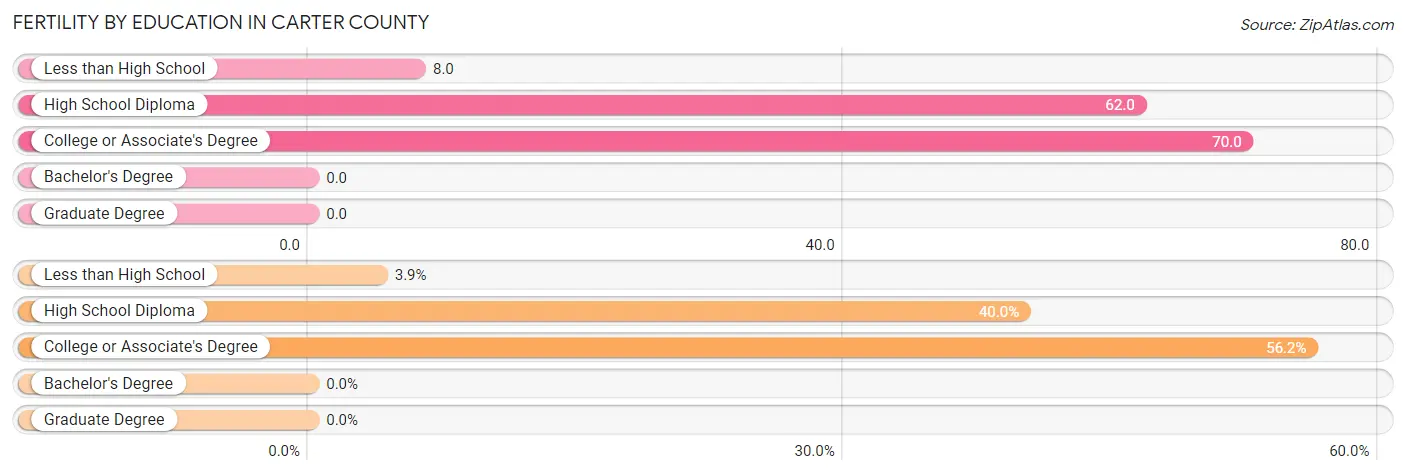
| Educational Attainment | Women with Births | Births / 1,000 Women |
| Less than High School | 10 (3.8%) | 8.0 |
| High School Diploma | 104 (40.0%) | 62.0 |
| College or Associate's Degree | 146 (56.1%) | 70.0 |
| Bachelor's Degree | 0 (0.0%) | 0.0 |
| Graduate Degree | 0 (0.0%) | 0.0 |
| Total | 260 (100.0%) | 45.0 |
Fertility by Education by Marriage Status in Carter County
15.4% of women with births in Carter County are unmarried. Women with the educational attainment of high school diploma are most likely to be married with 89.4% of them married at childbirth, while women with the educational attainment of less than high school are least likely to be married with 100.0% of them unmarried at childbirth.
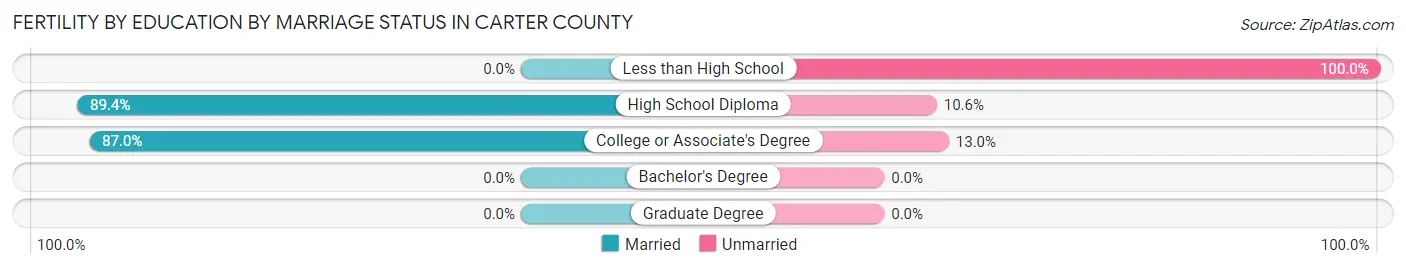
| Educational Attainment | Married | Unmarried |
| Less than High School | 0 (0.0%) | 10 (100.0%) |
| High School Diploma | 93 (89.4%) | 11 (10.6%) |
| College or Associate's Degree | 127 (87.0%) | 19 (13.0%) |
| Bachelor's Degree | 0 (0.0%) | 0 (0.0%) |
| Graduate Degree | 0 (0.0%) | 0 (0.0%) |
| Total | 220 (84.6%) | 40 (15.4%) |
Employment Characteristics in Carter County
Employment by Class of Employer in Carter County
Among the 8,799 employed individuals in Carter County, private company employees (5,723 | 65.0%), not-for-profit organizations (899 | 10.2%), and local government employees (768 | 8.7%) make up the most common classes of employment.
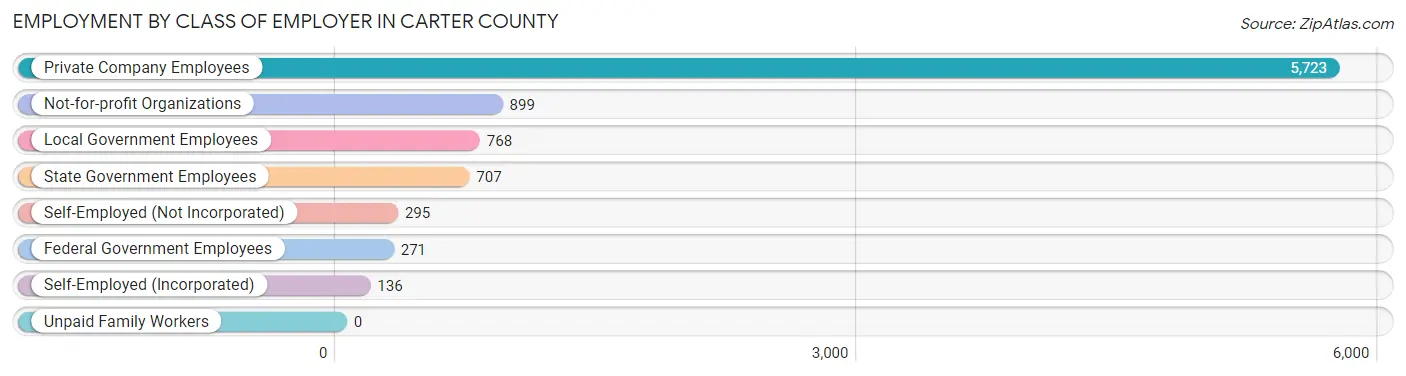
| Employer Class | # Employees | % Employees |
| Private Company Employees | 5,723 | 65.0% |
| Self-Employed (Incorporated) | 136 | 1.5% |
| Self-Employed (Not Incorporated) | 295 | 3.4% |
| Not-for-profit Organizations | 899 | 10.2% |
| Local Government Employees | 768 | 8.7% |
| State Government Employees | 707 | 8.0% |
| Federal Government Employees | 271 | 3.1% |
| Unpaid Family Workers | 0 | 0.0% |
| Total | 8,799 | 100.0% |
Employment Status by Age in Carter County
According to the labor force statistics for Carter County, out of the total population over 16 years of age (21,493), 45.4% or 9,758 individuals are in the labor force, with 6.0% or 585 of them unemployed. The age group with the highest labor force participation rate is 25 to 29 years, with 76.4% or 1,174 individuals in the labor force. Within the labor force, the 16 to 19 years age range has the highest percentage of unemployed individuals, with 20.9% or 80 of them being unemployed.
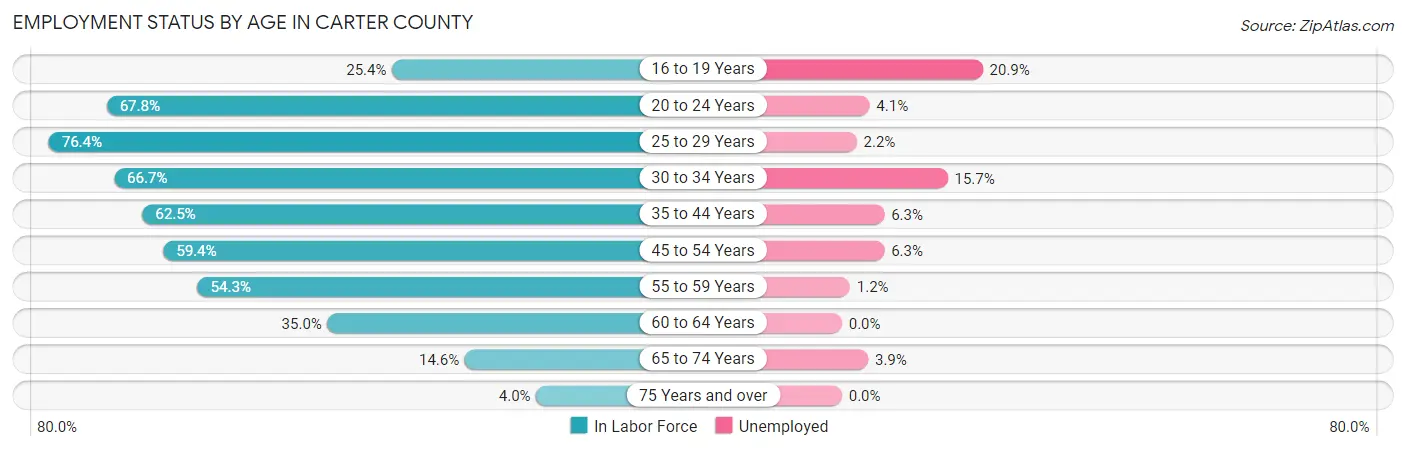
| Age Bracket | In Labor Force | Unemployed |
| 16 to 19 Years | 382 (25.4%) | 80 (20.9%) |
| 20 to 24 Years | 1,125 (67.8%) | 46 (4.1%) |
| 25 to 29 Years | 1,174 (76.4%) | 26 (2.2%) |
| 30 to 34 Years | 955 (66.7%) | 150 (15.7%) |
| 35 to 44 Years | 1,865 (62.5%) | 117 (6.3%) |
| 45 to 54 Years | 2,138 (59.4%) | 135 (6.3%) |
| 55 to 59 Years | 940 (54.3%) | 11 (1.2%) |
| 60 to 64 Years | 639 (35.0%) | 0 (0.0%) |
| 65 to 74 Years | 456 (14.6%) | 18 (3.9%) |
| 75 Years and over | 84 (4.0%) | 0 (0.0%) |
| Total | 9,758 (45.4%) | 585 (6.0%) |
Employment Status by Educational Attainment in Carter County
According to labor force statistics for Carter County, 58.8% of individuals (7,707) out of the total population between 25 and 64 years of age (13,107) are in the labor force, with 5.7% or 439 of them being unemployed. The group with the highest labor force participation rate are those with the educational attainment of bachelor's degree or higher, with 79.3% or 1,546 individuals in the labor force. Within the labor force, individuals with high school diploma education have the highest percentage of unemployment, with 7.3% or 216 of them being unemployed.
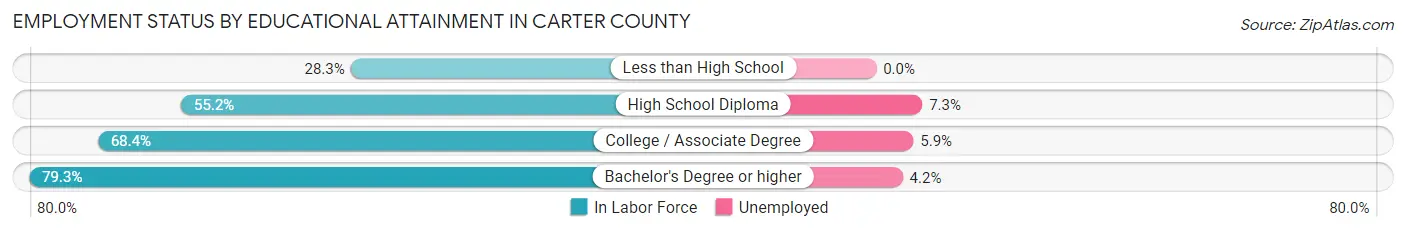
| Educational Attainment | In Labor Force | Unemployed |
| Less than High School | 535 (28.3%) | 0 (0.0%) |
| High School Diploma | 2,959 (55.2%) | 391 (7.3%) |
| College / Associate Degree | 2,670 (68.4%) | 230 (5.9%) |
| Bachelor's Degree or higher | 1,546 (79.3%) | 82 (4.2%) |
| Total | 7,707 (58.8%) | 747 (5.7%) |
Employment Occupations by Sex in Carter County
Management, Business, Science and Arts Occupations
The most common Management, Business, Science and Arts occupations in Carter County are Community & Social Service (902 | 9.8%), Health Diagnosing & Treating (767 | 8.4%), Management (665 | 7.2%), Health Technologists (614 | 6.7%), and Education Instruction & Library (606 | 6.6%).
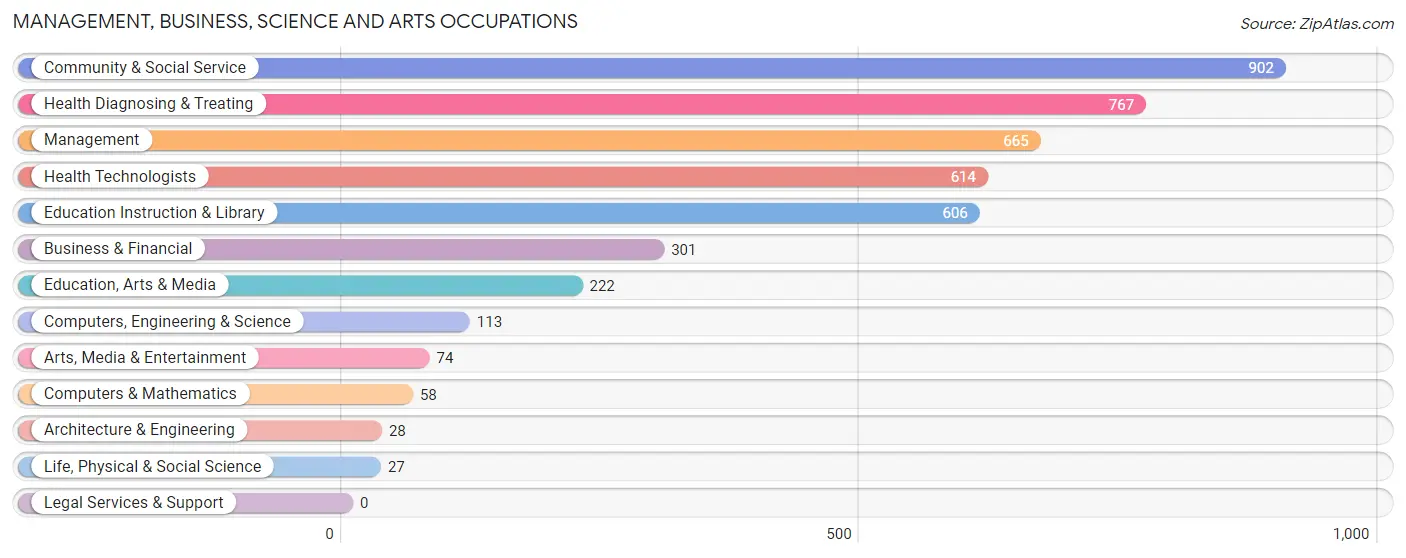
Management, Business, Science and Arts Occupations by Sex
Within the Management, Business, Science and Arts occupations in Carter County, the most male-oriented occupations are Architecture & Engineering (100.0%), Life, Physical & Social Science (100.0%), and Computers, Engineering & Science (92.0%), while the most female-oriented occupations are Education Instruction & Library (86.0%), Health Technologists (84.0%), and Community & Social Service (80.6%).
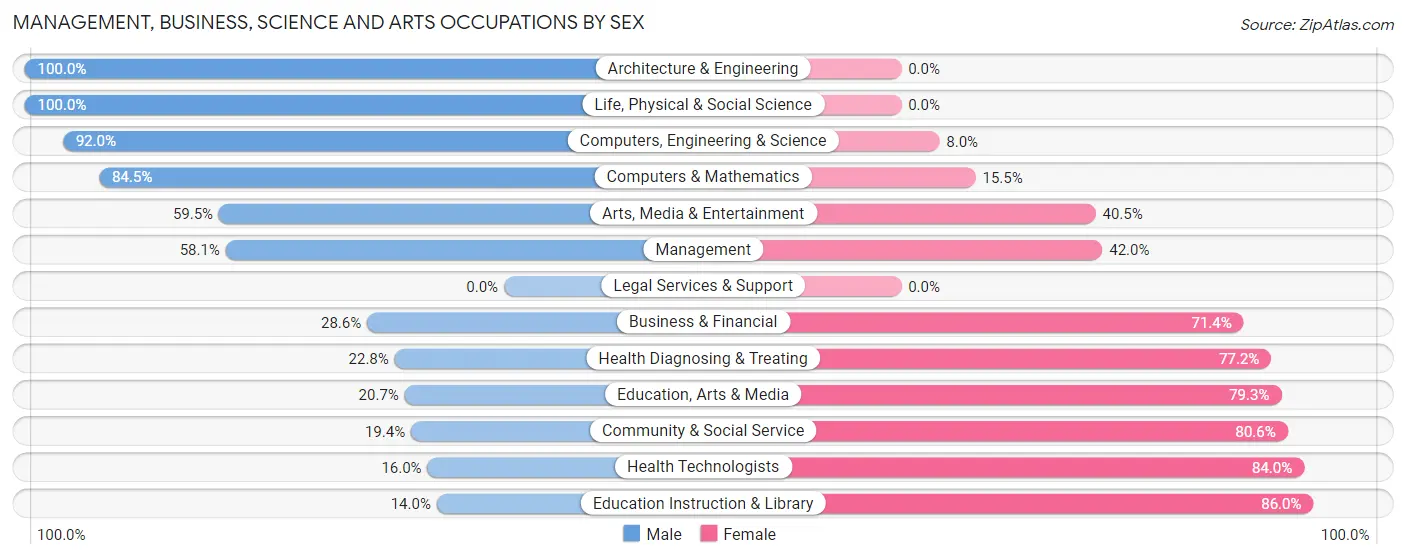
| Occupation | Male | Female |
| Management | 386 (58.1%) | 279 (41.9%) |
| Business & Financial | 86 (28.6%) | 215 (71.4%) |
| Computers, Engineering & Science | 104 (92.0%) | 9 (8.0%) |
| Computers & Mathematics | 49 (84.5%) | 9 (15.5%) |
| Architecture & Engineering | 28 (100.0%) | 0 (0.0%) |
| Life, Physical & Social Science | 27 (100.0%) | 0 (0.0%) |
| Community & Social Service | 175 (19.4%) | 727 (80.6%) |
| Education, Arts & Media | 46 (20.7%) | 176 (79.3%) |
| Legal Services & Support | 0 (0.0%) | 0 (0.0%) |
| Education Instruction & Library | 85 (14.0%) | 521 (86.0%) |
| Arts, Media & Entertainment | 44 (59.5%) | 30 (40.5%) |
| Health Diagnosing & Treating | 175 (22.8%) | 592 (77.2%) |
| Health Technologists | 98 (16.0%) | 516 (84.0%) |
| Total (Category) | 926 (33.7%) | 1,822 (66.3%) |
| Total (Overall) | 4,864 (53.0%) | 4,313 (47.0%) |
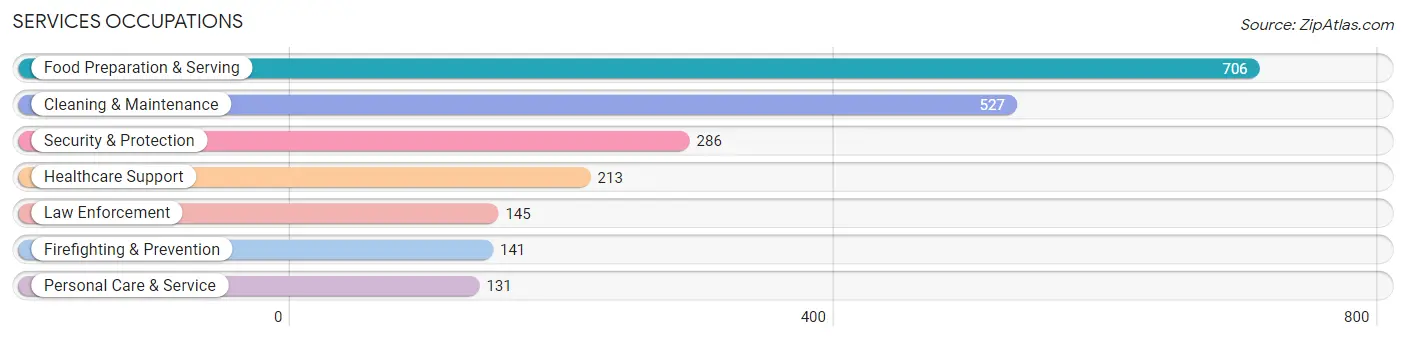
Services Occupations
The most common Services occupations in Carter County are Food Preparation & Serving (706 | 7.7%), Cleaning & Maintenance (527 | 5.7%), Security & Protection (286 | 3.1%), Healthcare Support (213 | 2.3%), and Law Enforcement (145 | 1.6%).
Services Occupations by Sex
Within the Services occupations in Carter County, the most male-oriented occupations are Law Enforcement (94.5%), Security & Protection (85.0%), and Firefighting & Prevention (75.2%), while the most female-oriented occupations are Healthcare Support (95.8%), Personal Care & Service (74.1%), and Food Preparation & Serving (70.4%).
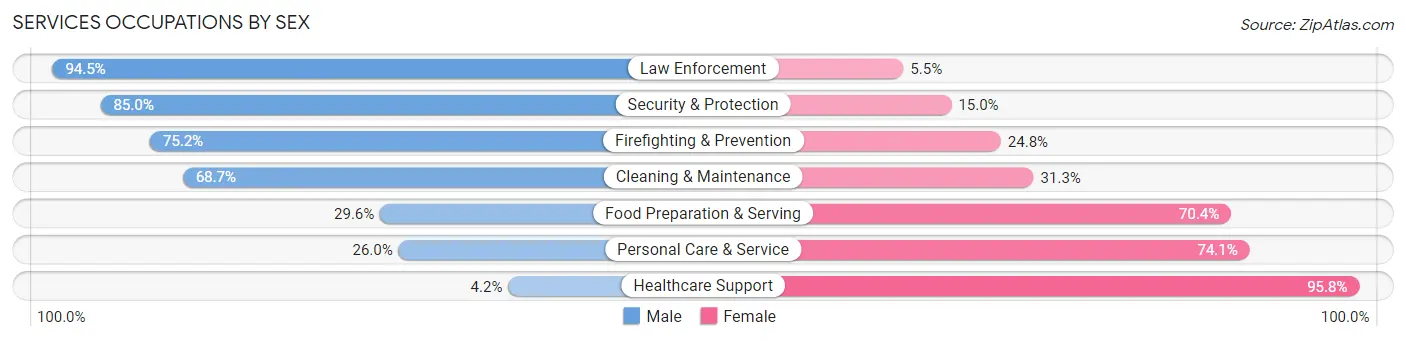
| Occupation | Male | Female |
| Healthcare Support | 9 (4.2%) | 204 (95.8%) |
| Security & Protection | 243 (85.0%) | 43 (15.0%) |
| Firefighting & Prevention | 106 (75.2%) | 35 (24.8%) |
| Law Enforcement | 137 (94.5%) | 8 (5.5%) |
| Food Preparation & Serving | 209 (29.6%) | 497 (70.4%) |
| Cleaning & Maintenance | 362 (68.7%) | 165 (31.3%) |
| Personal Care & Service | 34 (26.0%) | 97 (74.1%) |
| Total (Category) | 857 (46.0%) | 1,006 (54.0%) |
| Total (Overall) | 4,864 (53.0%) | 4,313 (47.0%) |
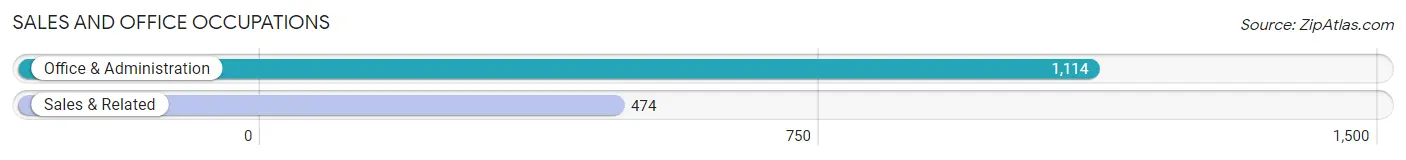
Sales and Office Occupations
The most common Sales and Office occupations in Carter County are Office & Administration (1,114 | 12.1%), and Sales & Related (474 | 5.2%).
Sales and Office Occupations by Sex
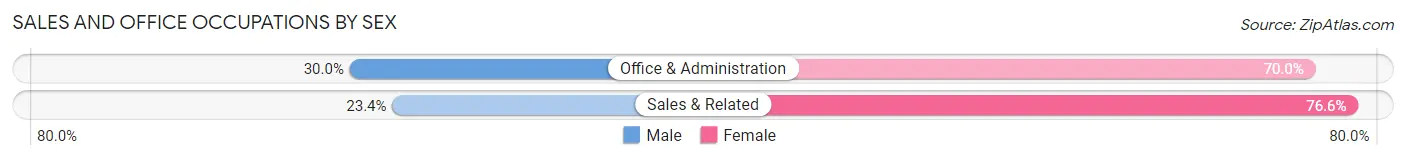
| Occupation | Male | Female |
| Sales & Related | 111 (23.4%) | 363 (76.6%) |
| Office & Administration | 334 (30.0%) | 780 (70.0%) |
| Total (Category) | 445 (28.0%) | 1,143 (72.0%) |
| Total (Overall) | 4,864 (53.0%) | 4,313 (47.0%) |
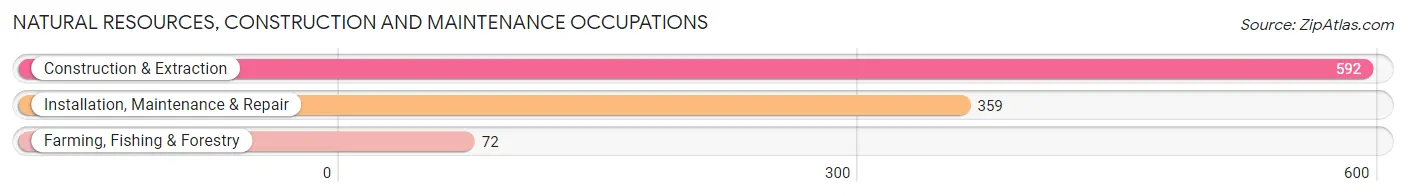
Natural Resources, Construction and Maintenance Occupations
The most common Natural Resources, Construction and Maintenance occupations in Carter County are Construction & Extraction (592 | 6.5%), Installation, Maintenance & Repair (359 | 3.9%), and Farming, Fishing & Forestry (72 | 0.8%).
Natural Resources, Construction and Maintenance Occupations by Sex
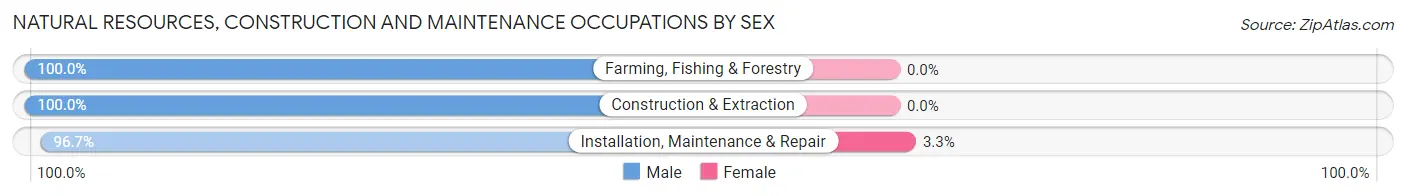
| Occupation | Male | Female |
| Farming, Fishing & Forestry | 72 (100.0%) | 0 (0.0%) |
| Construction & Extraction | 592 (100.0%) | 0 (0.0%) |
| Installation, Maintenance & Repair | 347 (96.7%) | 12 (3.3%) |
| Total (Category) | 1,011 (98.8%) | 12 (1.2%) |
| Total (Overall) | 4,864 (53.0%) | 4,313 (47.0%) |
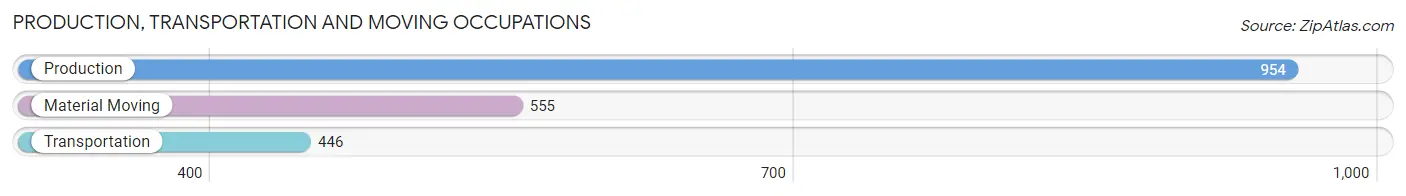
Production, Transportation and Moving Occupations
The most common Production, Transportation and Moving occupations in Carter County are Production (954 | 10.4%), Material Moving (555 | 6.0%), and Transportation (446 | 4.9%).
Production, Transportation and Moving Occupations by Sex
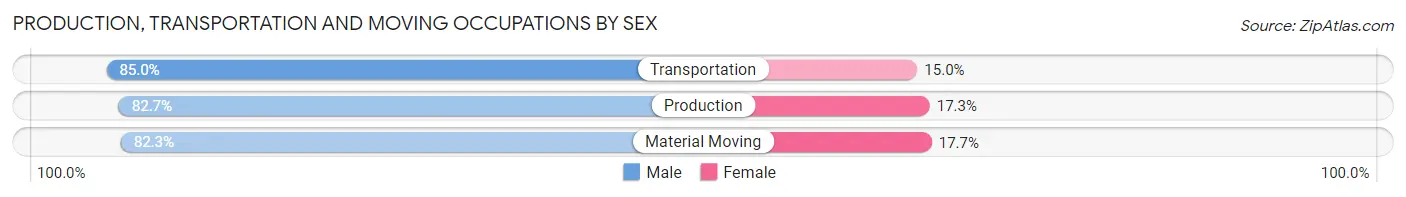
| Occupation | Male | Female |
| Production | 789 (82.7%) | 165 (17.3%) |
| Transportation | 379 (85.0%) | 67 (15.0%) |
| Material Moving | 457 (82.3%) | 98 (17.7%) |
| Total (Category) | 1,625 (83.1%) | 330 (16.9%) |
| Total (Overall) | 4,864 (53.0%) | 4,313 (47.0%) |
Employment Industries by Sex in Carter County
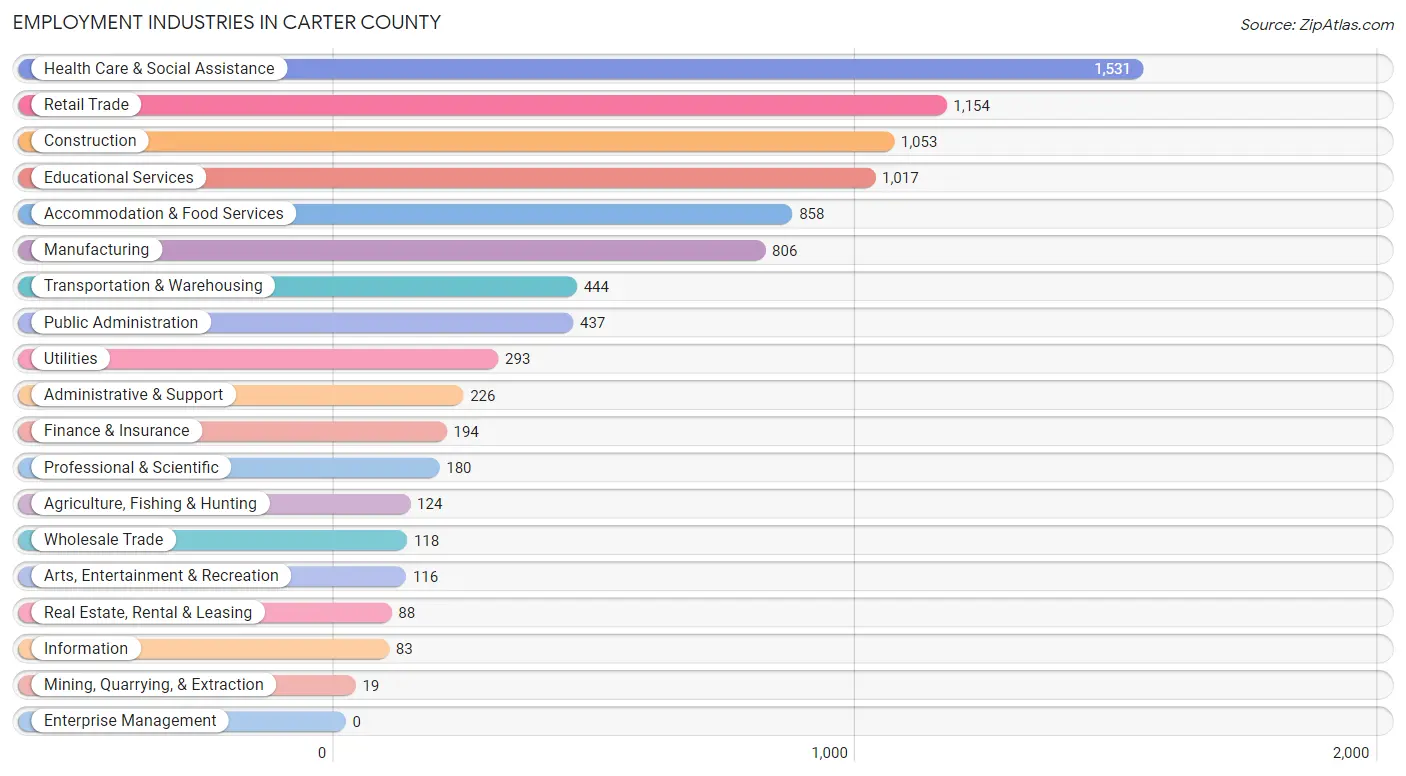
Employment Industries in Carter County
The major employment industries in Carter County include Health Care & Social Assistance (1,531 | 16.7%), Retail Trade (1,154 | 12.6%), Construction (1,053 | 11.5%), Educational Services (1,017 | 11.1%), and Accommodation & Food Services (858 | 9.3%).
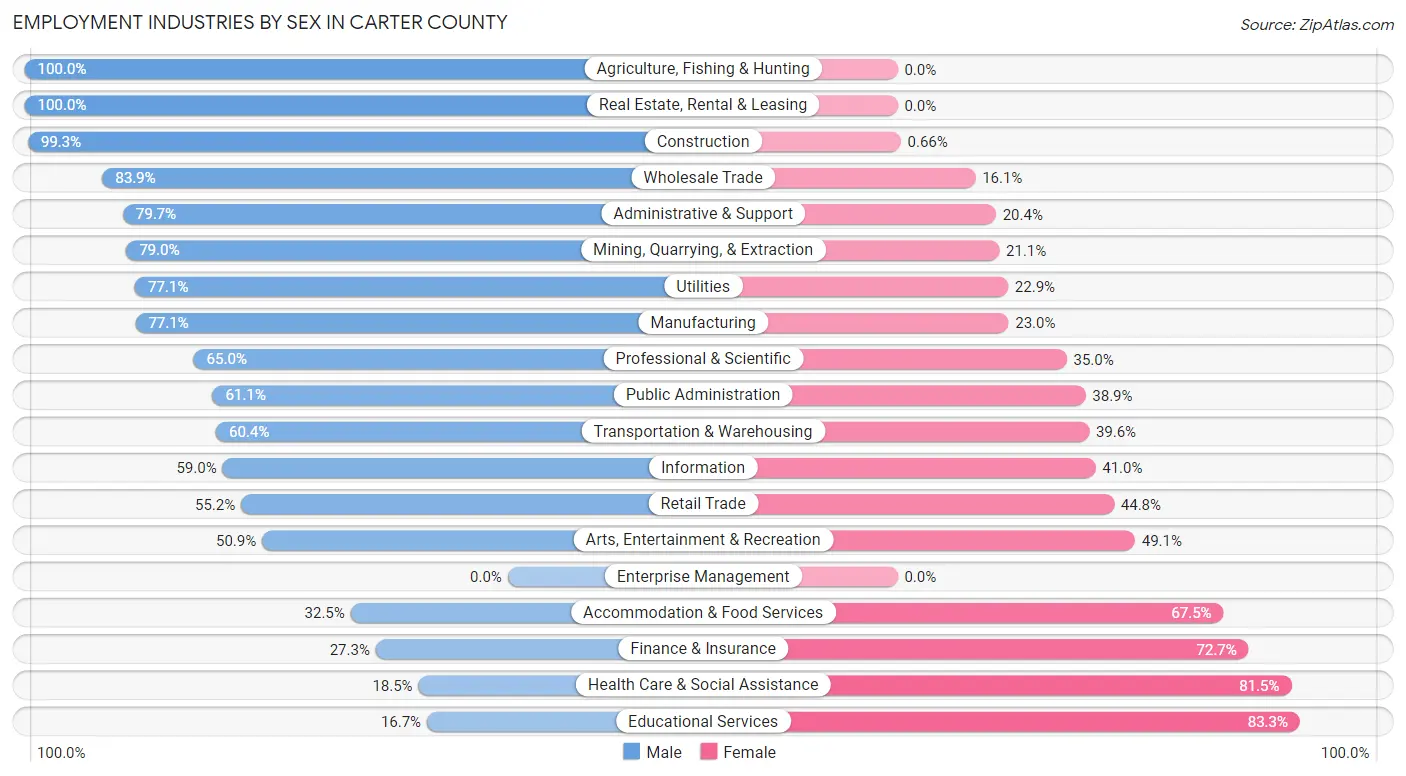
Employment Industries by Sex in Carter County
The Carter County industries that see more men than women are Agriculture, Fishing & Hunting (100.0%), Real Estate, Rental & Leasing (100.0%), and Construction (99.3%), whereas the industries that tend to have a higher number of women are Educational Services (83.3%), Health Care & Social Assistance (81.5%), and Finance & Insurance (72.7%).
| Industry | Male | Female |
| Agriculture, Fishing & Hunting | 124 (100.0%) | 0 (0.0%) |
| Mining, Quarrying, & Extraction | 15 (78.9%) | 4 (21.0%) |
| Construction | 1,046 (99.3%) | 7 (0.7%) |
| Manufacturing | 621 (77.0%) | 185 (23.0%) |
| Wholesale Trade | 99 (83.9%) | 19 (16.1%) |
| Retail Trade | 637 (55.2%) | 517 (44.8%) |
| Transportation & Warehousing | 268 (60.4%) | 176 (39.6%) |
| Utilities | 226 (77.1%) | 67 (22.9%) |
| Information | 49 (59.0%) | 34 (41.0%) |
| Finance & Insurance | 53 (27.3%) | 141 (72.7%) |
| Real Estate, Rental & Leasing | 88 (100.0%) | 0 (0.0%) |
| Professional & Scientific | 117 (65.0%) | 63 (35.0%) |
| Enterprise Management | 0 (0.0%) | 0 (0.0%) |
| Administrative & Support | 180 (79.6%) | 46 (20.3%) |
| Educational Services | 170 (16.7%) | 847 (83.3%) |
| Health Care & Social Assistance | 283 (18.5%) | 1,248 (81.5%) |
| Arts, Entertainment & Recreation | 59 (50.9%) | 57 (49.1%) |
| Accommodation & Food Services | 279 (32.5%) | 579 (67.5%) |
| Public Administration | 267 (61.1%) | 170 (38.9%) |
| Total | 4,864 (53.0%) | 4,313 (47.0%) |
Education in Carter County
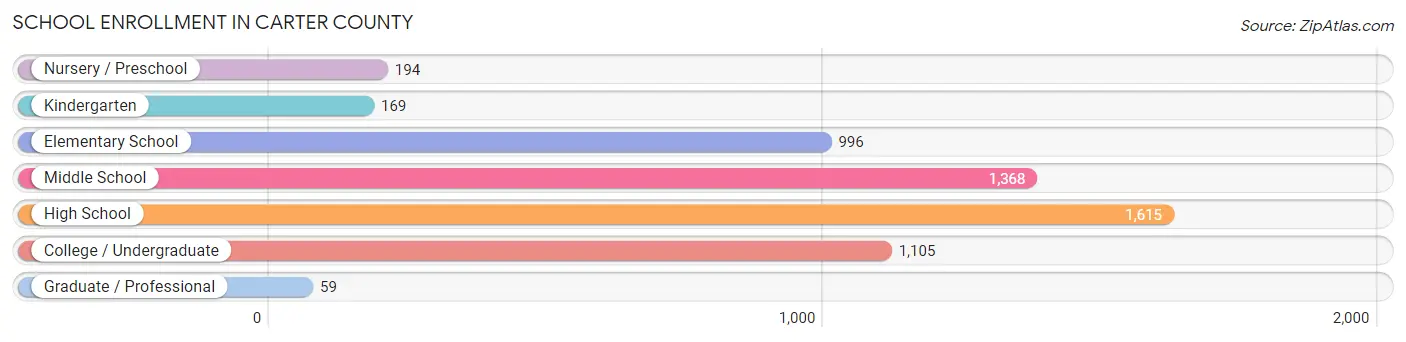
School Enrollment in Carter County
The most common levels of schooling among the 5,506 students in Carter County are high school (1,615 | 29.3%), middle school (1,368 | 24.8%), and college / undergraduate (1,105 | 20.1%).
| School Level | # Students | % Students |
| Nursery / Preschool | 194 | 3.5% |
| Kindergarten | 169 | 3.1% |
| Elementary School | 996 | 18.1% |
| Middle School | 1,368 | 24.8% |
| High School | 1,615 | 29.3% |
| College / Undergraduate | 1,105 | 20.1% |
| Graduate / Professional | 59 | 1.1% |
| Total | 5,506 | 100.0% |
School Enrollment by Age by Funding Source in Carter County
Out of a total of 5,506 students who are enrolled in schools in Carter County, 875 (15.9%) attend a private institution, while the remaining 4,631 (84.1%) are enrolled in public schools. The age group of 25 to 34 year olds has the highest likelihood of being enrolled in private schools, with 47 (58.0% in the age bracket) enrolled. Conversely, the age group of 3 to 4 year olds has the lowest likelihood of being enrolled in a private school, with 146 (99.3% in the age bracket) attending a public institution.
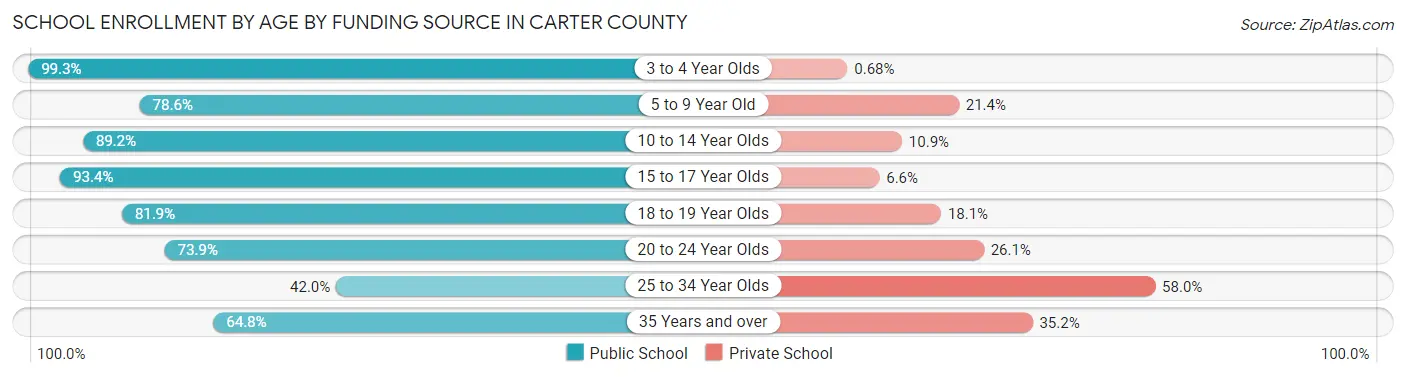
| Age Bracket | Public School | Private School |
| 3 to 4 Year Olds | 146 (99.3%) | 1 (0.7%) |
| 5 to 9 Year Old | 865 (78.6%) | 236 (21.4%) |
| 10 to 14 Year Olds | 1,455 (89.1%) | 177 (10.8%) |
| 15 to 17 Year Olds | 1,056 (93.4%) | 75 (6.6%) |
| 18 to 19 Year Olds | 452 (81.9%) | 100 (18.1%) |
| 20 to 24 Year Olds | 530 (73.9%) | 187 (26.1%) |
| 25 to 34 Year Olds | 34 (42.0%) | 47 (58.0%) |
| 35 Years and over | 94 (64.8%) | 51 (35.2%) |
| Total | 4,631 (84.1%) | 875 (15.9%) |
Educational Attainment by Field of Study in Carter County
Education (690 | 24.3%), arts & humanities (484 | 17.0%), business (391 | 13.8%), science & technology (235 | 8.3%), and visual & performing arts (233 | 8.2%) are the most common fields of study among 2,842 individuals in Carter County who have obtained a bachelor's degree or higher.
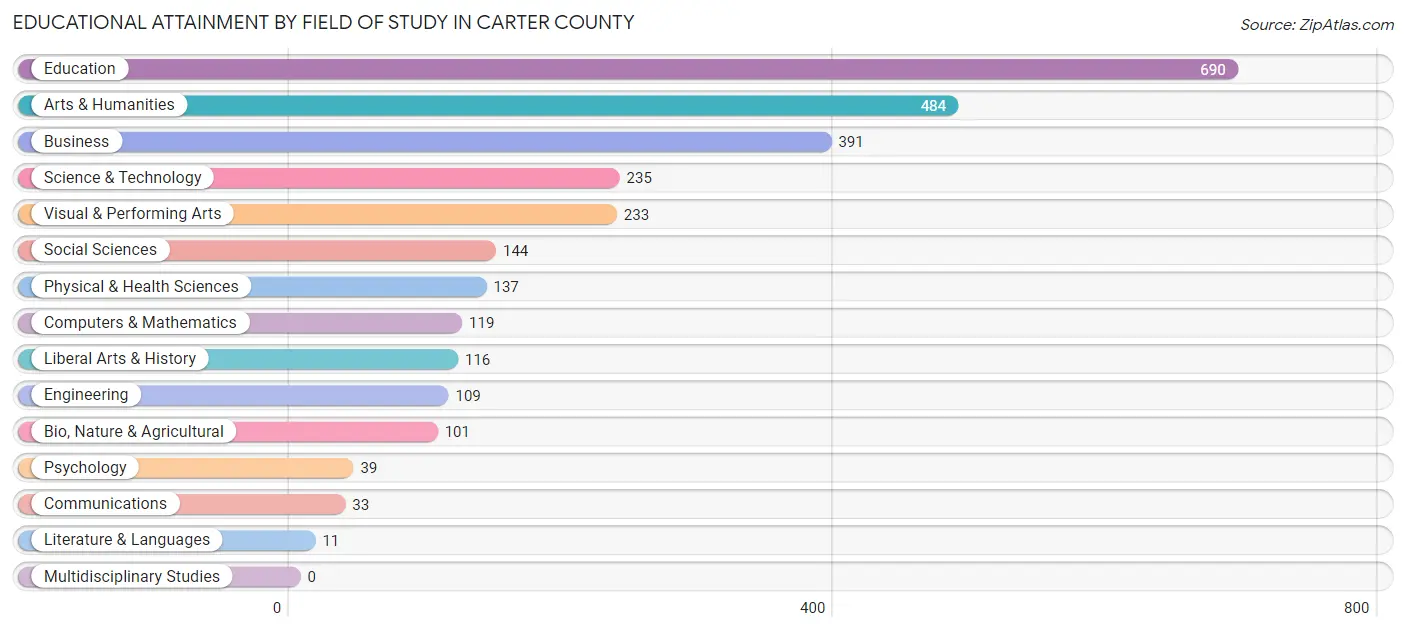
| Field of Study | # Graduates | % Graduates |
| Computers & Mathematics | 119 | 4.2% |
| Bio, Nature & Agricultural | 101 | 3.5% |
| Physical & Health Sciences | 137 | 4.8% |
| Psychology | 39 | 1.4% |
| Social Sciences | 144 | 5.1% |
| Engineering | 109 | 3.8% |
| Multidisciplinary Studies | 0 | 0.0% |
| Science & Technology | 235 | 8.3% |
| Business | 391 | 13.8% |
| Education | 690 | 24.3% |
| Literature & Languages | 11 | 0.4% |
| Liberal Arts & History | 116 | 4.1% |
| Visual & Performing Arts | 233 | 8.2% |
| Communications | 33 | 1.2% |
| Arts & Humanities | 484 | 17.0% |
| Total | 2,842 | 100.0% |
Transportation & Commute in Carter County
Vehicle Availability by Sex in Carter County
The most prevalent vehicle ownership categories in Carter County are males with 2 vehicles (1,697, accounting for 37.4%) and females with 2 vehicles (1,127, making up 41.2%).
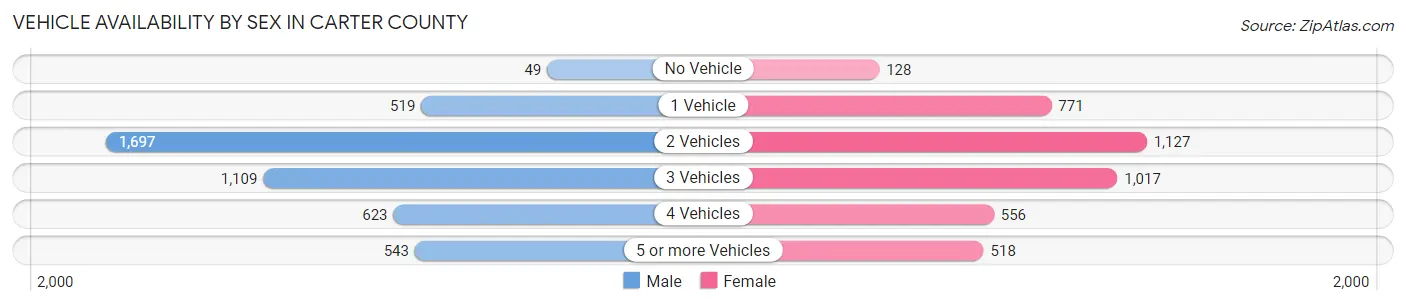
| Vehicles Available | Male | Female |
| No Vehicle | 49 (1.1%) | 128 (3.1%) |
| 1 Vehicle | 519 (11.4%) | 771 (18.7%) |
| 2 Vehicles | 1,697 (37.4%) | 1,127 (27.4%) |
| 3 Vehicles | 1,109 (24.4%) | 1,017 (24.7%) |
| 4 Vehicles | 623 (13.7%) | 556 (13.5%) |
| 5 or more Vehicles | 543 (12.0%) | 518 (12.6%) |
| Total | 4,540 (100.0%) | 4,117 (100.0%) |
Commute Time in Carter County
The most frequently occuring commute durations in Carter County are 15 to 19 minutes (1,263 commuters, 14.8%), 30 to 34 minutes (1,198 commuters, 14.1%), and 45 to 59 minutes (1,175 commuters, 13.8%).
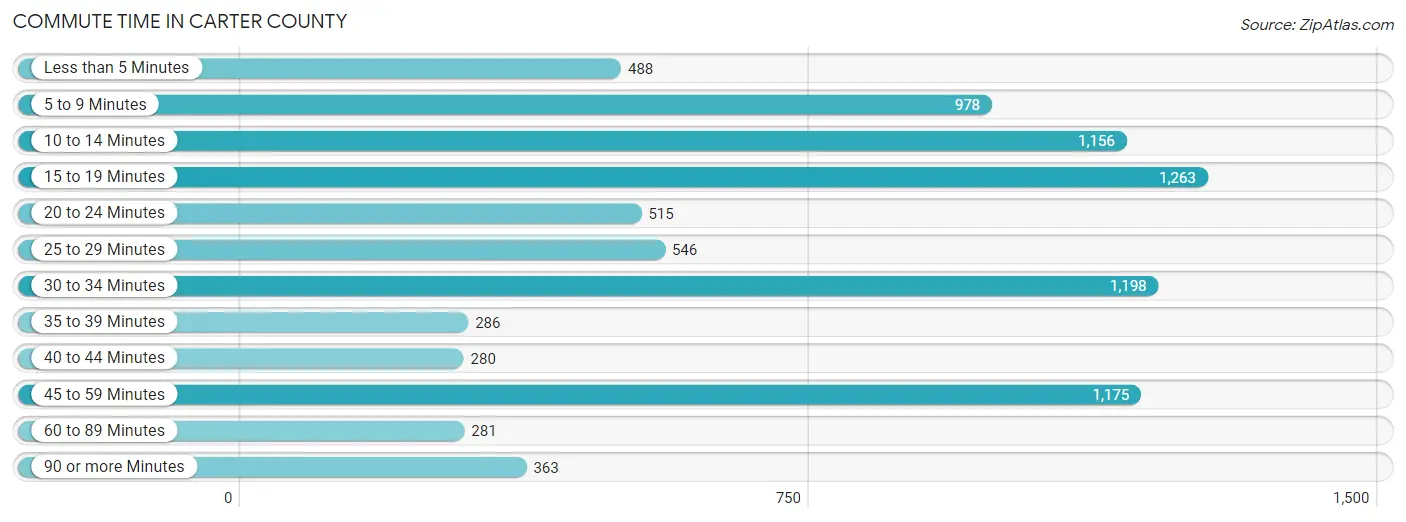
| Commute Time | # Commuters | % Commuters |
| Less than 5 Minutes | 488 | 5.7% |
| 5 to 9 Minutes | 978 | 11.5% |
| 10 to 14 Minutes | 1,156 | 13.6% |
| 15 to 19 Minutes | 1,263 | 14.8% |
| 20 to 24 Minutes | 515 | 6.0% |
| 25 to 29 Minutes | 546 | 6.4% |
| 30 to 34 Minutes | 1,198 | 14.1% |
| 35 to 39 Minutes | 286 | 3.4% |
| 40 to 44 Minutes | 280 | 3.3% |
| 45 to 59 Minutes | 1,175 | 13.8% |
| 60 to 89 Minutes | 281 | 3.3% |
| 90 or more Minutes | 363 | 4.3% |
Commute Time by Sex in Carter County
The most common commute times in Carter County are 30 to 34 minutes (779 commuters, 17.4%) for males and 45 to 59 minutes (692 commuters, 17.0%) for females.
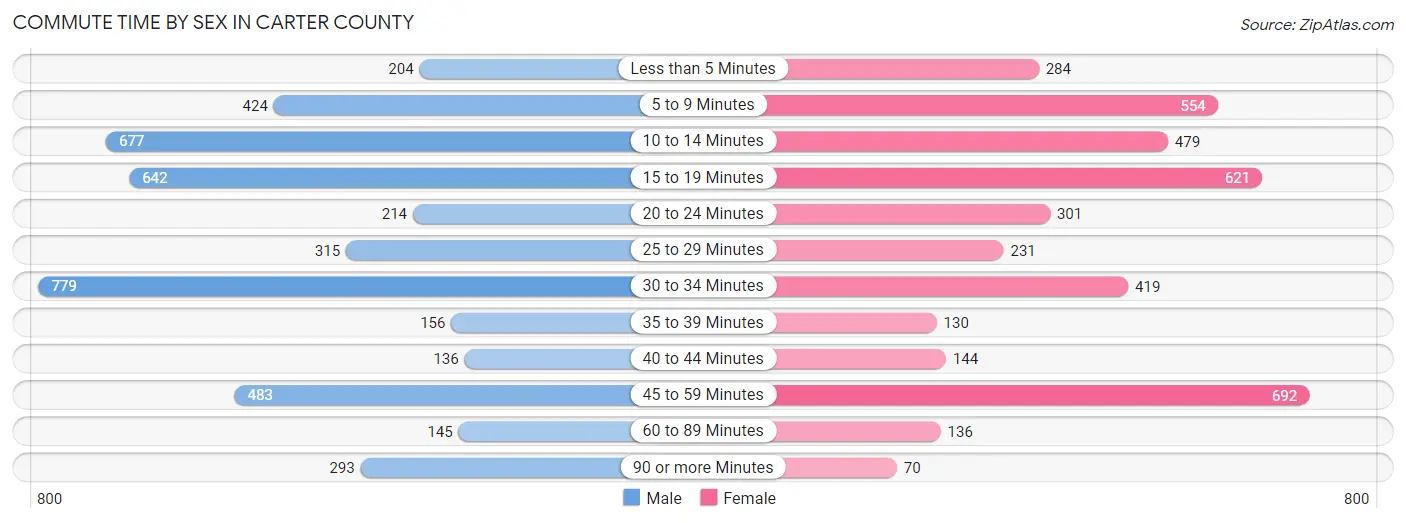
| Commute Time | Male | Female |
| Less than 5 Minutes | 204 (4.6%) | 284 (7.0%) |
| 5 to 9 Minutes | 424 (9.5%) | 554 (13.6%) |
| 10 to 14 Minutes | 677 (15.1%) | 479 (11.8%) |
| 15 to 19 Minutes | 642 (14.4%) | 621 (15.3%) |
| 20 to 24 Minutes | 214 (4.8%) | 301 (7.4%) |
| 25 to 29 Minutes | 315 (7.0%) | 231 (5.7%) |
| 30 to 34 Minutes | 779 (17.4%) | 419 (10.3%) |
| 35 to 39 Minutes | 156 (3.5%) | 130 (3.2%) |
| 40 to 44 Minutes | 136 (3.0%) | 144 (3.5%) |
| 45 to 59 Minutes | 483 (10.8%) | 692 (17.0%) |
| 60 to 89 Minutes | 145 (3.3%) | 136 (3.4%) |
| 90 or more Minutes | 293 (6.6%) | 70 (1.7%) |
Time of Departure to Work by Sex in Carter County
The most frequent times of departure to work in Carter County are 7:00 AM to 7:29 AM (597, 13.4%) for males and 7:00 AM to 7:29 AM (727, 17.9%) for females.
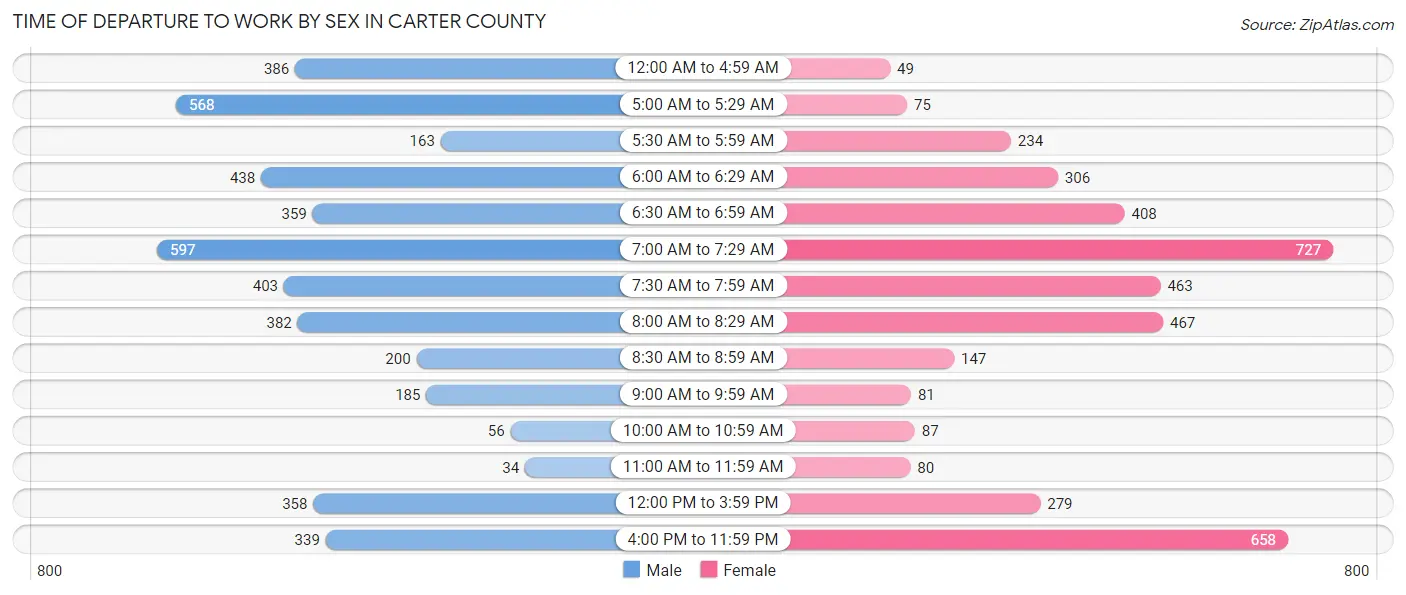
| Time of Departure | Male | Female |
| 12:00 AM to 4:59 AM | 386 (8.6%) | 49 (1.2%) |
| 5:00 AM to 5:29 AM | 568 (12.7%) | 75 (1.8%) |
| 5:30 AM to 5:59 AM | 163 (3.6%) | 234 (5.8%) |
| 6:00 AM to 6:29 AM | 438 (9.8%) | 306 (7.5%) |
| 6:30 AM to 6:59 AM | 359 (8.0%) | 408 (10.1%) |
| 7:00 AM to 7:29 AM | 597 (13.4%) | 727 (17.9%) |
| 7:30 AM to 7:59 AM | 403 (9.0%) | 463 (11.4%) |
| 8:00 AM to 8:29 AM | 382 (8.6%) | 467 (11.5%) |
| 8:30 AM to 8:59 AM | 200 (4.5%) | 147 (3.6%) |
| 9:00 AM to 9:59 AM | 185 (4.1%) | 81 (2.0%) |
| 10:00 AM to 10:59 AM | 56 (1.3%) | 87 (2.1%) |
| 11:00 AM to 11:59 AM | 34 (0.8%) | 80 (2.0%) |
| 12:00 PM to 3:59 PM | 358 (8.0%) | 279 (6.9%) |
| 4:00 PM to 11:59 PM | 339 (7.6%) | 658 (16.2%) |
| Total | 4,468 (100.0%) | 4,061 (100.0%) |
Housing Occupancy in Carter County
Occupancy by Ownership in Carter County
Of the total 9,778 dwellings in Carter County, owner-occupied units account for 7,769 (79.4%), while renter-occupied units make up 2,009 (20.5%).
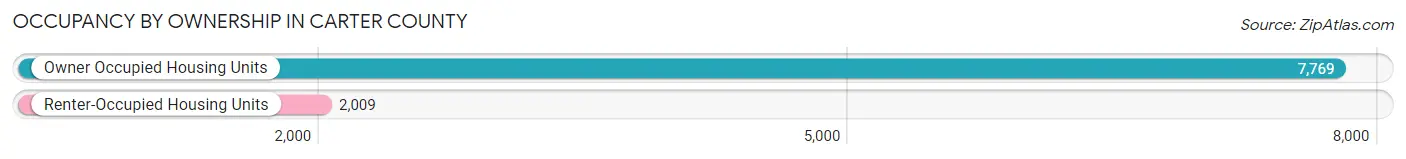
| Occupancy | # Housing Units | % Housing Units |
| Owner Occupied Housing Units | 7,769 | 79.4% |
| Renter-Occupied Housing Units | 2,009 | 20.5% |
| Total Occupied Housing Units | 9,778 | 100.0% |
Occupancy by Household Size in Carter County
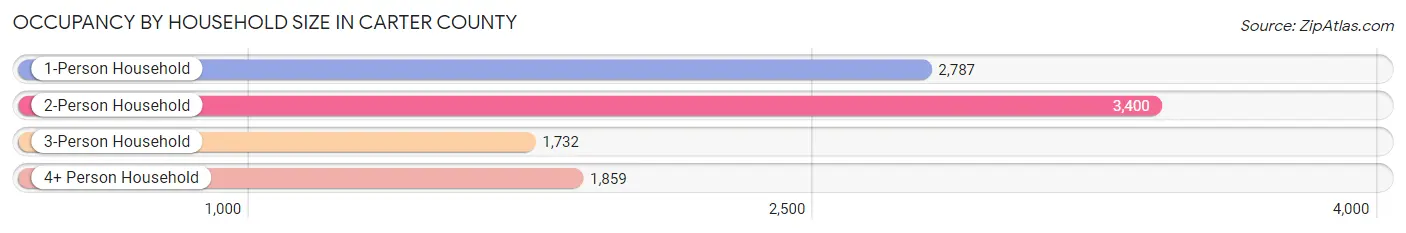
| Household Size | # Housing Units | % Housing Units |
| 1-Person Household | 2,787 | 28.5% |
| 2-Person Household | 3,400 | 34.8% |
| 3-Person Household | 1,732 | 17.7% |
| 4+ Person Household | 1,859 | 19.0% |
| Total Housing Units | 9,778 | 100.0% |
Occupancy by Ownership by Household Size in Carter County
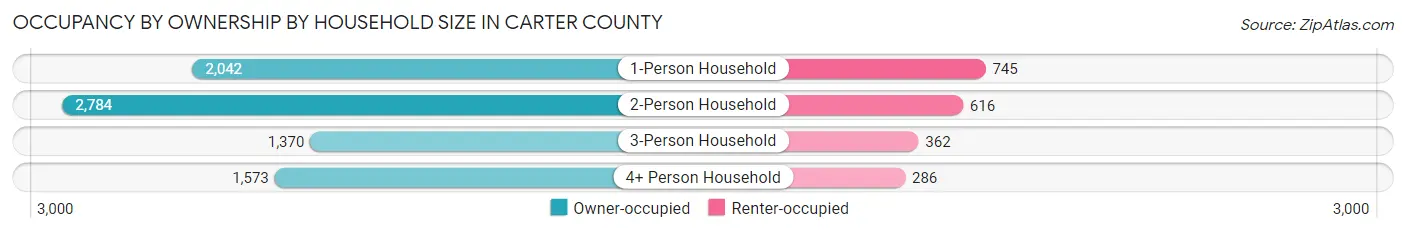
| Household Size | Owner-occupied | Renter-occupied |
| 1-Person Household | 2,042 (73.3%) | 745 (26.7%) |
| 2-Person Household | 2,784 (81.9%) | 616 (18.1%) |
| 3-Person Household | 1,370 (79.1%) | 362 (20.9%) |
| 4+ Person Household | 1,573 (84.6%) | 286 (15.4%) |
| Total Housing Units | 7,769 (79.4%) | 2,009 (20.5%) |
Occupancy by Educational Attainment in Carter County
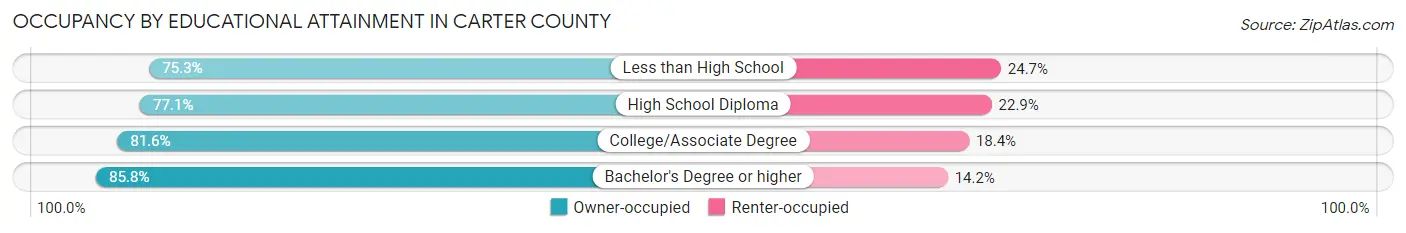
| Household Size | Owner-occupied | Renter-occupied |
| Less than High School | 1,300 (75.3%) | 427 (24.7%) |
| High School Diploma | 2,847 (77.1%) | 845 (22.9%) |
| College/Associate Degree | 2,303 (81.6%) | 519 (18.4%) |
| Bachelor's Degree or higher | 1,319 (85.8%) | 218 (14.2%) |
Occupancy by Age of Householder in Carter County
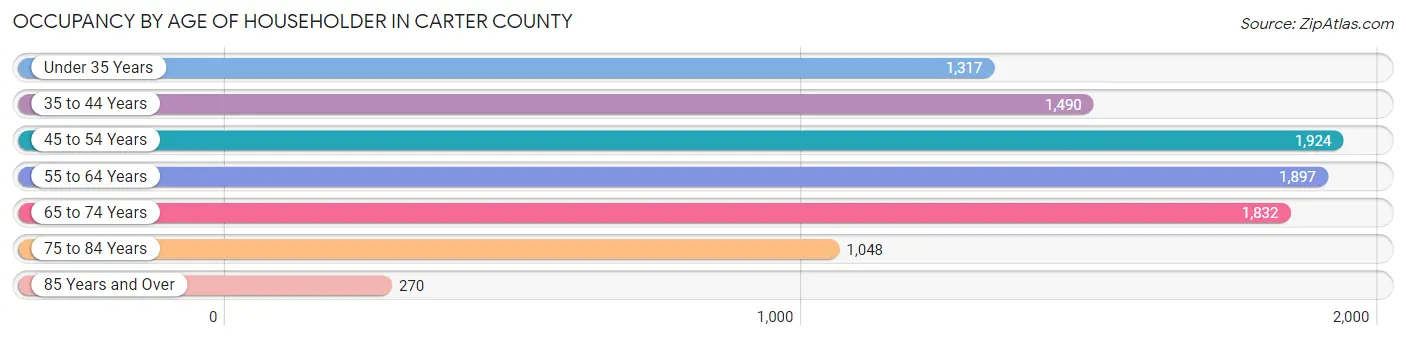
| Age Bracket | # Households | % Households |
| Under 35 Years | 1,317 | 13.5% |
| 35 to 44 Years | 1,490 | 15.2% |
| 45 to 54 Years | 1,924 | 19.7% |
| 55 to 64 Years | 1,897 | 19.4% |
| 65 to 74 Years | 1,832 | 18.7% |
| 75 to 84 Years | 1,048 | 10.7% |
| 85 Years and Over | 270 | 2.8% |
| Total | 9,778 | 100.0% |
Housing Finances in Carter County
Median Income by Occupancy in Carter County
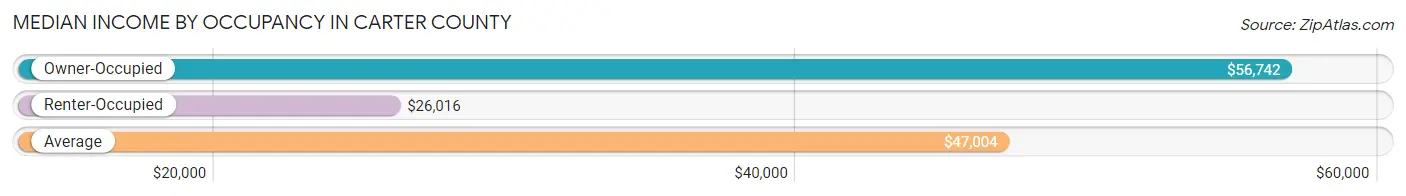
| Occupancy Type | # Households | Median Income |
| Owner-Occupied | 7,769 (79.4%) | $56,742 |
| Renter-Occupied | 2,009 (20.5%) | $26,016 |
| Average | 9,778 (100.0%) | $47,004 |
Occupancy by Householder Income Bracket in Carter County
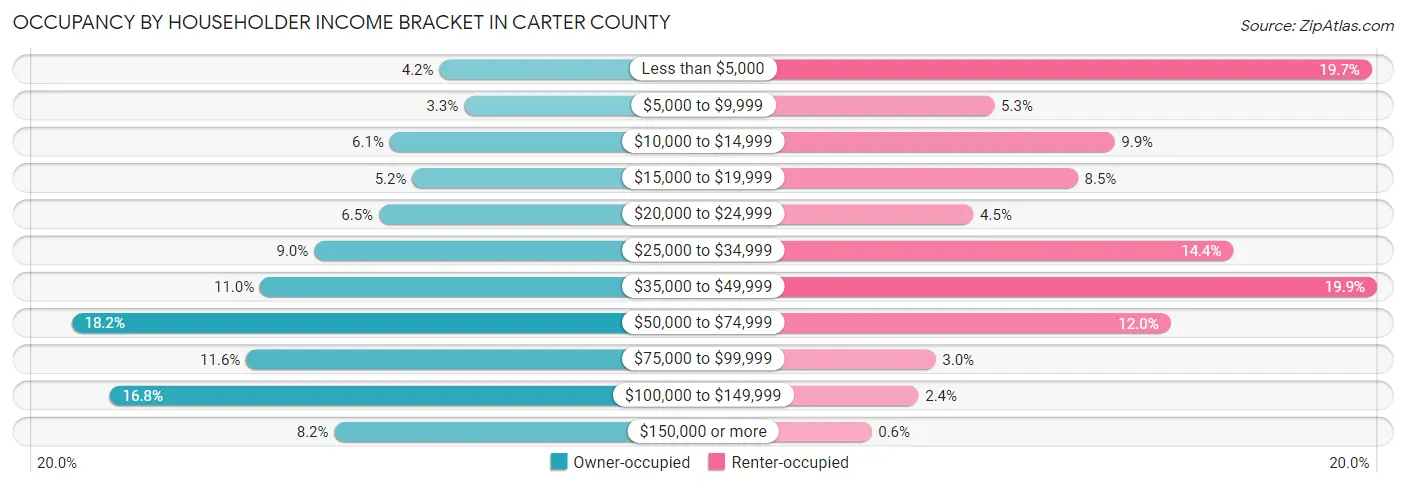
| Income Bracket | Owner-occupied | Renter-occupied |
| Less than $5,000 | 326 (4.2%) | 395 (19.7%) |
| $5,000 to $9,999 | 253 (3.3%) | 106 (5.3%) |
| $10,000 to $14,999 | 473 (6.1%) | 198 (9.9%) |
| $15,000 to $19,999 | 406 (5.2%) | 170 (8.5%) |
| $20,000 to $24,999 | 505 (6.5%) | 90 (4.5%) |
| $25,000 to $34,999 | 697 (9.0%) | 289 (14.4%) |
| $35,000 to $49,999 | 857 (11.0%) | 399 (19.9%) |
| $50,000 to $74,999 | 1,415 (18.2%) | 241 (12.0%) |
| $75,000 to $99,999 | 898 (11.6%) | 61 (3.0%) |
| $100,000 to $149,999 | 1,302 (16.8%) | 48 (2.4%) |
| $150,000 or more | 637 (8.2%) | 12 (0.6%) |
| Total | 7,769 (100.0%) | 2,009 (100.0%) |
Monthly Housing Cost Tiers in Carter County
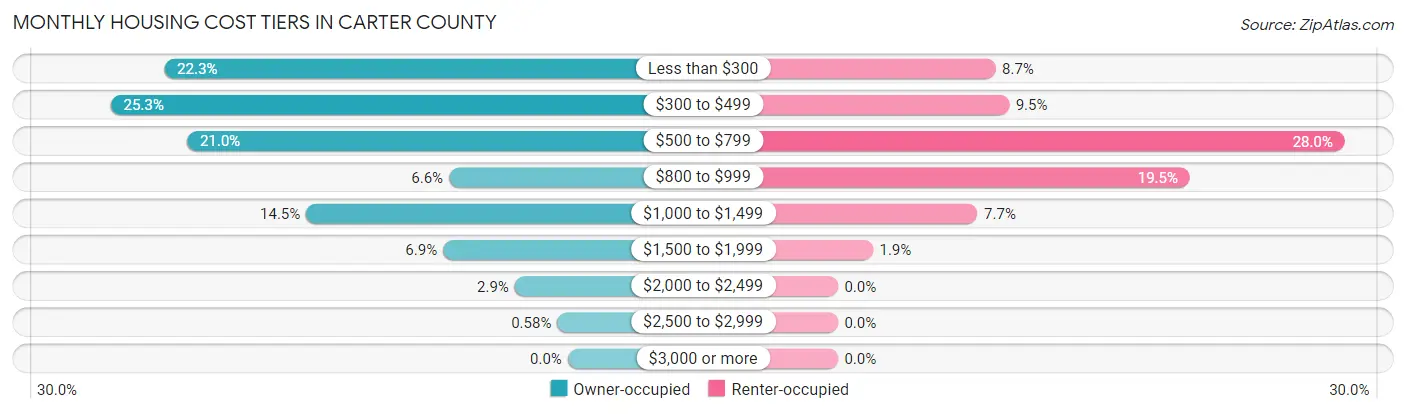
| Monthly Cost | Owner-occupied | Renter-occupied |
| Less than $300 | 1,732 (22.3%) | 175 (8.7%) |
| $300 to $499 | 1,962 (25.3%) | 190 (9.5%) |
| $500 to $799 | 1,634 (21.0%) | 563 (28.0%) |
| $800 to $999 | 510 (6.6%) | 391 (19.5%) |
| $1,000 to $1,499 | 1,123 (14.4%) | 155 (7.7%) |
| $1,500 to $1,999 | 535 (6.9%) | 39 (1.9%) |
| $2,000 to $2,499 | 228 (2.9%) | 0 (0.0%) |
| $2,500 to $2,999 | 45 (0.6%) | 0 (0.0%) |
| $3,000 or more | 0 (0.0%) | 0 (0.0%) |
| Total | 7,769 (100.0%) | 2,009 (100.0%) |
Physical Housing Characteristics in Carter County
Housing Structures in Carter County
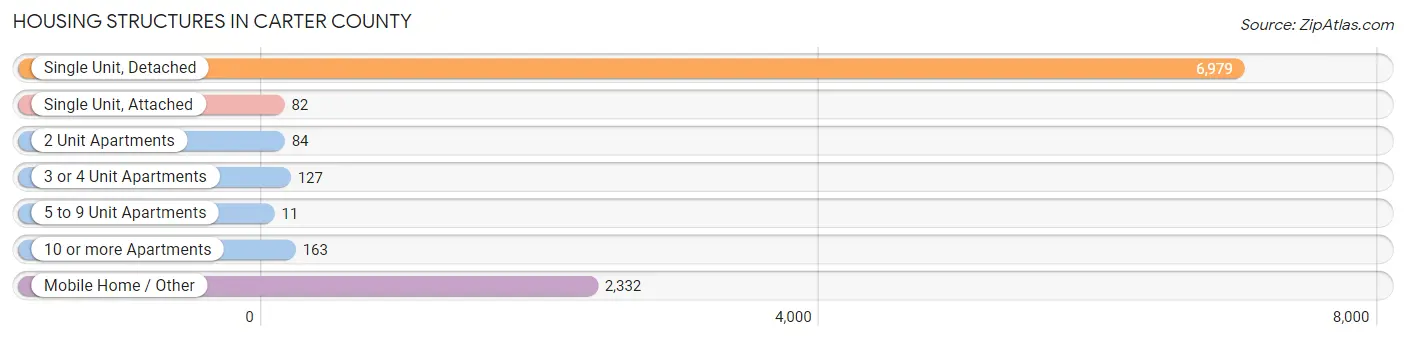
| Structure Type | # Housing Units | % Housing Units |
| Single Unit, Detached | 6,979 | 71.4% |
| Single Unit, Attached | 82 | 0.8% |
| 2 Unit Apartments | 84 | 0.9% |
| 3 or 4 Unit Apartments | 127 | 1.3% |
| 5 to 9 Unit Apartments | 11 | 0.1% |
| 10 or more Apartments | 163 | 1.7% |
| Mobile Home / Other | 2,332 | 23.8% |
| Total | 9,778 | 100.0% |
Housing Structures by Occupancy in Carter County
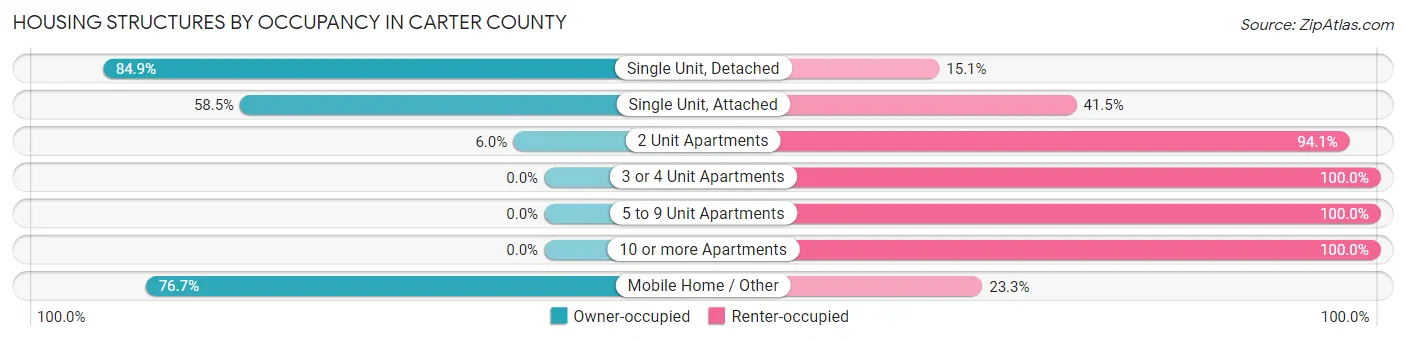
| Structure Type | Owner-occupied | Renter-occupied |
| Single Unit, Detached | 5,928 (84.9%) | 1,051 (15.1%) |
| Single Unit, Attached | 48 (58.5%) | 34 (41.5%) |
| 2 Unit Apartments | 5 (5.9%) | 79 (94.1%) |
| 3 or 4 Unit Apartments | 0 (0.0%) | 127 (100.0%) |
| 5 to 9 Unit Apartments | 0 (0.0%) | 11 (100.0%) |
| 10 or more Apartments | 0 (0.0%) | 163 (100.0%) |
| Mobile Home / Other | 1,788 (76.7%) | 544 (23.3%) |
| Total | 7,769 (79.4%) | 2,009 (20.5%) |
Housing Structures by Number of Rooms in Carter County
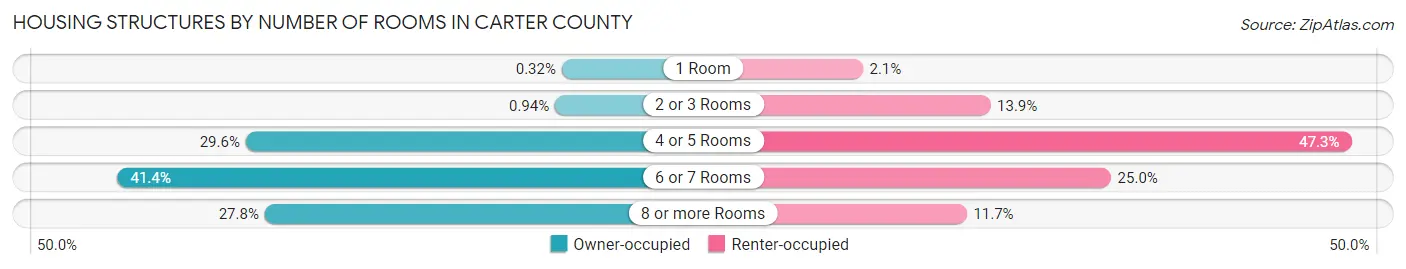
| Number of Rooms | Owner-occupied | Renter-occupied |
| 1 Room | 25 (0.3%) | 42 (2.1%) |
| 2 or 3 Rooms | 73 (0.9%) | 279 (13.9%) |
| 4 or 5 Rooms | 2,296 (29.5%) | 950 (47.3%) |
| 6 or 7 Rooms | 3,216 (41.4%) | 503 (25.0%) |
| 8 or more Rooms | 2,159 (27.8%) | 235 (11.7%) |
| Total | 7,769 (100.0%) | 2,009 (100.0%) |
Housing Structure by Heating Type in Carter County
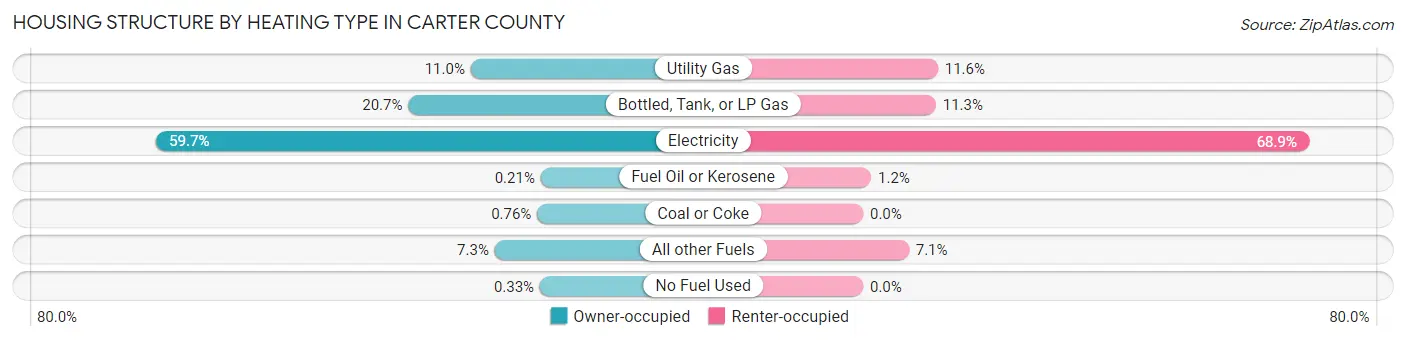
| Heating Type | Owner-occupied | Renter-occupied |
| Utility Gas | 857 (11.0%) | 232 (11.6%) |
| Bottled, Tank, or LP Gas | 1,607 (20.7%) | 226 (11.3%) |
| Electricity | 4,635 (59.7%) | 1,384 (68.9%) |
| Fuel Oil or Kerosene | 16 (0.2%) | 25 (1.2%) |
| Coal or Coke | 59 (0.8%) | 0 (0.0%) |
| All other Fuels | 569 (7.3%) | 142 (7.1%) |
| No Fuel Used | 26 (0.3%) | 0 (0.0%) |
| Total | 7,769 (100.0%) | 2,009 (100.0%) |
Household Vehicle Usage in Carter County
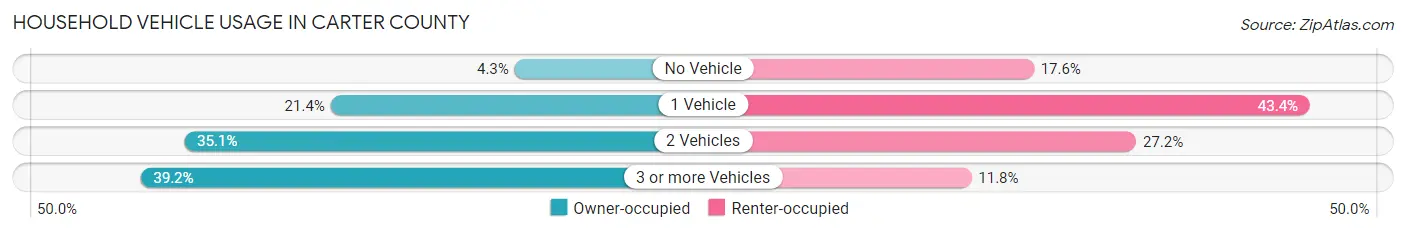
| Vehicles per Household | Owner-occupied | Renter-occupied |
| No Vehicle | 331 (4.3%) | 354 (17.6%) |
| 1 Vehicle | 1,665 (21.4%) | 872 (43.4%) |
| 2 Vehicles | 2,728 (35.1%) | 546 (27.2%) |
| 3 or more Vehicles | 3,045 (39.2%) | 237 (11.8%) |
| Total | 7,769 (100.0%) | 2,009 (100.0%) |
Real Estate & Mortgages in Carter County
Real Estate and Mortgage Overview in Carter County
| Characteristic | Without Mortgage | With Mortgage |
| Housing Units | 4,856 | 2,913 |
| Median Property Value | $90,600 | $159,500 |
| Median Household Income | $44,029 | $389 |
| Monthly Housing Costs | $375 | $0 |
| Real Estate Taxes | $466 | $272 |
Property Value by Mortgage Status in Carter County
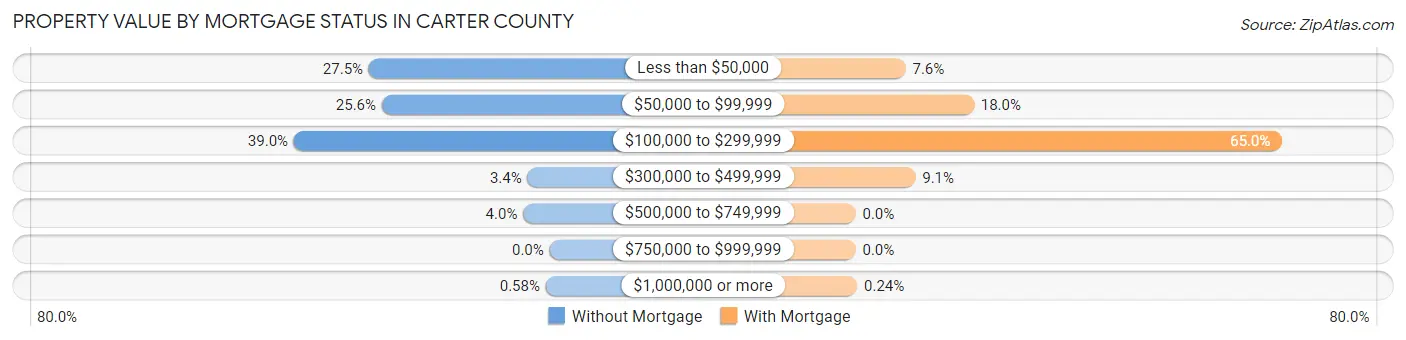
| Property Value | Without Mortgage | With Mortgage |
| Less than $50,000 | 1,337 (27.5%) | 222 (7.6%) |
| $50,000 to $99,999 | 1,241 (25.6%) | 525 (18.0%) |
| $100,000 to $299,999 | 1,892 (39.0%) | 1,894 (65.0%) |
| $300,000 to $499,999 | 163 (3.4%) | 265 (9.1%) |
| $500,000 to $749,999 | 195 (4.0%) | 0 (0.0%) |
| $750,000 to $999,999 | 0 (0.0%) | 0 (0.0%) |
| $1,000,000 or more | 28 (0.6%) | 7 (0.2%) |
| Total | 4,856 (100.0%) | 2,913 (100.0%) |
Household Income by Mortgage Status in Carter County
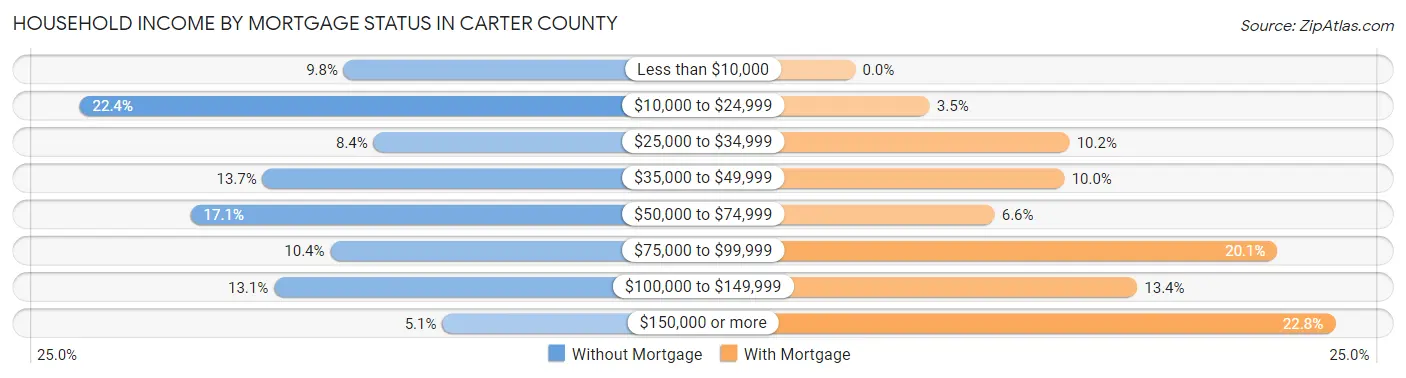
| Household Income | Without Mortgage | With Mortgage |
| Less than $10,000 | 476 (9.8%) | 0 (0.0%) |
| $10,000 to $24,999 | 1,087 (22.4%) | 103 (3.5%) |
| $25,000 to $34,999 | 407 (8.4%) | 297 (10.2%) |
| $35,000 to $49,999 | 664 (13.7%) | 290 (10.0%) |
| $50,000 to $74,999 | 830 (17.1%) | 193 (6.6%) |
| $75,000 to $99,999 | 507 (10.4%) | 585 (20.1%) |
| $100,000 to $149,999 | 637 (13.1%) | 391 (13.4%) |
| $150,000 or more | 248 (5.1%) | 665 (22.8%) |
| Total | 4,856 (100.0%) | 2,913 (100.0%) |
Property Value to Household Income Ratio in Carter County
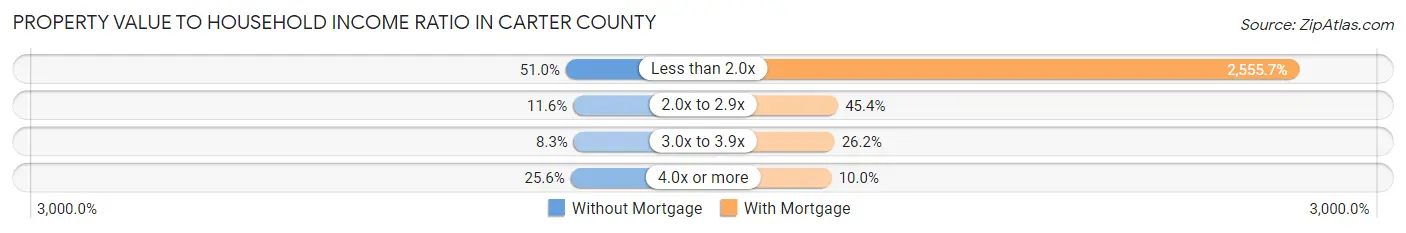
| Value-to-Income Ratio | Without Mortgage | With Mortgage |
| Less than 2.0x | 2,474 (50.9%) | 74,447 (2,555.7%) |
| 2.0x to 2.9x | 564 (11.6%) | 1,321 (45.4%) |
| 3.0x to 3.9x | 404 (8.3%) | 762 (26.2%) |
| 4.0x or more | 1,245 (25.6%) | 290 (10.0%) |
| Total | 4,856 (100.0%) | 2,913 (100.0%) |
Real Estate Taxes by Mortgage Status in Carter County
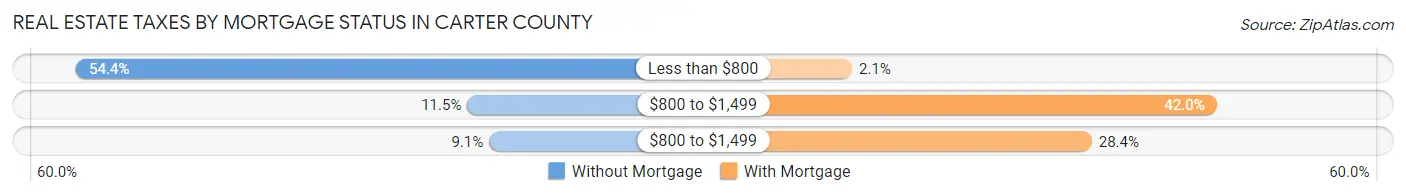
| Property Taxes | Without Mortgage | With Mortgage |
| Less than $800 | 2,639 (54.3%) | 61 (2.1%) |
| $800 to $1,499 | 558 (11.5%) | 1,224 (42.0%) |
| $800 to $1,499 | 442 (9.1%) | 826 (28.4%) |
| Total | 4,856 (100.0%) | 2,913 (100.0%) |
Health & Disability in Carter County
Health Insurance Coverage by Age in Carter County
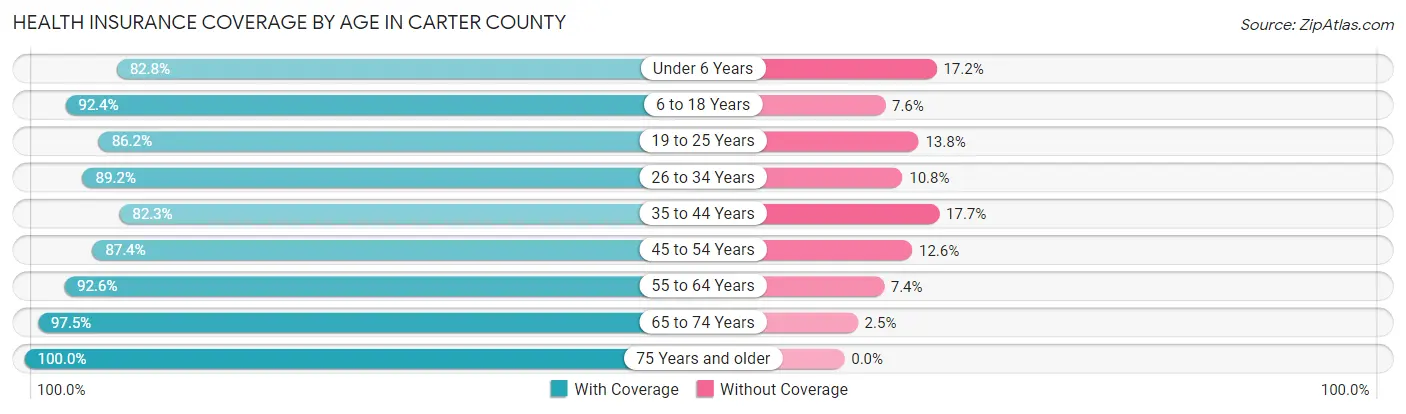
| Age Bracket | With Coverage | Without Coverage |
| Under 6 Years | 1,440 (82.8%) | 299 (17.2%) |
| 6 to 18 Years | 4,328 (92.4%) | 356 (7.6%) |
| 19 to 25 Years | 1,813 (86.2%) | 291 (13.8%) |
| 26 to 34 Years | 2,398 (89.2%) | 291 (10.8%) |
| 35 to 44 Years | 2,417 (82.3%) | 519 (17.7%) |
| 45 to 54 Years | 3,125 (87.4%) | 452 (12.6%) |
| 55 to 64 Years | 3,262 (92.6%) | 259 (7.4%) |
| 65 to 74 Years | 3,015 (97.5%) | 77 (2.5%) |
| 75 Years and older | 2,027 (100.0%) | 0 (0.0%) |
| Total | 23,825 (90.3%) | 2,544 (9.7%) |
Health Insurance Coverage by Citizenship Status in Carter County
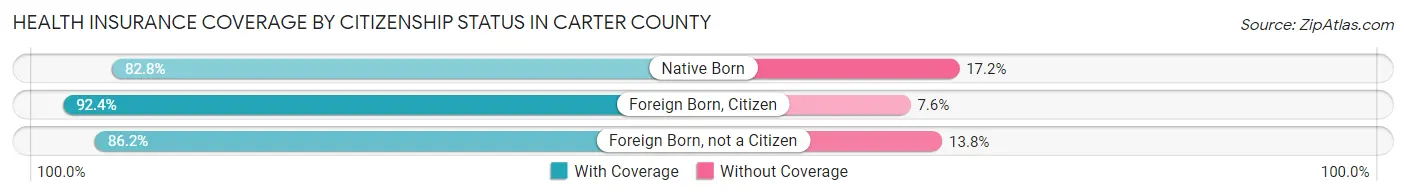
| Citizenship Status | With Coverage | Without Coverage |
| Native Born | 1,440 (82.8%) | 299 (17.2%) |
| Foreign Born, Citizen | 4,328 (92.4%) | 356 (7.6%) |
| Foreign Born, not a Citizen | 1,813 (86.2%) | 291 (13.8%) |
Health Insurance Coverage by Household Income in Carter County
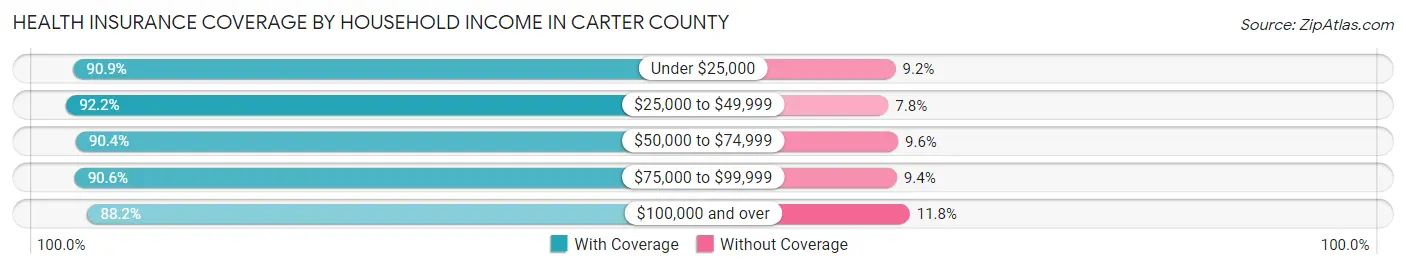
| Household Income | With Coverage | Without Coverage |
| Under $25,000 | 5,052 (90.8%) | 509 (9.1%) |
| $25,000 to $49,999 | 5,422 (92.2%) | 459 (7.8%) |
| $50,000 to $74,999 | 4,187 (90.4%) | 445 (9.6%) |
| $75,000 to $99,999 | 2,402 (90.6%) | 249 (9.4%) |
| $100,000 and over | 6,424 (88.2%) | 860 (11.8%) |
Public vs Private Health Insurance Coverage by Age in Carter County
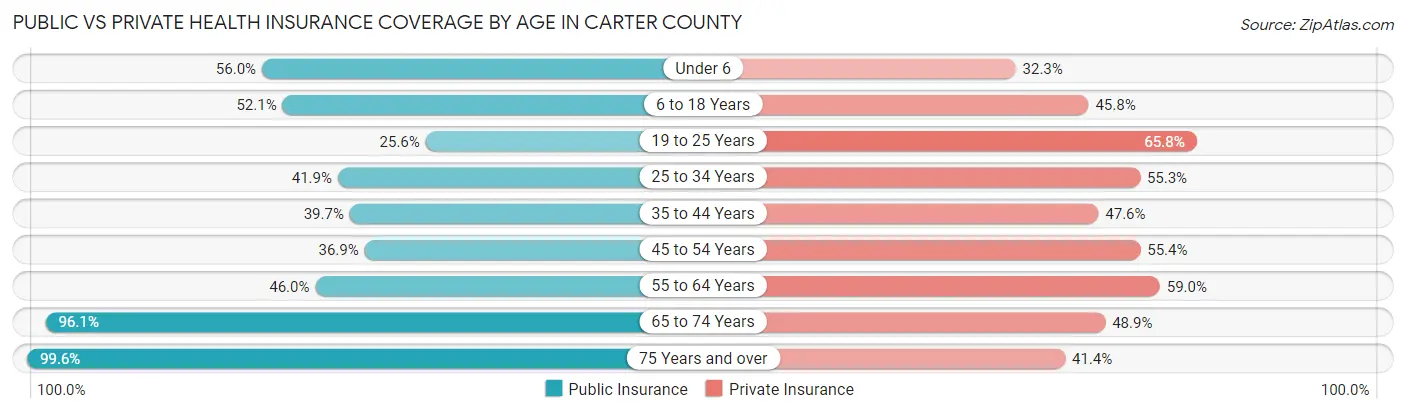
| Age Bracket | Public Insurance | Private Insurance |
| Under 6 | 973 (55.9%) | 561 (32.3%) |
| 6 to 18 Years | 2,442 (52.1%) | 2,145 (45.8%) |
| 19 to 25 Years | 538 (25.6%) | 1,385 (65.8%) |
| 25 to 34 Years | 1,126 (41.9%) | 1,488 (55.3%) |
| 35 to 44 Years | 1,164 (39.7%) | 1,398 (47.6%) |
| 45 to 54 Years | 1,320 (36.9%) | 1,982 (55.4%) |
| 55 to 64 Years | 1,621 (46.0%) | 2,078 (59.0%) |
| 65 to 74 Years | 2,972 (96.1%) | 1,512 (48.9%) |
| 75 Years and over | 2,018 (99.6%) | 840 (41.4%) |
| Total | 14,174 (53.7%) | 13,389 (50.8%) |
Disability Status by Sex by Age in Carter County
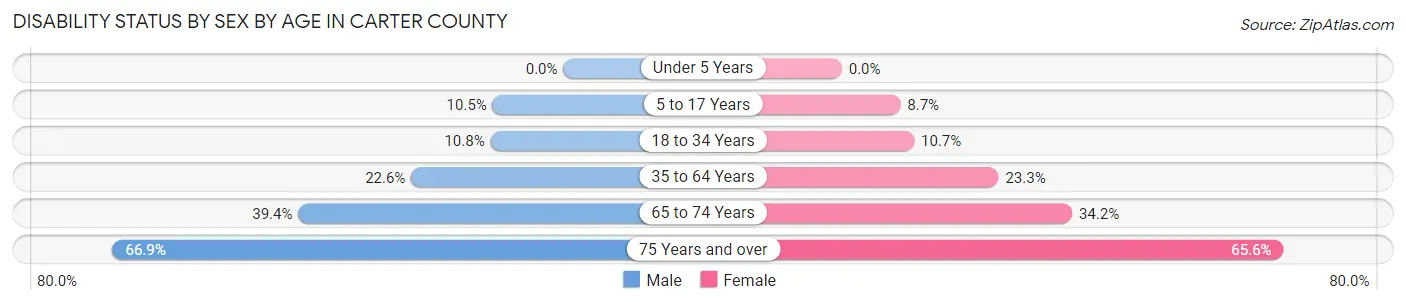
| Age Bracket | Male | Female |
| Under 5 Years | 0 (0.0%) | 0 (0.0%) |
| 5 to 17 Years | 247 (10.5%) | 174 (8.7%) |
| 18 to 34 Years | 284 (10.8%) | 289 (10.7%) |
| 35 to 64 Years | 1,128 (22.6%) | 1,173 (23.3%) |
| 65 to 74 Years | 594 (39.4%) | 541 (34.2%) |
| 75 Years and over | 585 (66.9%) | 756 (65.6%) |
Disability Class by Sex by Age in Carter County
Disability Class: Hearing Difficulty
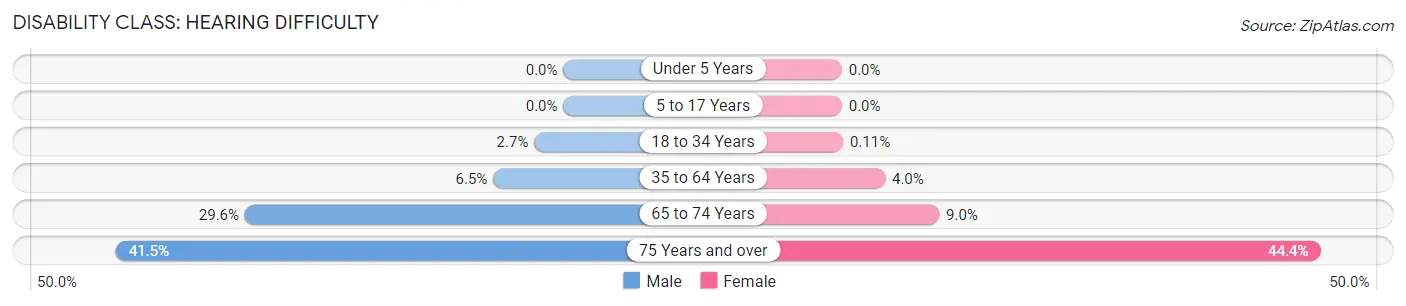
| Age Bracket | Male | Female |
| Under 5 Years | 0 (0.0%) | 0 (0.0%) |
| 5 to 17 Years | 0 (0.0%) | 0 (0.0%) |
| 18 to 34 Years | 71 (2.7%) | 3 (0.1%) |
| 35 to 64 Years | 325 (6.5%) | 202 (4.0%) |
| 65 to 74 Years | 446 (29.6%) | 143 (9.0%) |
| 75 Years and over | 363 (41.5%) | 512 (44.4%) |
Disability Class: Vision Difficulty
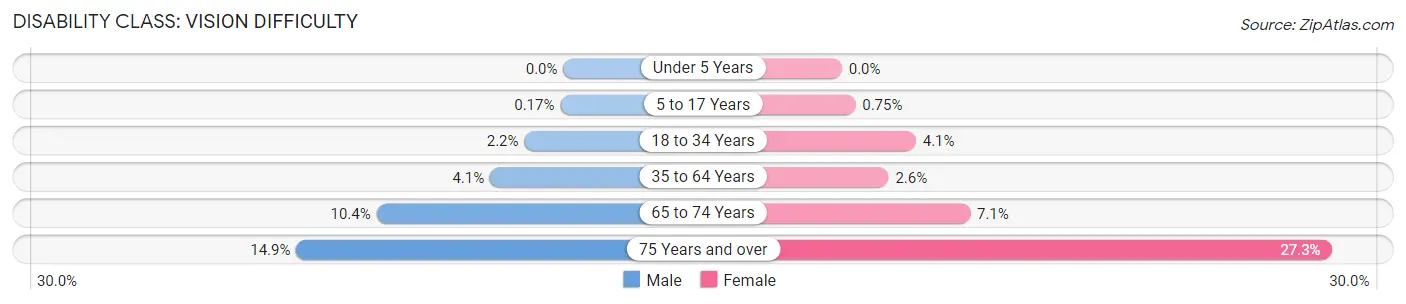
| Age Bracket | Male | Female |
| Under 5 Years | 0 (0.0%) | 0 (0.0%) |
| 5 to 17 Years | 4 (0.2%) | 15 (0.7%) |
| 18 to 34 Years | 57 (2.2%) | 111 (4.1%) |
| 35 to 64 Years | 204 (4.1%) | 131 (2.6%) |
| 65 to 74 Years | 157 (10.4%) | 113 (7.1%) |
| 75 Years and over | 130 (14.9%) | 315 (27.3%) |
Disability Class: Cognitive Difficulty
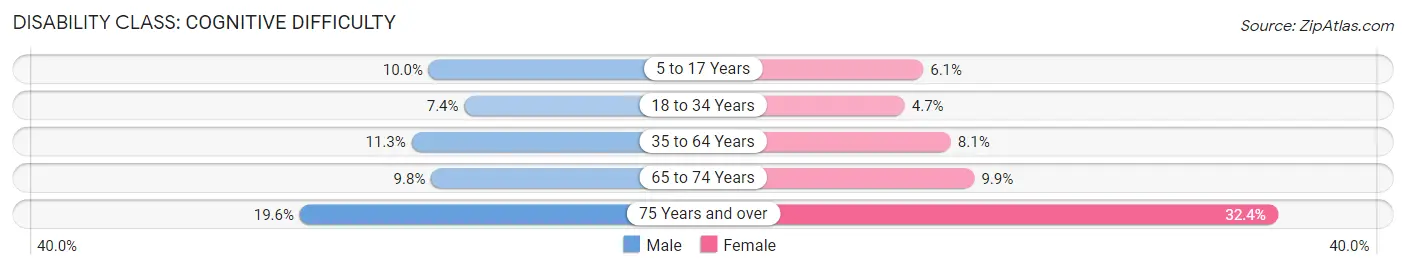
| Age Bracket | Male | Female |
| 5 to 17 Years | 235 (10.0%) | 121 (6.0%) |
| 18 to 34 Years | 193 (7.3%) | 126 (4.7%) |
| 35 to 64 Years | 563 (11.3%) | 408 (8.1%) |
| 65 to 74 Years | 148 (9.8%) | 156 (9.9%) |
| 75 Years and over | 171 (19.6%) | 373 (32.4%) |
Disability Class: Ambulatory Difficulty
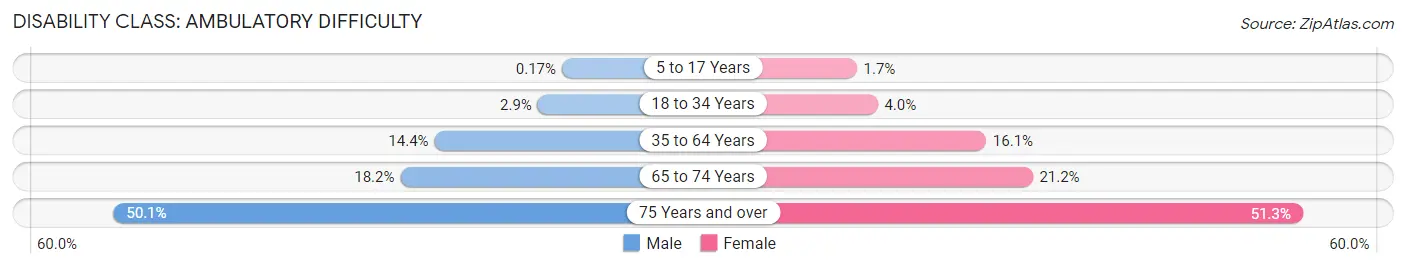
| Age Bracket | Male | Female |
| 5 to 17 Years | 4 (0.2%) | 33 (1.7%) |
| 18 to 34 Years | 75 (2.9%) | 107 (4.0%) |
| 35 to 64 Years | 717 (14.4%) | 809 (16.1%) |
| 65 to 74 Years | 274 (18.2%) | 336 (21.2%) |
| 75 Years and over | 438 (50.1%) | 592 (51.3%) |
Disability Class: Self-Care Difficulty
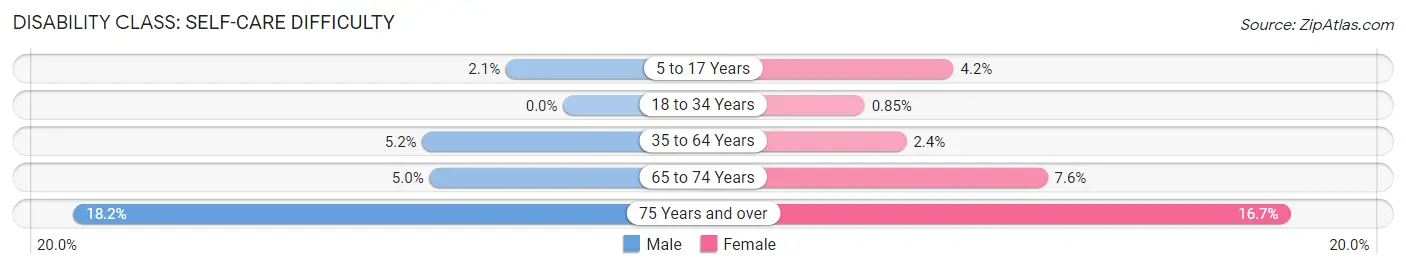
| Age Bracket | Male | Female |
| 5 to 17 Years | 50 (2.1%) | 83 (4.2%) |
| 18 to 34 Years | 0 (0.0%) | 23 (0.9%) |
| 35 to 64 Years | 261 (5.2%) | 121 (2.4%) |
| 65 to 74 Years | 75 (5.0%) | 121 (7.6%) |
| 75 Years and over | 159 (18.2%) | 192 (16.7%) |
Technology Access in Carter County
Computing Device Access in Carter County
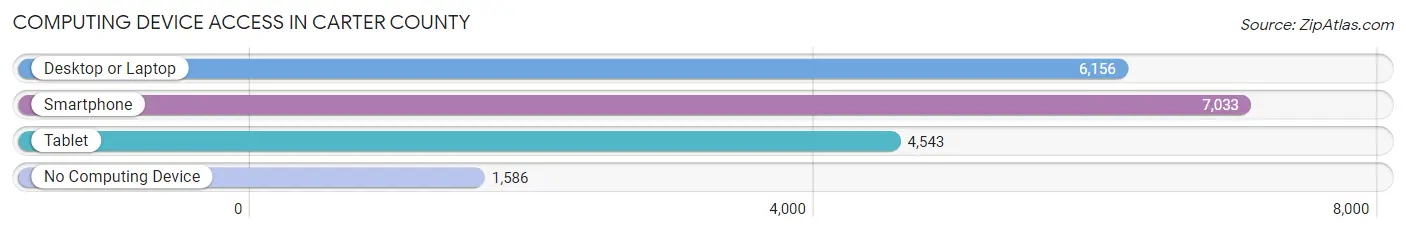
| Device Type | # Households | % Households |
| Desktop or Laptop | 6,156 | 63.0% |
| Smartphone | 7,033 | 71.9% |
| Tablet | 4,543 | 46.5% |
| No Computing Device | 1,586 | 16.2% |
| Total | 9,778 | 100.0% |
Internet Access in Carter County
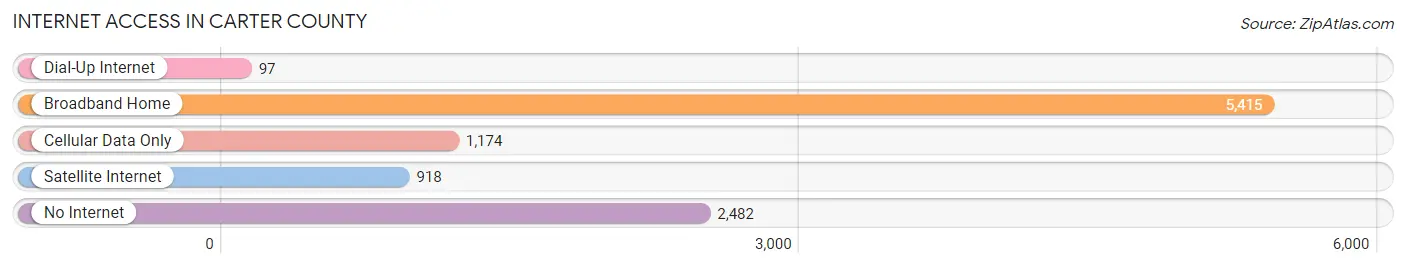
| Internet Type | # Households | % Households |
| Dial-Up Internet | 97 | 1.0% |
| Broadband Home | 5,415 | 55.4% |
| Cellular Data Only | 1,174 | 12.0% |
| Satellite Internet | 918 | 9.4% |
| No Internet | 2,482 | 25.4% |
| Total | 9,778 | 100.0% |
Carter County Summary
Carter County is located in northeastern Kentucky, in the foothills of the Appalachian Mountains. It is bordered by Boyd County to the north, Elliott County to the east, Lawrence County to the south, and Greenup County to the west. The county seat is Grayson, and the largest city is Olive Hill. The county was formed in 1838 from parts of Greenup and Lawrence counties, and was named for Colonel William Grayson Carter, a veteran of the War of 1812.
Geography
Carter County covers an area of 437 square miles, of which 434 square miles is land and 3 square miles is water. The county is located in the Eastern Coal Field region of Kentucky, and is part of the Big Sandy River watershed. The terrain is mostly hilly, with some flat areas in the valleys. The highest point in the county is located at the summit of Little Blaine Mountain, at an elevation of 1,717 feet. The county is home to several state parks, including Carter Caves State Resort Park, Grayson Lake State Park, and Greenbo Lake State Resort Park.
Demographics
As of the 2010 census, the population of Carter County was 27,720, making it the 48th most populous county in Kentucky. The population density was 63.3 people per square mile. The racial makeup of the county was 95.3% White, 2.7% Black or African American, 0.3% Native American, 0.2% Asian, 0.2% from other races, and 1.3% from two or more races. 1.3% of the population were Hispanic or Latino of any race.
The median income for a household in the county was $30,945, and the median income for a family was $37,945. The per capita income for the county was $16,845. About 17.2% of the population were below the poverty line.
Economy
Carter County is largely rural, and the economy is based on agriculture and tourism. The county is home to several large farms, and the main crops are corn, soybeans, and hay. The county is also home to several wineries, and the tourism industry is centered around the state parks. The county is also home to several manufacturing companies, including a furniture factory, a plastics factory, and a metal fabrication plant.
History
Carter County was formed in 1838 from parts of Greenup and Lawrence counties. The county was named for Colonel William Grayson Carter, a veteran of the War of 1812. The county seat was established in Grayson in 1839.
The county was largely rural until the late 19th century, when the railroad was built through the county. This led to the development of several small towns, including Olive Hill, which became the largest city in the county. The county was also home to several coal mines, which provided employment for many of the residents.
In the early 20th century, the county was home to several large farms, and the main crops were corn, soybeans, and hay. The county was also home to several wineries, and the tourism industry was centered around the state parks.
In the late 20th century, the county experienced a decline in population as people moved away in search of better economic opportunities. However, the county has seen a resurgence in recent years, as people have moved back to the area to take advantage of the low cost of living and the natural beauty of the area.
Common Questions
What is Per Capita Income in Carter County?
Per Capita income in Carter County is $24,949.
What is the Median Family Income in Carter County?
Median Family Income in Carter County is $60,536.
What is the Median Household income in Carter County?
Median Household Income in Carter County is $47,004.
What is Income or Wage Gap in Carter County?
Income or Wage Gap in Carter County is 33.1%.
Women in Carter County earn 66.9 cents for every dollar earned by a man.
What is Family Income Deficit in Carter County?
Family Income Deficit in Carter County is $11,956.
Families that are below poverty line in Carter County earn $11,956 less on average than the poverty threshold level.
What is Inequality or Gini Index in Carter County?
Inequality or Gini Index in Carter County is 0.51.
What is the Total Population of Carter County?
Total Population of Carter County is 26,671.
What is the Total Male Population of Carter County?
Total Male Population of Carter County is 13,343.
What is the Total Female Population of Carter County?
Total Female Population of Carter County is 13,328.
What is the Ratio of Males per 100 Females in Carter County?
There are 100.11 Males per 100 Females in Carter County.
What is the Ratio of Females per 100 Males in Carter County?
There are 99.89 Females per 100 Males in Carter County.
What is the Median Population Age in Carter County?
Median Population Age in Carter County is 41.9 Years.
What is the Average Family Size in Carter County
Average Family Size in Carter County is 3.2 People.
What is the Average Household Size in Carter County
Average Household Size in Carter County is 2.7 People.
How Large is the Labor Force in Carter County?
There are 9,758 People in the Labor Forcein in Carter County.
What is the Percentage of People in the Labor Force in Carter County?
45.4% of People are in the Labor Force in Carter County.
What is the Unemployment Rate in Carter County?
Unemployment Rate in Carter County is 6.0%.