Carlisle County, KY Map & Demographics
Carlisle County Map
Carlisle County Overview
$31,403
PER CAPITA INCOME
$66,250
AVG FAMILY INCOME
$53,065
AVG HOUSEHOLD INCOME
34.5%
WAGE / INCOME GAP [ % ]
65.5¢/ $1
WAGE / INCOME GAP [ $ ]
0.51
INEQUALITY / GINI INDEX
4,782
TOTAL POPULATION
2,402
MALE POPULATION
2,380
FEMALE POPULATION
100.92
MALES / 100 FEMALES
99.08
FEMALES / 100 MALES
42.9
MEDIAN AGE
3.0
AVG FAMILY SIZE
2.5
AVG HOUSEHOLD SIZE
1,906
LABOR FORCE [ PEOPLE ]
50.3%
PERCENT IN LABOR FORCE
4.2%
UNEMPLOYMENT RATE
Carlisle County Area Codes
Income in Carlisle County
Income Overview in Carlisle County
Per Capita Income in Carlisle County is $31,403, while median incomes of families and households are $66,250 and $53,065 respectively.
| Characteristic | Number | Measure |
| Per Capita Income | 4,782 | $31,403 |
| Median Family Income | 1,332 | $66,250 |
| Mean Family Income | 1,332 | $91,986 |
| Median Household Income | 1,905 | $53,065 |
| Mean Household Income | 1,905 | $77,657 |
| Income Deficit | 1,332 | $0 |
| Wage / Income Gap (%) | 4,782 | 34.55% |
| Wage / Income Gap ($) | 4,782 | 65.45¢ per $1 |
| Gini / Inequality Index | 4,782 | 0.51 |
Earnings by Sex in Carlisle County
Average Earnings in Carlisle County are $33,100, $38,983 for men and $25,515 for women, a difference of 34.5%.
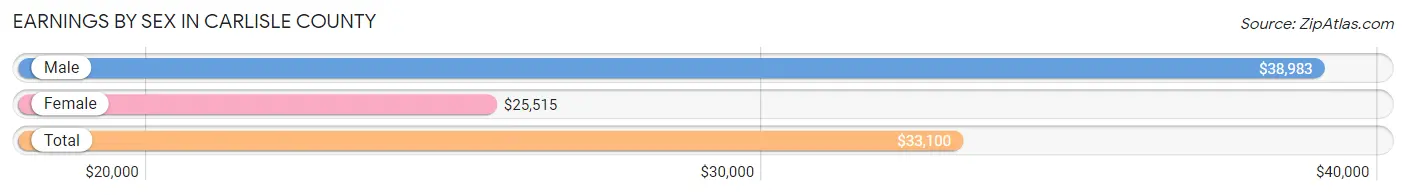
| Sex | Number | Average Earnings |
| Male | 1,075 (53.3%) | $38,983 |
| Female | 941 (46.7%) | $25,515 |
| Total | 2,016 (100.0%) | $33,100 |
Earnings by Sex by Income Bracket in Carlisle County
The most common earnings brackets in Carlisle County are $100,000+ for men (191 | 17.8%) and $30,000 to $34,999 for women (100 | 10.6%).
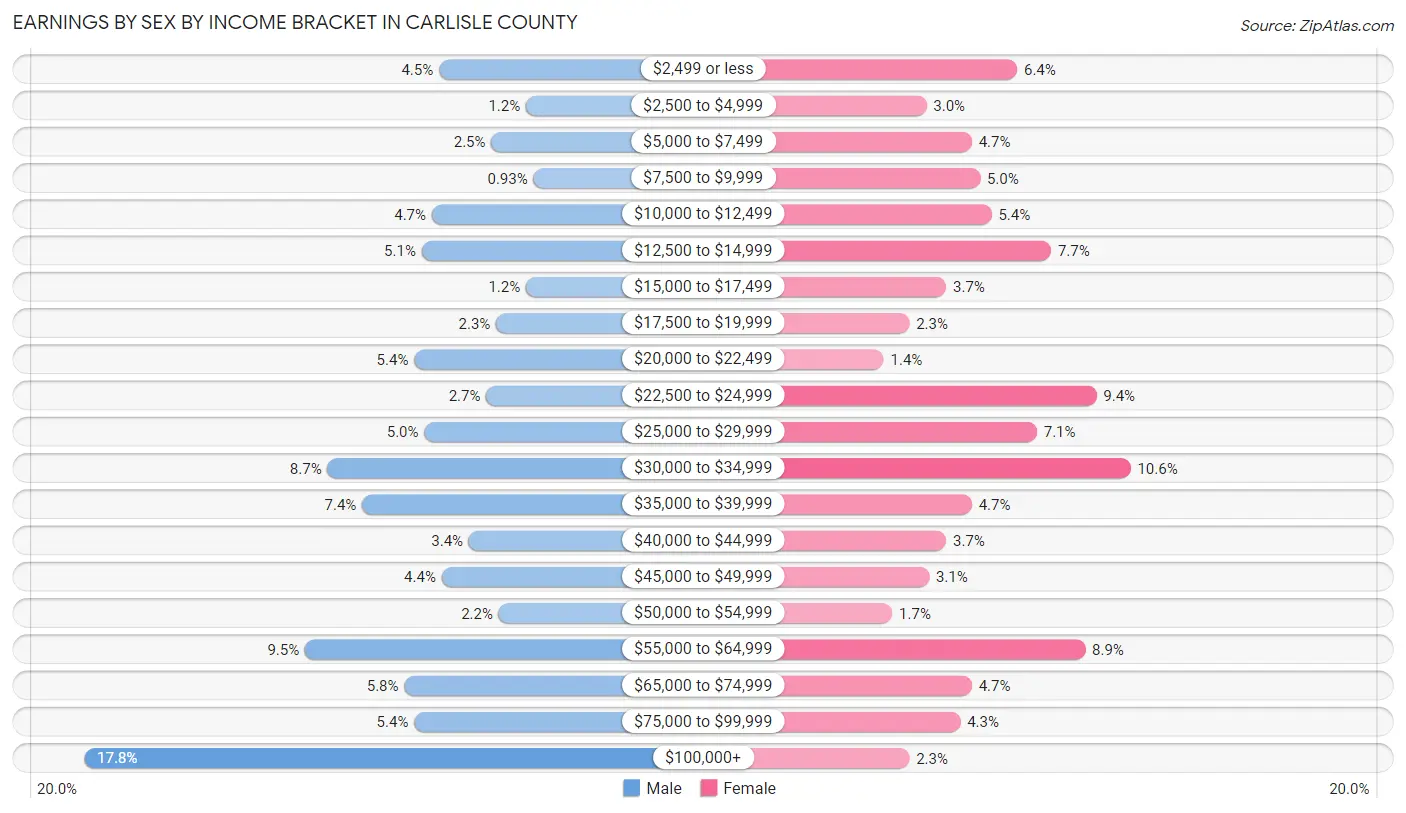
| Income | Male | Female |
| $2,499 or less | 48 (4.5%) | 60 (6.4%) |
| $2,500 to $4,999 | 13 (1.2%) | 28 (3.0%) |
| $5,000 to $7,499 | 27 (2.5%) | 44 (4.7%) |
| $7,500 to $9,999 | 10 (0.9%) | 47 (5.0%) |
| $10,000 to $12,499 | 51 (4.7%) | 51 (5.4%) |
| $12,500 to $14,999 | 55 (5.1%) | 72 (7.6%) |
| $15,000 to $17,499 | 13 (1.2%) | 35 (3.7%) |
| $17,500 to $19,999 | 25 (2.3%) | 22 (2.3%) |
| $20,000 to $22,499 | 58 (5.4%) | 13 (1.4%) |
| $22,500 to $24,999 | 29 (2.7%) | 88 (9.3%) |
| $25,000 to $29,999 | 54 (5.0%) | 67 (7.1%) |
| $30,000 to $34,999 | 93 (8.6%) | 100 (10.6%) |
| $35,000 to $39,999 | 79 (7.3%) | 44 (4.7%) |
| $40,000 to $44,999 | 36 (3.4%) | 35 (3.7%) |
| $45,000 to $49,999 | 47 (4.4%) | 29 (3.1%) |
| $50,000 to $54,999 | 24 (2.2%) | 16 (1.7%) |
| $55,000 to $64,999 | 102 (9.5%) | 84 (8.9%) |
| $65,000 to $74,999 | 62 (5.8%) | 44 (4.7%) |
| $75,000 to $99,999 | 58 (5.4%) | 40 (4.3%) |
| $100,000+ | 191 (17.8%) | 22 (2.3%) |
| Total | 1,075 (100.0%) | 941 (100.0%) |
Earnings by Sex by Educational Attainment in Carlisle County
Average earnings in Carlisle County are $45,559 for men and $26,023 for women, a difference of 42.9%. Men with an educational attainment of bachelor's degree enjoy the highest average annual earnings of $75,938, while those with less than high school education earn the least with $37,500. Women with an educational attainment of bachelor's degree earn the most with the average annual earnings of $47,273, while those with high school diploma education have the smallest earnings of $23,995.
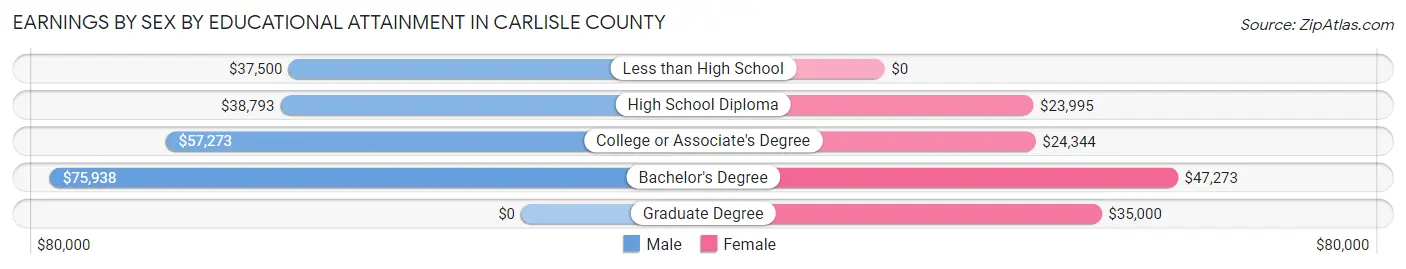
| Educational Attainment | Male Income | Female Income |
| Less than High School | $37,500 | $0 |
| High School Diploma | $38,793 | $23,995 |
| College or Associate's Degree | $57,273 | $24,344 |
| Bachelor's Degree | $75,938 | $47,273 |
| Graduate Degree | - | - |
| Total | $45,559 | $26,023 |
Family Income in Carlisle County
Family Income Brackets in Carlisle County
According to the Carlisle County family income data, there are 253 families falling into the $100,000 to $149,999 income range, which is the most common income bracket and makes up 19.0% of all families. Conversely, the less than $10,000 income bracket is the least frequent group with only 43 families (3.2%) belonging to this category.
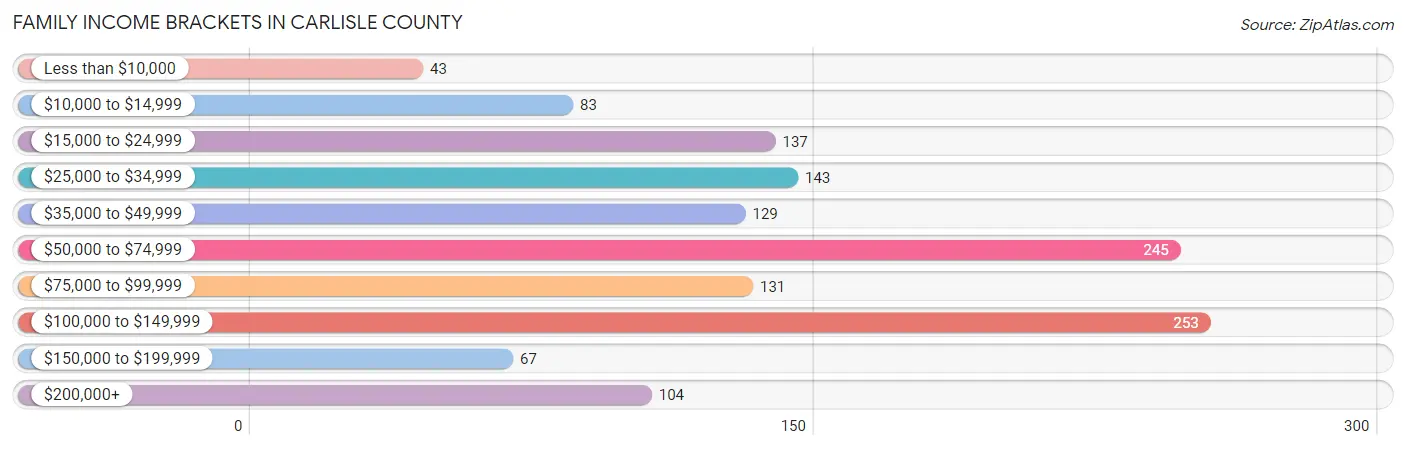
| Income Bracket | # Families | % Families |
| Less than $10,000 | 43 | 3.2% |
| $10,000 to $14,999 | 83 | 6.2% |
| $15,000 to $24,999 | 137 | 10.3% |
| $25,000 to $34,999 | 143 | 10.7% |
| $35,000 to $49,999 | 129 | 9.7% |
| $50,000 to $74,999 | 245 | 18.4% |
| $75,000 to $99,999 | 131 | 9.8% |
| $100,000 to $149,999 | 253 | 19.0% |
| $150,000 to $199,999 | 67 | 5.0% |
| $200,000+ | 104 | 7.8% |
Family Income by Famaliy Size in Carlisle County
4-person families (205 | 15.4%) account for the highest median family income in Carlisle County with $107,798 per family, while 3-person families (290 | 21.8%) have the highest median income of $27,917 per family member.
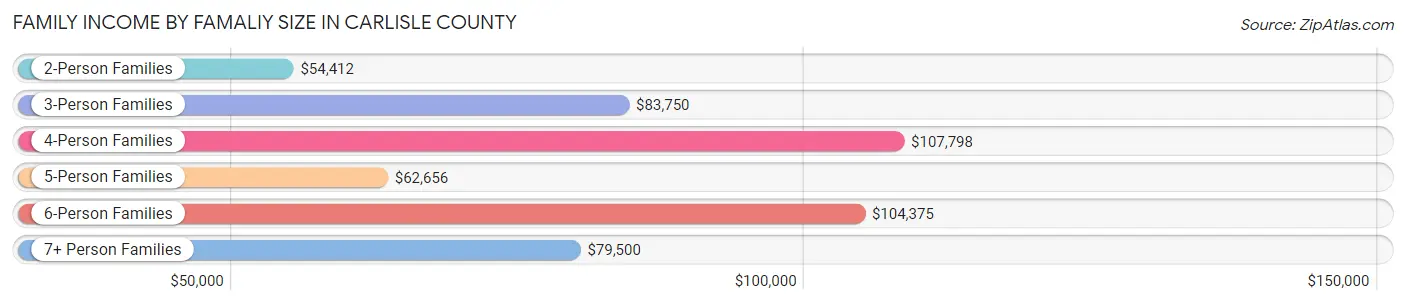
| Income Bracket | # Families | Median Income |
| 2-Person Families | 682 (51.2%) | $54,412 |
| 3-Person Families | 290 (21.8%) | $83,750 |
| 4-Person Families | 205 (15.4%) | $107,798 |
| 5-Person Families | 101 (7.6%) | $62,656 |
| 6-Person Families | 14 (1.1%) | $104,375 |
| 7+ Person Families | 40 (3.0%) | $79,500 |
| Total | 1,332 (100.0%) | $66,250 |
Family Income by Number of Earners in Carlisle County
The median family income in Carlisle County is $66,250, with families comprising 3+ earners (101) having the highest median family income of $147,813, while families with 1 earner (510) have the lowest median family income of $37,941, accounting for 7.6% and 38.3% of families, respectively.
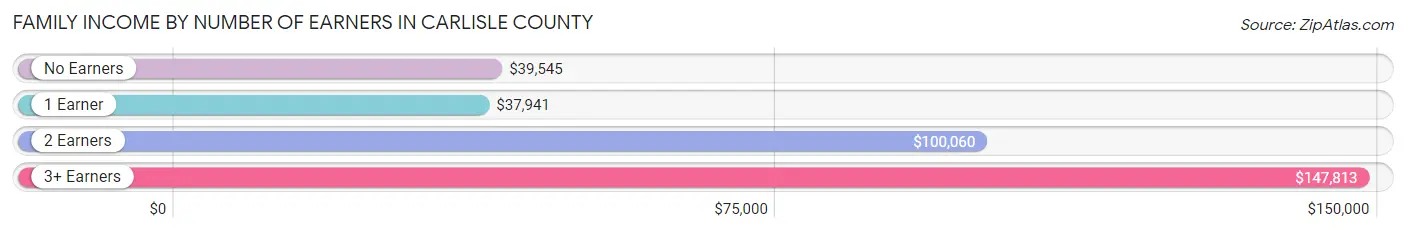
| Number of Earners | # Families | Median Income |
| No Earners | 302 (22.7%) | $39,545 |
| 1 Earner | 510 (38.3%) | $37,941 |
| 2 Earners | 419 (31.5%) | $100,060 |
| 3+ Earners | 101 (7.6%) | $147,813 |
| Total | 1,332 (100.0%) | $66,250 |
Household Income in Carlisle County
Household Income Brackets in Carlisle County
With 345 households falling in the category, the $50,000 to $74,999 income range is the most frequent in Carlisle County, accounting for 18.1% of all households. In contrast, only 67 households (3.5%) fall into the $150,000 to $199,999 income bracket, making it the least populous group.
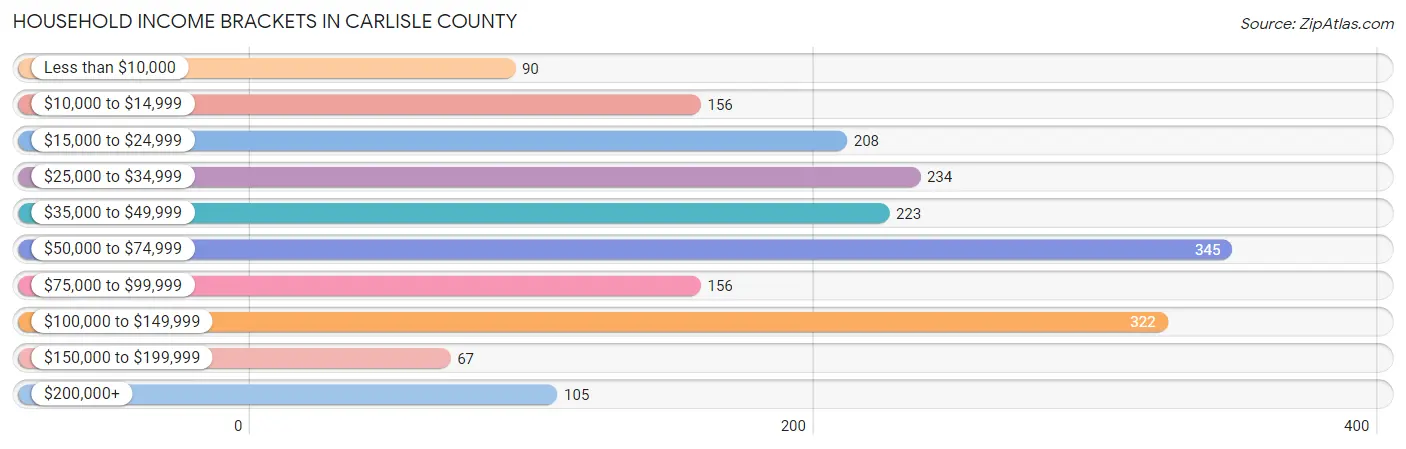
| Income Bracket | # Households | % Households |
| Less than $10,000 | 90 | 4.7% |
| $10,000 to $14,999 | 156 | 8.2% |
| $15,000 to $24,999 | 208 | 10.9% |
| $25,000 to $34,999 | 234 | 12.3% |
| $35,000 to $49,999 | 223 | 11.7% |
| $50,000 to $74,999 | 345 | 18.1% |
| $75,000 to $99,999 | 156 | 8.2% |
| $100,000 to $149,999 | 322 | 16.9% |
| $150,000 to $199,999 | 67 | 3.5% |
| $200,000+ | 105 | 5.5% |
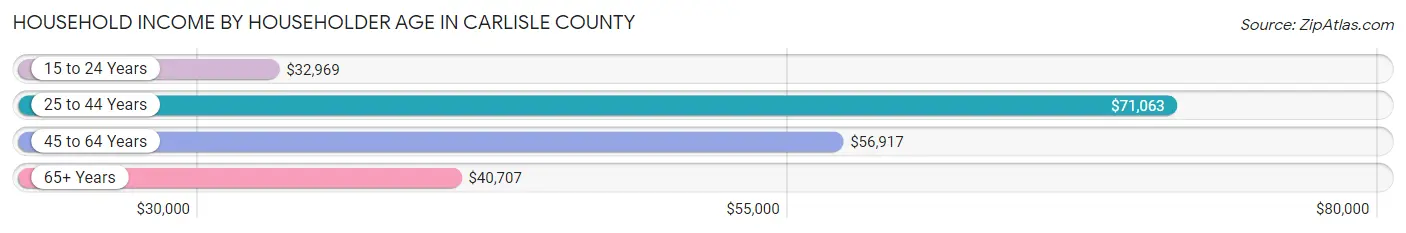
Household Income by Householder Age in Carlisle County
The median household income in Carlisle County is $53,065, with the highest median household income of $71,063 found in the 25 to 44 years age bracket for the primary householder. A total of 500 households (26.3%) fall into this category. Meanwhile, the 15 to 24 years age bracket for the primary householder has the lowest median household income of $32,969, with 75 households (3.9%) in this group.
| Income Bracket | # Households | Median Income |
| 15 to 24 Years | 75 (3.9%) | $32,969 |
| 25 to 44 Years | 500 (26.3%) | $71,063 |
| 45 to 64 Years | 715 (37.5%) | $56,917 |
| 65+ Years | 615 (32.3%) | $40,707 |
| Total | 1,905 (100.0%) | $53,065 |
Poverty in Carlisle County
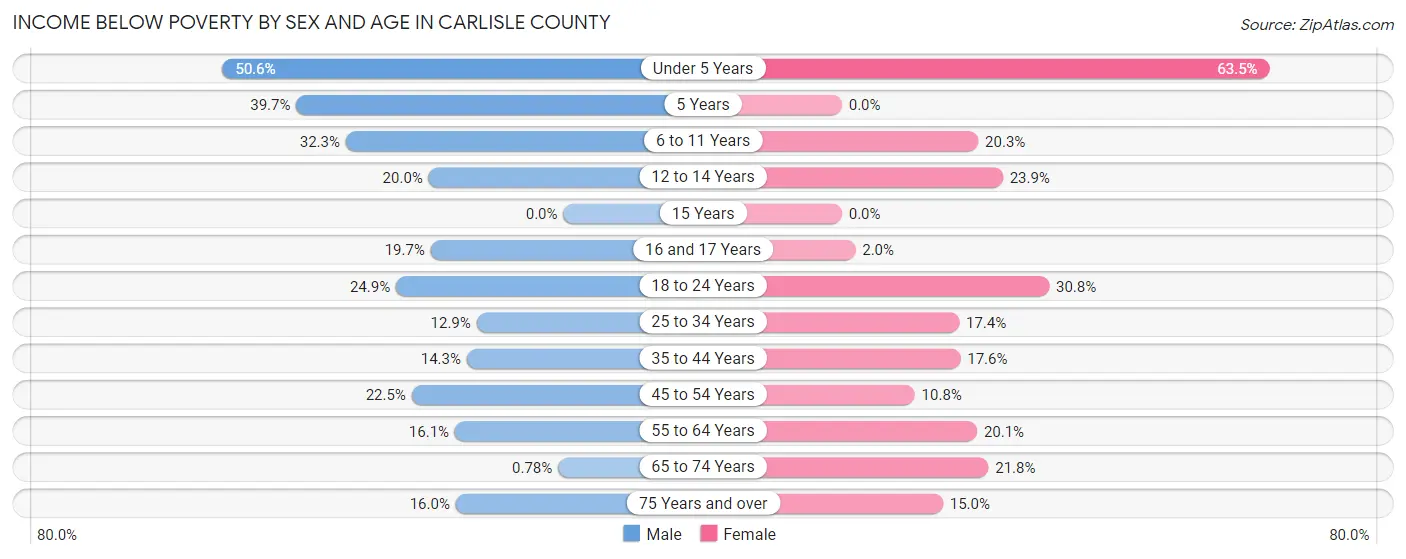
Income Below Poverty by Sex and Age in Carlisle County
With 19.2% poverty level for males and 21.0% for females among the residents of Carlisle County, under 5 year old males and under 5 year old females are the most vulnerable to poverty, with 79 males (50.6%) and 87 females (63.5%) in their respective age groups living below the poverty level.
| Age Bracket | Male | Female |
| Under 5 Years | 79 (50.6%) | 87 (63.5%) |
| 5 Years | 23 (39.7%) | 0 (0.0%) |
| 6 to 11 Years | 52 (32.3%) | 32 (20.3%) |
| 12 to 14 Years | 27 (20.0%) | 27 (23.9%) |
| 15 Years | 0 (0.0%) | 0 (0.0%) |
| 16 and 17 Years | 13 (19.7%) | 1 (2.0%) |
| 18 to 24 Years | 41 (24.8%) | 60 (30.8%) |
| 25 to 34 Years | 34 (12.9%) | 51 (17.4%) |
| 35 to 44 Years | 39 (14.3%) | 47 (17.6%) |
| 45 to 54 Years | 68 (22.5%) | 33 (10.8%) |
| 55 to 64 Years | 52 (16.1%) | 61 (20.1%) |
| 65 to 74 Years | 2 (0.8%) | 57 (21.8%) |
| 75 Years and over | 27 (16.0%) | 36 (15.0%) |
| Total | 457 (19.2%) | 492 (21.0%) |
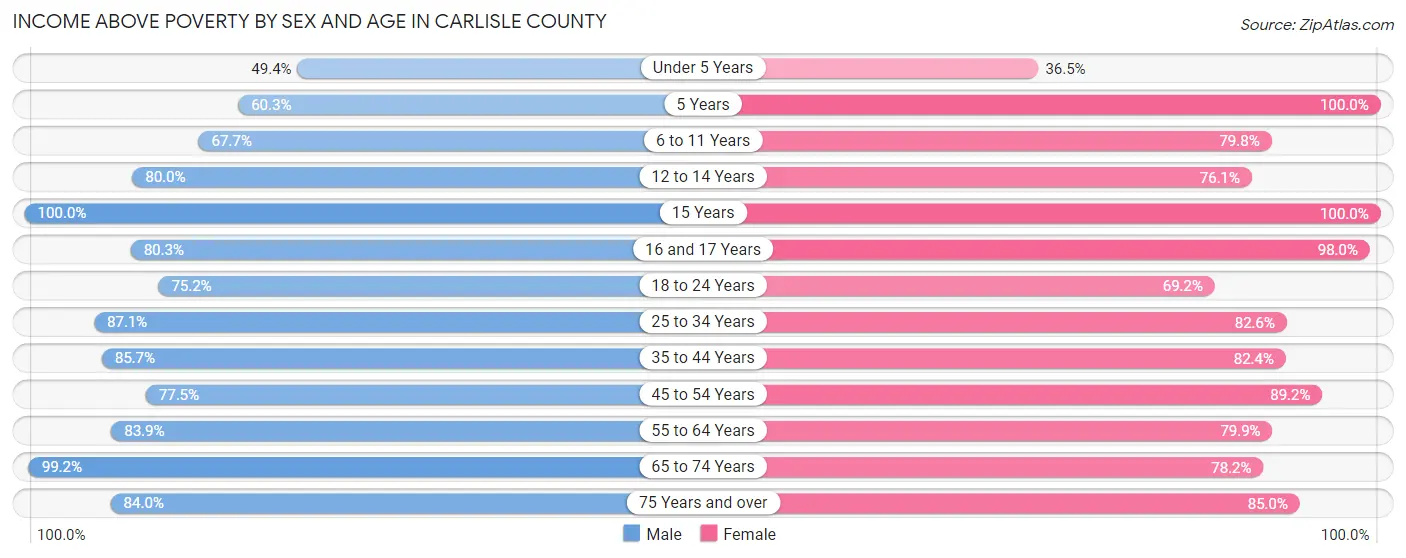
Income Above Poverty by Sex and Age in Carlisle County
According to the poverty statistics in Carlisle County, males aged 15 years and females aged 5 years are the age groups that are most secure financially, with 100.0% of males and 100.0% of females in these age groups living above the poverty line.
| Age Bracket | Male | Female |
| Under 5 Years | 77 (49.4%) | 50 (36.5%) |
| 5 Years | 35 (60.3%) | 9 (100.0%) |
| 6 to 11 Years | 109 (67.7%) | 126 (79.7%) |
| 12 to 14 Years | 108 (80.0%) | 86 (76.1%) |
| 15 Years | 52 (100.0%) | 13 (100.0%) |
| 16 and 17 Years | 53 (80.3%) | 49 (98.0%) |
| 18 to 24 Years | 124 (75.1%) | 135 (69.2%) |
| 25 to 34 Years | 230 (87.1%) | 242 (82.6%) |
| 35 to 44 Years | 233 (85.7%) | 220 (82.4%) |
| 45 to 54 Years | 234 (77.5%) | 272 (89.2%) |
| 55 to 64 Years | 271 (83.9%) | 243 (79.9%) |
| 65 to 74 Years | 254 (99.2%) | 205 (78.2%) |
| 75 Years and over | 142 (84.0%) | 204 (85.0%) |
| Total | 1,922 (80.8%) | 1,854 (79.0%) |
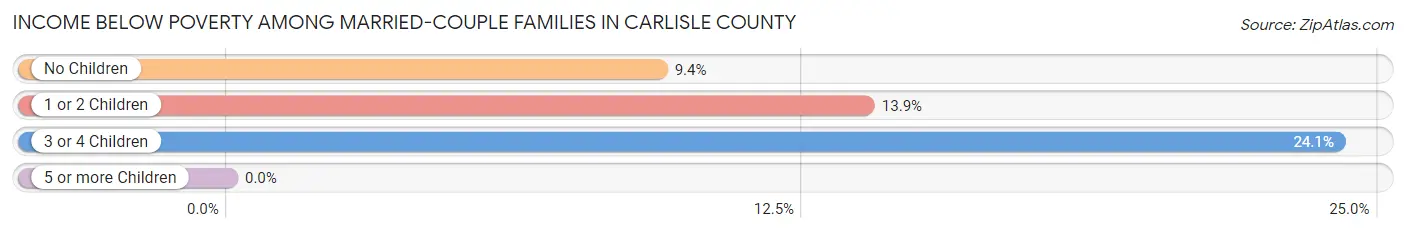
Income Below Poverty Among Married-Couple Families in Carlisle County
The poverty statistics for married-couple families in Carlisle County show that 11.7% or 114 of the total 971 families live below the poverty line. Families with 3 or 4 children have the highest poverty rate of 24.1%, comprising of 20 families. On the other hand, families with 5 or more children have the lowest poverty rate of 0.0%, which includes 0 families.
| Children | Above Poverty | Below Poverty |
| No Children | 504 (90.6%) | 52 (9.3%) |
| 1 or 2 Children | 261 (86.1%) | 42 (13.9%) |
| 3 or 4 Children | 63 (75.9%) | 20 (24.1%) |
| 5 or more Children | 29 (100.0%) | 0 (0.0%) |
| Total | 857 (88.3%) | 114 (11.7%) |
Income Below Poverty Among Single-Parent Households in Carlisle County
According to the poverty data in Carlisle County, 2.0% or 3 single-father households and 41.6% or 89 single-mother households are living below the poverty line. Among single-father households, those with 1 or 2 children have the highest poverty rate, with 3 households (4.0%) experiencing poverty. Likewise, among single-mother households, those with 3 or 4 children have the highest poverty rate, with 50 households (96.2%) falling below the poverty line.
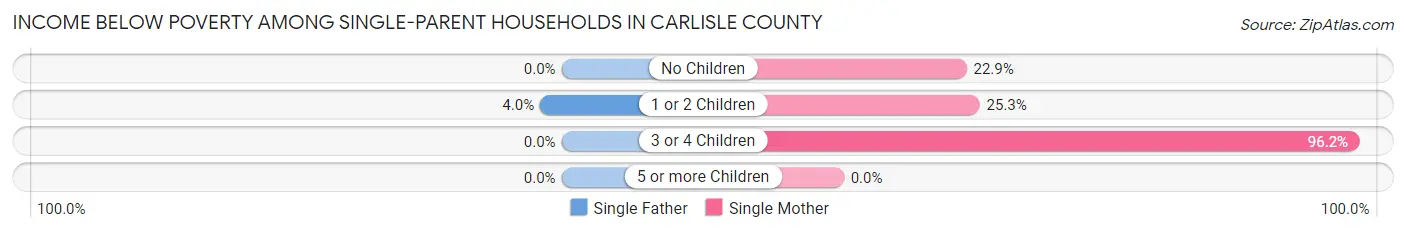
| Children | Single Father | Single Mother |
| No Children | 0 (0.0%) | 19 (22.9%) |
| 1 or 2 Children | 3 (4.0%) | 20 (25.3%) |
| 3 or 4 Children | 0 (0.0%) | 50 (96.2%) |
| 5 or more Children | 0 (0.0%) | 0 (0.0%) |
| Total | 3 (2.0%) | 89 (41.6%) |
Income Below Poverty Among Married-Couple vs Single-Parent Households in Carlisle County
The poverty data for Carlisle County shows that 114 of the married-couple family households (11.7%) and 92 of the single-parent households (25.5%) are living below the poverty level. Within the married-couple family households, those with 3 or 4 children have the highest poverty rate, with 20 households (24.1%) falling below the poverty line. Among the single-parent households, those with 3 or 4 children have the highest poverty rate, with 50 household (96.2%) living below poverty.
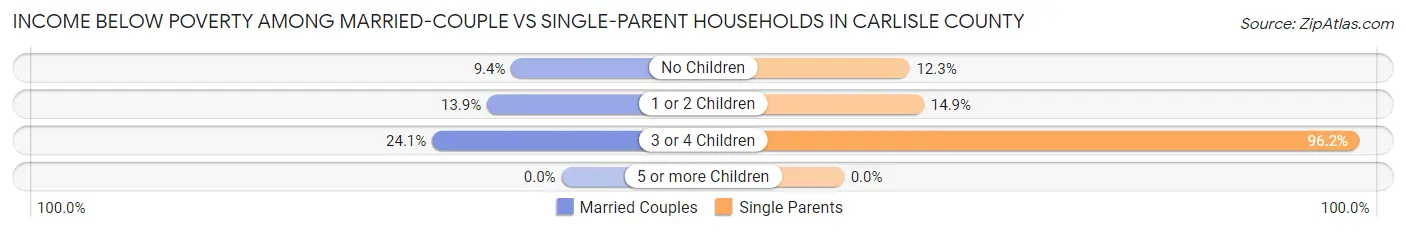
| Children | Married-Couple Families | Single-Parent Households |
| No Children | 52 (9.3%) | 19 (12.3%) |
| 1 or 2 Children | 42 (13.9%) | 23 (14.9%) |
| 3 or 4 Children | 20 (24.1%) | 50 (96.2%) |
| 5 or more Children | 0 (0.0%) | 0 (0.0%) |
| Total | 114 (11.7%) | 92 (25.5%) |
Race in Carlisle County
The most populous races in Carlisle County are White / Caucasian (4,481 | 93.7%), Two or more Races (180 | 3.8%), and Hispanic or Latino (118 | 2.5%).
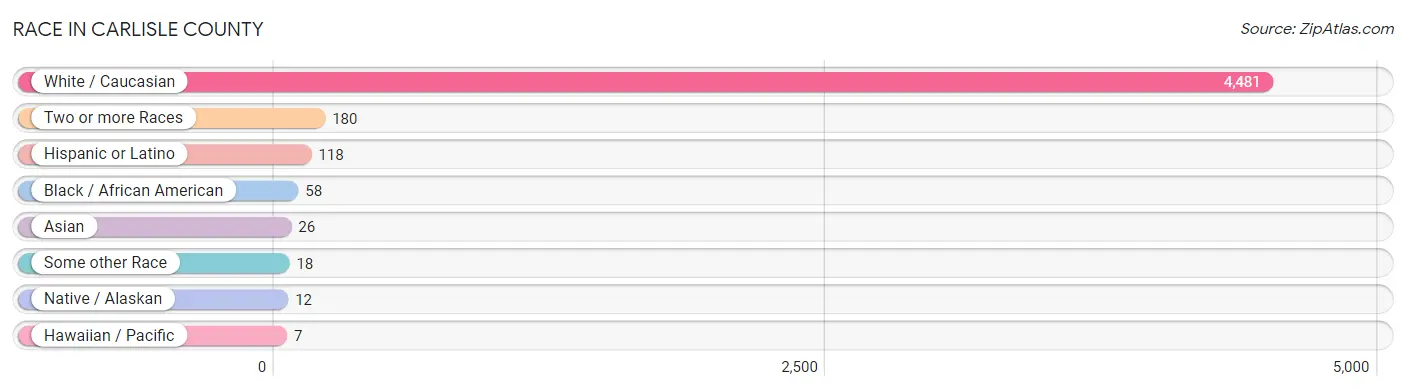
| Race | # Population | % Population |
| Asian | 26 | 0.5% |
| Black / African American | 58 | 1.2% |
| Hawaiian / Pacific | 7 | 0.2% |
| Hispanic or Latino | 118 | 2.5% |
| Native / Alaskan | 12 | 0.3% |
| White / Caucasian | 4,481 | 93.7% |
| Two or more Races | 180 | 3.8% |
| Some other Race | 18 | 0.4% |
| Total | 4,782 | 100.0% |
Ancestry in Carlisle County
The most populous ancestries reported in Carlisle County are English (1,532 | 32.0%), Irish (342 | 7.1%), American (331 | 6.9%), German (315 | 6.6%), and Mexican (99 | 2.1%), together accounting for 54.8% of all Carlisle County residents.
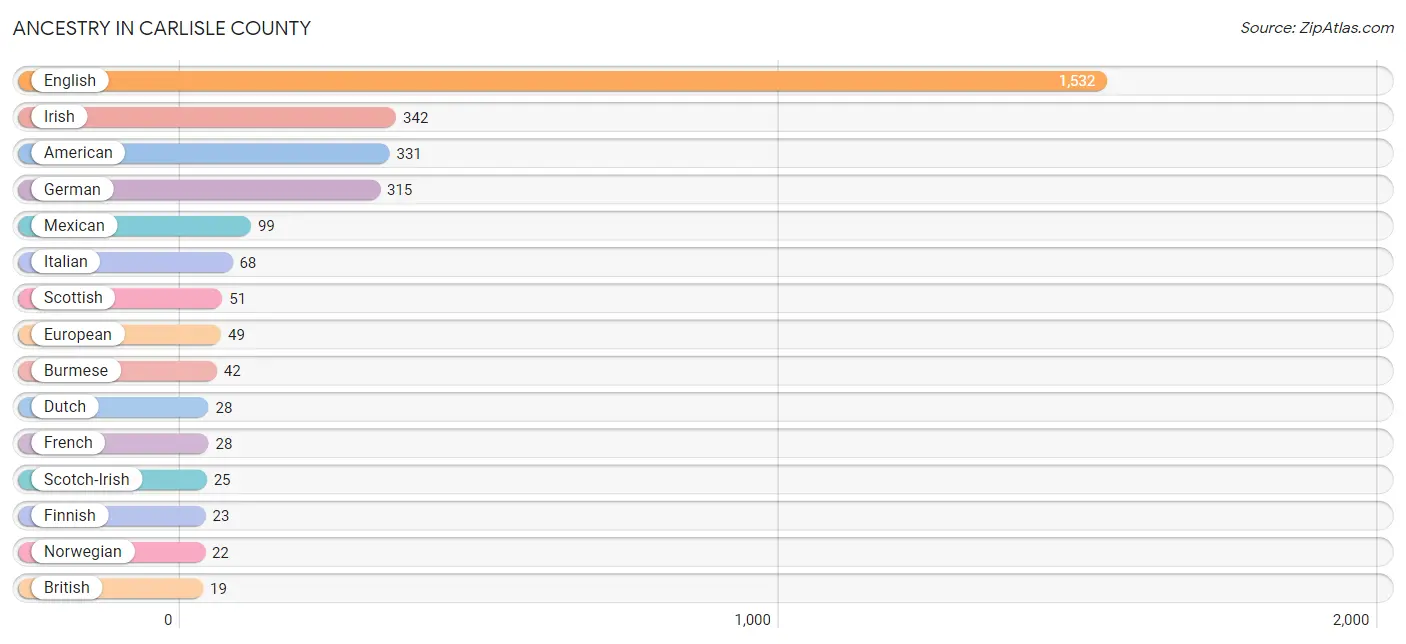
| Ancestry | # Population | % Population |
| American | 331 | 6.9% |
| Arab | 7 | 0.2% |
| British | 19 | 0.4% |
| Burmese | 42 | 0.9% |
| Canadian | 1 | 0.0% |
| Cherokee | 11 | 0.2% |
| Croatian | 13 | 0.3% |
| Dutch | 28 | 0.6% |
| Eastern European | 2 | 0.0% |
| English | 1,532 | 32.0% |
| European | 49 | 1.0% |
| Finnish | 23 | 0.5% |
| French | 28 | 0.6% |
| German | 315 | 6.6% |
| Guamanian / Chamorro | 16 | 0.3% |
| Hungarian | 9 | 0.2% |
| Irish | 342 | 7.1% |
| Italian | 68 | 1.4% |
| Mexican | 99 | 2.1% |
| Norwegian | 22 | 0.5% |
| Pakistani | 5 | 0.1% |
| Scandinavian | 2 | 0.0% |
| Scotch-Irish | 25 | 0.5% |
| Scottish | 51 | 1.1% |
| Spanish | 12 | 0.3% |
| Swedish | 8 | 0.2% |
| Welsh | 9 | 0.2% | View All 27 Rows |
Immigrants in Carlisle County
The most numerous immigrant groups reported in Carlisle County came from Asia (32 | 0.7%), India (20 | 0.4%), South Central Asia (20 | 0.4%), Saudi Arabia (7 | 0.2%), and Western Asia (7 | 0.2%), together accounting for 1.8% of all Carlisle County residents.
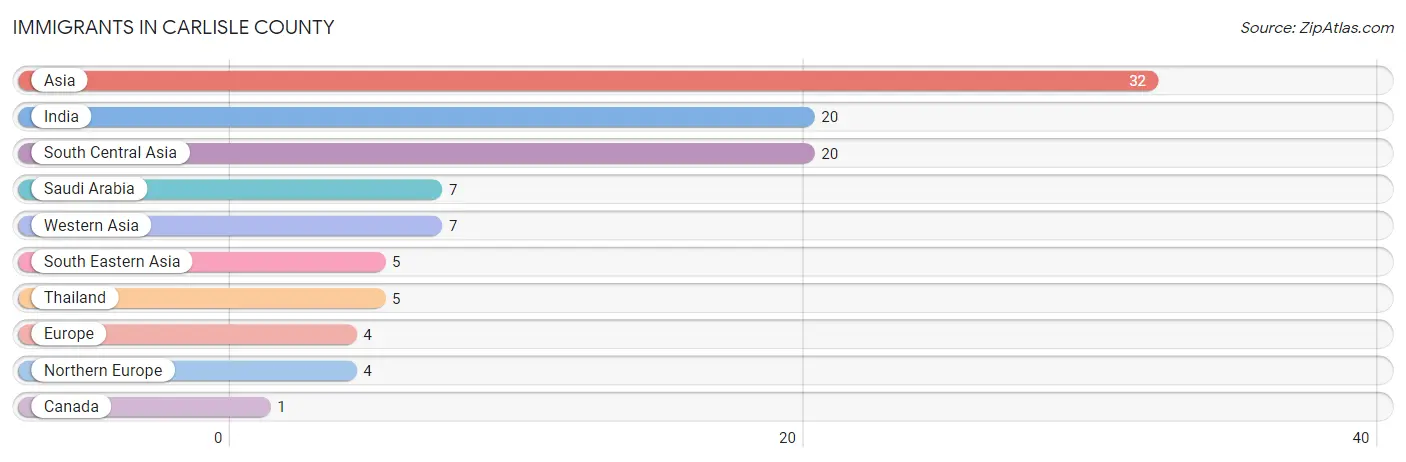
| Immigration Origin | # Population | % Population |
| Asia | 32 | 0.7% |
| Canada | 1 | 0.0% |
| Europe | 4 | 0.1% |
| India | 20 | 0.4% |
| Northern Europe | 4 | 0.1% |
| Saudi Arabia | 7 | 0.2% |
| South Central Asia | 20 | 0.4% |
| South Eastern Asia | 5 | 0.1% |
| Thailand | 5 | 0.1% |
| Western Asia | 7 | 0.2% | View All 10 Rows |
Sex and Age in Carlisle County
Sex and Age in Carlisle County
The most populous age groups in Carlisle County are 5 to 9 Years (180 | 7.5%) for men and 60 to 64 Years (206 | 8.7%) for women.
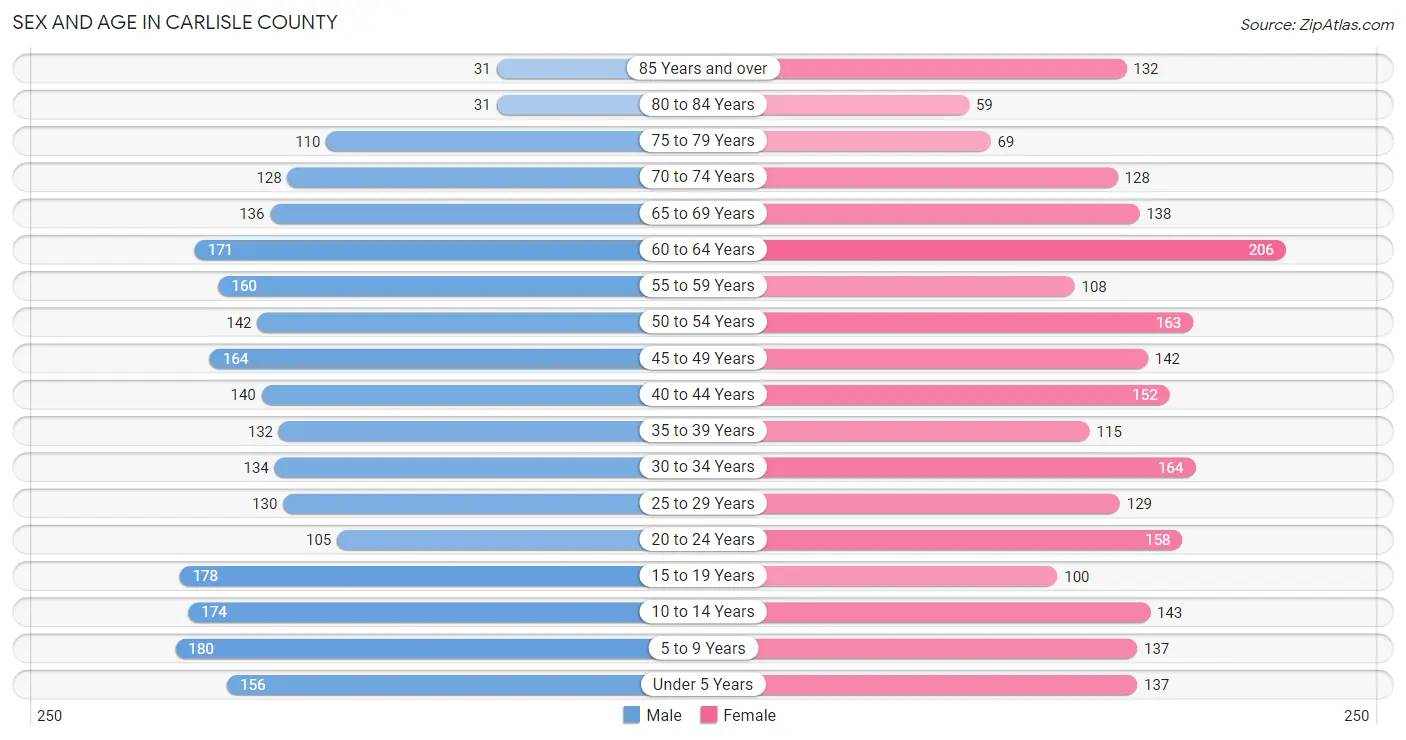
| Age Bracket | Male | Female |
| Under 5 Years | 156 (6.5%) | 137 (5.8%) |
| 5 to 9 Years | 180 (7.5%) | 137 (5.8%) |
| 10 to 14 Years | 174 (7.2%) | 143 (6.0%) |
| 15 to 19 Years | 178 (7.4%) | 100 (4.2%) |
| 20 to 24 Years | 105 (4.4%) | 158 (6.6%) |
| 25 to 29 Years | 130 (5.4%) | 129 (5.4%) |
| 30 to 34 Years | 134 (5.6%) | 164 (6.9%) |
| 35 to 39 Years | 132 (5.5%) | 115 (4.8%) |
| 40 to 44 Years | 140 (5.8%) | 152 (6.4%) |
| 45 to 49 Years | 164 (6.8%) | 142 (6.0%) |
| 50 to 54 Years | 142 (5.9%) | 163 (6.9%) |
| 55 to 59 Years | 160 (6.7%) | 108 (4.5%) |
| 60 to 64 Years | 171 (7.1%) | 206 (8.7%) |
| 65 to 69 Years | 136 (5.7%) | 138 (5.8%) |
| 70 to 74 Years | 128 (5.3%) | 128 (5.4%) |
| 75 to 79 Years | 110 (4.6%) | 69 (2.9%) |
| 80 to 84 Years | 31 (1.3%) | 59 (2.5%) |
| 85 Years and over | 31 (1.3%) | 132 (5.6%) |
| Total | 2,402 (100.0%) | 2,380 (100.0%) |
Families and Households in Carlisle County
Median Family Size in Carlisle County
The median family size in Carlisle County is 2.95 persons per family, with married-couple families (971 | 72.9%) accounting for the largest median family size of 3.03 persons per family. On the other hand, single male/father families (147 | 11.0%) represent the smallest median family size with 2.35 persons per family.
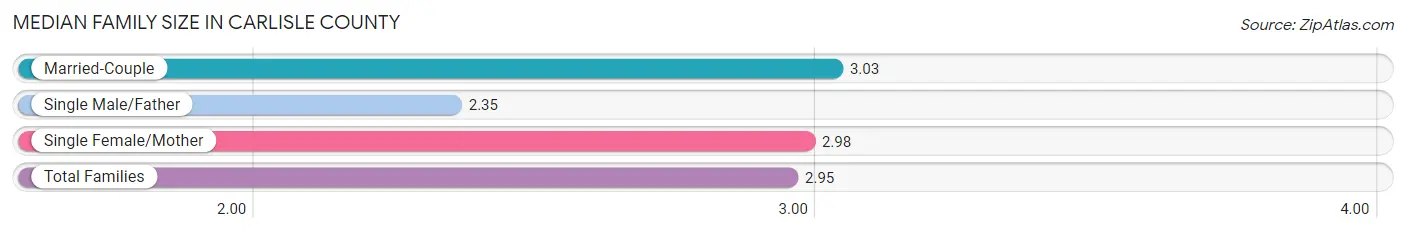
| Family Type | # Families | Family Size |
| Married-Couple | 971 (72.9%) | 3.03 |
| Single Male/Father | 147 (11.0%) | 2.35 |
| Single Female/Mother | 214 (16.1%) | 2.98 |
| Total Families | 1,332 (100.0%) | 2.95 |
Median Household Size in Carlisle County
The median household size in Carlisle County is 2.48 persons per household, with single female/mother households (214 | 11.2%) accounting for the largest median household size of 3.2 persons per household. non-family households (573 | 30.1%) represent the smallest median household size with 1.24 persons per household.
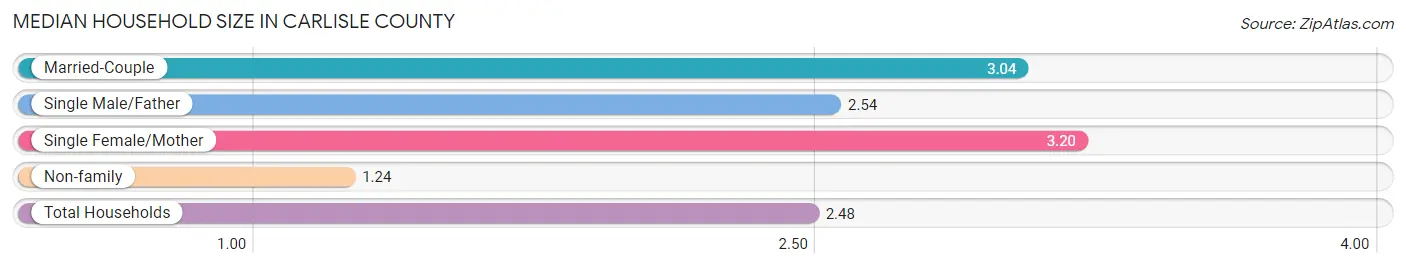
| Household Type | # Households | Household Size |
| Married-Couple | 971 (51.0%) | 3.04 |
| Single Male/Father | 147 (7.7%) | 2.54 |
| Single Female/Mother | 214 (11.2%) | 3.20 |
| Non-family | 573 (30.1%) | 1.24 |
| Total Households | 1,905 (100.0%) | 2.48 |
Household Size by Marriage Status in Carlisle County
Out of a total of 1,905 households in Carlisle County, 1,332 (69.9%) are family households, while 573 (30.1%) are nonfamily households. The most numerous type of family households are 2-person households, comprising 646, and the most common type of nonfamily households are 1-person households, comprising 471.
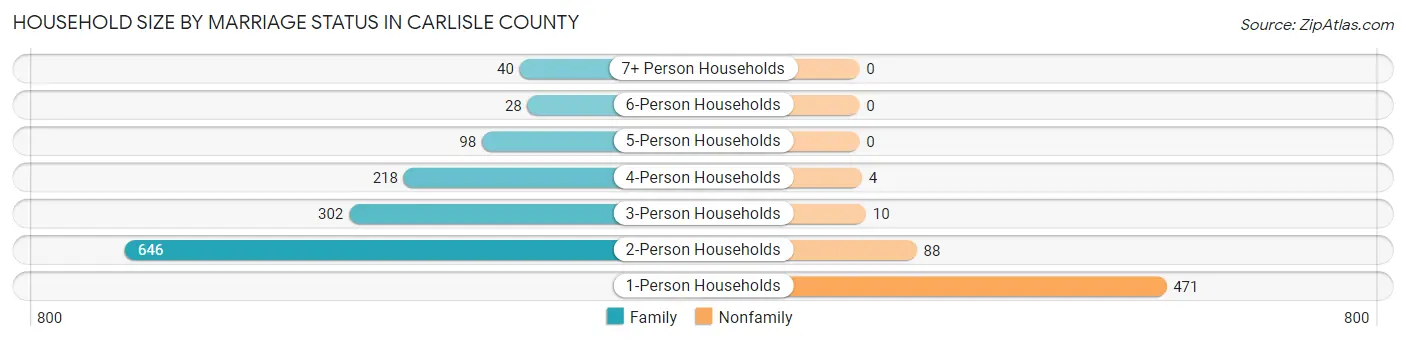
| Household Size | Family Households | Nonfamily Households |
| 1-Person Households | - | 471 (24.7%) |
| 2-Person Households | 646 (33.9%) | 88 (4.6%) |
| 3-Person Households | 302 (15.9%) | 10 (0.5%) |
| 4-Person Households | 218 (11.4%) | 4 (0.2%) |
| 5-Person Households | 98 (5.1%) | 0 (0.0%) |
| 6-Person Households | 28 (1.5%) | 0 (0.0%) |
| 7+ Person Households | 40 (2.1%) | 0 (0.0%) |
| Total | 1,332 (69.9%) | 573 (30.1%) |
Female Fertility in Carlisle County
Fertility by Age in Carlisle County
Average fertility rate in Carlisle County is 38.0 births per 1,000 women. Women in the age bracket of 20 to 34 years have the highest fertility rate with 84.0 births per 1,000 women. Women in the age bracket of 20 to 34 years acount for 100.0% of all women with births.
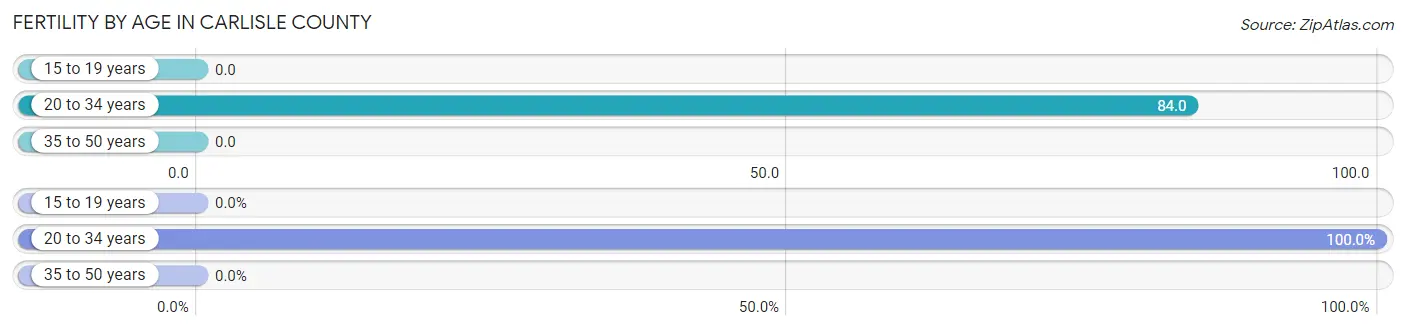
| Age Bracket | Women with Births | Births / 1,000 Women |
| 15 to 19 years | 0 (0.0%) | 0.0 |
| 20 to 34 years | 38 (100.0%) | 84.0 |
| 35 to 50 years | 0 (0.0%) | 0.0 |
| Total | 38 (100.0%) | 38.0 |
Fertility by Age by Marriage Status in Carlisle County
63.2% of women with births (38) in Carlisle County are married. The highest percentage of unmarried women with births falls into 20 to 34 years age bracket with 36.8% of them unmarried at the time of birth, while the lowest percentage of unmarried women with births belong to 20 to 34 years age bracket with 36.8% of them unmarried.
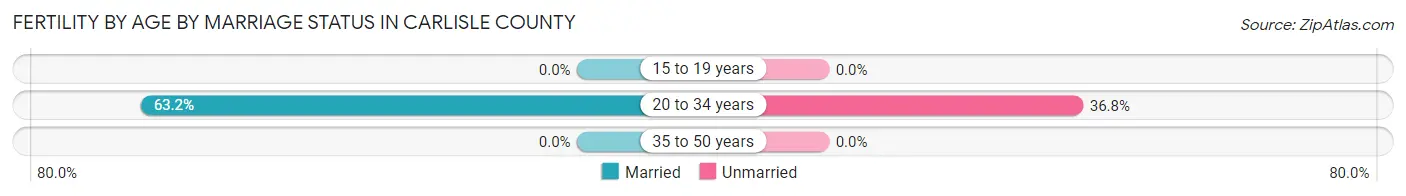
| Age Bracket | Married | Unmarried |
| 15 to 19 years | 0 (0.0%) | 0 (0.0%) |
| 20 to 34 years | 24 (63.2%) | 14 (36.8%) |
| 35 to 50 years | 0 (0.0%) | 0 (0.0%) |
| Total | 24 (63.2%) | 14 (36.8%) |
Fertility by Education in Carlisle County
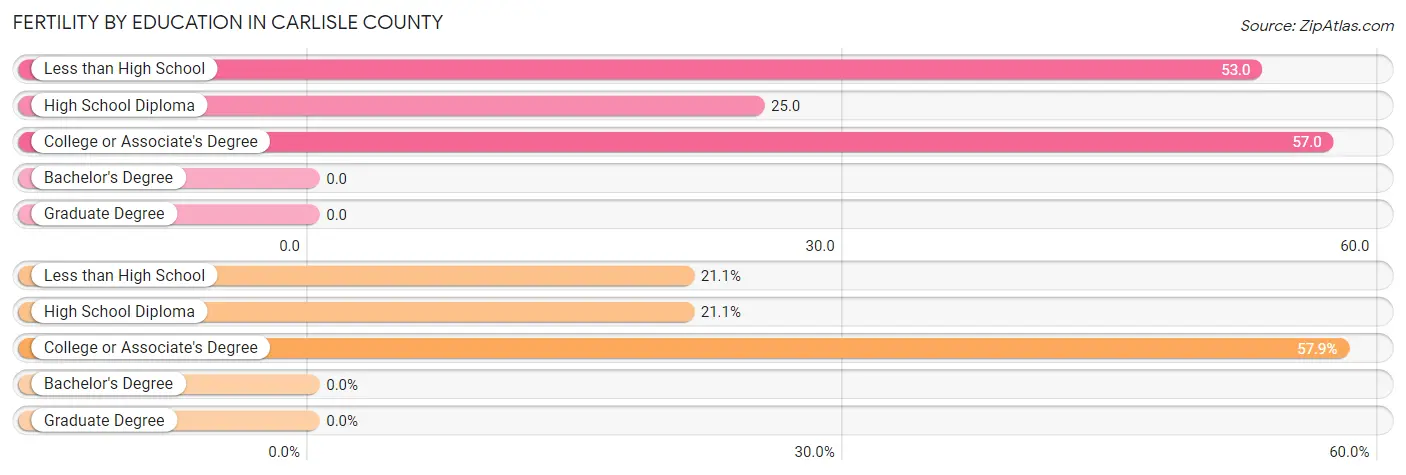
| Educational Attainment | Women with Births | Births / 1,000 Women |
| Less than High School | 8 (21.0%) | 53.0 |
| High School Diploma | 8 (21.0%) | 25.0 |
| College or Associate's Degree | 22 (57.9%) | 57.0 |
| Bachelor's Degree | 0 (0.0%) | 0.0 |
| Graduate Degree | 0 (0.0%) | 0.0 |
| Total | 38 (100.0%) | 38.0 |
Fertility by Education by Marriage Status in Carlisle County
36.8% of women with births in Carlisle County are unmarried. Women with the educational attainment of less than high school are most likely to be married with 100.0% of them married at childbirth, while women with the educational attainment of high school diploma are least likely to be married with 62.5% of them unmarried at childbirth.
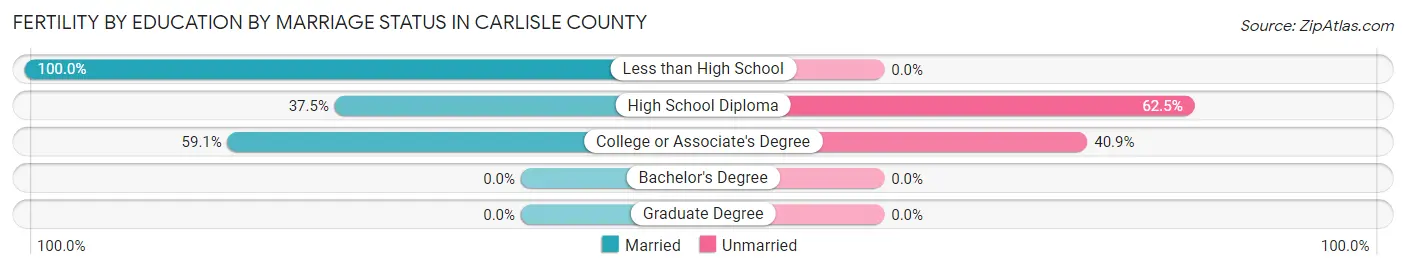
| Educational Attainment | Married | Unmarried |
| Less than High School | 8 (100.0%) | 0 (0.0%) |
| High School Diploma | 3 (37.5%) | 5 (62.5%) |
| College or Associate's Degree | 13 (59.1%) | 9 (40.9%) |
| Bachelor's Degree | 0 (0.0%) | 0 (0.0%) |
| Graduate Degree | 0 (0.0%) | 0 (0.0%) |
| Total | 24 (63.2%) | 14 (36.8%) |
Employment Characteristics in Carlisle County
Employment by Class of Employer in Carlisle County
Among the 1,792 employed individuals in Carlisle County, private company employees (1,332 | 74.3%), not-for-profit organizations (117 | 6.5%), and self-employed (not incorporated) (93 | 5.2%) make up the most common classes of employment.
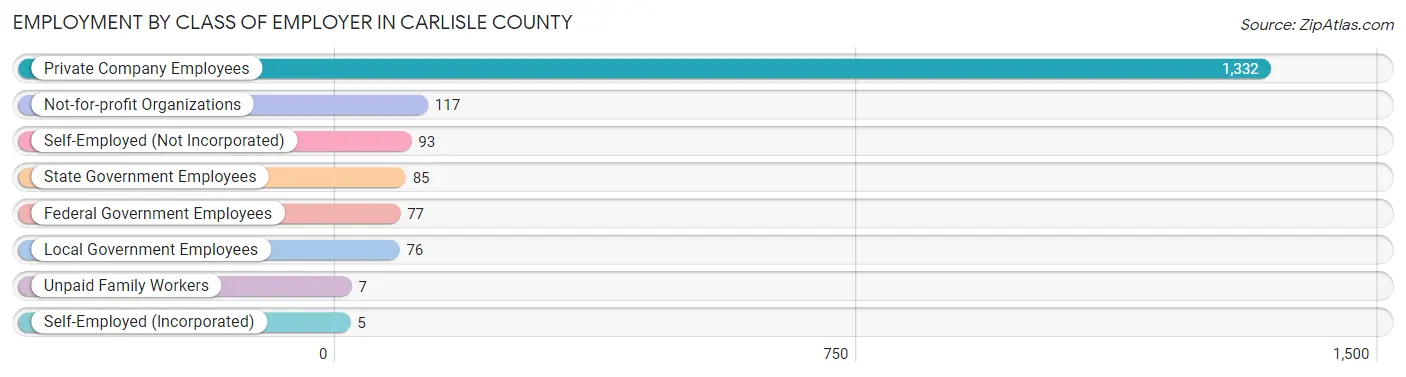
| Employer Class | # Employees | % Employees |
| Private Company Employees | 1,332 | 74.3% |
| Self-Employed (Incorporated) | 5 | 0.3% |
| Self-Employed (Not Incorporated) | 93 | 5.2% |
| Not-for-profit Organizations | 117 | 6.5% |
| Local Government Employees | 76 | 4.2% |
| State Government Employees | 85 | 4.7% |
| Federal Government Employees | 77 | 4.3% |
| Unpaid Family Workers | 7 | 0.4% |
| Total | 1,792 | 100.0% |
Employment Status by Age in Carlisle County
According to the labor force statistics for Carlisle County, out of the total population over 16 years of age (3,790), 50.3% or 1,906 individuals are in the labor force, with 4.2% or 80 of them unemployed. The age group with the highest labor force participation rate is 25 to 29 years, with 84.9% or 220 individuals in the labor force. Within the labor force, the 16 to 19 years age range has the highest percentage of unemployed individuals, with 9.6% or 5 of them being unemployed.
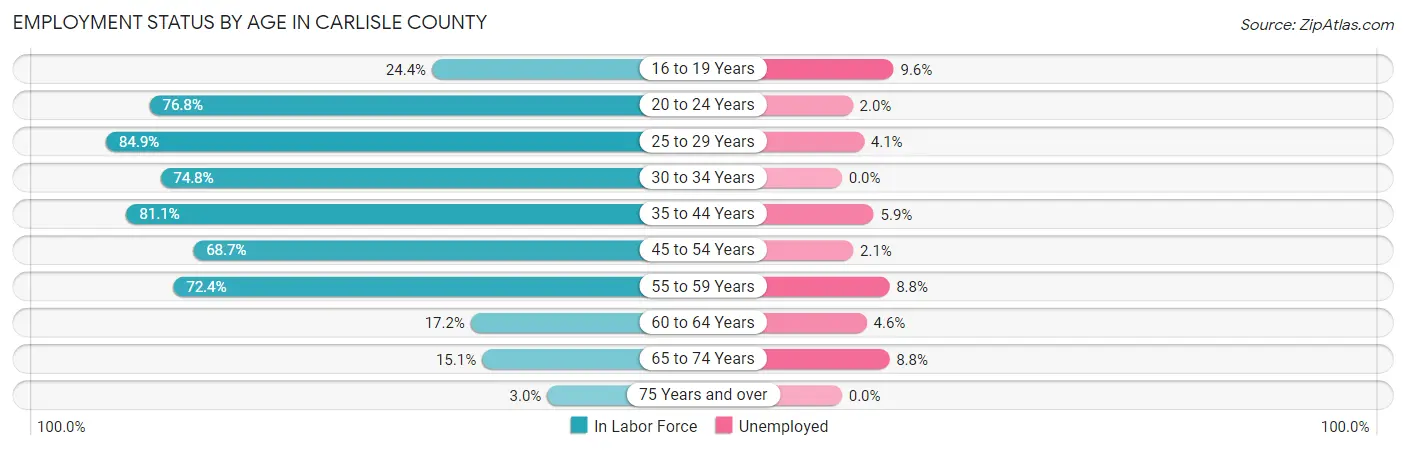
| Age Bracket | In Labor Force | Unemployed |
| 16 to 19 Years | 52 (24.4%) | 5 (9.6%) |
| 20 to 24 Years | 202 (76.8%) | 4 (2.0%) |
| 25 to 29 Years | 220 (84.9%) | 9 (4.1%) |
| 30 to 34 Years | 223 (74.8%) | 0 (0.0%) |
| 35 to 44 Years | 437 (81.1%) | 26 (5.9%) |
| 45 to 54 Years | 420 (68.7%) | 9 (2.1%) |
| 55 to 59 Years | 194 (72.4%) | 17 (8.8%) |
| 60 to 64 Years | 65 (17.2%) | 3 (4.6%) |
| 65 to 74 Years | 80 (15.1%) | 7 (8.8%) |
| 75 Years and over | 13 (3.0%) | 0 (0.0%) |
| Total | 1,906 (50.3%) | 80 (4.2%) |
Employment Status by Educational Attainment in Carlisle County
According to labor force statistics for Carlisle County, 66.3% of individuals (1,559) out of the total population between 25 and 64 years of age (2,352) are in the labor force, with 4.1% or 64 of them being unemployed. The group with the highest labor force participation rate are those with the educational attainment of bachelor's degree or higher, with 88.6% or 273 individuals in the labor force. Within the labor force, individuals with less than high school education have the highest percentage of unemployment, with 7.5% or 9 of them being unemployed.
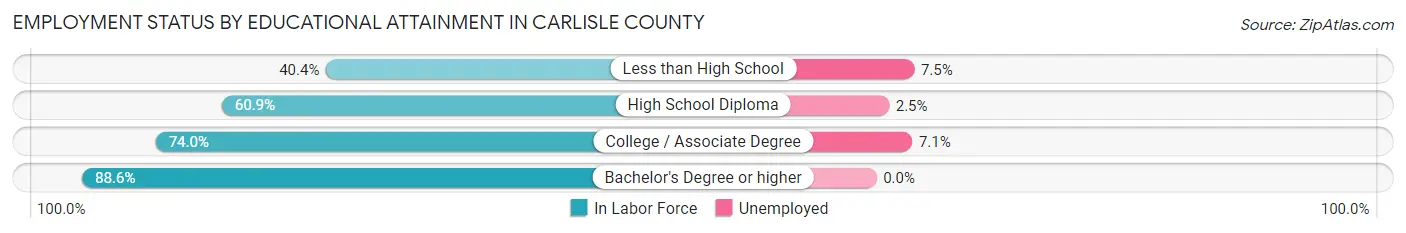
| Educational Attainment | In Labor Force | Unemployed |
| Less than High School | 120 (40.4%) | 22 (7.5%) |
| High School Diploma | 593 (60.9%) | 24 (2.5%) |
| College / Associate Degree | 573 (74.0%) | 55 (7.1%) |
| Bachelor's Degree or higher | 273 (88.6%) | 0 (0.0%) |
| Total | 1,559 (66.3%) | 96 (4.1%) |
Employment Occupations by Sex in Carlisle County
Management, Business, Science and Arts Occupations
The most common Management, Business, Science and Arts occupations in Carlisle County are Management (174 | 9.6%), Community & Social Service (150 | 8.3%), Health Diagnosing & Treating (110 | 6.0%), Health Technologists (79 | 4.3%), and Education Instruction & Library (66 | 3.6%).
Management, Business, Science and Arts Occupations by Sex
Within the Management, Business, Science and Arts occupations in Carlisle County, the most male-oriented occupations are Architecture & Engineering (100.0%), Arts, Media & Entertainment (100.0%), and Management (56.3%), while the most female-oriented occupations are Business & Financial (100.0%), Legal Services & Support (100.0%), and Education Instruction & Library (93.9%).
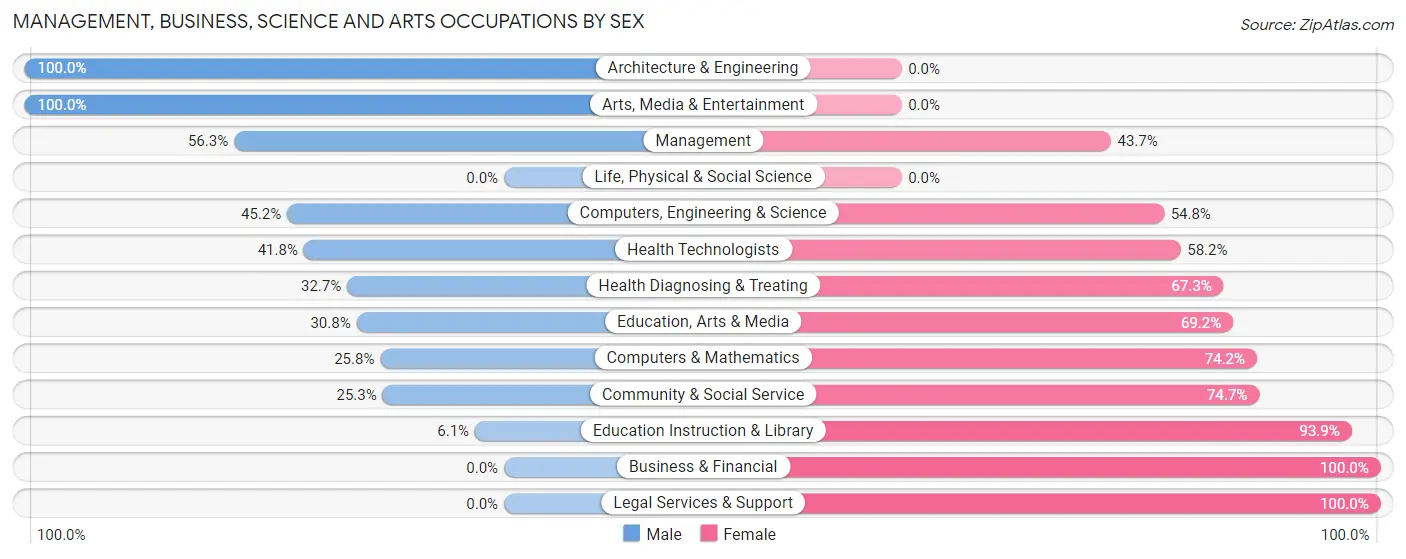
| Occupation | Male | Female |
| Management | 98 (56.3%) | 76 (43.7%) |
| Business & Financial | 0 (0.0%) | 6 (100.0%) |
| Computers, Engineering & Science | 19 (45.2%) | 23 (54.8%) |
| Computers & Mathematics | 8 (25.8%) | 23 (74.2%) |
| Architecture & Engineering | 11 (100.0%) | 0 (0.0%) |
| Life, Physical & Social Science | 0 (0.0%) | 0 (0.0%) |
| Community & Social Service | 38 (25.3%) | 112 (74.7%) |
| Education, Arts & Media | 20 (30.8%) | 45 (69.2%) |
| Legal Services & Support | 0 (0.0%) | 5 (100.0%) |
| Education Instruction & Library | 4 (6.1%) | 62 (93.9%) |
| Arts, Media & Entertainment | 14 (100.0%) | 0 (0.0%) |
| Health Diagnosing & Treating | 36 (32.7%) | 74 (67.3%) |
| Health Technologists | 33 (41.8%) | 46 (58.2%) |
| Total (Category) | 191 (39.6%) | 291 (60.4%) |
| Total (Overall) | 981 (54.0%) | 836 (46.0%) |
Services Occupations
The most common Services occupations in Carlisle County are Cleaning & Maintenance (122 | 6.7%), Healthcare Support (84 | 4.6%), Food Preparation & Serving (79 | 4.3%), Security & Protection (20 | 1.1%), and Personal Care & Service (13 | 0.7%).
Services Occupations by Sex
Within the Services occupations in Carlisle County, the most male-oriented occupations are Cleaning & Maintenance (59.8%), Firefighting & Prevention (58.3%), and Personal Care & Service (53.8%), while the most female-oriented occupations are Healthcare Support (96.4%), Food Preparation & Serving (70.9%), and Law Enforcement (62.5%).
| Occupation | Male | Female |
| Healthcare Support | 3 (3.6%) | 81 (96.4%) |
| Security & Protection | 10 (50.0%) | 10 (50.0%) |
| Firefighting & Prevention | 7 (58.3%) | 5 (41.7%) |
| Law Enforcement | 3 (37.5%) | 5 (62.5%) |
| Food Preparation & Serving | 23 (29.1%) | 56 (70.9%) |
| Cleaning & Maintenance | 73 (59.8%) | 49 (40.2%) |
| Personal Care & Service | 7 (53.8%) | 6 (46.2%) |
| Total (Category) | 116 (36.5%) | 202 (63.5%) |
| Total (Overall) | 981 (54.0%) | 836 (46.0%) |
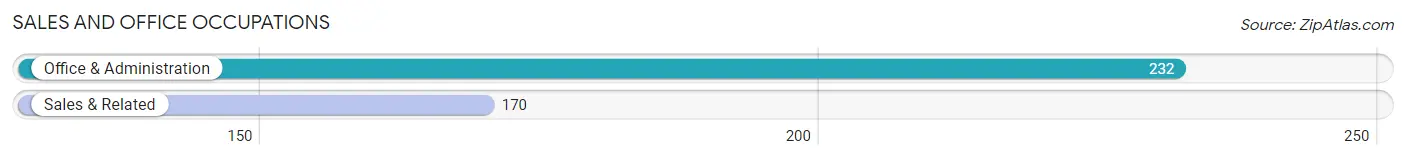
Sales and Office Occupations
The most common Sales and Office occupations in Carlisle County are Office & Administration (232 | 12.8%), and Sales & Related (170 | 9.4%).
Sales and Office Occupations by Sex
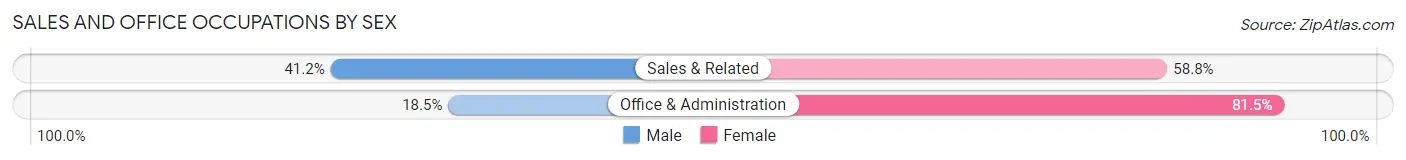
| Occupation | Male | Female |
| Sales & Related | 70 (41.2%) | 100 (58.8%) |
| Office & Administration | 43 (18.5%) | 189 (81.5%) |
| Total (Category) | 113 (28.1%) | 289 (71.9%) |
| Total (Overall) | 981 (54.0%) | 836 (46.0%) |
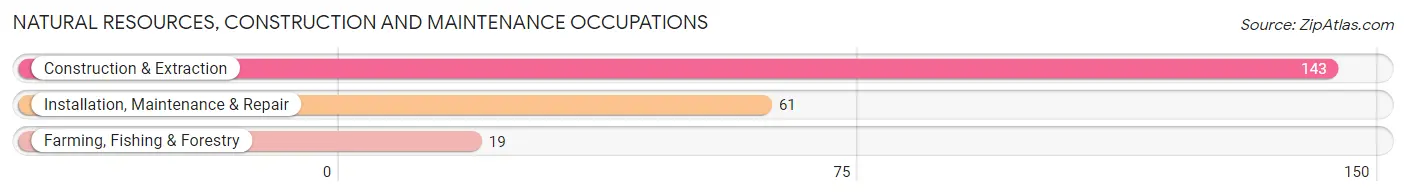
Natural Resources, Construction and Maintenance Occupations
The most common Natural Resources, Construction and Maintenance occupations in Carlisle County are Construction & Extraction (143 | 7.9%), Installation, Maintenance & Repair (61 | 3.4%), and Farming, Fishing & Forestry (19 | 1.1%).
Natural Resources, Construction and Maintenance Occupations by Sex
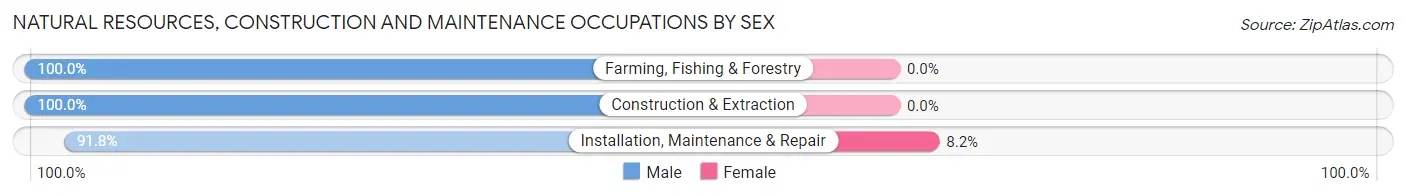
| Occupation | Male | Female |
| Farming, Fishing & Forestry | 19 (100.0%) | 0 (0.0%) |
| Construction & Extraction | 143 (100.0%) | 0 (0.0%) |
| Installation, Maintenance & Repair | 56 (91.8%) | 5 (8.2%) |
| Total (Category) | 218 (97.8%) | 5 (2.2%) |
| Total (Overall) | 981 (54.0%) | 836 (46.0%) |
Production, Transportation and Moving Occupations
The most common Production, Transportation and Moving occupations in Carlisle County are Production (156 | 8.6%), Transportation (120 | 6.6%), and Material Moving (116 | 6.4%).
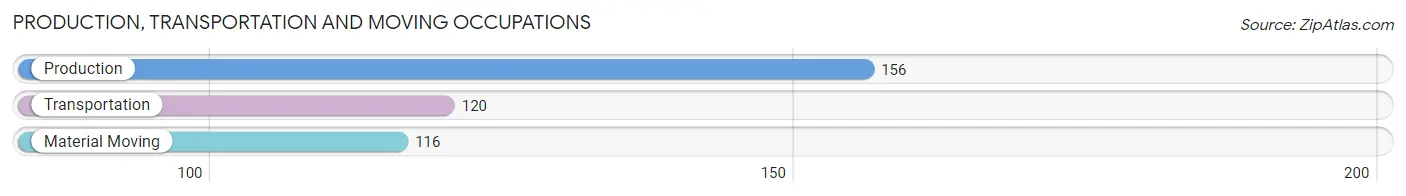
Production, Transportation and Moving Occupations by Sex
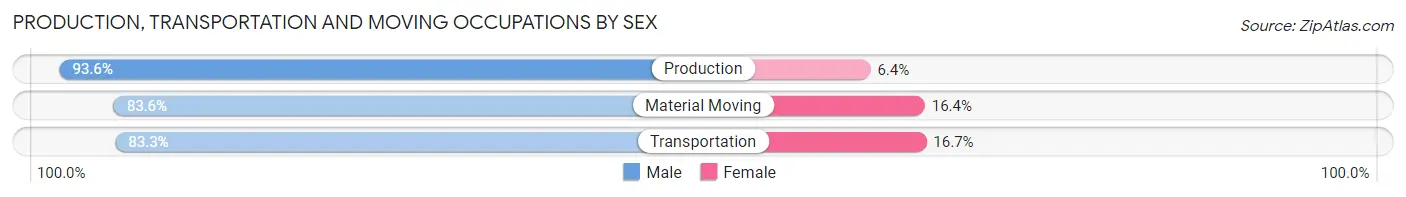
| Occupation | Male | Female |
| Production | 146 (93.6%) | 10 (6.4%) |
| Transportation | 100 (83.3%) | 20 (16.7%) |
| Material Moving | 97 (83.6%) | 19 (16.4%) |
| Total (Category) | 343 (87.5%) | 49 (12.5%) |
| Total (Overall) | 981 (54.0%) | 836 (46.0%) |
Employment Industries by Sex in Carlisle County
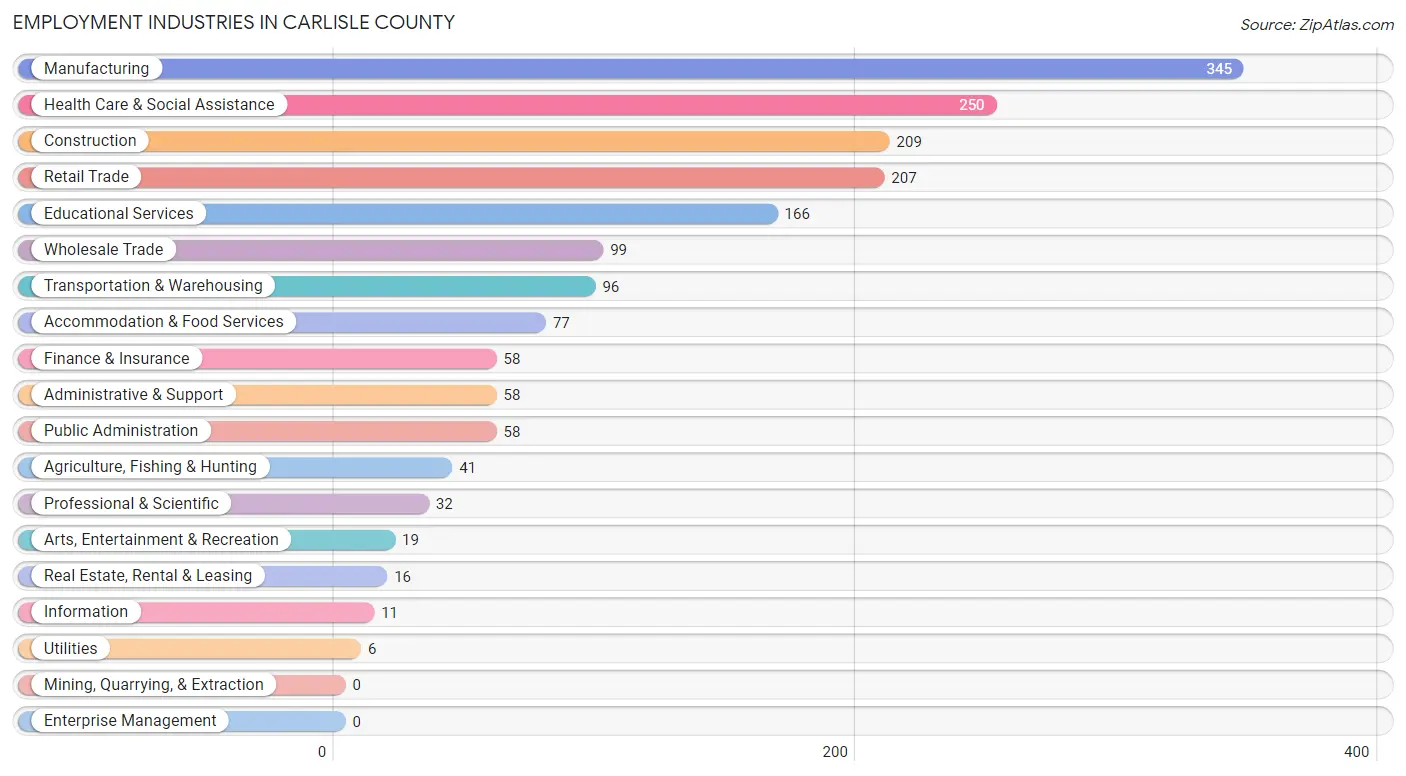
Employment Industries in Carlisle County
The major employment industries in Carlisle County include Manufacturing (345 | 19.0%), Health Care & Social Assistance (250 | 13.8%), Construction (209 | 11.5%), Retail Trade (207 | 11.4%), and Educational Services (166 | 9.1%).
Employment Industries by Sex in Carlisle County
The Carlisle County industries that see more men than women are Agriculture, Fishing & Hunting (100.0%), Information (100.0%), and Administrative & Support (96.6%), whereas the industries that tend to have a higher number of women are Real Estate, Rental & Leasing (100.0%), Arts, Entertainment & Recreation (100.0%), and Health Care & Social Assistance (86.4%).
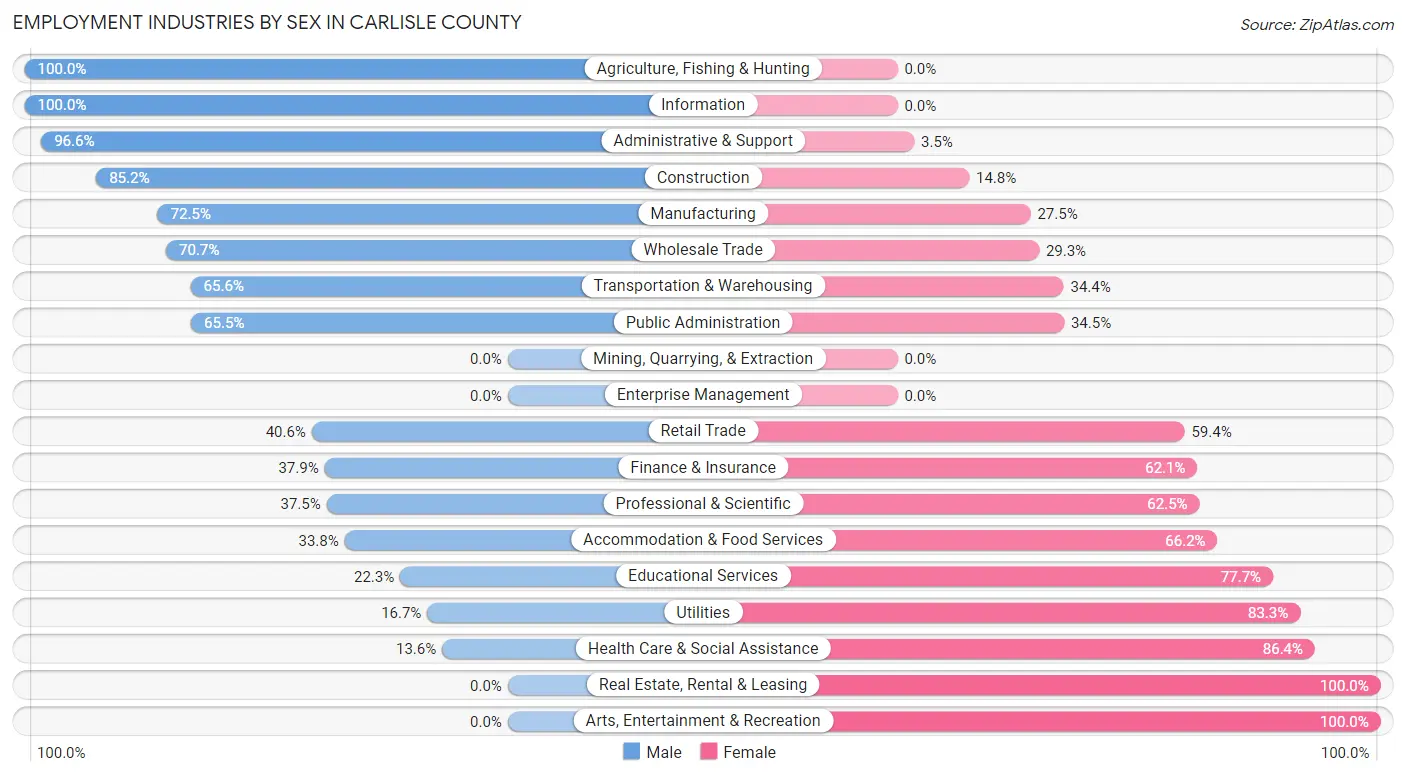
| Industry | Male | Female |
| Agriculture, Fishing & Hunting | 41 (100.0%) | 0 (0.0%) |
| Mining, Quarrying, & Extraction | 0 (0.0%) | 0 (0.0%) |
| Construction | 178 (85.2%) | 31 (14.8%) |
| Manufacturing | 250 (72.5%) | 95 (27.5%) |
| Wholesale Trade | 70 (70.7%) | 29 (29.3%) |
| Retail Trade | 84 (40.6%) | 123 (59.4%) |
| Transportation & Warehousing | 63 (65.6%) | 33 (34.4%) |
| Utilities | 1 (16.7%) | 5 (83.3%) |
| Information | 11 (100.0%) | 0 (0.0%) |
| Finance & Insurance | 22 (37.9%) | 36 (62.1%) |
| Real Estate, Rental & Leasing | 0 (0.0%) | 16 (100.0%) |
| Professional & Scientific | 12 (37.5%) | 20 (62.5%) |
| Enterprise Management | 0 (0.0%) | 0 (0.0%) |
| Administrative & Support | 56 (96.6%) | 2 (3.5%) |
| Educational Services | 37 (22.3%) | 129 (77.7%) |
| Health Care & Social Assistance | 34 (13.6%) | 216 (86.4%) |
| Arts, Entertainment & Recreation | 0 (0.0%) | 19 (100.0%) |
| Accommodation & Food Services | 26 (33.8%) | 51 (66.2%) |
| Public Administration | 38 (65.5%) | 20 (34.5%) |
| Total | 981 (54.0%) | 836 (46.0%) |
Education in Carlisle County
School Enrollment in Carlisle County
The most common levels of schooling among the 1,080 students in Carlisle County are middle school (279 | 25.8%), high school (241 | 22.3%), and elementary school (216 | 20.0%).
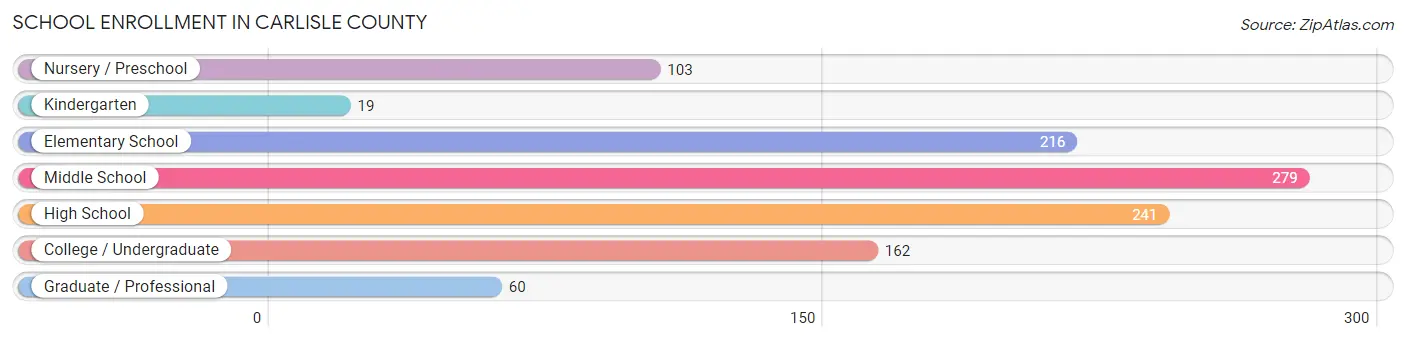
| School Level | # Students | % Students |
| Nursery / Preschool | 103 | 9.5% |
| Kindergarten | 19 | 1.8% |
| Elementary School | 216 | 20.0% |
| Middle School | 279 | 25.8% |
| High School | 241 | 22.3% |
| College / Undergraduate | 162 | 15.0% |
| Graduate / Professional | 60 | 5.6% |
| Total | 1,080 | 100.0% |
School Enrollment by Age by Funding Source in Carlisle County
Out of a total of 1,080 students who are enrolled in schools in Carlisle County, 158 (14.6%) attend a private institution, while the remaining 922 (85.4%) are enrolled in public schools. The age group of 20 to 24 year olds has the highest likelihood of being enrolled in private schools, with 7 (33.3% in the age bracket) enrolled. Conversely, the age group of 3 to 4 year olds has the lowest likelihood of being enrolled in a private school, with 58 (100.0% in the age bracket) attending a public institution.
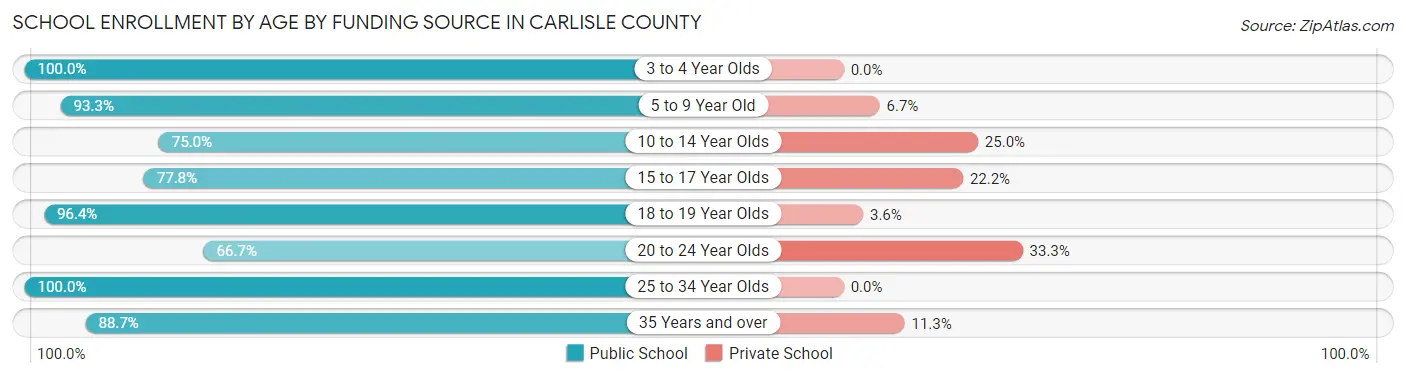
| Age Bracket | Public School | Private School |
| 3 to 4 Year Olds | 58 (100.0%) | 0 (0.0%) |
| 5 to 9 Year Old | 265 (93.3%) | 19 (6.7%) |
| 10 to 14 Year Olds | 234 (75.0%) | 78 (25.0%) |
| 15 to 17 Year Olds | 140 (77.8%) | 40 (22.2%) |
| 18 to 19 Year Olds | 80 (96.4%) | 3 (3.6%) |
| 20 to 24 Year Olds | 14 (66.7%) | 7 (33.3%) |
| 25 to 34 Year Olds | 45 (100.0%) | 0 (0.0%) |
| 35 Years and over | 86 (88.7%) | 11 (11.3%) |
| Total | 922 (85.4%) | 158 (14.6%) |
Educational Attainment by Field of Study in Carlisle County
Education (102 | 22.0%), science & technology (90 | 19.4%), business (58 | 12.5%), arts & humanities (51 | 11.0%), and bio, nature & agricultural (44 | 9.5%) are the most common fields of study among 463 individuals in Carlisle County who have obtained a bachelor's degree or higher.
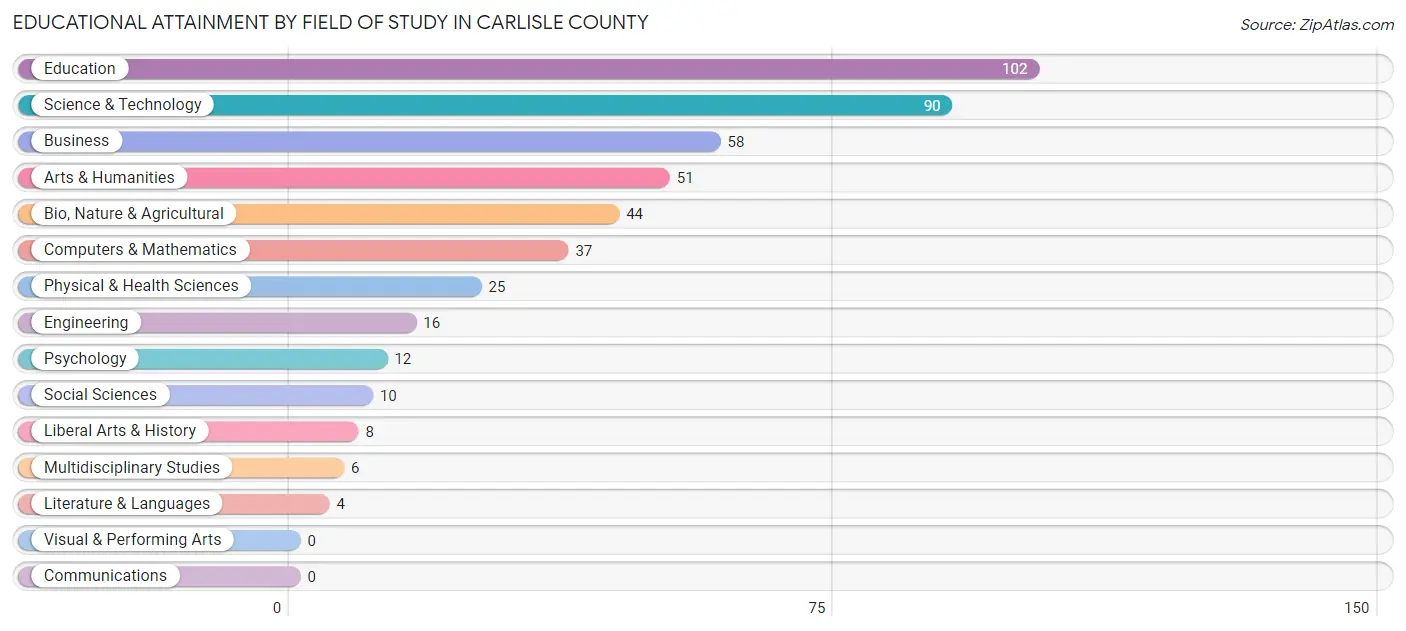
| Field of Study | # Graduates | % Graduates |
| Computers & Mathematics | 37 | 8.0% |
| Bio, Nature & Agricultural | 44 | 9.5% |
| Physical & Health Sciences | 25 | 5.4% |
| Psychology | 12 | 2.6% |
| Social Sciences | 10 | 2.2% |
| Engineering | 16 | 3.5% |
| Multidisciplinary Studies | 6 | 1.3% |
| Science & Technology | 90 | 19.4% |
| Business | 58 | 12.5% |
| Education | 102 | 22.0% |
| Literature & Languages | 4 | 0.9% |
| Liberal Arts & History | 8 | 1.7% |
| Visual & Performing Arts | 0 | 0.0% |
| Communications | 0 | 0.0% |
| Arts & Humanities | 51 | 11.0% |
| Total | 463 | 100.0% |
Transportation & Commute in Carlisle County
Vehicle Availability by Sex in Carlisle County
The most prevalent vehicle ownership categories in Carlisle County are males with 2 vehicles (424, accounting for 43.4%) and females with 2 vehicles (344, making up 52.0%).
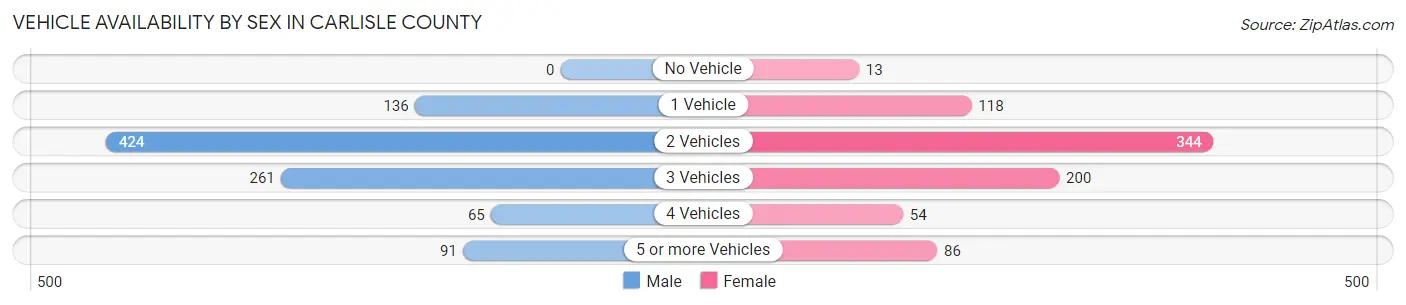
| Vehicles Available | Male | Female |
| No Vehicle | 0 (0.0%) | 13 (1.6%) |
| 1 Vehicle | 136 (13.9%) | 118 (14.5%) |
| 2 Vehicles | 424 (43.4%) | 344 (42.2%) |
| 3 Vehicles | 261 (26.7%) | 200 (24.5%) |
| 4 Vehicles | 65 (6.7%) | 54 (6.6%) |
| 5 or more Vehicles | 91 (9.3%) | 86 (10.5%) |
| Total | 977 (100.0%) | 815 (100.0%) |
Commute Time in Carlisle County
The most frequently occuring commute durations in Carlisle County are 20 to 24 minutes (258 commuters, 15.3%), 30 to 34 minutes (255 commuters, 15.1%), and 10 to 14 minutes (229 commuters, 13.5%).
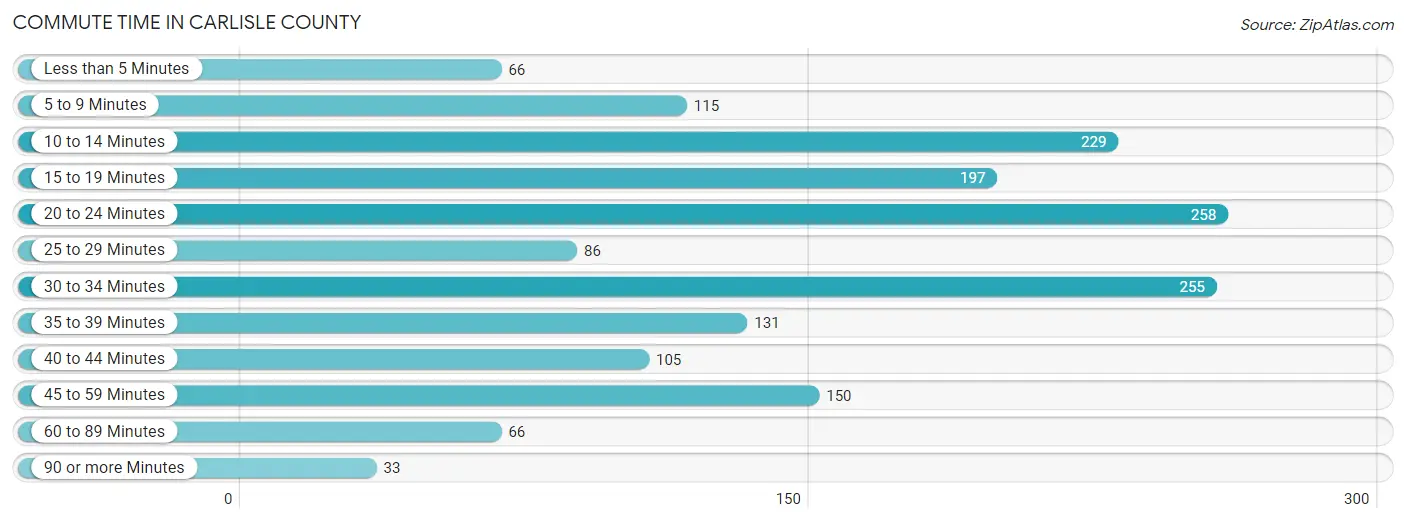
| Commute Time | # Commuters | % Commuters |
| Less than 5 Minutes | 66 | 3.9% |
| 5 to 9 Minutes | 115 | 6.8% |
| 10 to 14 Minutes | 229 | 13.5% |
| 15 to 19 Minutes | 197 | 11.7% |
| 20 to 24 Minutes | 258 | 15.3% |
| 25 to 29 Minutes | 86 | 5.1% |
| 30 to 34 Minutes | 255 | 15.1% |
| 35 to 39 Minutes | 131 | 7.7% |
| 40 to 44 Minutes | 105 | 6.2% |
| 45 to 59 Minutes | 150 | 8.9% |
| 60 to 89 Minutes | 66 | 3.9% |
| 90 or more Minutes | 33 | 1.9% |
Commute Time by Sex in Carlisle County
The most common commute times in Carlisle County are 10 to 14 minutes (167 commuters, 18.2%) for males and 20 to 24 minutes (148 commuters, 19.2%) for females.
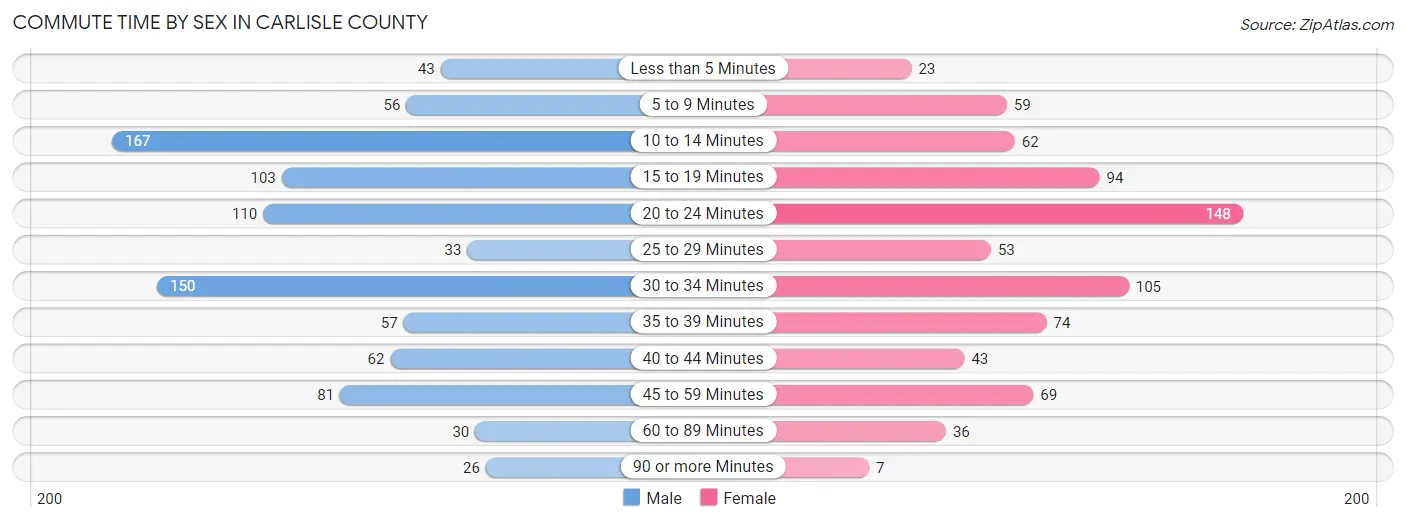
| Commute Time | Male | Female |
| Less than 5 Minutes | 43 (4.7%) | 23 (3.0%) |
| 5 to 9 Minutes | 56 (6.1%) | 59 (7.6%) |
| 10 to 14 Minutes | 167 (18.2%) | 62 (8.0%) |
| 15 to 19 Minutes | 103 (11.2%) | 94 (12.2%) |
| 20 to 24 Minutes | 110 (12.0%) | 148 (19.2%) |
| 25 to 29 Minutes | 33 (3.6%) | 53 (6.9%) |
| 30 to 34 Minutes | 150 (16.3%) | 105 (13.6%) |
| 35 to 39 Minutes | 57 (6.2%) | 74 (9.6%) |
| 40 to 44 Minutes | 62 (6.8%) | 43 (5.6%) |
| 45 to 59 Minutes | 81 (8.8%) | 69 (8.9%) |
| 60 to 89 Minutes | 30 (3.3%) | 36 (4.7%) |
| 90 or more Minutes | 26 (2.8%) | 7 (0.9%) |
Time of Departure to Work by Sex in Carlisle County
The most frequent times of departure to work in Carlisle County are 6:00 AM to 6:29 AM (193, 21.0%) for males and 7:00 AM to 7:29 AM (144, 18.6%) for females.
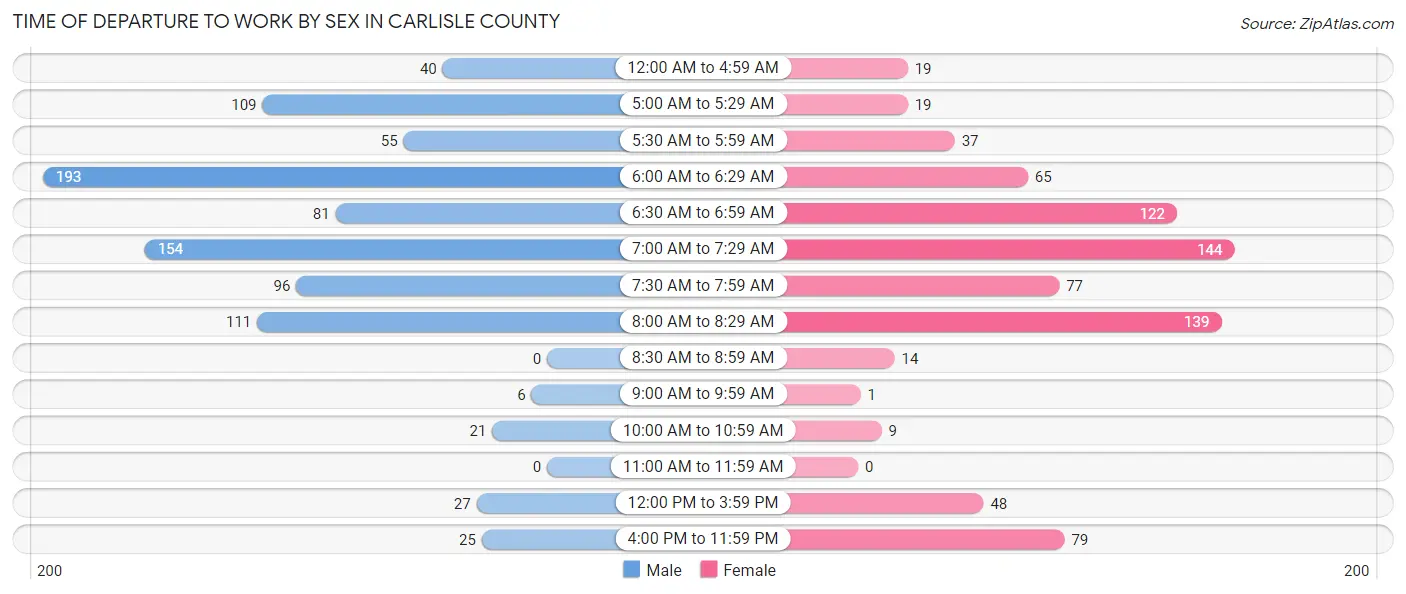
| Time of Departure | Male | Female |
| 12:00 AM to 4:59 AM | 40 (4.4%) | 19 (2.5%) |
| 5:00 AM to 5:29 AM | 109 (11.9%) | 19 (2.5%) |
| 5:30 AM to 5:59 AM | 55 (6.0%) | 37 (4.8%) |
| 6:00 AM to 6:29 AM | 193 (21.0%) | 65 (8.4%) |
| 6:30 AM to 6:59 AM | 81 (8.8%) | 122 (15.8%) |
| 7:00 AM to 7:29 AM | 154 (16.8%) | 144 (18.6%) |
| 7:30 AM to 7:59 AM | 96 (10.5%) | 77 (10.0%) |
| 8:00 AM to 8:29 AM | 111 (12.1%) | 139 (18.0%) |
| 8:30 AM to 8:59 AM | 0 (0.0%) | 14 (1.8%) |
| 9:00 AM to 9:59 AM | 6 (0.6%) | 1 (0.1%) |
| 10:00 AM to 10:59 AM | 21 (2.3%) | 9 (1.2%) |
| 11:00 AM to 11:59 AM | 0 (0.0%) | 0 (0.0%) |
| 12:00 PM to 3:59 PM | 27 (2.9%) | 48 (6.2%) |
| 4:00 PM to 11:59 PM | 25 (2.7%) | 79 (10.2%) |
| Total | 918 (100.0%) | 773 (100.0%) |
Housing Occupancy in Carlisle County
Occupancy by Ownership in Carlisle County
Of the total 1,905 dwellings in Carlisle County, owner-occupied units account for 1,458 (76.5%), while renter-occupied units make up 447 (23.5%).
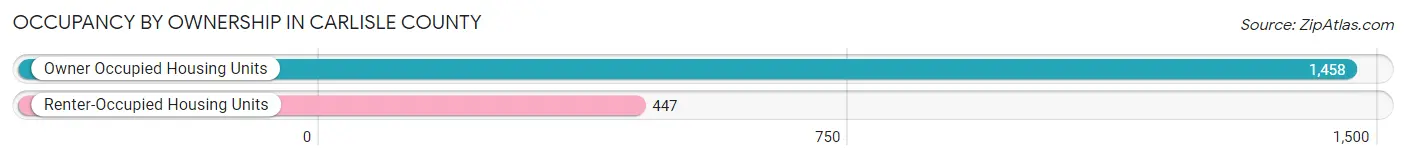
| Occupancy | # Housing Units | % Housing Units |
| Owner Occupied Housing Units | 1,458 | 76.5% |
| Renter-Occupied Housing Units | 447 | 23.5% |
| Total Occupied Housing Units | 1,905 | 100.0% |
Occupancy by Household Size in Carlisle County
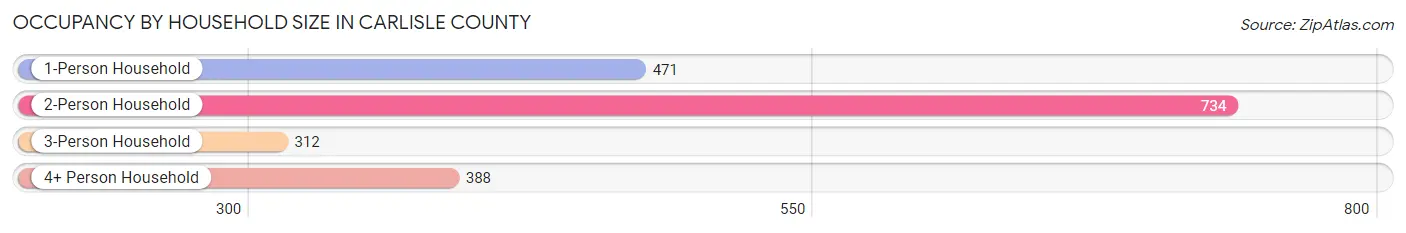
| Household Size | # Housing Units | % Housing Units |
| 1-Person Household | 471 | 24.7% |
| 2-Person Household | 734 | 38.5% |
| 3-Person Household | 312 | 16.4% |
| 4+ Person Household | 388 | 20.4% |
| Total Housing Units | 1,905 | 100.0% |
Occupancy by Ownership by Household Size in Carlisle County
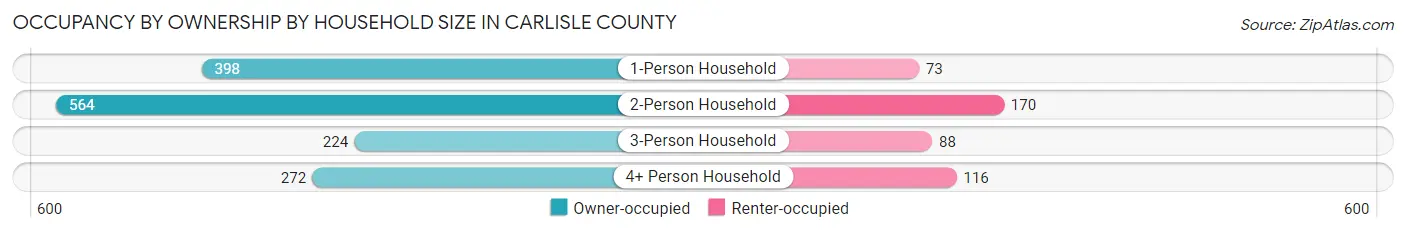
| Household Size | Owner-occupied | Renter-occupied |
| 1-Person Household | 398 (84.5%) | 73 (15.5%) |
| 2-Person Household | 564 (76.8%) | 170 (23.2%) |
| 3-Person Household | 224 (71.8%) | 88 (28.2%) |
| 4+ Person Household | 272 (70.1%) | 116 (29.9%) |
| Total Housing Units | 1,458 (76.5%) | 447 (23.5%) |
Occupancy by Educational Attainment in Carlisle County
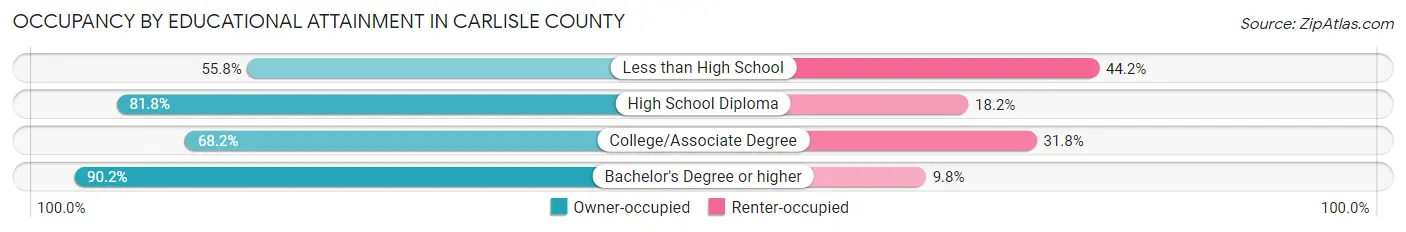
| Household Size | Owner-occupied | Renter-occupied |
| Less than High School | 96 (55.8%) | 76 (44.2%) |
| High School Diploma | 695 (81.8%) | 155 (18.2%) |
| College/Associate Degree | 401 (68.2%) | 187 (31.8%) |
| Bachelor's Degree or higher | 266 (90.2%) | 29 (9.8%) |
Occupancy by Age of Householder in Carlisle County
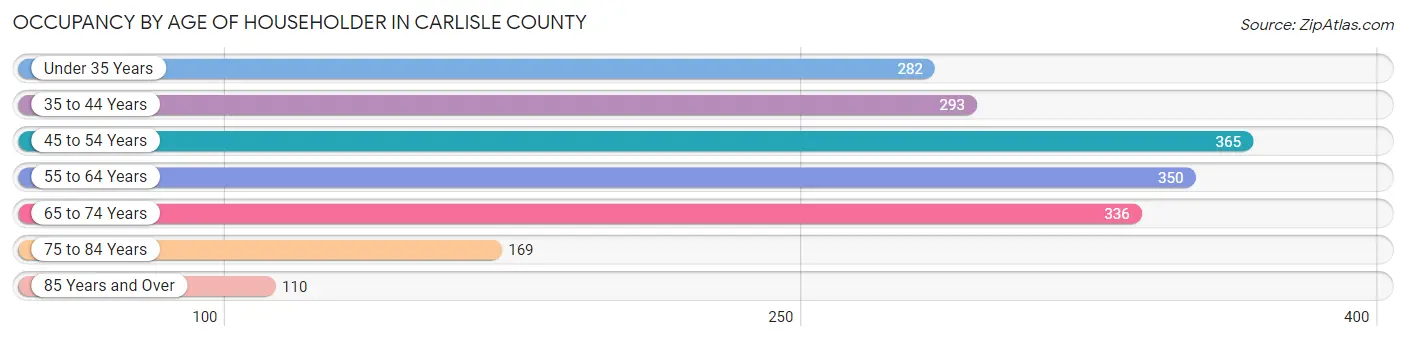
| Age Bracket | # Households | % Households |
| Under 35 Years | 282 | 14.8% |
| 35 to 44 Years | 293 | 15.4% |
| 45 to 54 Years | 365 | 19.2% |
| 55 to 64 Years | 350 | 18.4% |
| 65 to 74 Years | 336 | 17.6% |
| 75 to 84 Years | 169 | 8.9% |
| 85 Years and Over | 110 | 5.8% |
| Total | 1,905 | 100.0% |
Housing Finances in Carlisle County
Median Income by Occupancy in Carlisle County
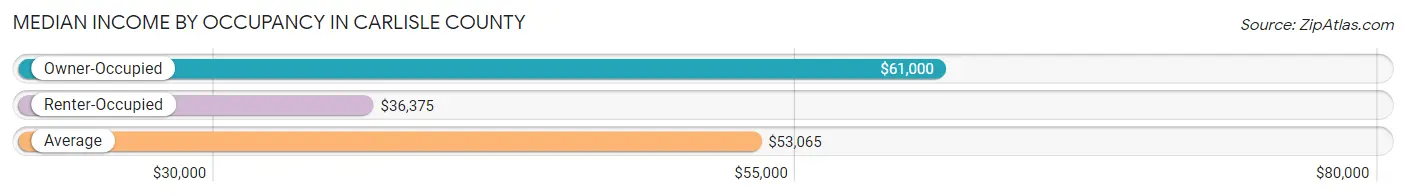
| Occupancy Type | # Households | Median Income |
| Owner-Occupied | 1,458 (76.5%) | $61,000 |
| Renter-Occupied | 447 (23.5%) | $36,375 |
| Average | 1,905 (100.0%) | $53,065 |
Occupancy by Householder Income Bracket in Carlisle County
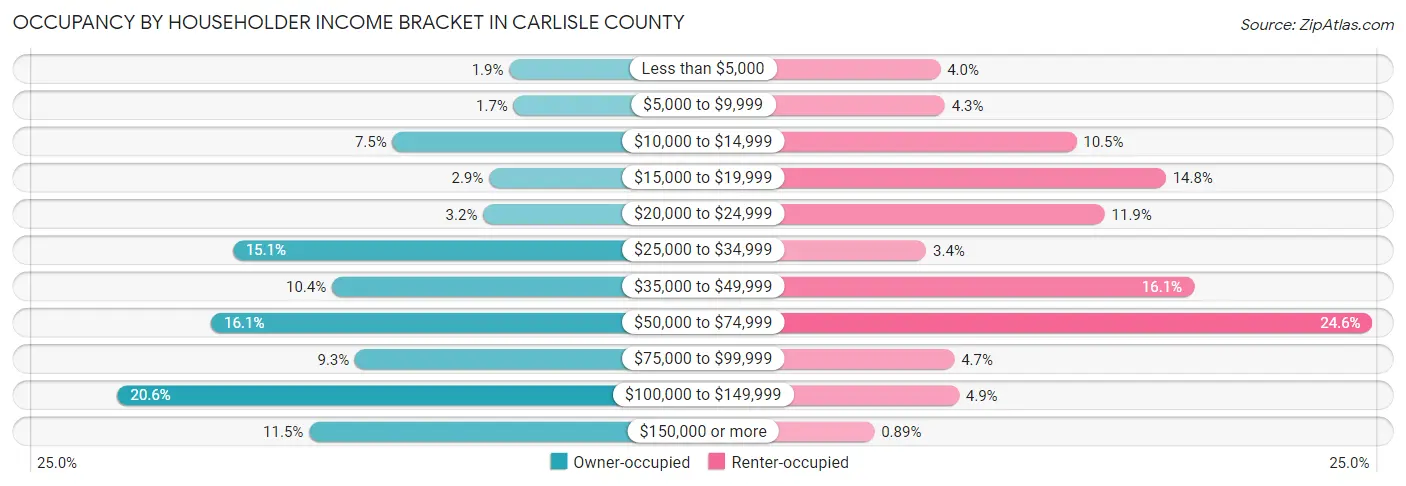
| Income Bracket | Owner-occupied | Renter-occupied |
| Less than $5,000 | 28 (1.9%) | 18 (4.0%) |
| $5,000 to $9,999 | 25 (1.7%) | 19 (4.3%) |
| $10,000 to $14,999 | 109 (7.5%) | 47 (10.5%) |
| $15,000 to $19,999 | 42 (2.9%) | 66 (14.8%) |
| $20,000 to $24,999 | 46 (3.2%) | 53 (11.9%) |
| $25,000 to $34,999 | 220 (15.1%) | 15 (3.4%) |
| $35,000 to $49,999 | 151 (10.4%) | 72 (16.1%) |
| $50,000 to $74,999 | 235 (16.1%) | 110 (24.6%) |
| $75,000 to $99,999 | 135 (9.3%) | 21 (4.7%) |
| $100,000 to $149,999 | 300 (20.6%) | 22 (4.9%) |
| $150,000 or more | 167 (11.5%) | 4 (0.9%) |
| Total | 1,458 (100.0%) | 447 (100.0%) |
Monthly Housing Cost Tiers in Carlisle County
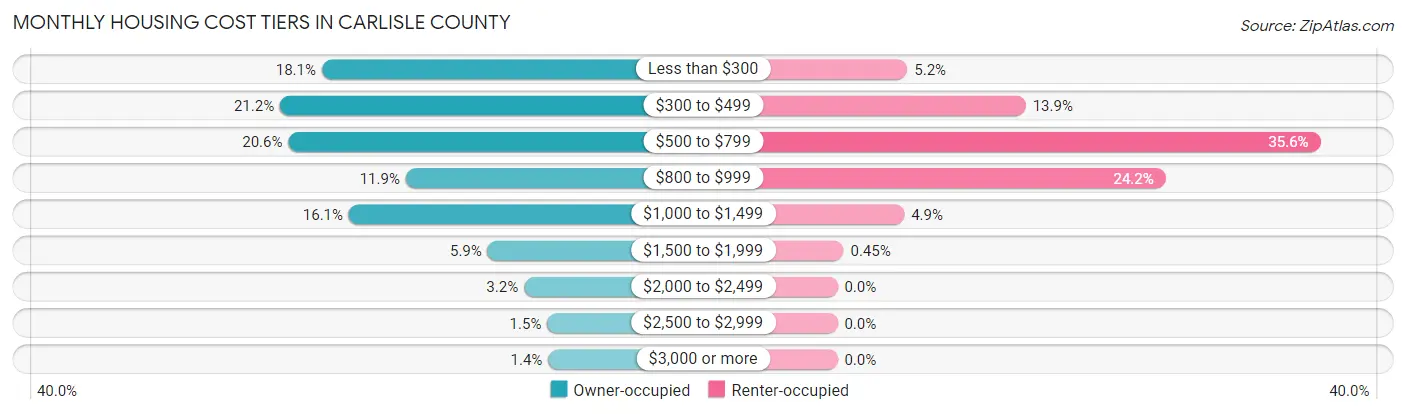
| Monthly Cost | Owner-occupied | Renter-occupied |
| Less than $300 | 264 (18.1%) | 23 (5.1%) |
| $300 to $499 | 309 (21.2%) | 62 (13.9%) |
| $500 to $799 | 300 (20.6%) | 159 (35.6%) |
| $800 to $999 | 174 (11.9%) | 108 (24.2%) |
| $1,000 to $1,499 | 235 (16.1%) | 22 (4.9%) |
| $1,500 to $1,999 | 86 (5.9%) | 2 (0.4%) |
| $2,000 to $2,499 | 47 (3.2%) | 0 (0.0%) |
| $2,500 to $2,999 | 22 (1.5%) | 0 (0.0%) |
| $3,000 or more | 21 (1.4%) | 0 (0.0%) |
| Total | 1,458 (100.0%) | 447 (100.0%) |
Physical Housing Characteristics in Carlisle County
Housing Structures in Carlisle County
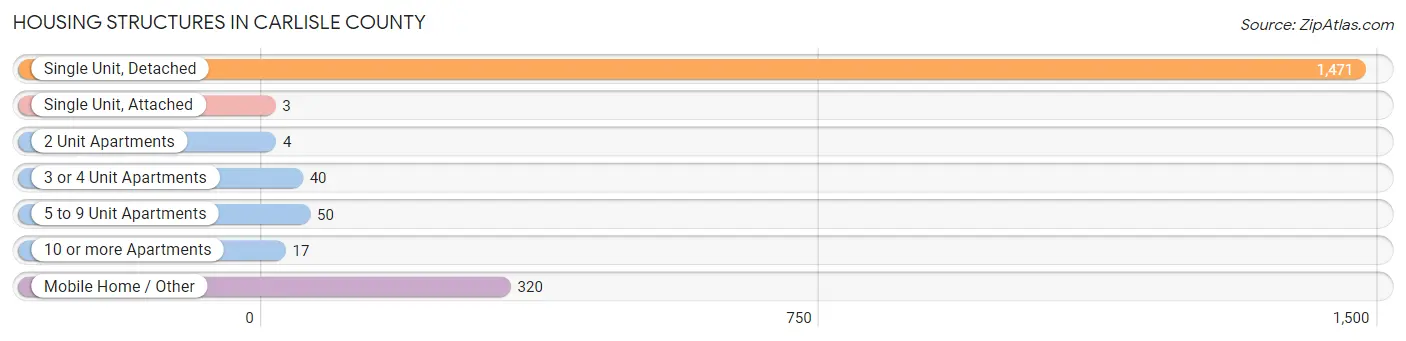
| Structure Type | # Housing Units | % Housing Units |
| Single Unit, Detached | 1,471 | 77.2% |
| Single Unit, Attached | 3 | 0.2% |
| 2 Unit Apartments | 4 | 0.2% |
| 3 or 4 Unit Apartments | 40 | 2.1% |
| 5 to 9 Unit Apartments | 50 | 2.6% |
| 10 or more Apartments | 17 | 0.9% |
| Mobile Home / Other | 320 | 16.8% |
| Total | 1,905 | 100.0% |
Housing Structures by Occupancy in Carlisle County
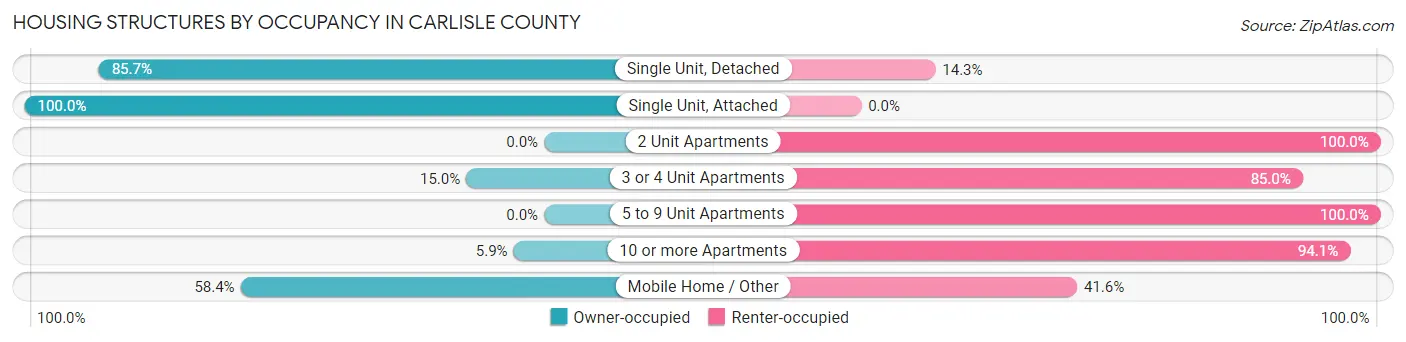
| Structure Type | Owner-occupied | Renter-occupied |
| Single Unit, Detached | 1,261 (85.7%) | 210 (14.3%) |
| Single Unit, Attached | 3 (100.0%) | 0 (0.0%) |
| 2 Unit Apartments | 0 (0.0%) | 4 (100.0%) |
| 3 or 4 Unit Apartments | 6 (15.0%) | 34 (85.0%) |
| 5 to 9 Unit Apartments | 0 (0.0%) | 50 (100.0%) |
| 10 or more Apartments | 1 (5.9%) | 16 (94.1%) |
| Mobile Home / Other | 187 (58.4%) | 133 (41.6%) |
| Total | 1,458 (76.5%) | 447 (23.5%) |
Housing Structures by Number of Rooms in Carlisle County
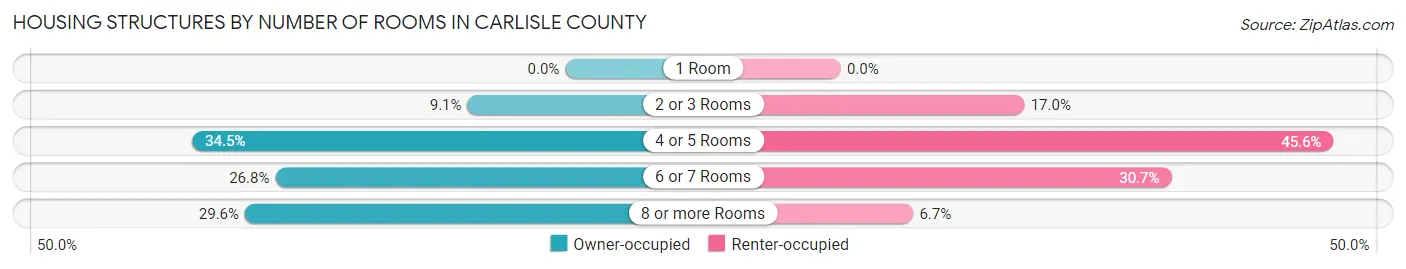
| Number of Rooms | Owner-occupied | Renter-occupied |
| 1 Room | 0 (0.0%) | 0 (0.0%) |
| 2 or 3 Rooms | 132 (9.0%) | 76 (17.0%) |
| 4 or 5 Rooms | 503 (34.5%) | 204 (45.6%) |
| 6 or 7 Rooms | 391 (26.8%) | 137 (30.6%) |
| 8 or more Rooms | 432 (29.6%) | 30 (6.7%) |
| Total | 1,458 (100.0%) | 447 (100.0%) |
Housing Structure by Heating Type in Carlisle County
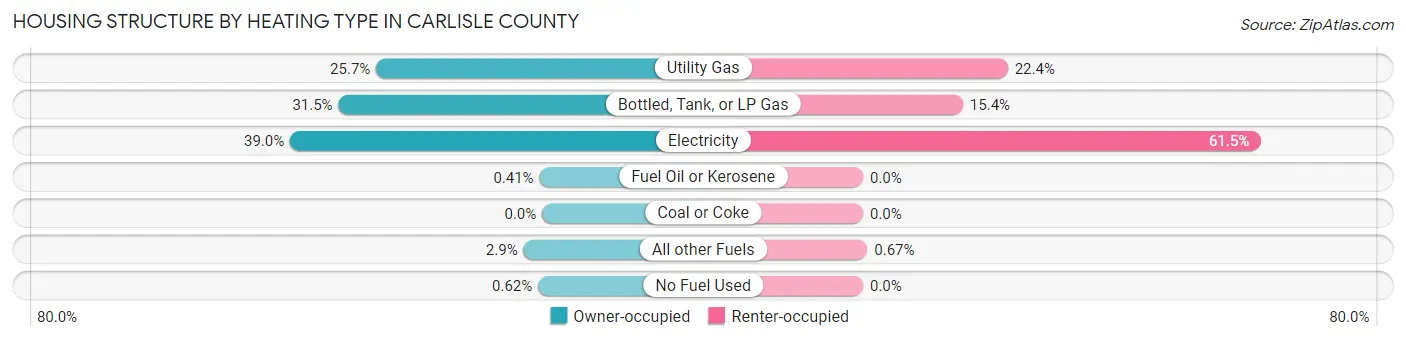
| Heating Type | Owner-occupied | Renter-occupied |
| Utility Gas | 374 (25.7%) | 100 (22.4%) |
| Bottled, Tank, or LP Gas | 459 (31.5%) | 69 (15.4%) |
| Electricity | 568 (39.0%) | 275 (61.5%) |
| Fuel Oil or Kerosene | 6 (0.4%) | 0 (0.0%) |
| Coal or Coke | 0 (0.0%) | 0 (0.0%) |
| All other Fuels | 42 (2.9%) | 3 (0.7%) |
| No Fuel Used | 9 (0.6%) | 0 (0.0%) |
| Total | 1,458 (100.0%) | 447 (100.0%) |
Household Vehicle Usage in Carlisle County
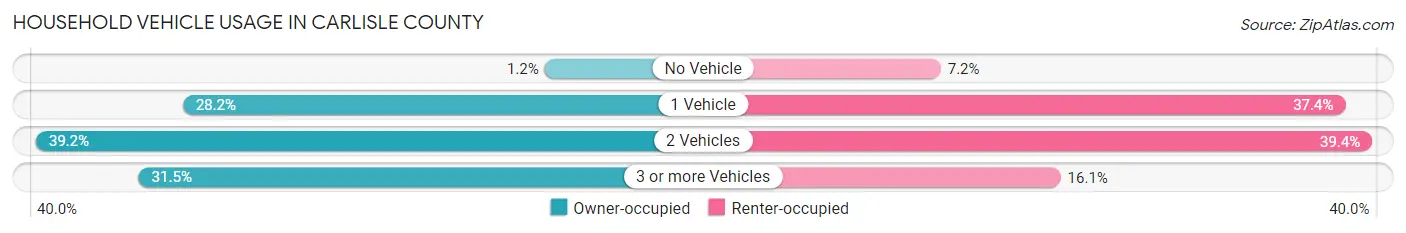
| Vehicles per Household | Owner-occupied | Renter-occupied |
| No Vehicle | 17 (1.2%) | 32 (7.2%) |
| 1 Vehicle | 411 (28.2%) | 167 (37.4%) |
| 2 Vehicles | 571 (39.2%) | 176 (39.4%) |
| 3 or more Vehicles | 459 (31.5%) | 72 (16.1%) |
| Total | 1,458 (100.0%) | 447 (100.0%) |
Real Estate & Mortgages in Carlisle County
Real Estate and Mortgage Overview in Carlisle County
| Characteristic | Without Mortgage | With Mortgage |
| Housing Units | 811 | 647 |
| Median Property Value | $85,200 | $103,500 |
| Median Household Income | $41,125 | $108 |
| Monthly Housing Costs | $377 | $21 |
| Real Estate Taxes | $630 | $54 |
Property Value by Mortgage Status in Carlisle County
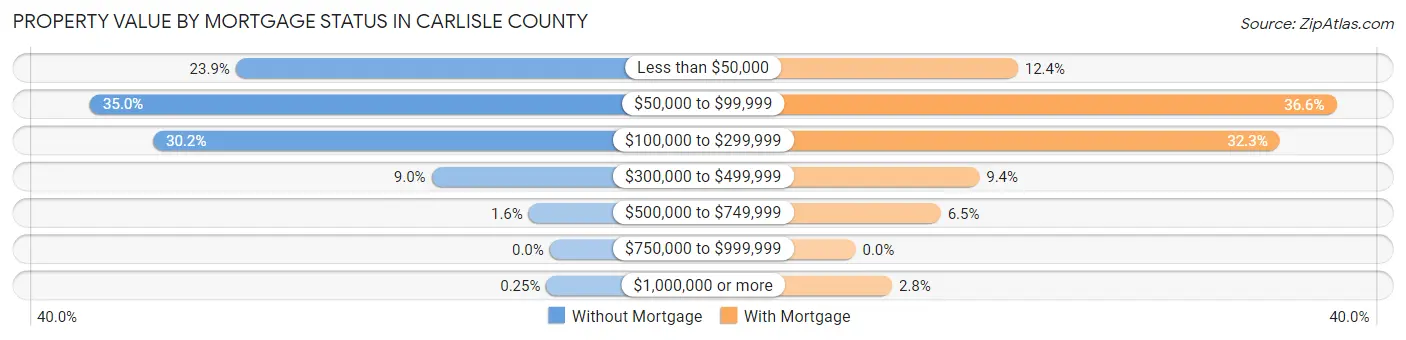
| Property Value | Without Mortgage | With Mortgage |
| Less than $50,000 | 194 (23.9%) | 80 (12.4%) |
| $50,000 to $99,999 | 284 (35.0%) | 237 (36.6%) |
| $100,000 to $299,999 | 245 (30.2%) | 209 (32.3%) |
| $300,000 to $499,999 | 73 (9.0%) | 61 (9.4%) |
| $500,000 to $749,999 | 13 (1.6%) | 42 (6.5%) |
| $750,000 to $999,999 | 0 (0.0%) | 0 (0.0%) |
| $1,000,000 or more | 2 (0.3%) | 18 (2.8%) |
| Total | 811 (100.0%) | 647 (100.0%) |
Household Income by Mortgage Status in Carlisle County
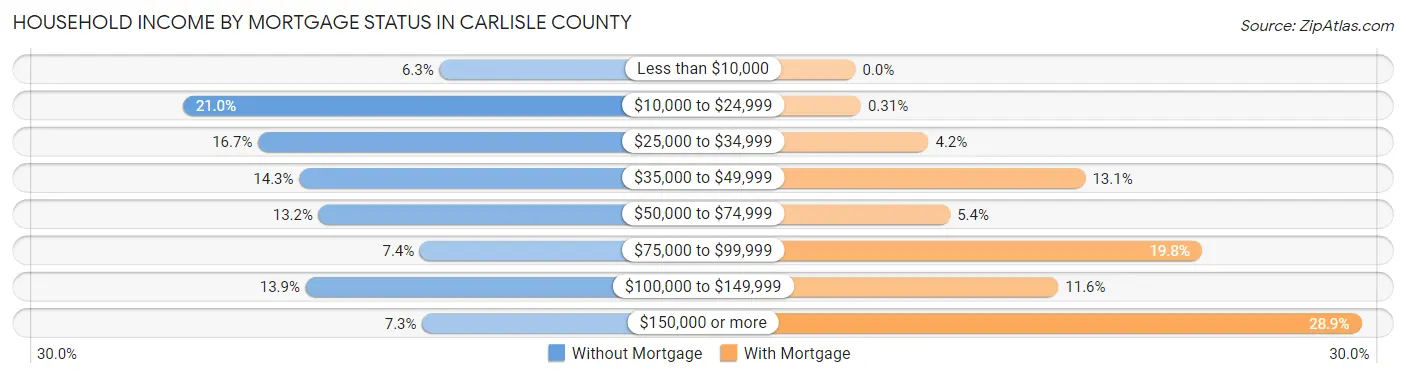
| Household Income | Without Mortgage | With Mortgage |
| Less than $10,000 | 51 (6.3%) | 0 (0.0%) |
| $10,000 to $24,999 | 170 (21.0%) | 2 (0.3%) |
| $25,000 to $34,999 | 135 (16.7%) | 27 (4.2%) |
| $35,000 to $49,999 | 116 (14.3%) | 85 (13.1%) |
| $50,000 to $74,999 | 107 (13.2%) | 35 (5.4%) |
| $75,000 to $99,999 | 60 (7.4%) | 128 (19.8%) |
| $100,000 to $149,999 | 113 (13.9%) | 75 (11.6%) |
| $150,000 or more | 59 (7.3%) | 187 (28.9%) |
| Total | 811 (100.0%) | 647 (100.0%) |
Property Value to Household Income Ratio in Carlisle County
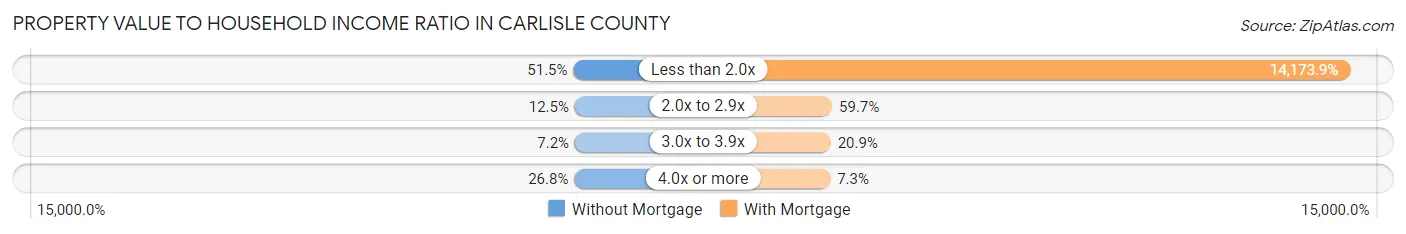
| Value-to-Income Ratio | Without Mortgage | With Mortgage |
| Less than 2.0x | 418 (51.5%) | 91,705 (14,173.9%) |
| 2.0x to 2.9x | 101 (12.4%) | 386 (59.7%) |
| 3.0x to 3.9x | 58 (7.1%) | 135 (20.9%) |
| 4.0x or more | 217 (26.8%) | 47 (7.3%) |
| Total | 811 (100.0%) | 647 (100.0%) |
Real Estate Taxes by Mortgage Status in Carlisle County
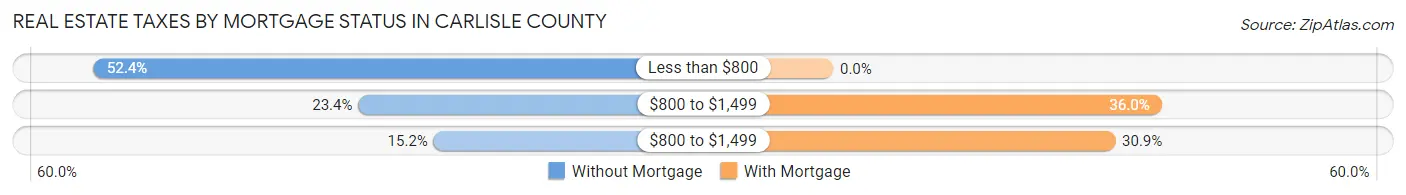
| Property Taxes | Without Mortgage | With Mortgage |
| Less than $800 | 425 (52.4%) | 0 (0.0%) |
| $800 to $1,499 | 190 (23.4%) | 233 (36.0%) |
| $800 to $1,499 | 123 (15.2%) | 200 (30.9%) |
| Total | 811 (100.0%) | 647 (100.0%) |
Health & Disability in Carlisle County
Health Insurance Coverage by Age in Carlisle County
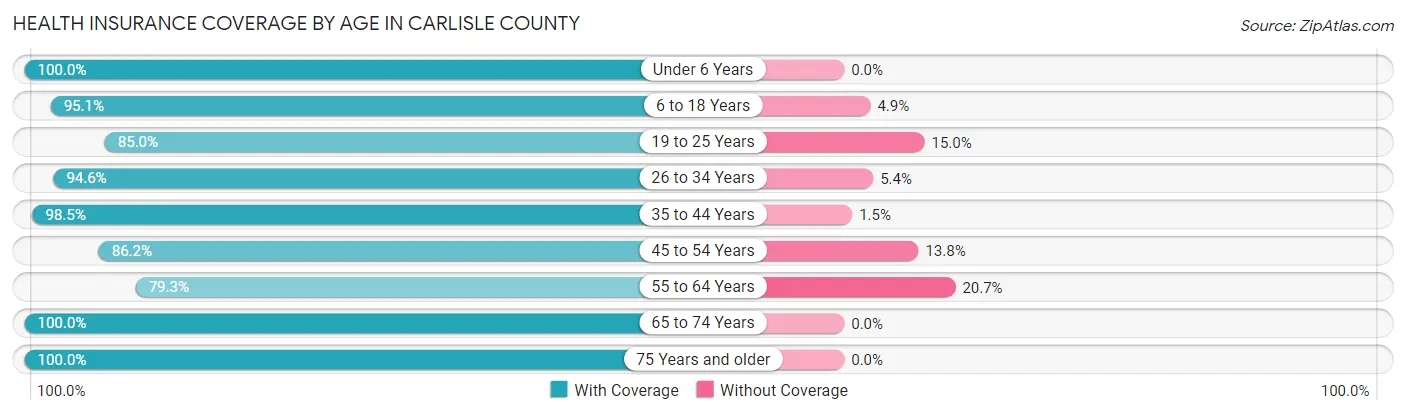
| Age Bracket | With Coverage | Without Coverage |
| Under 6 Years | 360 (100.0%) | 0 (0.0%) |
| 6 to 18 Years | 761 (95.1%) | 39 (4.9%) |
| 19 to 25 Years | 318 (85.0%) | 56 (15.0%) |
| 26 to 34 Years | 456 (94.6%) | 26 (5.4%) |
| 35 to 44 Years | 531 (98.5%) | 8 (1.5%) |
| 45 to 54 Years | 523 (86.2%) | 84 (13.8%) |
| 55 to 64 Years | 497 (79.3%) | 130 (20.7%) |
| 65 to 74 Years | 518 (100.0%) | 0 (0.0%) |
| 75 Years and older | 409 (100.0%) | 0 (0.0%) |
| Total | 4,373 (92.7%) | 343 (7.3%) |
Health Insurance Coverage by Citizenship Status in Carlisle County
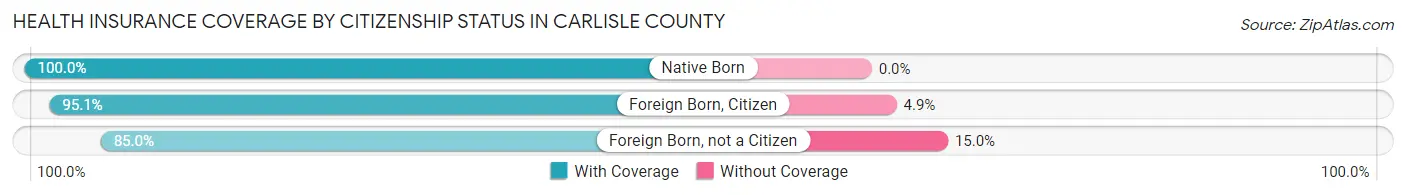
| Citizenship Status | With Coverage | Without Coverage |
| Native Born | 360 (100.0%) | 0 (0.0%) |
| Foreign Born, Citizen | 761 (95.1%) | 39 (4.9%) |
| Foreign Born, not a Citizen | 318 (85.0%) | 56 (15.0%) |
Health Insurance Coverage by Household Income in Carlisle County
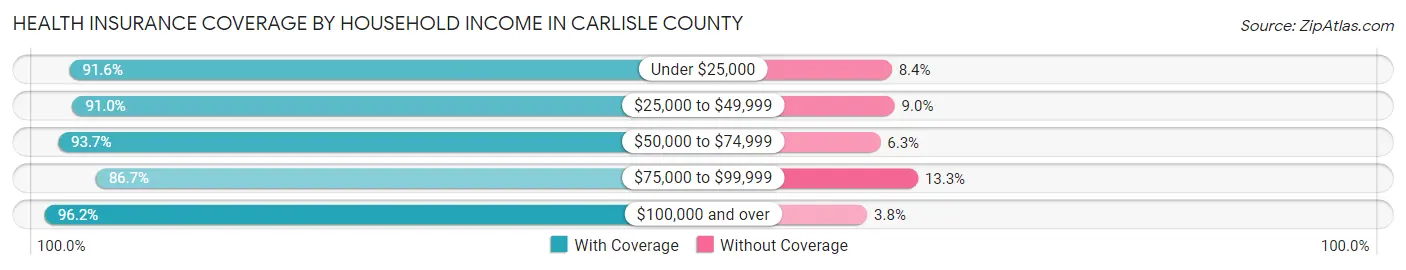
| Household Income | With Coverage | Without Coverage |
| Under $25,000 | 837 (91.6%) | 77 (8.4%) |
| $25,000 to $49,999 | 994 (91.0%) | 98 (9.0%) |
| $50,000 to $74,999 | 776 (93.7%) | 52 (6.3%) |
| $75,000 to $99,999 | 403 (86.7%) | 62 (13.3%) |
| $100,000 and over | 1,363 (96.2%) | 54 (3.8%) |
Public vs Private Health Insurance Coverage by Age in Carlisle County
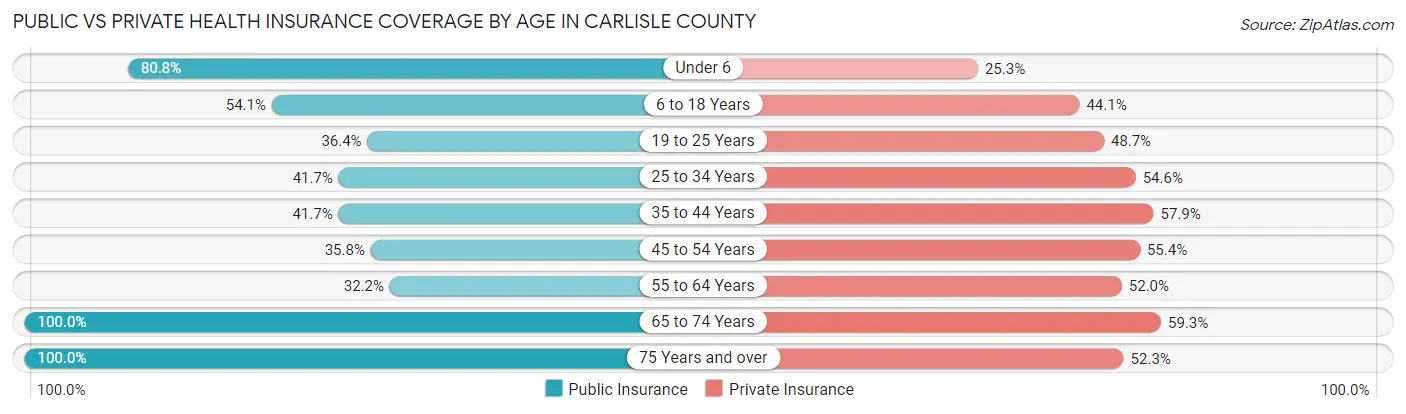
| Age Bracket | Public Insurance | Private Insurance |
| Under 6 | 291 (80.8%) | 91 (25.3%) |
| 6 to 18 Years | 433 (54.1%) | 353 (44.1%) |
| 19 to 25 Years | 136 (36.4%) | 182 (48.7%) |
| 25 to 34 Years | 201 (41.7%) | 263 (54.6%) |
| 35 to 44 Years | 225 (41.7%) | 312 (57.9%) |
| 45 to 54 Years | 217 (35.7%) | 336 (55.3%) |
| 55 to 64 Years | 202 (32.2%) | 326 (52.0%) |
| 65 to 74 Years | 518 (100.0%) | 307 (59.3%) |
| 75 Years and over | 409 (100.0%) | 214 (52.3%) |
| Total | 2,632 (55.8%) | 2,384 (50.5%) |
Disability Status by Sex by Age in Carlisle County
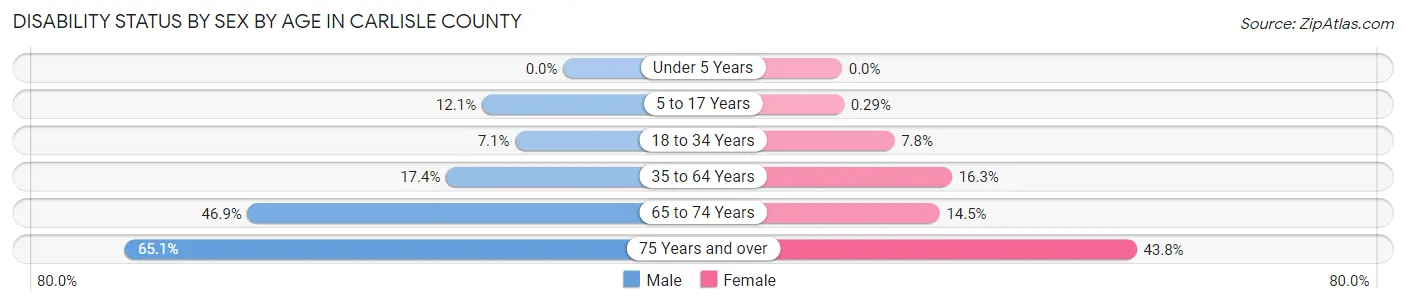
| Age Bracket | Male | Female |
| Under 5 Years | 0 (0.0%) | 0 (0.0%) |
| 5 to 17 Years | 57 (12.1%) | 1 (0.3%) |
| 18 to 34 Years | 30 (7.1%) | 38 (7.8%) |
| 35 to 64 Years | 156 (17.4%) | 143 (16.3%) |
| 65 to 74 Years | 120 (46.9%) | 38 (14.5%) |
| 75 Years and over | 110 (65.1%) | 105 (43.8%) |
Disability Class by Sex by Age in Carlisle County
Disability Class: Hearing Difficulty
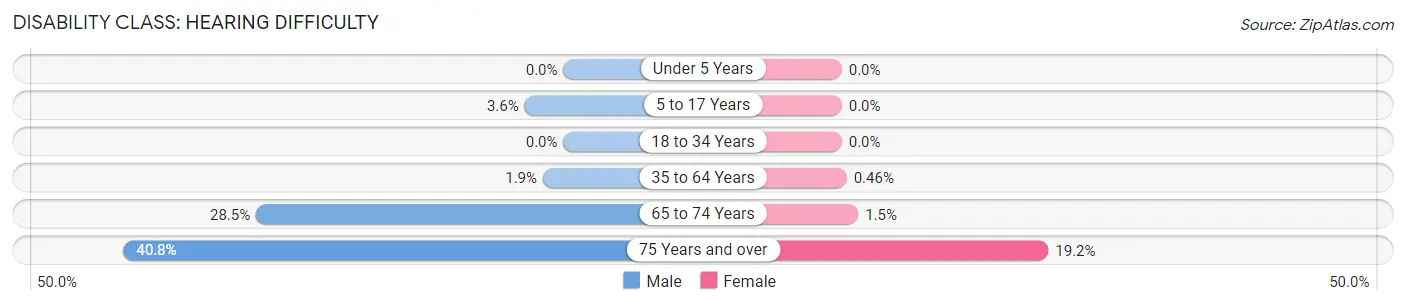
| Age Bracket | Male | Female |
| Under 5 Years | 0 (0.0%) | 0 (0.0%) |
| 5 to 17 Years | 17 (3.6%) | 0 (0.0%) |
| 18 to 34 Years | 0 (0.0%) | 0 (0.0%) |
| 35 to 64 Years | 17 (1.9%) | 4 (0.5%) |
| 65 to 74 Years | 73 (28.5%) | 4 (1.5%) |
| 75 Years and over | 69 (40.8%) | 46 (19.2%) |
Disability Class: Vision Difficulty
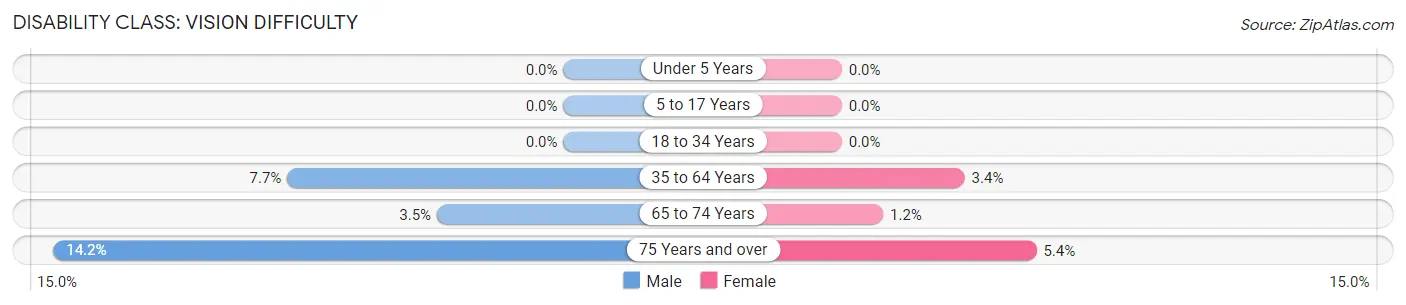
| Age Bracket | Male | Female |
| Under 5 Years | 0 (0.0%) | 0 (0.0%) |
| 5 to 17 Years | 0 (0.0%) | 0 (0.0%) |
| 18 to 34 Years | 0 (0.0%) | 0 (0.0%) |
| 35 to 64 Years | 69 (7.7%) | 30 (3.4%) |
| 65 to 74 Years | 9 (3.5%) | 3 (1.1%) |
| 75 Years and over | 24 (14.2%) | 13 (5.4%) |
Disability Class: Cognitive Difficulty
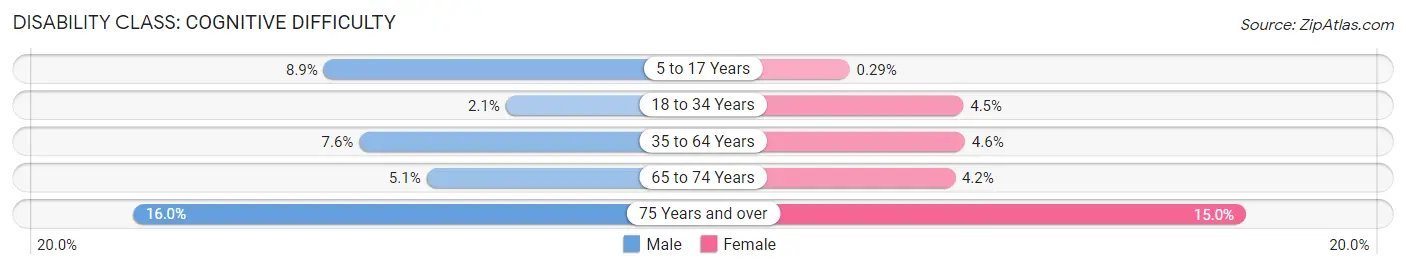
| Age Bracket | Male | Female |
| 5 to 17 Years | 42 (8.9%) | 1 (0.3%) |
| 18 to 34 Years | 9 (2.1%) | 22 (4.5%) |
| 35 to 64 Years | 68 (7.6%) | 40 (4.6%) |
| 65 to 74 Years | 13 (5.1%) | 11 (4.2%) |
| 75 Years and over | 27 (16.0%) | 36 (15.0%) |
Disability Class: Ambulatory Difficulty
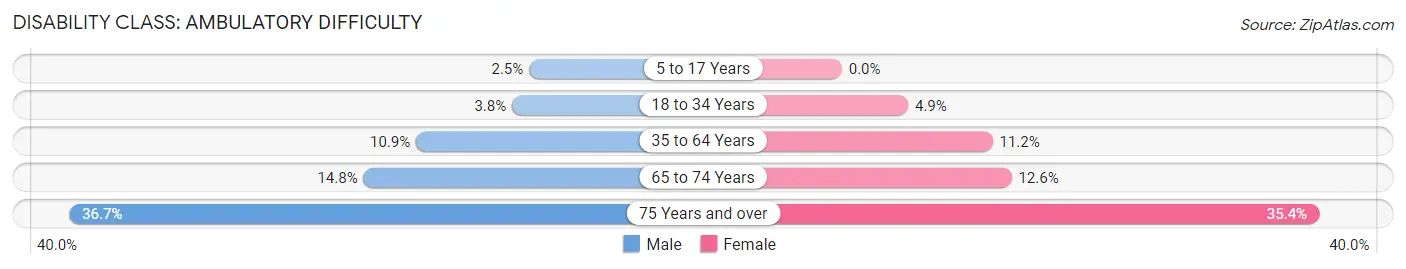
| Age Bracket | Male | Female |
| 5 to 17 Years | 12 (2.5%) | 0 (0.0%) |
| 18 to 34 Years | 16 (3.8%) | 24 (4.9%) |
| 35 to 64 Years | 98 (10.9%) | 98 (11.2%) |
| 65 to 74 Years | 38 (14.8%) | 33 (12.6%) |
| 75 Years and over | 62 (36.7%) | 85 (35.4%) |
Disability Class: Self-Care Difficulty
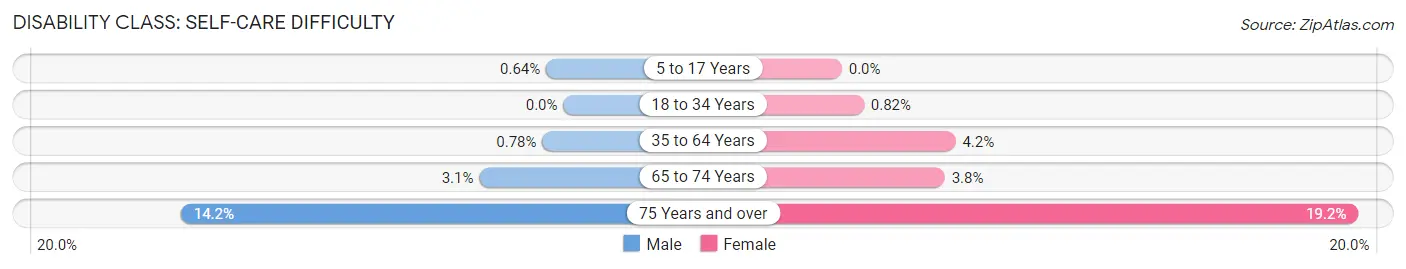
| Age Bracket | Male | Female |
| 5 to 17 Years | 3 (0.6%) | 0 (0.0%) |
| 18 to 34 Years | 0 (0.0%) | 4 (0.8%) |
| 35 to 64 Years | 7 (0.8%) | 37 (4.2%) |
| 65 to 74 Years | 8 (3.1%) | 10 (3.8%) |
| 75 Years and over | 24 (14.2%) | 46 (19.2%) |
Technology Access in Carlisle County
Computing Device Access in Carlisle County
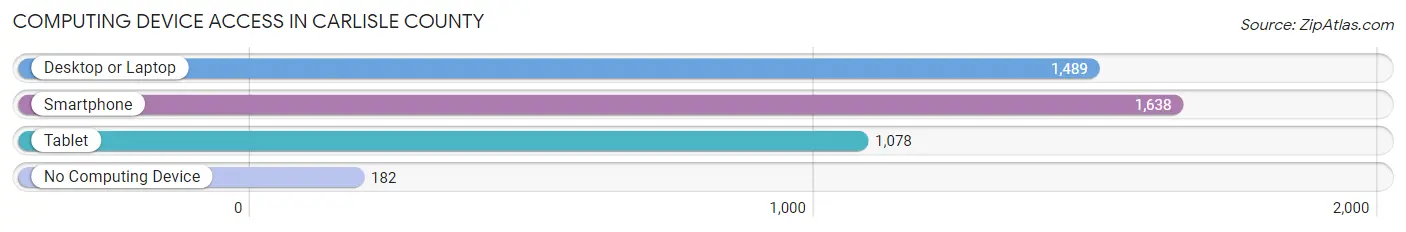
| Device Type | # Households | % Households |
| Desktop or Laptop | 1,489 | 78.2% |
| Smartphone | 1,638 | 86.0% |
| Tablet | 1,078 | 56.6% |
| No Computing Device | 182 | 9.6% |
| Total | 1,905 | 100.0% |
Internet Access in Carlisle County
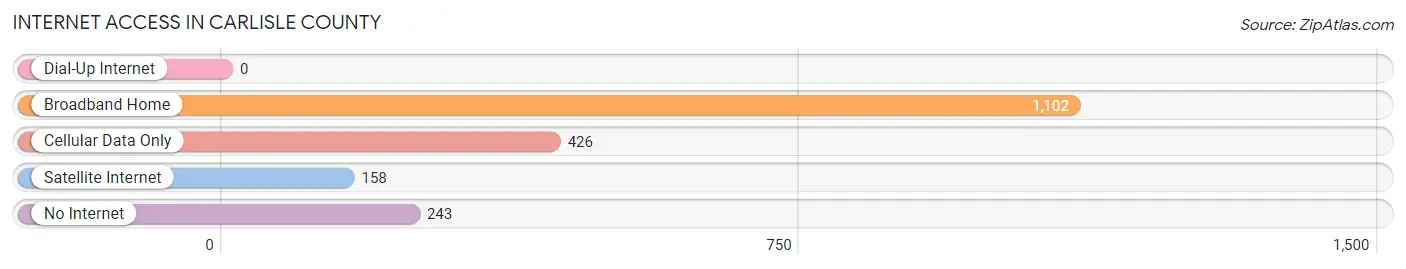
| Internet Type | # Households | % Households |
| Dial-Up Internet | 0 | 0.0% |
| Broadband Home | 1,102 | 57.9% |
| Cellular Data Only | 426 | 22.4% |
| Satellite Internet | 158 | 8.3% |
| No Internet | 243 | 12.8% |
| Total | 1,905 | 100.0% |
Carlisle County Summary
Carlisle County is a county located in the U.S. state of Kentucky. As of the 2010 census, the population was 5,104, making it the second-least populous county in Kentucky. Its county seat is Bardwell. The county was formed in 1886 from parts of Ballard and Hickman counties and named for Kentucky Governor James F. Robinson's home county in Kentucky.
Geography
Carlisle County is located in the western part of Kentucky, along the Mississippi River. It is bordered by Ballard County to the north, Hickman County to the east, Fulton County to the south, and Mississippi County, Missouri to the west. The county has a total area of 246 square miles, of which 241 square miles is land and 5.2 square miles (2.1%) is water.
The county is mostly flat, with some rolling hills in the northern part. The highest point in the county is located in the northwest corner, at an elevation of 437 feet above sea level. The county is drained by the Mississippi River, which forms its western border.
Demographics
As of the 2010 census, there were 5,104 people, 2,068 households, and 1,457 families residing in the county. The population density was 21.2 people per square mile. There were 2,323 housing units at an average density of 9.6 per square mile. The racial makeup of the county was 95.2% White, 2.7% Black or African American, 0.2% Native American, 0.2% Asian, 0.2% Pacific Islander, 0.6% from other races, and 0.9% from two or more races. 1.6% of the population were Hispanic or Latino of any race.
There were 2,068 households, out of which 30.2% had children under the age of 18 living with them, 54.2% were married couples living together, 11.2% had a female householder with no husband present, and 30.2% were non-families. 26.2% of all households were made up of individuals, and 12.2% had someone living alone who was 65 years of age or older. The average household size was 2.45 and the average family size was 2.94.
The age distribution was 24.2% under the age of 18, 8.2% from 18 to 24, 26.2% from 25 to 44, 25.2% from 45 to 64, and 16.2% who were 65 years of age or older. The median age was 38.4 years. For every 100 females, there were 94.2 males. For every 100 females age 18 and over, there were 91.2 males.
The median income for a household in the county was $35,938, and the median income for a family was $41,944. Males had a median income of $35,000 versus $22,917 for females. The per capita income for the county was $17,845. About 13.2% of families and 16.2% of the population were below the poverty line, including 22.2% of those under age 18 and 14.2% of those age 65 or over.
Economy
The economy of Carlisle County is largely based on agriculture. The county is home to several large farms, as well as smaller family-owned farms. The main crops grown in the county are corn, soybeans, wheat, and hay. Livestock production is also important, with cattle, hogs, and poultry being the main animals raised.
The county also has a small manufacturing sector, with several small factories producing a variety of products, including furniture, clothing, and food products. There is also a small tourism industry, with visitors coming to the county to enjoy its natural beauty and outdoor activities.
Conclusion
Carlisle County is a rural county located in western Kentucky, along the Mississippi River. It has a population of 5,104, and is largely agricultural, with a small manufacturing sector and a small tourism industry. The county is home to several large farms, as well as smaller family-owned farms, and is known for its natural beauty and outdoor activities.
Common Questions
What is Per Capita Income in Carlisle County?
Per Capita income in Carlisle County is $31,403.
What is the Median Family Income in Carlisle County?
Median Family Income in Carlisle County is $66,250.
What is the Median Household income in Carlisle County?
Median Household Income in Carlisle County is $53,065.
What is Income or Wage Gap in Carlisle County?
Income or Wage Gap in Carlisle County is 34.5%.
Women in Carlisle County earn 65.5 cents for every dollar earned by a man.
What is Inequality or Gini Index in Carlisle County?
Inequality or Gini Index in Carlisle County is 0.51.
What is the Total Population of Carlisle County?
Total Population of Carlisle County is 4,782.
What is the Total Male Population of Carlisle County?
Total Male Population of Carlisle County is 2,402.
What is the Total Female Population of Carlisle County?
Total Female Population of Carlisle County is 2,380.
What is the Ratio of Males per 100 Females in Carlisle County?
There are 100.92 Males per 100 Females in Carlisle County.
What is the Ratio of Females per 100 Males in Carlisle County?
There are 99.08 Females per 100 Males in Carlisle County.
What is the Median Population Age in Carlisle County?
Median Population Age in Carlisle County is 42.9 Years.
What is the Average Family Size in Carlisle County
Average Family Size in Carlisle County is 3.0 People.
What is the Average Household Size in Carlisle County
Average Household Size in Carlisle County is 2.5 People.
How Large is the Labor Force in Carlisle County?
There are 1,906 People in the Labor Forcein in Carlisle County.
What is the Percentage of People in the Labor Force in Carlisle County?
50.3% of People are in the Labor Force in Carlisle County.
What is the Unemployment Rate in Carlisle County?
Unemployment Rate in Carlisle County is 4.2%.