Breckinridge County, KY Map & Demographics
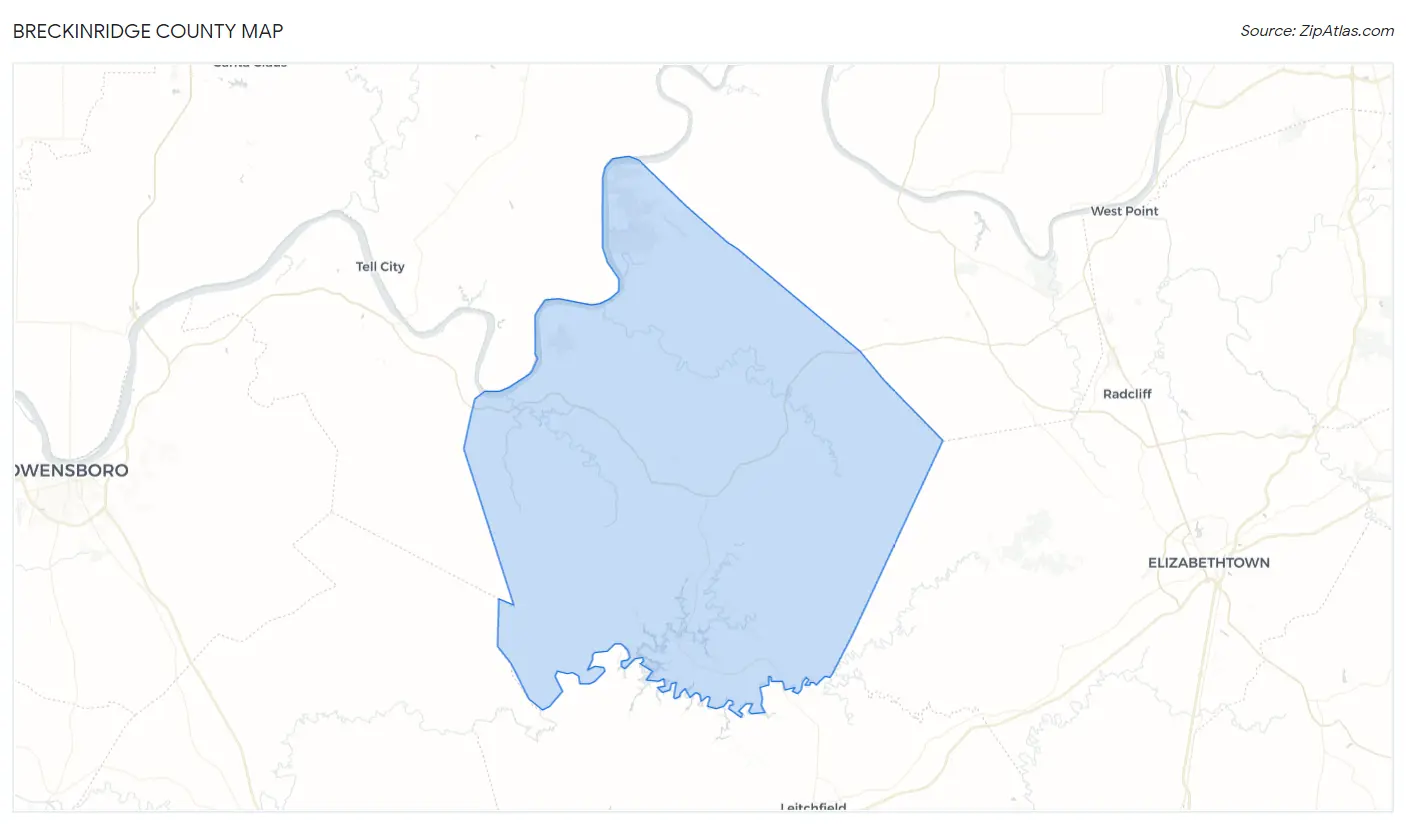
Breckinridge County Map
Breckinridge County Overview
$27,733
PER CAPITA INCOME
$64,675
AVG FAMILY INCOME
$51,756
AVG HOUSEHOLD INCOME
40.4%
WAGE / INCOME GAP [ % ]
59.6¢/ $1
WAGE / INCOME GAP [ $ ]
$12,549
FAMILY INCOME DEFICIT
0.46
INEQUALITY / GINI INDEX
20,528
TOTAL POPULATION
10,403
MALE POPULATION
10,125
FEMALE POPULATION
102.75
MALES / 100 FEMALES
97.33
FEMALES / 100 MALES
42.3
MEDIAN AGE
3.3
AVG FAMILY SIZE
2.7
AVG HOUSEHOLD SIZE
8,489
LABOR FORCE [ PEOPLE ]
51.7%
PERCENT IN LABOR FORCE
7.7%
UNEMPLOYMENT RATE
Breckinridge County Area Codes
Income in Breckinridge County
Income Overview in Breckinridge County
Per Capita Income in Breckinridge County is $27,733, while median incomes of families and households are $64,675 and $51,756 respectively.
| Characteristic | Number | Measure |
| Per Capita Income | 20,528 | $27,733 |
| Median Family Income | 5,048 | $64,675 |
| Mean Family Income | 5,048 | $81,930 |
| Median Household Income | 7,542 | $51,756 |
| Mean Household Income | 7,542 | $69,871 |
| Income Deficit | 5,048 | $12,549 |
| Wage / Income Gap (%) | 20,528 | 40.38% |
| Wage / Income Gap ($) | 20,528 | 59.62¢ per $1 |
| Gini / Inequality Index | 20,528 | 0.46 |
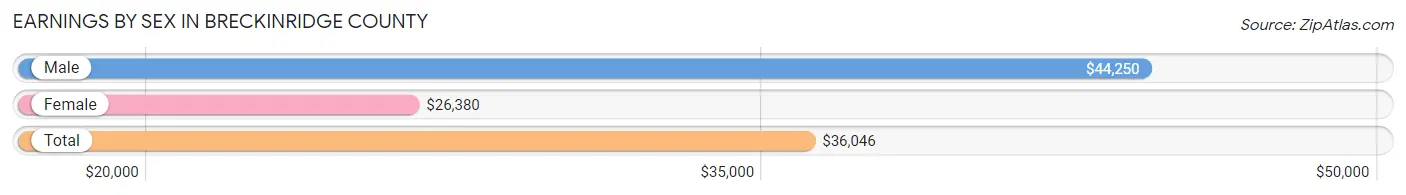
Earnings by Sex in Breckinridge County
Average Earnings in Breckinridge County are $36,046, $44,250 for men and $26,380 for women, a difference of 40.4%.
| Sex | Number | Average Earnings |
| Male | 4,707 (53.5%) | $44,250 |
| Female | 4,094 (46.5%) | $26,380 |
| Total | 8,801 (100.0%) | $36,046 |
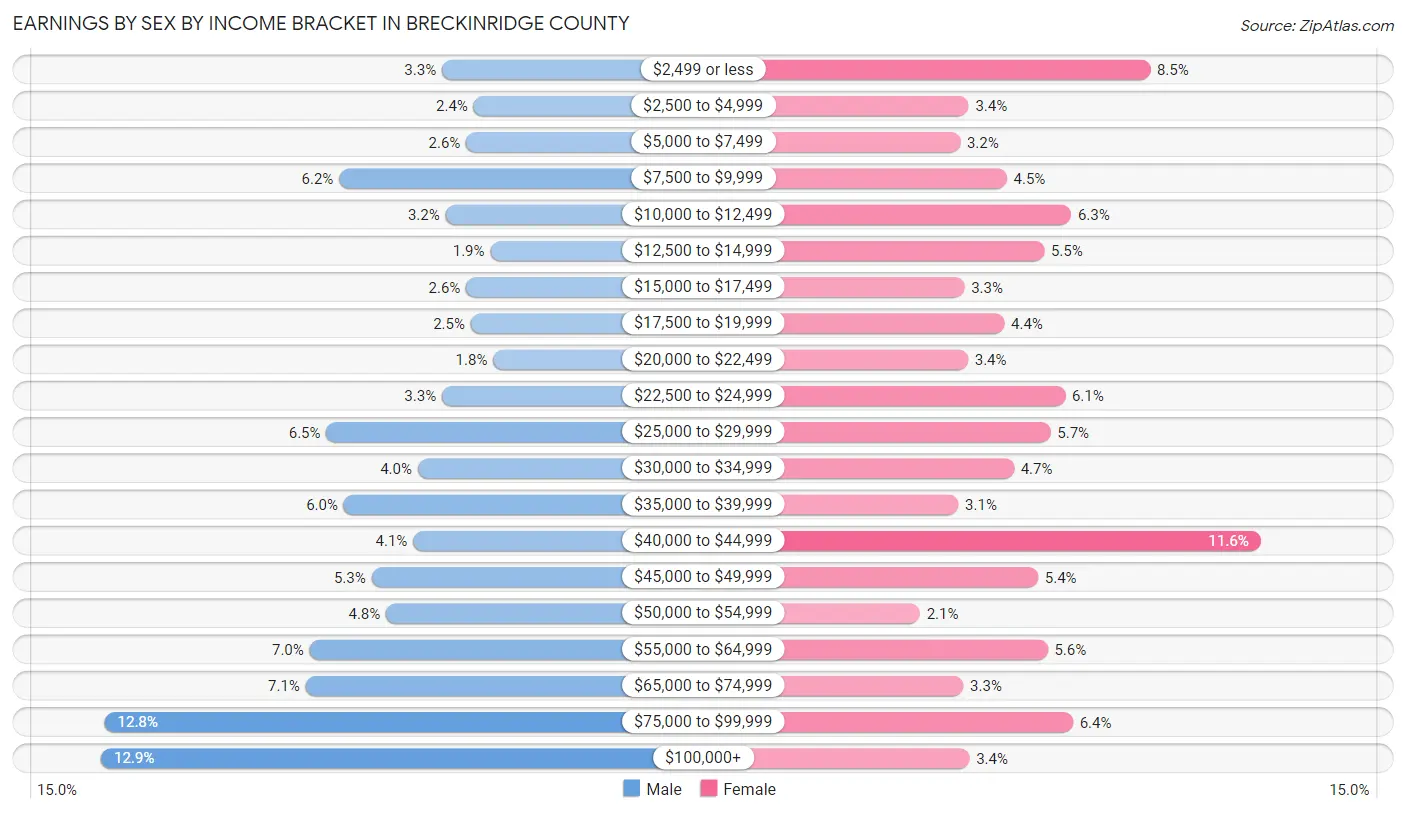
Earnings by Sex by Income Bracket in Breckinridge County
The most common earnings brackets in Breckinridge County are $100,000+ for men (605 | 12.9%) and $40,000 to $44,999 for women (476 | 11.6%).
| Income | Male | Female |
| $2,499 or less | 154 (3.3%) | 349 (8.5%) |
| $2,500 to $4,999 | 112 (2.4%) | 140 (3.4%) |
| $5,000 to $7,499 | 122 (2.6%) | 130 (3.2%) |
| $7,500 to $9,999 | 290 (6.2%) | 184 (4.5%) |
| $10,000 to $12,499 | 149 (3.2%) | 258 (6.3%) |
| $12,500 to $14,999 | 90 (1.9%) | 227 (5.5%) |
| $15,000 to $17,499 | 122 (2.6%) | 135 (3.3%) |
| $17,500 to $19,999 | 116 (2.5%) | 181 (4.4%) |
| $20,000 to $22,499 | 86 (1.8%) | 139 (3.4%) |
| $22,500 to $24,999 | 154 (3.3%) | 251 (6.1%) |
| $25,000 to $29,999 | 307 (6.5%) | 234 (5.7%) |
| $30,000 to $34,999 | 186 (4.0%) | 192 (4.7%) |
| $35,000 to $39,999 | 284 (6.0%) | 128 (3.1%) |
| $40,000 to $44,999 | 192 (4.1%) | 476 (11.6%) |
| $45,000 to $49,999 | 247 (5.2%) | 220 (5.4%) |
| $50,000 to $54,999 | 228 (4.8%) | 84 (2.1%) |
| $55,000 to $64,999 | 329 (7.0%) | 231 (5.6%) |
| $65,000 to $74,999 | 334 (7.1%) | 134 (3.3%) |
| $75,000 to $99,999 | 600 (12.8%) | 260 (6.4%) |
| $100,000+ | 605 (12.9%) | 141 (3.4%) |
| Total | 4,707 (100.0%) | 4,094 (100.0%) |
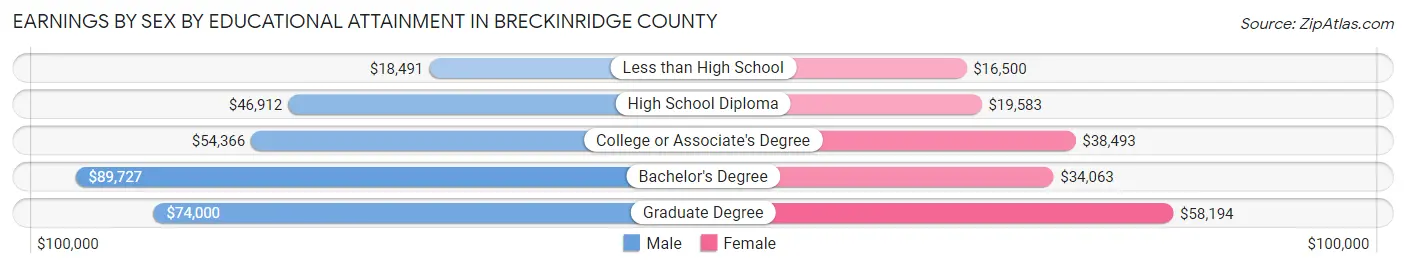
Earnings by Sex by Educational Attainment in Breckinridge County
Average earnings in Breckinridge County are $51,960 for men and $31,014 for women, a difference of 40.3%. Men with an educational attainment of bachelor's degree enjoy the highest average annual earnings of $89,727, while those with less than high school education earn the least with $18,491. Women with an educational attainment of graduate degree earn the most with the average annual earnings of $58,194, while those with less than high school education have the smallest earnings of $16,500.
| Educational Attainment | Male Income | Female Income |
| Less than High School | $18,491 | $16,500 |
| High School Diploma | $46,912 | $19,583 |
| College or Associate's Degree | $54,366 | $38,493 |
| Bachelor's Degree | $89,727 | $34,063 |
| Graduate Degree | $74,000 | $58,194 |
| Total | $51,960 | $31,014 |
Family Income in Breckinridge County
Family Income Brackets in Breckinridge County
According to the Breckinridge County family income data, there are 924 families falling into the $100,000 to $149,999 income range, which is the most common income bracket and makes up 18.3% of all families. Conversely, the less than $10,000 income bracket is the least frequent group with only 222 families (4.4%) belonging to this category.
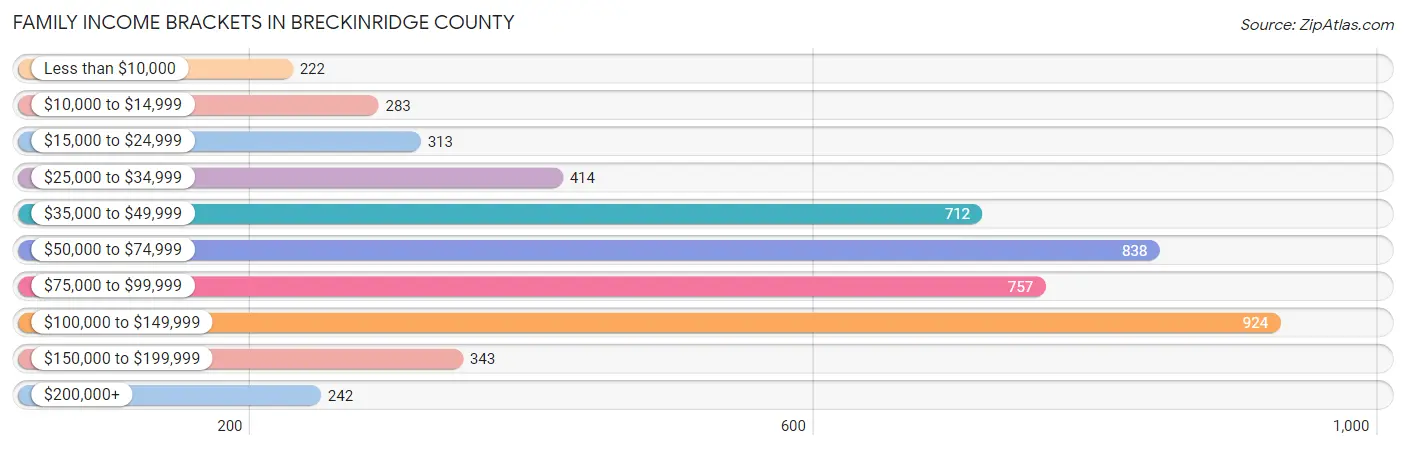
| Income Bracket | # Families | % Families |
| Less than $10,000 | 222 | 4.4% |
| $10,000 to $14,999 | 283 | 5.6% |
| $15,000 to $24,999 | 313 | 6.2% |
| $25,000 to $34,999 | 414 | 8.2% |
| $35,000 to $49,999 | 712 | 14.1% |
| $50,000 to $74,999 | 838 | 16.6% |
| $75,000 to $99,999 | 757 | 15.0% |
| $100,000 to $149,999 | 924 | 18.3% |
| $150,000 to $199,999 | 343 | 6.8% |
| $200,000+ | 242 | 4.8% |
Family Income by Famaliy Size in Breckinridge County
5-person families (282 | 5.6%) account for the highest median family income in Breckinridge County with $107,500 per family, while 2-person families (2,655 | 52.6%) have the highest median income of $29,238 per family member.
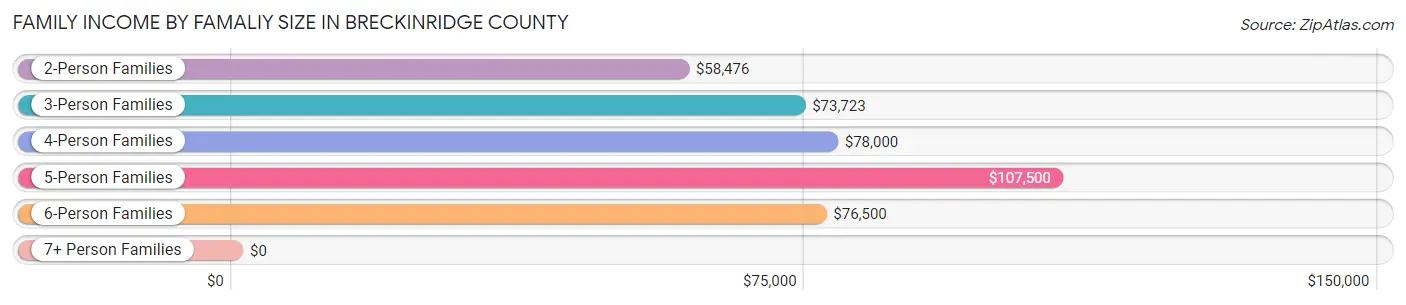
| Income Bracket | # Families | Median Income |
| 2-Person Families | 2,655 (52.6%) | $58,476 |
| 3-Person Families | 1,179 (23.4%) | $73,723 |
| 4-Person Families | 760 (15.1%) | $78,000 |
| 5-Person Families | 282 (5.6%) | $107,500 |
| 6-Person Families | 74 (1.5%) | $76,500 |
| 7+ Person Families | 98 (1.9%) | $0 |
| Total | 5,048 (100.0%) | $64,675 |
Family Income by Number of Earners in Breckinridge County
The median family income in Breckinridge County is $64,675, with families comprising 3+ earners (534) having the highest median family income of $145,644, while families with no earners (1,197) have the lowest median family income of $32,321, accounting for 10.6% and 23.7% of families, respectively.
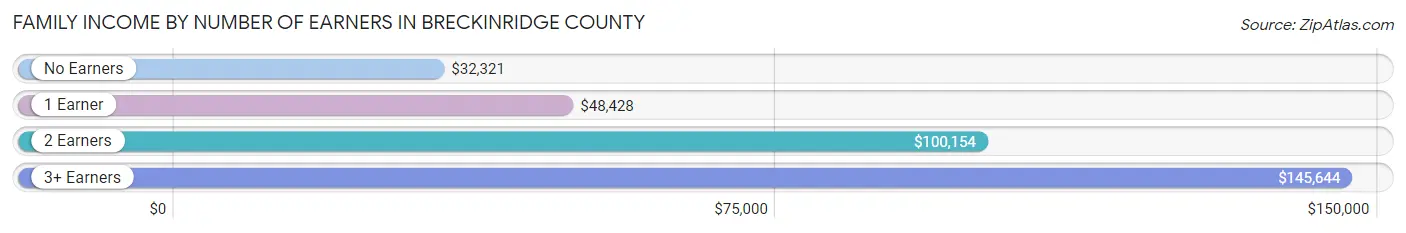
| Number of Earners | # Families | Median Income |
| No Earners | 1,197 (23.7%) | $32,321 |
| 1 Earner | 1,819 (36.0%) | $48,428 |
| 2 Earners | 1,498 (29.7%) | $100,154 |
| 3+ Earners | 534 (10.6%) | $145,644 |
| Total | 5,048 (100.0%) | $64,675 |
Household Income in Breckinridge County
Household Income Brackets in Breckinridge County
With 1,275 households falling in the category, the $50,000 to $74,999 income range is the most frequent in Breckinridge County, accounting for 16.9% of all households. In contrast, only 279 households (3.7%) fall into the $200,000+ income bracket, making it the least populous group.
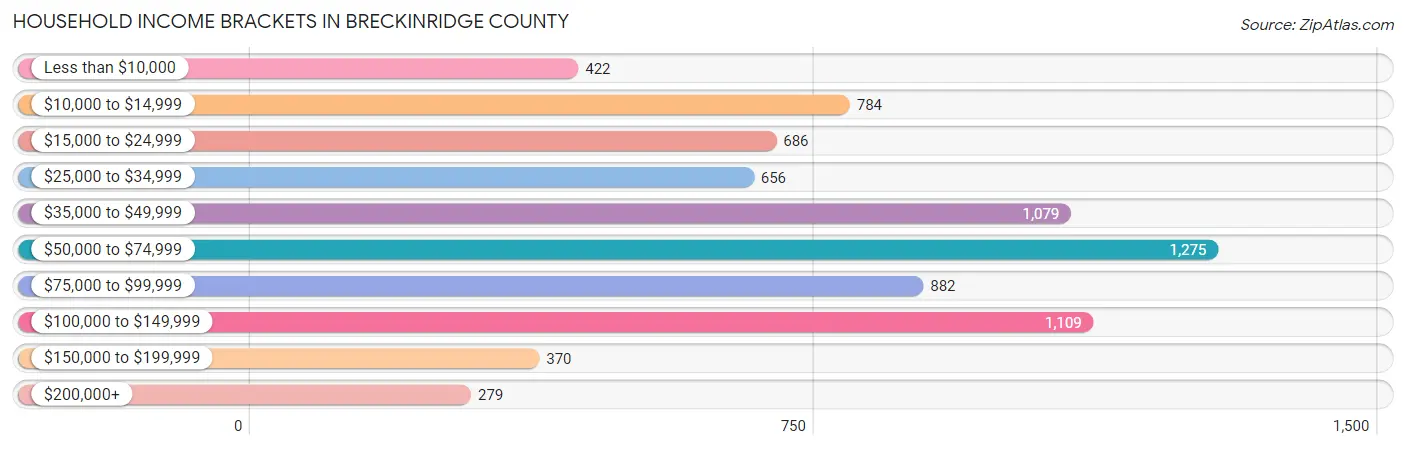
| Income Bracket | # Households | % Households |
| Less than $10,000 | 422 | 5.6% |
| $10,000 to $14,999 | 784 | 10.4% |
| $15,000 to $24,999 | 686 | 9.1% |
| $25,000 to $34,999 | 656 | 8.7% |
| $35,000 to $49,999 | 1,079 | 14.3% |
| $50,000 to $74,999 | 1,275 | 16.9% |
| $75,000 to $99,999 | 882 | 11.7% |
| $100,000 to $149,999 | 1,109 | 14.7% |
| $150,000 to $199,999 | 370 | 4.9% |
| $200,000+ | 279 | 3.7% |
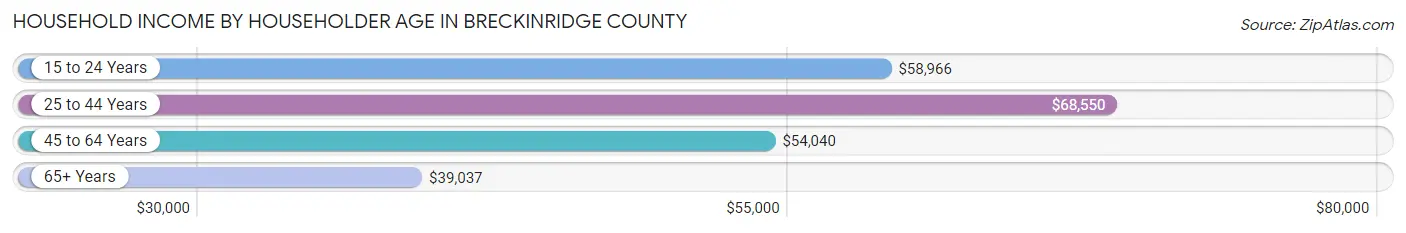
Household Income by Householder Age in Breckinridge County
The median household income in Breckinridge County is $51,756, with the highest median household income of $68,550 found in the 25 to 44 years age bracket for the primary householder. A total of 1,847 households (24.5%) fall into this category. Meanwhile, the 65+ years age bracket for the primary householder has the lowest median household income of $39,037, with 2,357 households (31.2%) in this group.
| Income Bracket | # Households | Median Income |
| 15 to 24 Years | 204 (2.7%) | $58,966 |
| 25 to 44 Years | 1,847 (24.5%) | $68,550 |
| 45 to 64 Years | 3,134 (41.5%) | $54,040 |
| 65+ Years | 2,357 (31.2%) | $39,037 |
| Total | 7,542 (100.0%) | $51,756 |
Poverty in Breckinridge County
Income Below Poverty by Sex and Age in Breckinridge County
With 23.4% poverty level for males and 23.6% for females among the residents of Breckinridge County, under 5 year old males and under 5 year old females are the most vulnerable to poverty, with 308 males (52.1%) and 227 females (41.3%) in their respective age groups living below the poverty level.
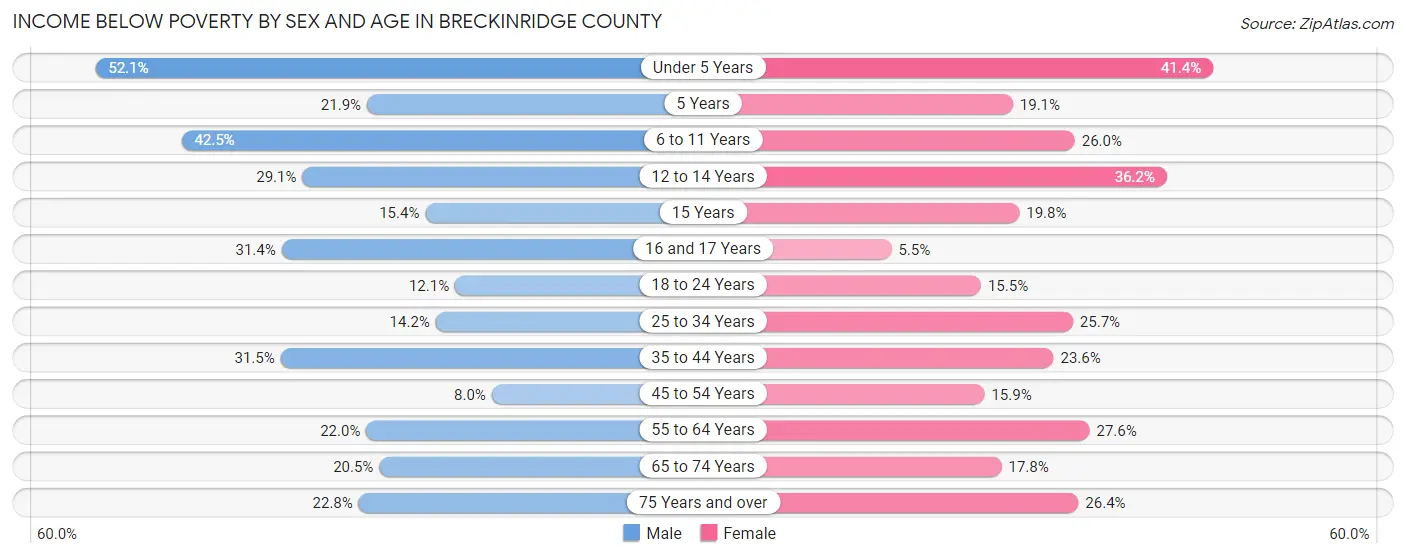
| Age Bracket | Male | Female |
| Under 5 Years | 308 (52.1%) | 227 (41.3%) |
| 5 Years | 14 (21.9%) | 8 (19.1%) |
| 6 to 11 Years | 333 (42.5%) | 178 (26.0%) |
| 12 to 14 Years | 132 (29.1%) | 190 (36.2%) |
| 15 Years | 22 (15.4%) | 35 (19.8%) |
| 16 and 17 Years | 102 (31.4%) | 11 (5.5%) |
| 18 to 24 Years | 106 (12.1%) | 128 (15.5%) |
| 25 to 34 Years | 145 (14.2%) | 261 (25.7%) |
| 35 to 44 Years | 355 (31.5%) | 273 (23.6%) |
| 45 to 54 Years | 99 (8.0%) | 209 (15.9%) |
| 55 to 64 Years | 354 (22.0%) | 416 (27.6%) |
| 65 to 74 Years | 247 (20.5%) | 216 (17.8%) |
| 75 Years and over | 150 (22.8%) | 215 (26.4%) |
| Total | 2,367 (23.4%) | 2,367 (23.6%) |
Income Above Poverty by Sex and Age in Breckinridge County
According to the poverty statistics in Breckinridge County, males aged 45 to 54 years and females aged 16 and 17 years are the age groups that are most secure financially, with 92.0% of males and 94.5% of females in these age groups living above the poverty line.
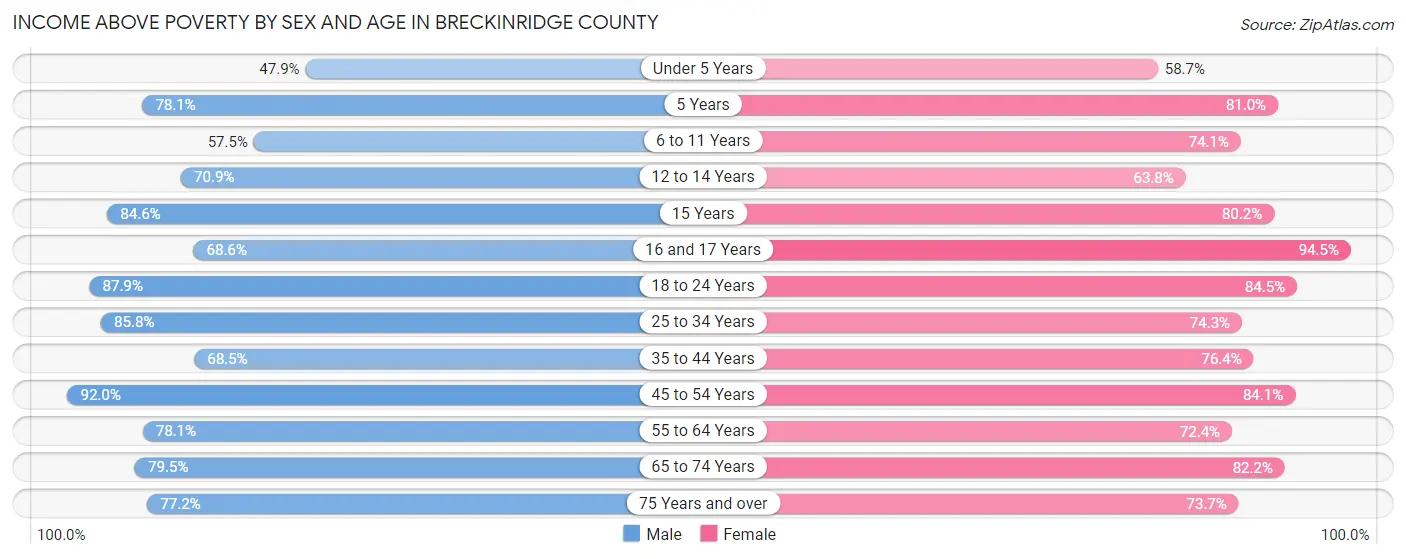
| Age Bracket | Male | Female |
| Under 5 Years | 283 (47.9%) | 322 (58.7%) |
| 5 Years | 50 (78.1%) | 34 (80.9%) |
| 6 to 11 Years | 450 (57.5%) | 508 (74.1%) |
| 12 to 14 Years | 322 (70.9%) | 335 (63.8%) |
| 15 Years | 121 (84.6%) | 142 (80.2%) |
| 16 and 17 Years | 223 (68.6%) | 188 (94.5%) |
| 18 to 24 Years | 772 (87.9%) | 698 (84.5%) |
| 25 to 34 Years | 875 (85.8%) | 753 (74.3%) |
| 35 to 44 Years | 772 (68.5%) | 885 (76.4%) |
| 45 to 54 Years | 1,141 (92.0%) | 1,106 (84.1%) |
| 55 to 64 Years | 1,259 (78.0%) | 1,092 (72.4%) |
| 65 to 74 Years | 957 (79.5%) | 998 (82.2%) |
| 75 Years and over | 508 (77.2%) | 601 (73.7%) |
| Total | 7,733 (76.6%) | 7,662 (76.4%) |
Income Below Poverty Among Married-Couple Families in Breckinridge County
The poverty statistics for married-couple families in Breckinridge County show that 12.1% or 485 of the total 4,023 families live below the poverty line. Families with 5 or more children have the highest poverty rate of 100.0%, comprising of 69 families. On the other hand, families with 3 or 4 children have the lowest poverty rate of 7.1%, which includes 13 families.
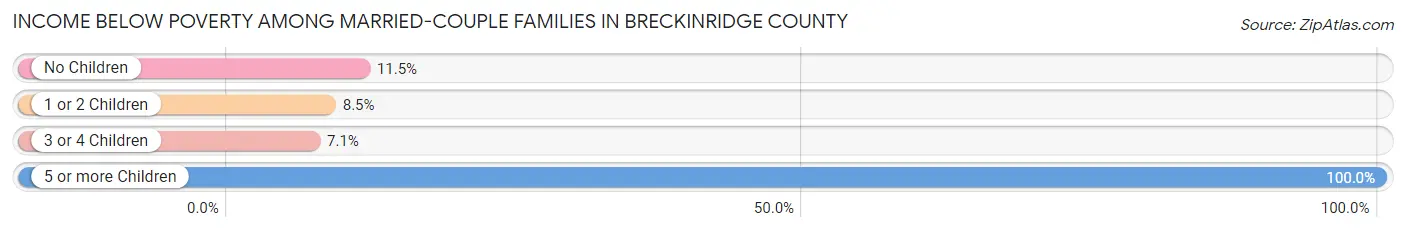
| Children | Above Poverty | Below Poverty |
| No Children | 2,444 (88.5%) | 317 (11.5%) |
| 1 or 2 Children | 925 (91.5%) | 86 (8.5%) |
| 3 or 4 Children | 169 (92.9%) | 13 (7.1%) |
| 5 or more Children | 0 (0.0%) | 69 (100.0%) |
| Total | 3,538 (87.9%) | 485 (12.1%) |
Income Below Poverty Among Single-Parent Households in Breckinridge County
According to the poverty data in Breckinridge County, 24.2% or 54 single-father households and 33.0% or 265 single-mother households are living below the poverty line. Among single-father households, those with 3 or 4 children have the highest poverty rate, with 11 households (100.0%) experiencing poverty. Likewise, among single-mother households, those with 1 or 2 children have the highest poverty rate, with 186 households (41.8%) falling below the poverty line.
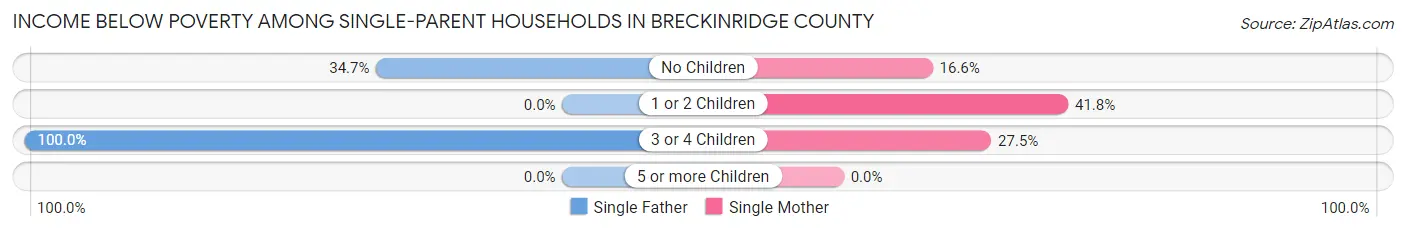
| Children | Single Father | Single Mother |
| No Children | 43 (34.7%) | 29 (16.6%) |
| 1 or 2 Children | 0 (0.0%) | 186 (41.8%) |
| 3 or 4 Children | 11 (100.0%) | 50 (27.5%) |
| 5 or more Children | 0 (0.0%) | 0 (0.0%) |
| Total | 54 (24.2%) | 265 (33.0%) |
Income Below Poverty Among Married-Couple vs Single-Parent Households in Breckinridge County
The poverty data for Breckinridge County shows that 485 of the married-couple family households (12.1%) and 319 of the single-parent households (31.1%) are living below the poverty level. Within the married-couple family households, those with 5 or more children have the highest poverty rate, with 69 households (100.0%) falling below the poverty line. Among the single-parent households, those with 1 or 2 children have the highest poverty rate, with 186 household (34.9%) living below poverty.
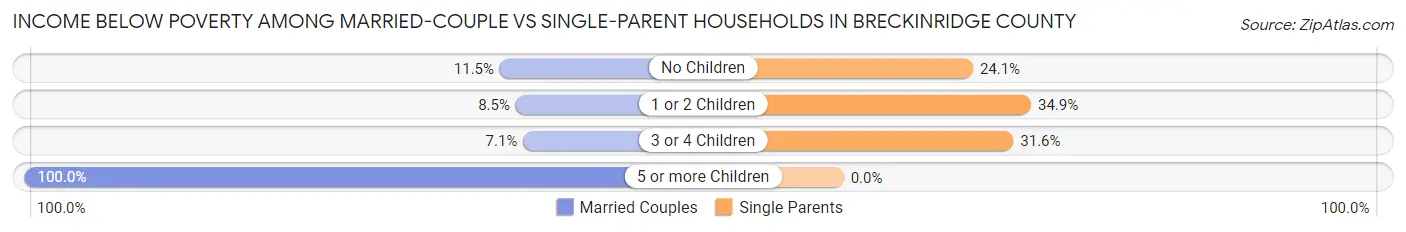
| Children | Married-Couple Families | Single-Parent Households |
| No Children | 317 (11.5%) | 72 (24.1%) |
| 1 or 2 Children | 86 (8.5%) | 186 (34.9%) |
| 3 or 4 Children | 13 (7.1%) | 61 (31.6%) |
| 5 or more Children | 69 (100.0%) | 0 (0.0%) |
| Total | 485 (12.1%) | 319 (31.1%) |
Race in Breckinridge County
The most populous races in Breckinridge County are White / Caucasian (19,435 | 94.7%), Two or more Races (625 | 3.0%), and Hispanic or Latino (400 | 1.9%).
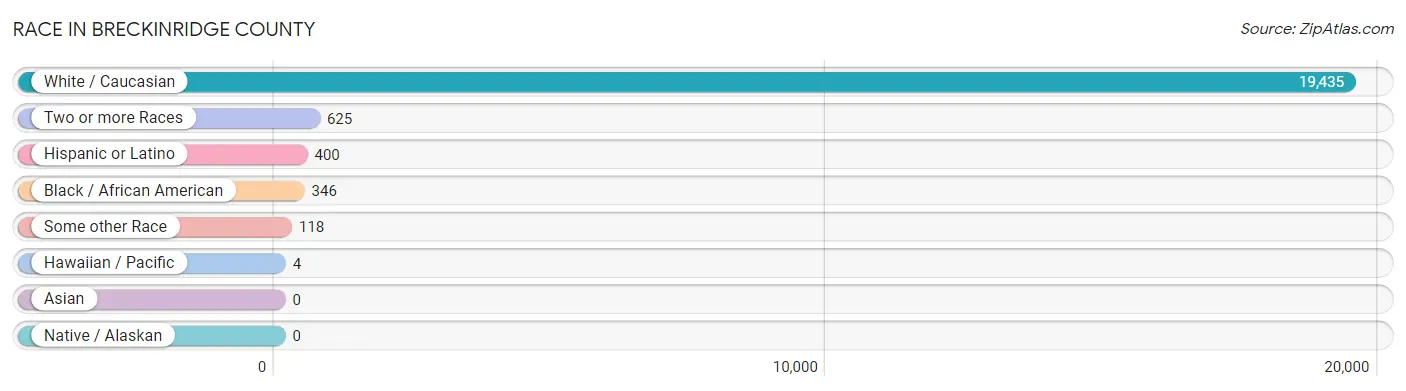
| Race | # Population | % Population |
| Asian | 0 | 0.0% |
| Black / African American | 346 | 1.7% |
| Hawaiian / Pacific | 4 | 0.0% |
| Hispanic or Latino | 400 | 1.9% |
| Native / Alaskan | 0 | 0.0% |
| White / Caucasian | 19,435 | 94.7% |
| Two or more Races | 625 | 3.0% |
| Some other Race | 118 | 0.6% |
| Total | 20,528 | 100.0% |
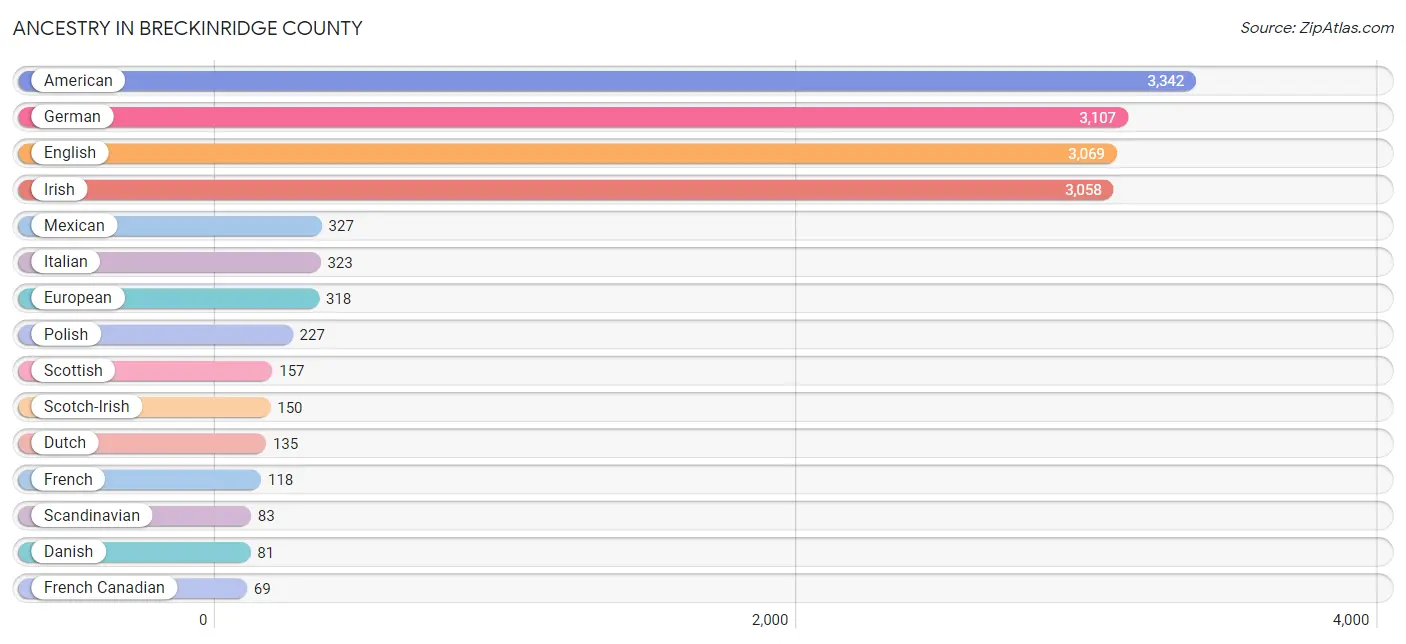
Ancestry in Breckinridge County
The most populous ancestries reported in Breckinridge County are American (3,342 | 16.3%), German (3,107 | 15.1%), English (3,069 | 14.9%), Irish (3,058 | 14.9%), and Mexican (327 | 1.6%), together accounting for 62.9% of all Breckinridge County residents.
| Ancestry | # Population | % Population |
| African | 5 | 0.0% |
| American | 3,342 | 16.3% |
| Arab | 13 | 0.1% |
| Austrian | 15 | 0.1% |
| Basque | 7 | 0.0% |
| Belgian | 64 | 0.3% |
| Bhutanese | 3 | 0.0% |
| Blackfeet | 7 | 0.0% |
| British | 63 | 0.3% |
| Canadian | 9 | 0.0% |
| Central American | 12 | 0.1% |
| Cherokee | 48 | 0.2% |
| Croatian | 14 | 0.1% |
| Czech | 8 | 0.0% |
| Czechoslovakian | 5 | 0.0% |
| Danish | 81 | 0.4% |
| Dutch | 135 | 0.7% |
| Ecuadorian | 40 | 0.2% |
| English | 3,069 | 14.9% |
| European | 318 | 1.5% |
| French | 118 | 0.6% |
| French Canadian | 69 | 0.3% |
| German | 3,107 | 15.1% |
| Greek | 10 | 0.1% |
| Guamanian / Chamorro | 13 | 0.1% |
| Guatemalan | 4 | 0.0% |
| Hungarian | 17 | 0.1% |
| Iranian | 10 | 0.1% |
| Irish | 3,058 | 14.9% |
| Iroquois | 4 | 0.0% |
| Italian | 323 | 1.6% |
| Korean | 15 | 0.1% |
| Lebanese | 13 | 0.1% |
| Mexican | 327 | 1.6% |
| Native Hawaiian | 4 | 0.0% |
| Nigerian | 9 | 0.0% |
| Norwegian | 38 | 0.2% |
| Panamanian | 8 | 0.0% |
| Polish | 227 | 1.1% |
| Puerto Rican | 4 | 0.0% |
| Scandinavian | 83 | 0.4% |
| Scotch-Irish | 150 | 0.7% |
| Scottish | 157 | 0.8% |
| South American | 40 | 0.2% |
| Subsaharan African | 14 | 0.1% |
| Swedish | 21 | 0.1% |
| Swiss | 30 | 0.2% |
| Welsh | 42 | 0.2% | View All 48 Rows |
Immigrants in Breckinridge County
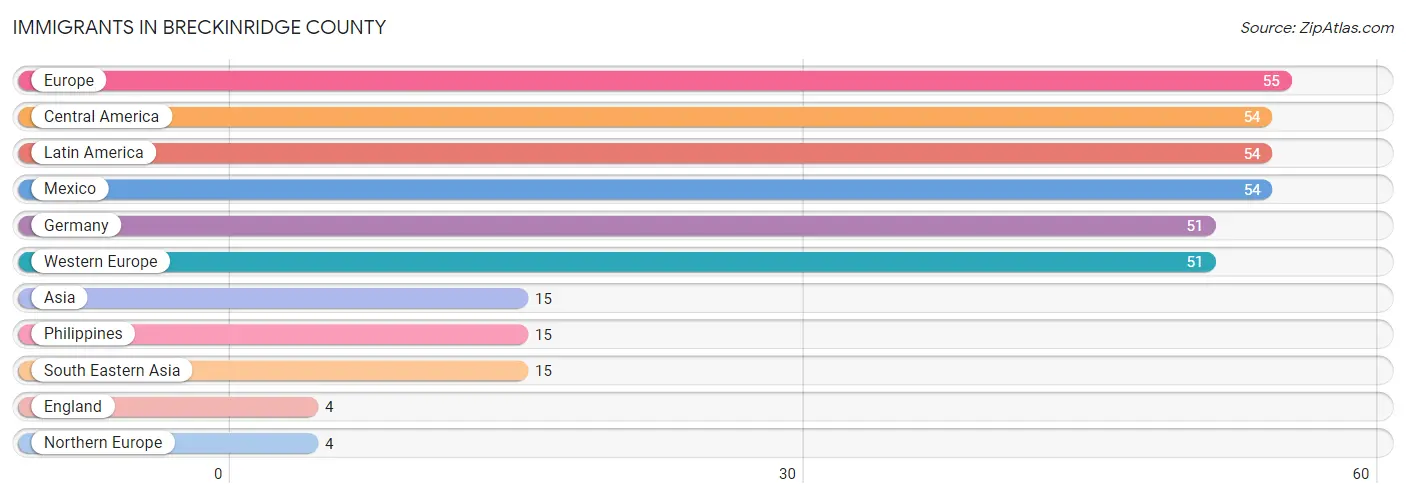
The most numerous immigrant groups reported in Breckinridge County came from Europe (55 | 0.3%), Central America (54 | 0.3%), Latin America (54 | 0.3%), Mexico (54 | 0.3%), and Germany (51 | 0.3%), together accounting for 1.3% of all Breckinridge County residents.
| Immigration Origin | # Population | % Population |
| Asia | 15 | 0.1% |
| Central America | 54 | 0.3% |
| England | 4 | 0.0% |
| Europe | 55 | 0.3% |
| Germany | 51 | 0.3% |
| Latin America | 54 | 0.3% |
| Mexico | 54 | 0.3% |
| Northern Europe | 4 | 0.0% |
| Philippines | 15 | 0.1% |
| South Eastern Asia | 15 | 0.1% |
| Western Europe | 51 | 0.3% | View All 11 Rows |
Sex and Age in Breckinridge County
Sex and Age in Breckinridge County
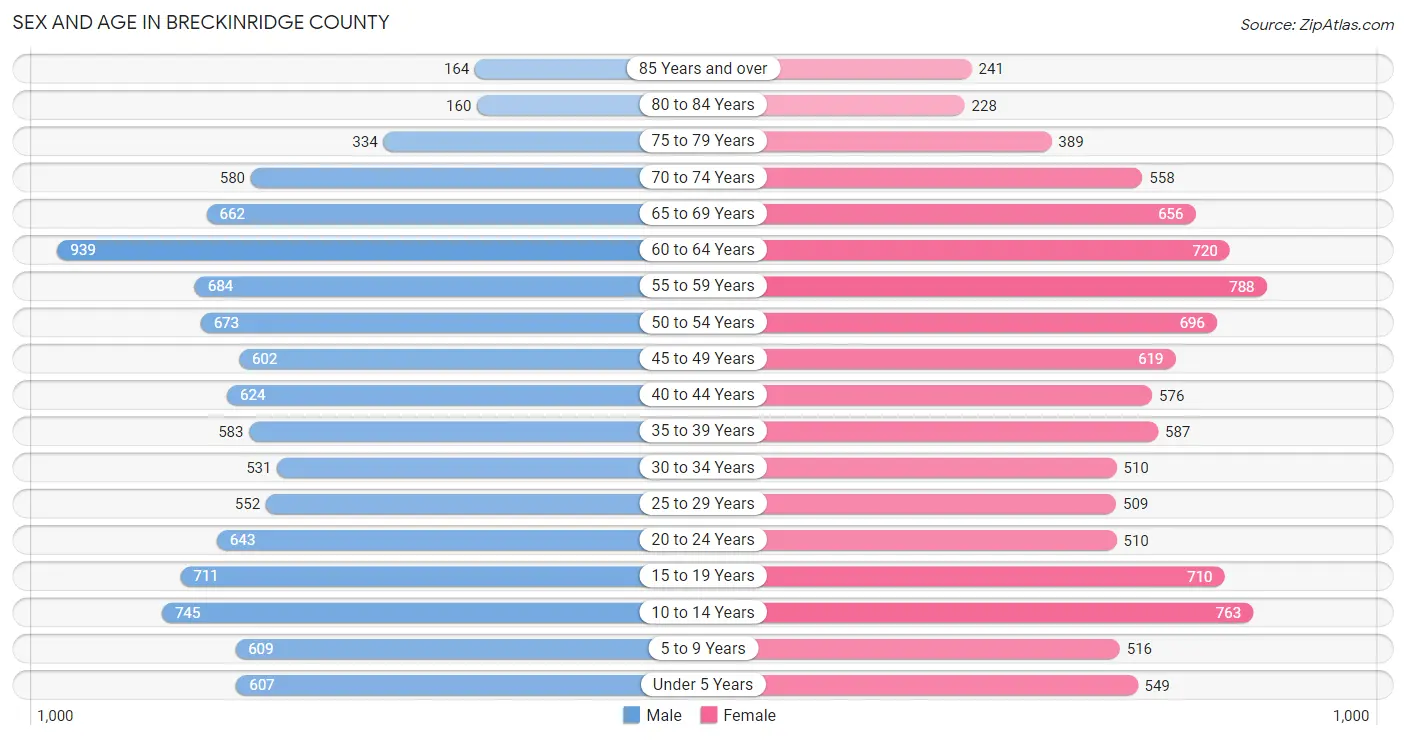
The most populous age groups in Breckinridge County are 60 to 64 Years (939 | 9.0%) for men and 55 to 59 Years (788 | 7.8%) for women.
| Age Bracket | Male | Female |
| Under 5 Years | 607 (5.8%) | 549 (5.4%) |
| 5 to 9 Years | 609 (5.9%) | 516 (5.1%) |
| 10 to 14 Years | 745 (7.2%) | 763 (7.5%) |
| 15 to 19 Years | 711 (6.8%) | 710 (7.0%) |
| 20 to 24 Years | 643 (6.2%) | 510 (5.0%) |
| 25 to 29 Years | 552 (5.3%) | 509 (5.0%) |
| 30 to 34 Years | 531 (5.1%) | 510 (5.0%) |
| 35 to 39 Years | 583 (5.6%) | 587 (5.8%) |
| 40 to 44 Years | 624 (6.0%) | 576 (5.7%) |
| 45 to 49 Years | 602 (5.8%) | 619 (6.1%) |
| 50 to 54 Years | 673 (6.5%) | 696 (6.9%) |
| 55 to 59 Years | 684 (6.6%) | 788 (7.8%) |
| 60 to 64 Years | 939 (9.0%) | 720 (7.1%) |
| 65 to 69 Years | 662 (6.4%) | 656 (6.5%) |
| 70 to 74 Years | 580 (5.6%) | 558 (5.5%) |
| 75 to 79 Years | 334 (3.2%) | 389 (3.8%) |
| 80 to 84 Years | 160 (1.5%) | 228 (2.2%) |
| 85 Years and over | 164 (1.6%) | 241 (2.4%) |
| Total | 10,403 (100.0%) | 10,125 (100.0%) |
Families and Households in Breckinridge County
Median Family Size in Breckinridge County
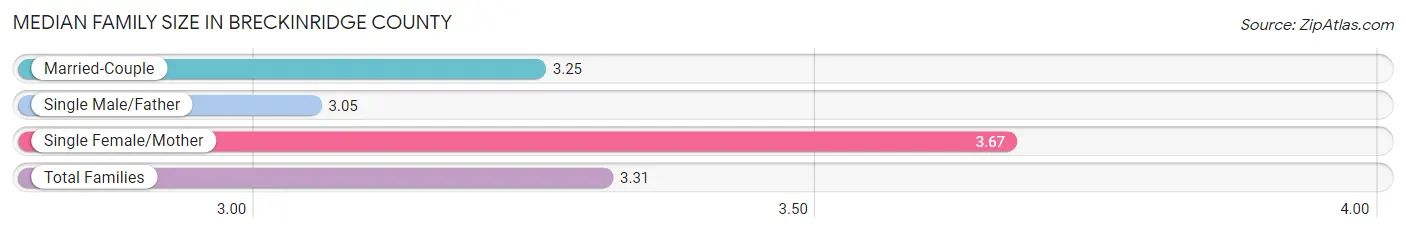
The median family size in Breckinridge County is 3.31 persons per family, with single female/mother families (802 | 15.9%) accounting for the largest median family size of 3.67 persons per family. On the other hand, single male/father families (223 | 4.4%) represent the smallest median family size with 3.05 persons per family.
| Family Type | # Families | Family Size |
| Married-Couple | 4,023 (79.7%) | 3.25 |
| Single Male/Father | 223 (4.4%) | 3.05 |
| Single Female/Mother | 802 (15.9%) | 3.67 |
| Total Families | 5,048 (100.0%) | 3.31 |
Median Household Size in Breckinridge County
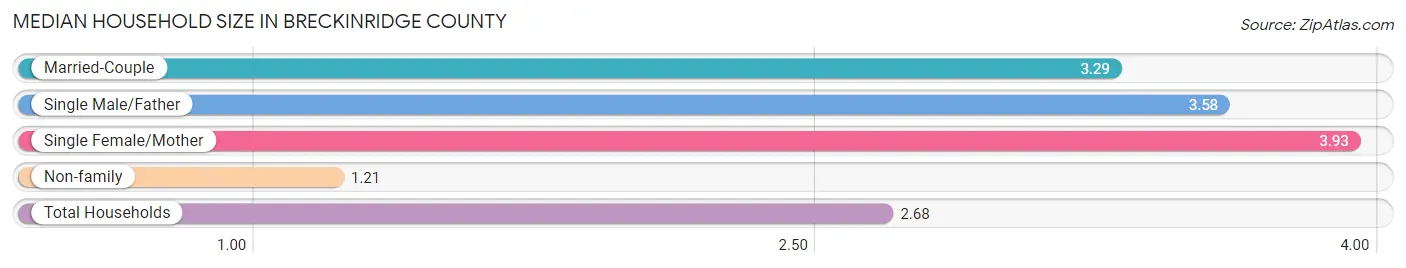
The median household size in Breckinridge County is 2.68 persons per household, with single female/mother households (802 | 10.6%) accounting for the largest median household size of 3.93 persons per household. non-family households (2,494 | 33.1%) represent the smallest median household size with 1.21 persons per household.
| Household Type | # Households | Household Size |
| Married-Couple | 4,023 (53.3%) | 3.29 |
| Single Male/Father | 223 (3.0%) | 3.58 |
| Single Female/Mother | 802 (10.6%) | 3.93 |
| Non-family | 2,494 (33.1%) | 1.21 |
| Total Households | 7,542 (100.0%) | 2.68 |
Household Size by Marriage Status in Breckinridge County
Out of a total of 7,542 households in Breckinridge County, 5,048 (66.9%) are family households, while 2,494 (33.1%) are nonfamily households. The most numerous type of family households are 2-person households, comprising 2,547, and the most common type of nonfamily households are 1-person households, comprising 2,165.
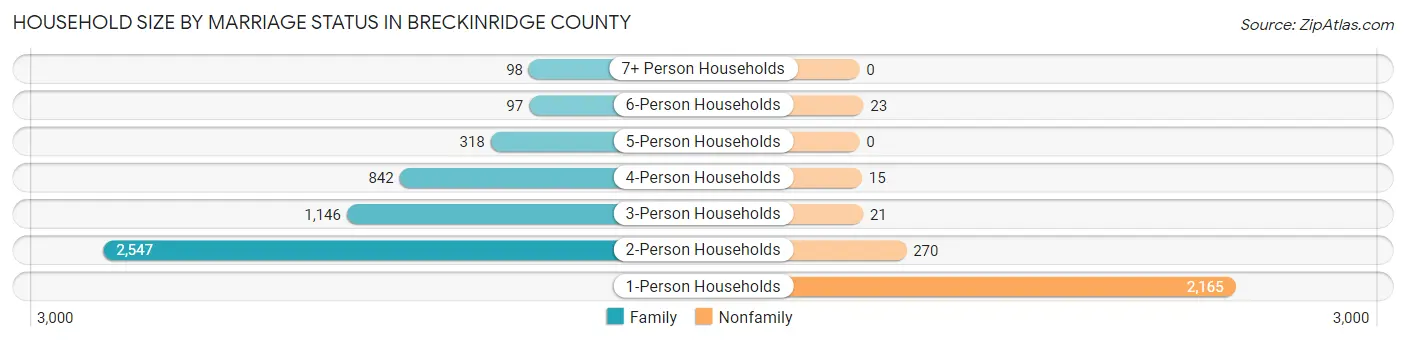
| Household Size | Family Households | Nonfamily Households |
| 1-Person Households | - | 2,165 (28.7%) |
| 2-Person Households | 2,547 (33.8%) | 270 (3.6%) |
| 3-Person Households | 1,146 (15.2%) | 21 (0.3%) |
| 4-Person Households | 842 (11.2%) | 15 (0.2%) |
| 5-Person Households | 318 (4.2%) | 0 (0.0%) |
| 6-Person Households | 97 (1.3%) | 23 (0.3%) |
| 7+ Person Households | 98 (1.3%) | 0 (0.0%) |
| Total | 5,048 (66.9%) | 2,494 (33.1%) |
Female Fertility in Breckinridge County
Fertility by Age in Breckinridge County
Average fertility rate in Breckinridge County is 68.0 births per 1,000 women. Women in the age bracket of 20 to 34 years have the highest fertility rate with 156.0 births per 1,000 women. Women in the age bracket of 20 to 34 years acount for 83.8% of all women with births.
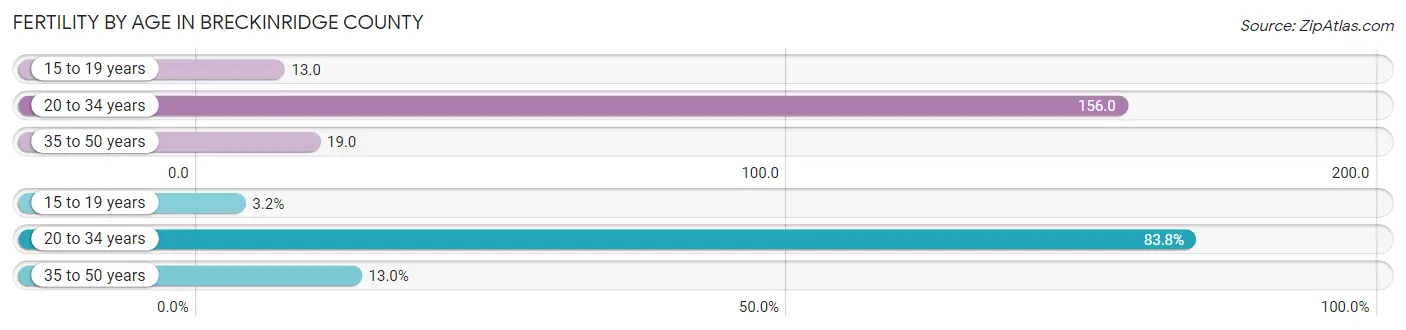
| Age Bracket | Women with Births | Births / 1,000 Women |
| 15 to 19 years | 9 (3.2%) | 13.0 |
| 20 to 34 years | 238 (83.8%) | 156.0 |
| 35 to 50 years | 37 (13.0%) | 19.0 |
| Total | 284 (100.0%) | 68.0 |
Fertility by Age by Marriage Status in Breckinridge County
63.0% of women with births (284) in Breckinridge County are married. The highest percentage of unmarried women with births falls into 35 to 50 years age bracket with 51.3% of them unmarried at the time of birth, while the lowest percentage of unmarried women with births belong to 15 to 19 years age bracket with 0.0% of them unmarried.
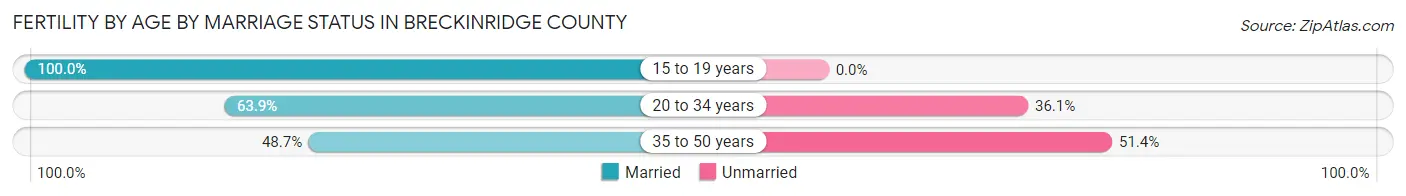
| Age Bracket | Married | Unmarried |
| 15 to 19 years | 9 (100.0%) | 0 (0.0%) |
| 20 to 34 years | 152 (63.9%) | 86 (36.1%) |
| 35 to 50 years | 18 (48.6%) | 19 (51.3%) |
| Total | 179 (63.0%) | 105 (37.0%) |
Fertility by Education in Breckinridge County
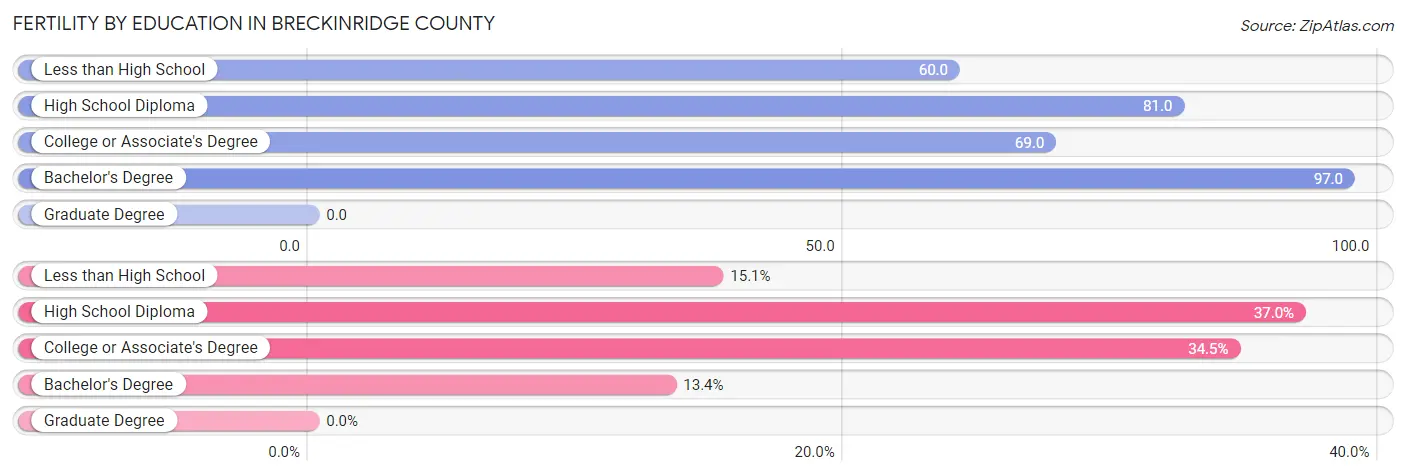
| Educational Attainment | Women with Births | Births / 1,000 Women |
| Less than High School | 43 (15.1%) | 60.0 |
| High School Diploma | 105 (37.0%) | 81.0 |
| College or Associate's Degree | 98 (34.5%) | 69.0 |
| Bachelor's Degree | 38 (13.4%) | 97.0 |
| Graduate Degree | 0 (0.0%) | 0.0 |
| Total | 284 (100.0%) | 68.0 |
Fertility by Education by Marriage Status in Breckinridge County
37.0% of women with births in Breckinridge County are unmarried. Women with the educational attainment of less than high school are most likely to be married with 93.0% of them married at childbirth, while women with the educational attainment of college or associate's degree are least likely to be married with 69.4% of them unmarried at childbirth.
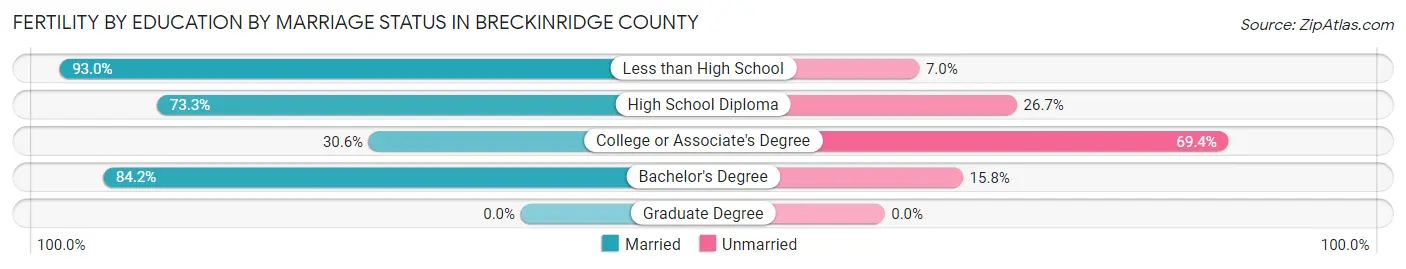
| Educational Attainment | Married | Unmarried |
| Less than High School | 40 (93.0%) | 3 (7.0%) |
| High School Diploma | 77 (73.3%) | 28 (26.7%) |
| College or Associate's Degree | 30 (30.6%) | 68 (69.4%) |
| Bachelor's Degree | 32 (84.2%) | 6 (15.8%) |
| Graduate Degree | 0 (0.0%) | 0 (0.0%) |
| Total | 179 (63.0%) | 105 (37.0%) |
Employment Characteristics in Breckinridge County
Employment by Class of Employer in Breckinridge County
Among the 7,611 employed individuals in Breckinridge County, private company employees (5,223 | 68.6%), local government employees (761 | 10.0%), and not-for-profit organizations (669 | 8.8%) make up the most common classes of employment.
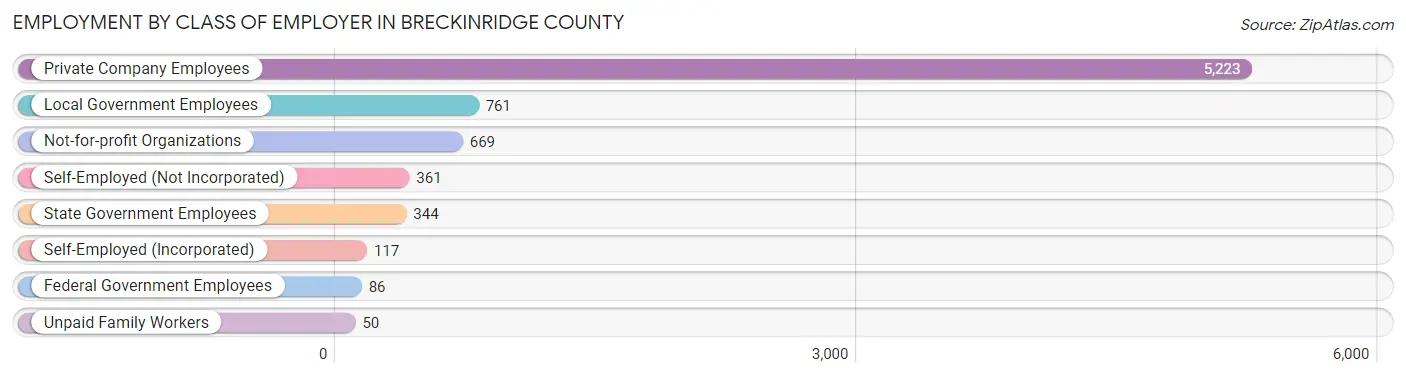
| Employer Class | # Employees | % Employees |
| Private Company Employees | 5,223 | 68.6% |
| Self-Employed (Incorporated) | 117 | 1.5% |
| Self-Employed (Not Incorporated) | 361 | 4.7% |
| Not-for-profit Organizations | 669 | 8.8% |
| Local Government Employees | 761 | 10.0% |
| State Government Employees | 344 | 4.5% |
| Federal Government Employees | 86 | 1.1% |
| Unpaid Family Workers | 50 | 0.7% |
| Total | 7,611 | 100.0% |
Employment Status by Age in Breckinridge County
According to the labor force statistics for Breckinridge County, out of the total population over 16 years of age (16,419), 51.7% or 8,489 individuals are in the labor force, with 7.7% or 654 of them unemployed. The age group with the highest labor force participation rate is 20 to 24 years, with 91.2% or 1,052 individuals in the labor force. Within the labor force, the 16 to 19 years age range has the highest percentage of unemployed individuals, with 27.6% or 142 of them being unemployed.
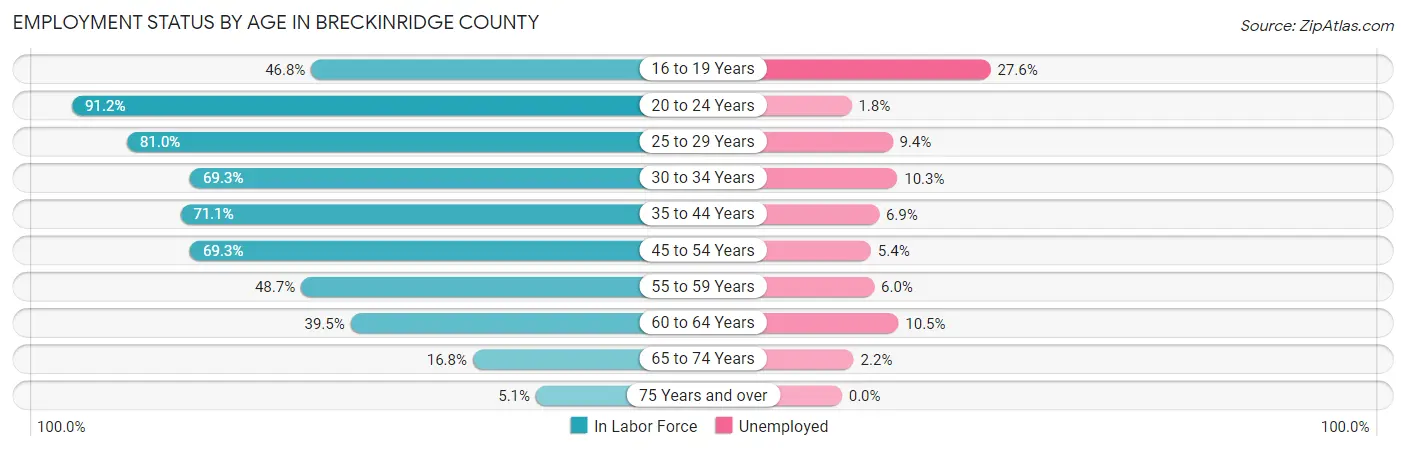
| Age Bracket | In Labor Force | Unemployed |
| 16 to 19 Years | 515 (46.8%) | 142 (27.6%) |
| 20 to 24 Years | 1,052 (91.2%) | 19 (1.8%) |
| 25 to 29 Years | 859 (81.0%) | 81 (9.4%) |
| 30 to 34 Years | 721 (69.3%) | 74 (10.3%) |
| 35 to 44 Years | 1,685 (71.1%) | 116 (6.9%) |
| 45 to 54 Years | 1,795 (69.3%) | 97 (5.4%) |
| 55 to 59 Years | 717 (48.7%) | 43 (6.0%) |
| 60 to 64 Years | 655 (39.5%) | 69 (10.5%) |
| 65 to 74 Years | 413 (16.8%) | 9 (2.2%) |
| 75 Years and over | 77 (5.1%) | 0 (0.0%) |
| Total | 8,489 (51.7%) | 654 (7.7%) |
Employment Status by Educational Attainment in Breckinridge County
According to labor force statistics for Breckinridge County, 63.1% of individuals (6,432) out of the total population between 25 and 64 years of age (10,193) are in the labor force, with 7.5% or 482 of them being unemployed. The group with the highest labor force participation rate are those with the educational attainment of bachelor's degree or higher, with 75.8% or 1,003 individuals in the labor force. Within the labor force, individuals with high school diploma education have the highest percentage of unemployment, with 11.0% or 305 of them being unemployed.
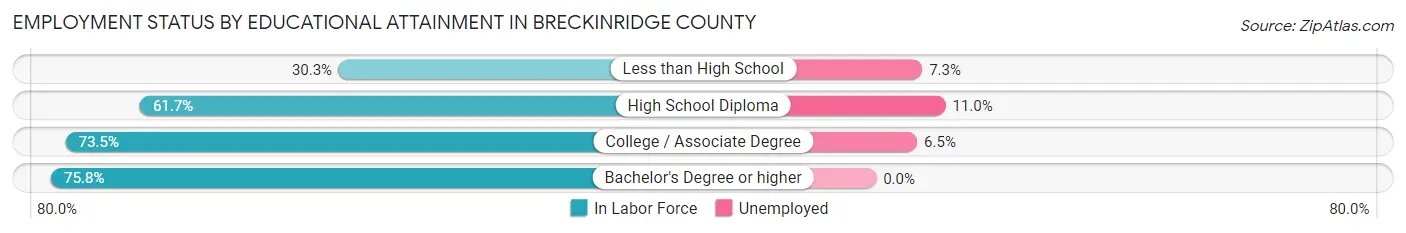
| Educational Attainment | In Labor Force | Unemployed |
| Less than High School | 395 (30.3%) | 95 (7.3%) |
| High School Diploma | 2,777 (61.7%) | 495 (11.0%) |
| College / Associate Degree | 2,254 (73.5%) | 199 (6.5%) |
| Bachelor's Degree or higher | 1,003 (75.8%) | 0 (0.0%) |
| Total | 6,432 (63.1%) | 764 (7.5%) |
Employment Occupations by Sex in Breckinridge County
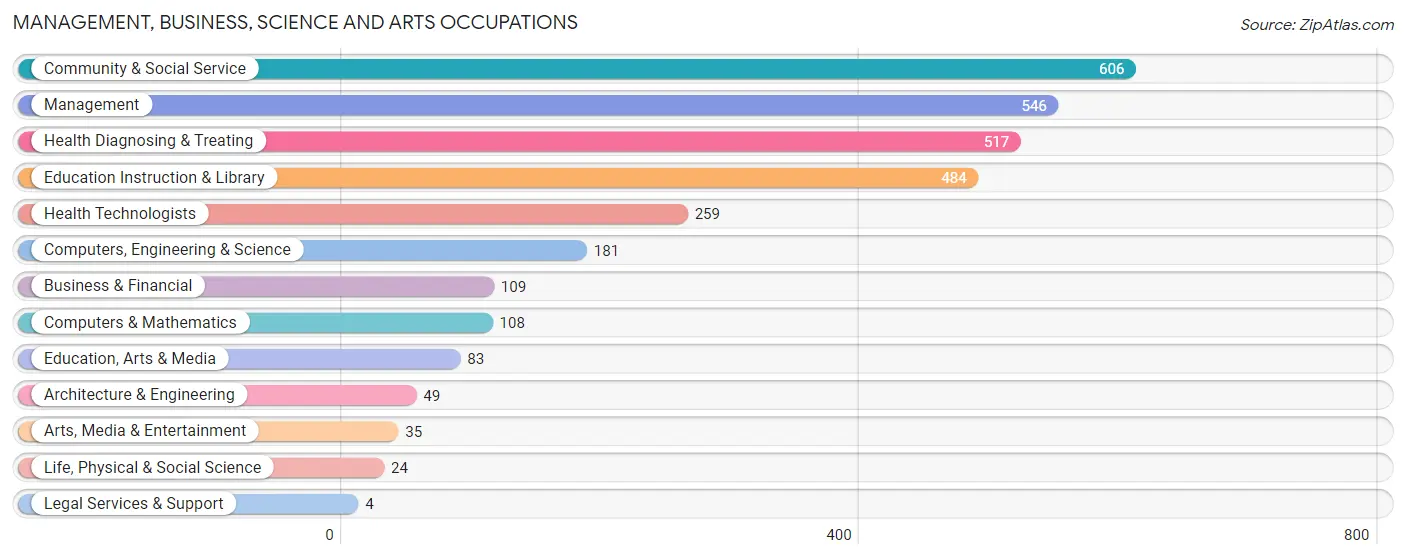
Management, Business, Science and Arts Occupations
The most common Management, Business, Science and Arts occupations in Breckinridge County are Community & Social Service (606 | 7.8%), Management (546 | 7.0%), Health Diagnosing & Treating (517 | 6.6%), Education Instruction & Library (484 | 6.2%), and Health Technologists (259 | 3.3%).
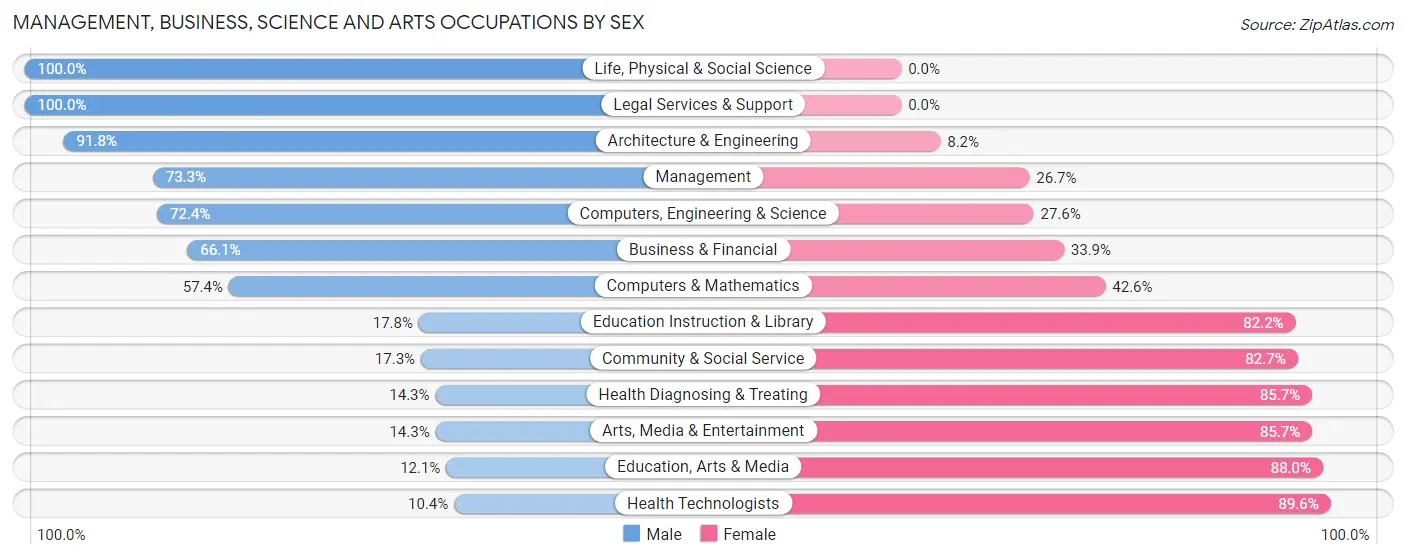
Management, Business, Science and Arts Occupations by Sex
Within the Management, Business, Science and Arts occupations in Breckinridge County, the most male-oriented occupations are Life, Physical & Social Science (100.0%), Legal Services & Support (100.0%), and Architecture & Engineering (91.8%), while the most female-oriented occupations are Health Technologists (89.6%), Education, Arts & Media (87.9%), and Arts, Media & Entertainment (85.7%).
| Occupation | Male | Female |
| Management | 400 (73.3%) | 146 (26.7%) |
| Business & Financial | 72 (66.1%) | 37 (33.9%) |
| Computers, Engineering & Science | 131 (72.4%) | 50 (27.6%) |
| Computers & Mathematics | 62 (57.4%) | 46 (42.6%) |
| Architecture & Engineering | 45 (91.8%) | 4 (8.2%) |
| Life, Physical & Social Science | 24 (100.0%) | 0 (0.0%) |
| Community & Social Service | 105 (17.3%) | 501 (82.7%) |
| Education, Arts & Media | 10 (12.0%) | 73 (87.9%) |
| Legal Services & Support | 4 (100.0%) | 0 (0.0%) |
| Education Instruction & Library | 86 (17.8%) | 398 (82.2%) |
| Arts, Media & Entertainment | 5 (14.3%) | 30 (85.7%) |
| Health Diagnosing & Treating | 74 (14.3%) | 443 (85.7%) |
| Health Technologists | 27 (10.4%) | 232 (89.6%) |
| Total (Category) | 782 (39.9%) | 1,177 (60.1%) |
| Total (Overall) | 4,214 (54.0%) | 3,589 (46.0%) |
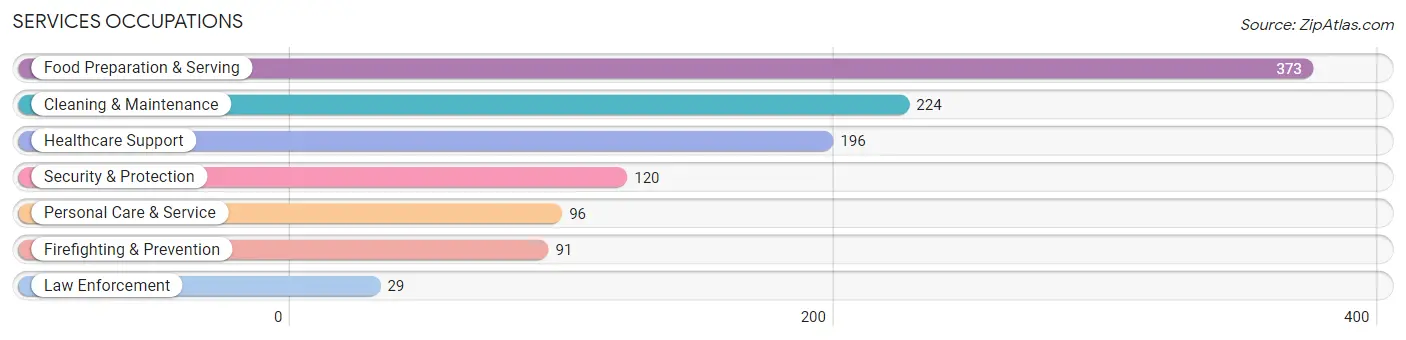
Services Occupations
The most common Services occupations in Breckinridge County are Food Preparation & Serving (373 | 4.8%), Cleaning & Maintenance (224 | 2.9%), Healthcare Support (196 | 2.5%), Security & Protection (120 | 1.5%), and Personal Care & Service (96 | 1.2%).
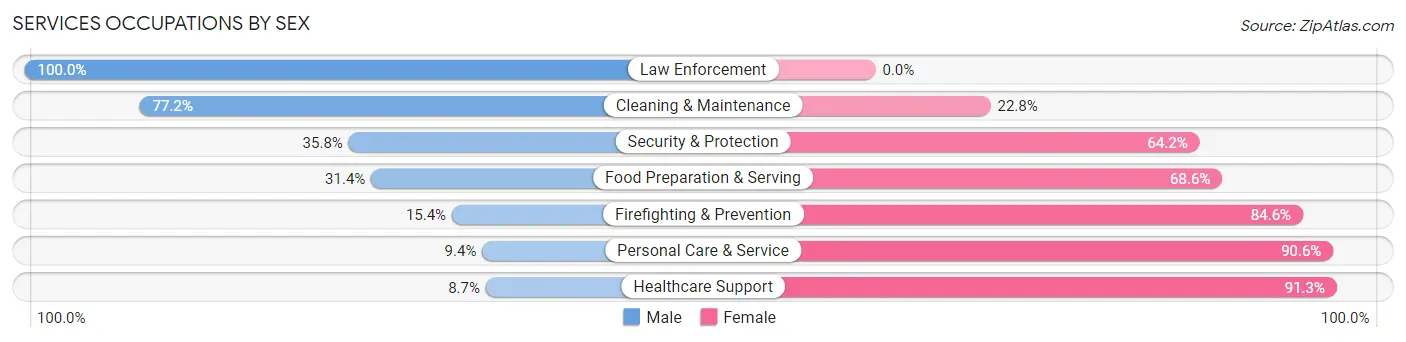
Services Occupations by Sex
Within the Services occupations in Breckinridge County, the most male-oriented occupations are Law Enforcement (100.0%), Cleaning & Maintenance (77.2%), and Security & Protection (35.8%), while the most female-oriented occupations are Healthcare Support (91.3%), Personal Care & Service (90.6%), and Firefighting & Prevention (84.6%).
| Occupation | Male | Female |
| Healthcare Support | 17 (8.7%) | 179 (91.3%) |
| Security & Protection | 43 (35.8%) | 77 (64.2%) |
| Firefighting & Prevention | 14 (15.4%) | 77 (84.6%) |
| Law Enforcement | 29 (100.0%) | 0 (0.0%) |
| Food Preparation & Serving | 117 (31.4%) | 256 (68.6%) |
| Cleaning & Maintenance | 173 (77.2%) | 51 (22.8%) |
| Personal Care & Service | 9 (9.4%) | 87 (90.6%) |
| Total (Category) | 359 (35.6%) | 650 (64.4%) |
| Total (Overall) | 4,214 (54.0%) | 3,589 (46.0%) |
Sales and Office Occupations
The most common Sales and Office occupations in Breckinridge County are Office & Administration (1,039 | 13.3%), and Sales & Related (613 | 7.9%).
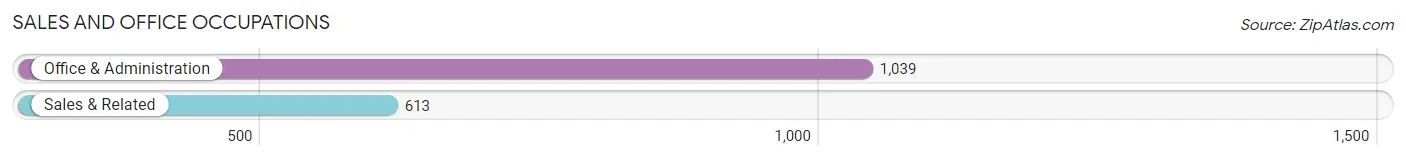
Sales and Office Occupations by Sex
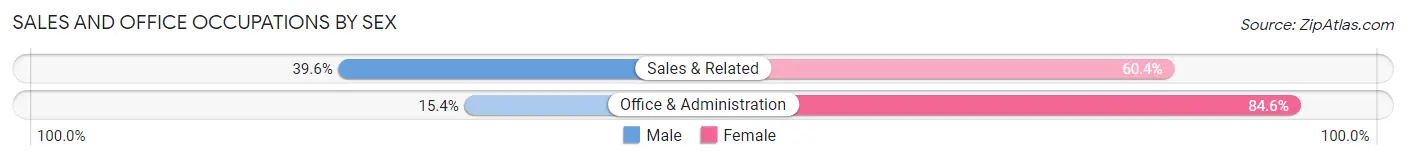
| Occupation | Male | Female |
| Sales & Related | 243 (39.6%) | 370 (60.4%) |
| Office & Administration | 160 (15.4%) | 879 (84.6%) |
| Total (Category) | 403 (24.4%) | 1,249 (75.6%) |
| Total (Overall) | 4,214 (54.0%) | 3,589 (46.0%) |
Natural Resources, Construction and Maintenance Occupations
The most common Natural Resources, Construction and Maintenance occupations in Breckinridge County are Construction & Extraction (489 | 6.3%), Installation, Maintenance & Repair (355 | 4.5%), and Farming, Fishing & Forestry (28 | 0.4%).
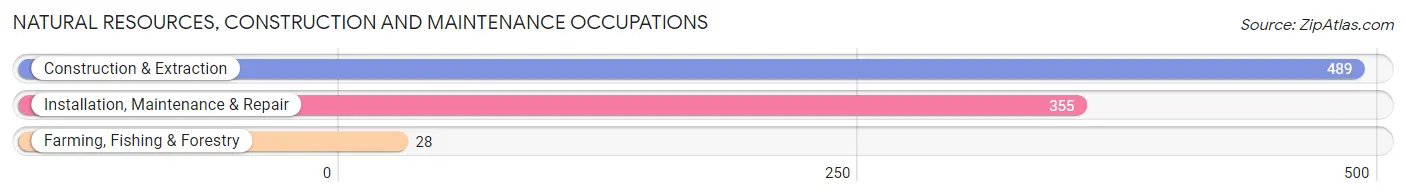
Natural Resources, Construction and Maintenance Occupations by Sex
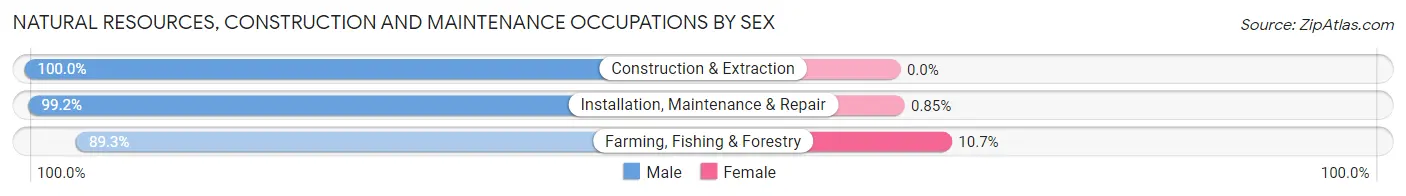
| Occupation | Male | Female |
| Farming, Fishing & Forestry | 25 (89.3%) | 3 (10.7%) |
| Construction & Extraction | 489 (100.0%) | 0 (0.0%) |
| Installation, Maintenance & Repair | 352 (99.2%) | 3 (0.9%) |
| Total (Category) | 866 (99.3%) | 6 (0.7%) |
| Total (Overall) | 4,214 (54.0%) | 3,589 (46.0%) |
Production, Transportation and Moving Occupations
The most common Production, Transportation and Moving occupations in Breckinridge County are Production (1,328 | 17.0%), Transportation (520 | 6.7%), and Material Moving (463 | 5.9%).
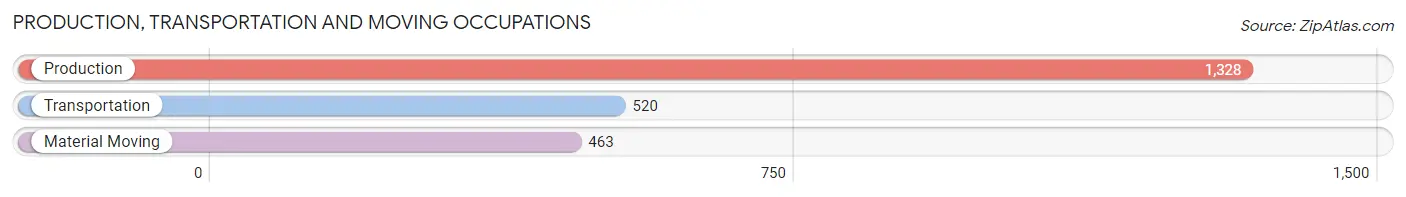
Production, Transportation and Moving Occupations by Sex
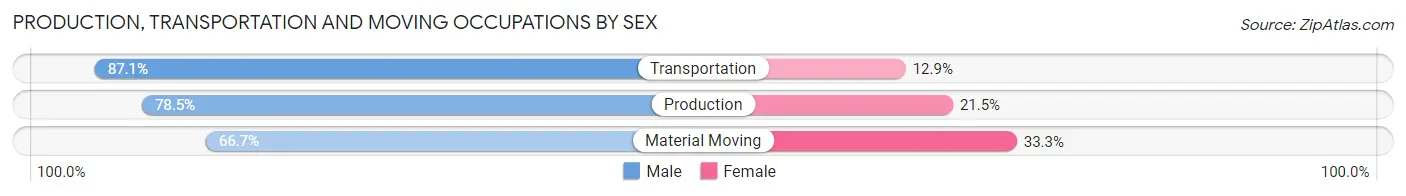
| Occupation | Male | Female |
| Production | 1,042 (78.5%) | 286 (21.5%) |
| Transportation | 453 (87.1%) | 67 (12.9%) |
| Material Moving | 309 (66.7%) | 154 (33.3%) |
| Total (Category) | 1,804 (78.1%) | 507 (21.9%) |
| Total (Overall) | 4,214 (54.0%) | 3,589 (46.0%) |
Employment Industries by Sex in Breckinridge County
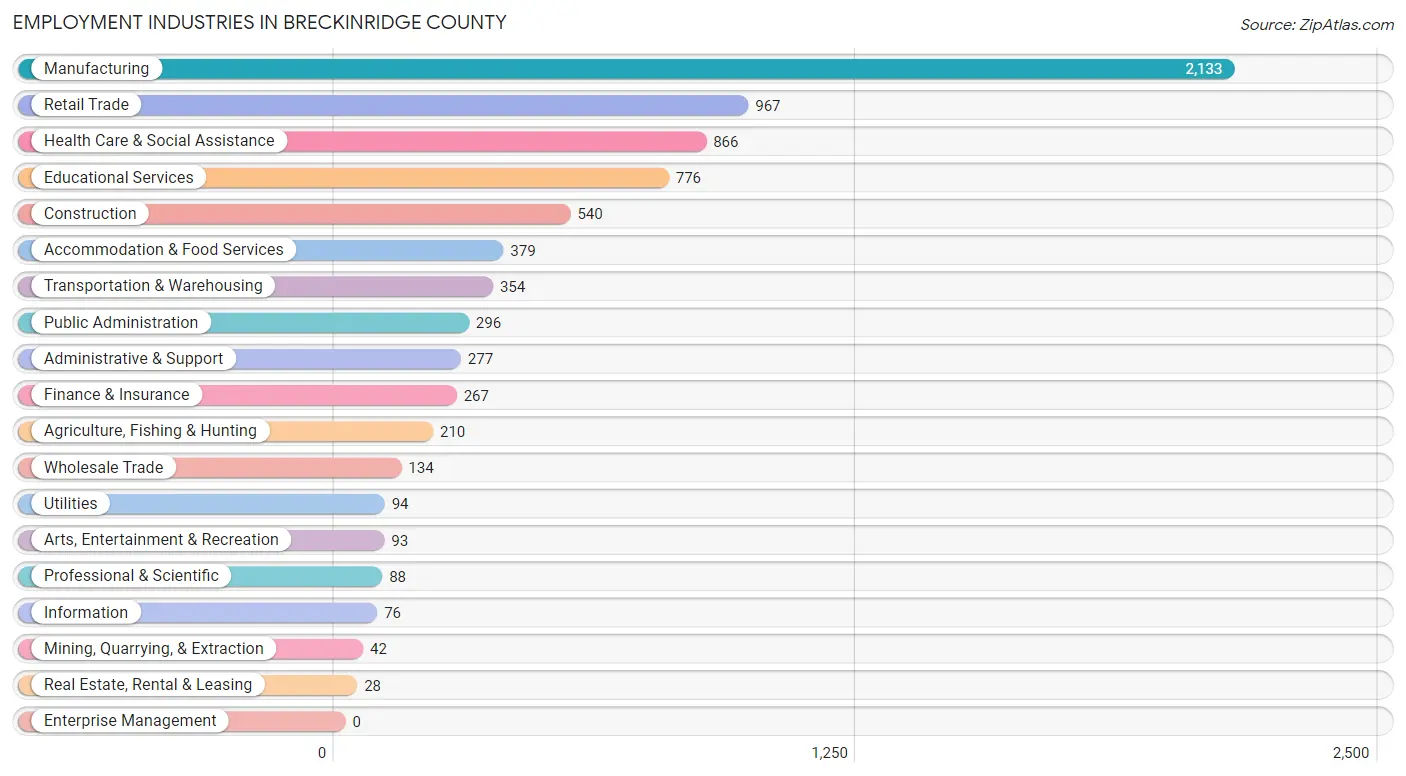
Employment Industries in Breckinridge County
The major employment industries in Breckinridge County include Manufacturing (2,133 | 27.3%), Retail Trade (967 | 12.4%), Health Care & Social Assistance (866 | 11.1%), Educational Services (776 | 9.9%), and Construction (540 | 6.9%).
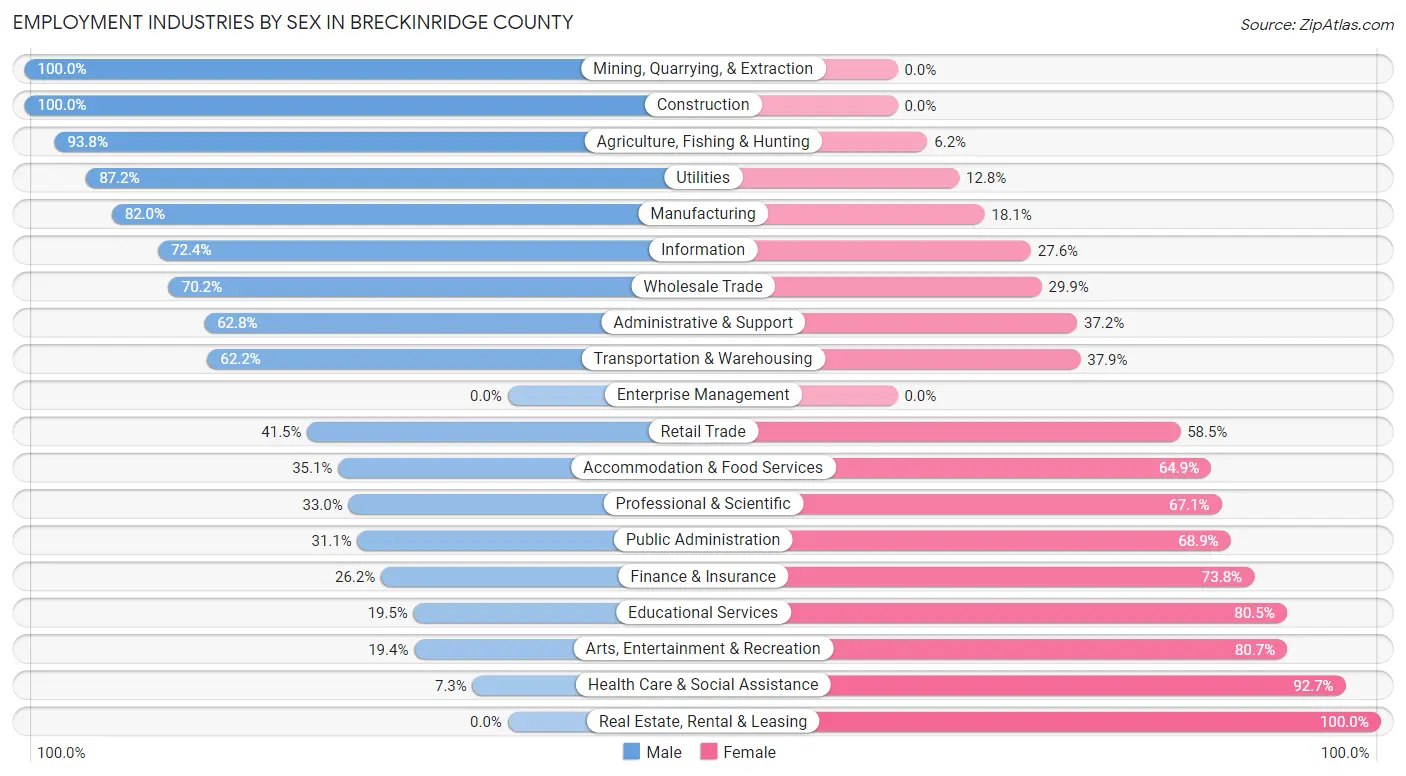
Employment Industries by Sex in Breckinridge County
The Breckinridge County industries that see more men than women are Mining, Quarrying, & Extraction (100.0%), Construction (100.0%), and Agriculture, Fishing & Hunting (93.8%), whereas the industries that tend to have a higher number of women are Real Estate, Rental & Leasing (100.0%), Health Care & Social Assistance (92.7%), and Arts, Entertainment & Recreation (80.6%).
| Industry | Male | Female |
| Agriculture, Fishing & Hunting | 197 (93.8%) | 13 (6.2%) |
| Mining, Quarrying, & Extraction | 42 (100.0%) | 0 (0.0%) |
| Construction | 540 (100.0%) | 0 (0.0%) |
| Manufacturing | 1,748 (82.0%) | 385 (18.0%) |
| Wholesale Trade | 94 (70.2%) | 40 (29.8%) |
| Retail Trade | 401 (41.5%) | 566 (58.5%) |
| Transportation & Warehousing | 220 (62.2%) | 134 (37.9%) |
| Utilities | 82 (87.2%) | 12 (12.8%) |
| Information | 55 (72.4%) | 21 (27.6%) |
| Finance & Insurance | 70 (26.2%) | 197 (73.8%) |
| Real Estate, Rental & Leasing | 0 (0.0%) | 28 (100.0%) |
| Professional & Scientific | 29 (33.0%) | 59 (67.0%) |
| Enterprise Management | 0 (0.0%) | 0 (0.0%) |
| Administrative & Support | 174 (62.8%) | 103 (37.2%) |
| Educational Services | 151 (19.5%) | 625 (80.5%) |
| Health Care & Social Assistance | 63 (7.3%) | 803 (92.7%) |
| Arts, Entertainment & Recreation | 18 (19.4%) | 75 (80.6%) |
| Accommodation & Food Services | 133 (35.1%) | 246 (64.9%) |
| Public Administration | 92 (31.1%) | 204 (68.9%) |
| Total | 4,214 (54.0%) | 3,589 (46.0%) |
Education in Breckinridge County
School Enrollment in Breckinridge County
The most common levels of schooling among the 4,212 students in Breckinridge County are high school (1,169 | 27.8%), middle school (1,122 | 26.6%), and elementary school (936 | 22.2%).
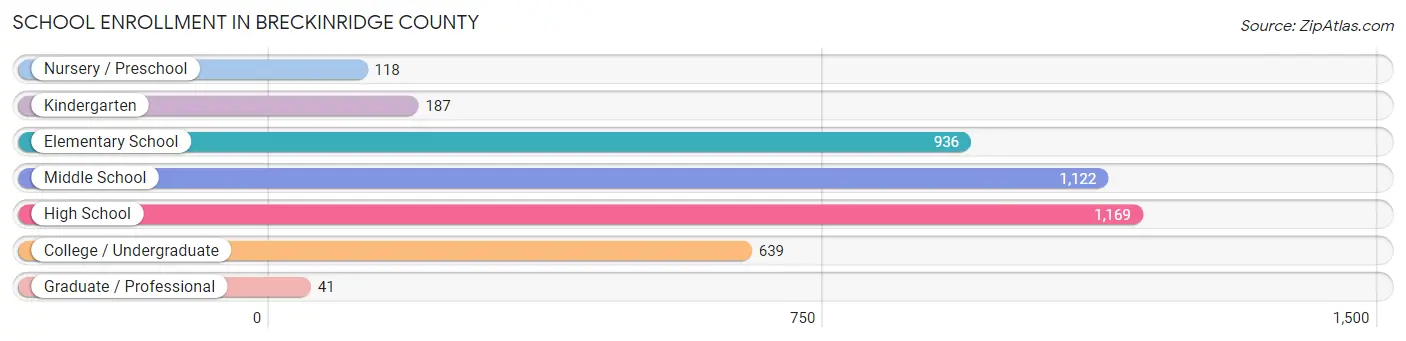
| School Level | # Students | % Students |
| Nursery / Preschool | 118 | 2.8% |
| Kindergarten | 187 | 4.4% |
| Elementary School | 936 | 22.2% |
| Middle School | 1,122 | 26.6% |
| High School | 1,169 | 27.8% |
| College / Undergraduate | 639 | 15.2% |
| Graduate / Professional | 41 | 1.0% |
| Total | 4,212 | 100.0% |
School Enrollment by Age by Funding Source in Breckinridge County
Out of a total of 4,212 students who are enrolled in schools in Breckinridge County, 611 (14.5%) attend a private institution, while the remaining 3,601 (85.5%) are enrolled in public schools. The age group of 5 to 9 year old has the highest likelihood of being enrolled in private schools, with 273 (27.4% in the age bracket) enrolled. Conversely, the age group of 15 to 17 year olds has the lowest likelihood of being enrolled in a private school, with 788 (95.2% in the age bracket) attending a public institution.
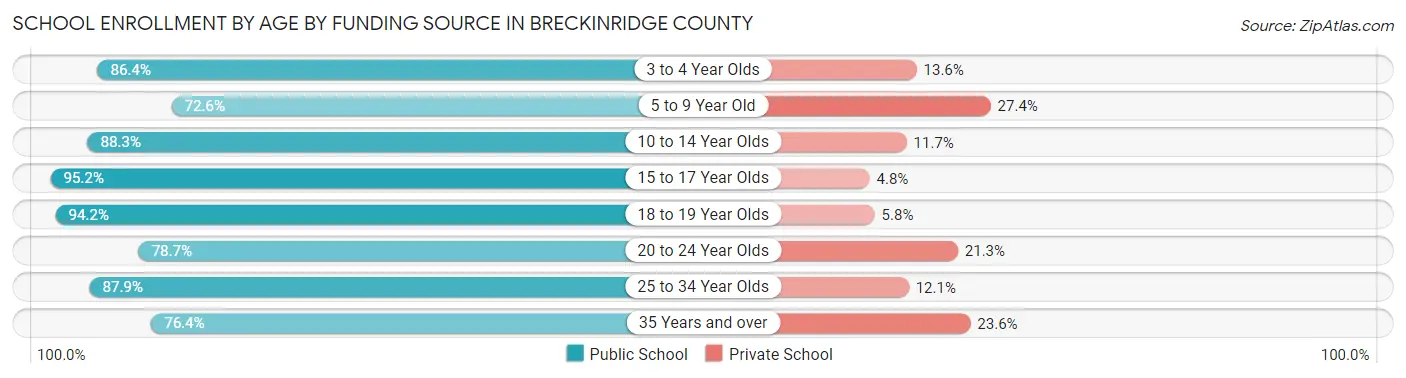
| Age Bracket | Public School | Private School |
| 3 to 4 Year Olds | 89 (86.4%) | 14 (13.6%) |
| 5 to 9 Year Old | 724 (72.6%) | 273 (27.4%) |
| 10 to 14 Year Olds | 1,212 (88.3%) | 161 (11.7%) |
| 15 to 17 Year Olds | 788 (95.2%) | 40 (4.8%) |
| 18 to 19 Year Olds | 359 (94.2%) | 22 (5.8%) |
| 20 to 24 Year Olds | 174 (78.7%) | 47 (21.3%) |
| 25 to 34 Year Olds | 145 (87.9%) | 20 (12.1%) |
| 35 Years and over | 110 (76.4%) | 34 (23.6%) |
| Total | 3,601 (85.5%) | 611 (14.5%) |
Educational Attainment by Field of Study in Breckinridge County
Education (621 | 28.2%), science & technology (310 | 14.1%), business (290 | 13.2%), bio, nature & agricultural (257 | 11.7%), and arts & humanities (137 | 6.2%) are the most common fields of study among 2,198 individuals in Breckinridge County who have obtained a bachelor's degree or higher.
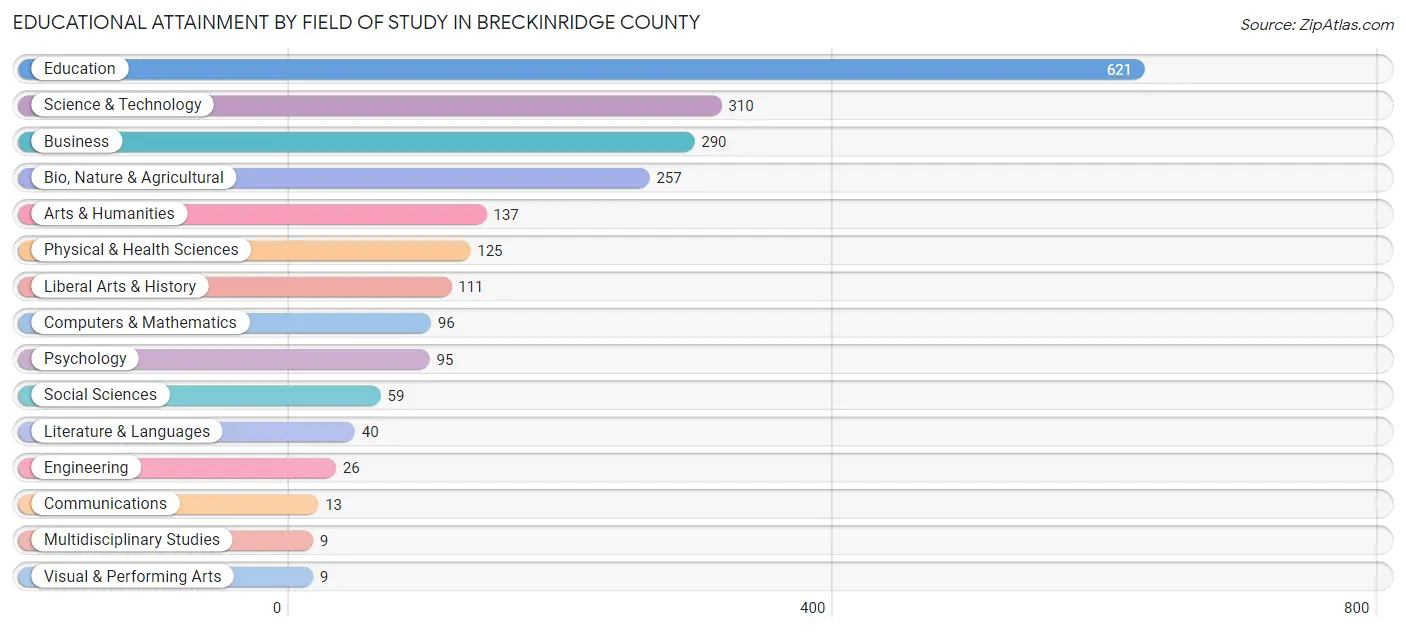
| Field of Study | # Graduates | % Graduates |
| Computers & Mathematics | 96 | 4.4% |
| Bio, Nature & Agricultural | 257 | 11.7% |
| Physical & Health Sciences | 125 | 5.7% |
| Psychology | 95 | 4.3% |
| Social Sciences | 59 | 2.7% |
| Engineering | 26 | 1.2% |
| Multidisciplinary Studies | 9 | 0.4% |
| Science & Technology | 310 | 14.1% |
| Business | 290 | 13.2% |
| Education | 621 | 28.2% |
| Literature & Languages | 40 | 1.8% |
| Liberal Arts & History | 111 | 5.1% |
| Visual & Performing Arts | 9 | 0.4% |
| Communications | 13 | 0.6% |
| Arts & Humanities | 137 | 6.2% |
| Total | 2,198 | 100.0% |
Transportation & Commute in Breckinridge County
Vehicle Availability by Sex in Breckinridge County
The most prevalent vehicle ownership categories in Breckinridge County are males with 2 vehicles (1,316, accounting for 31.4%) and females with 2 vehicles (1,041, making up 38.5%).
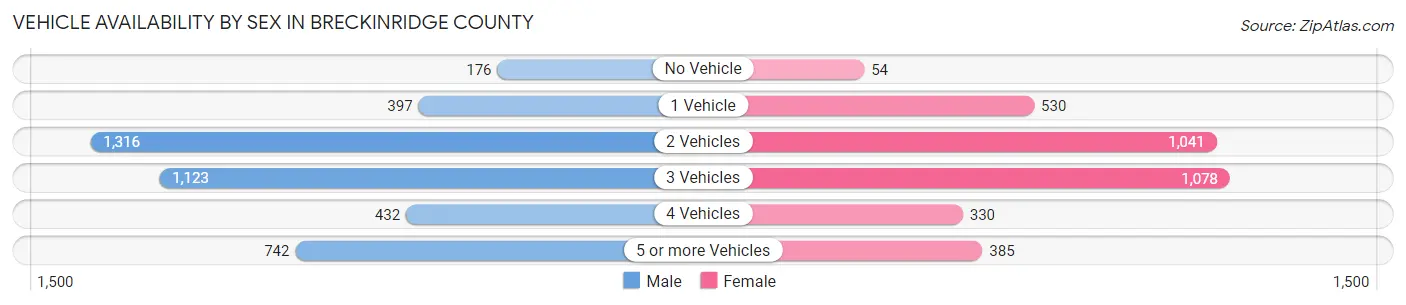
| Vehicles Available | Male | Female |
| No Vehicle | 176 (4.2%) | 54 (1.6%) |
| 1 Vehicle | 397 (9.5%) | 530 (15.5%) |
| 2 Vehicles | 1,316 (31.4%) | 1,041 (30.5%) |
| 3 Vehicles | 1,123 (26.8%) | 1,078 (31.5%) |
| 4 Vehicles | 432 (10.3%) | 330 (9.7%) |
| 5 or more Vehicles | 742 (17.7%) | 385 (11.3%) |
| Total | 4,186 (100.0%) | 3,418 (100.0%) |
Commute Time in Breckinridge County
The most frequently occuring commute durations in Breckinridge County are 60 to 89 minutes (975 commuters, 13.1%), 15 to 19 minutes (877 commuters, 11.8%), and 10 to 14 minutes (846 commuters, 11.4%).
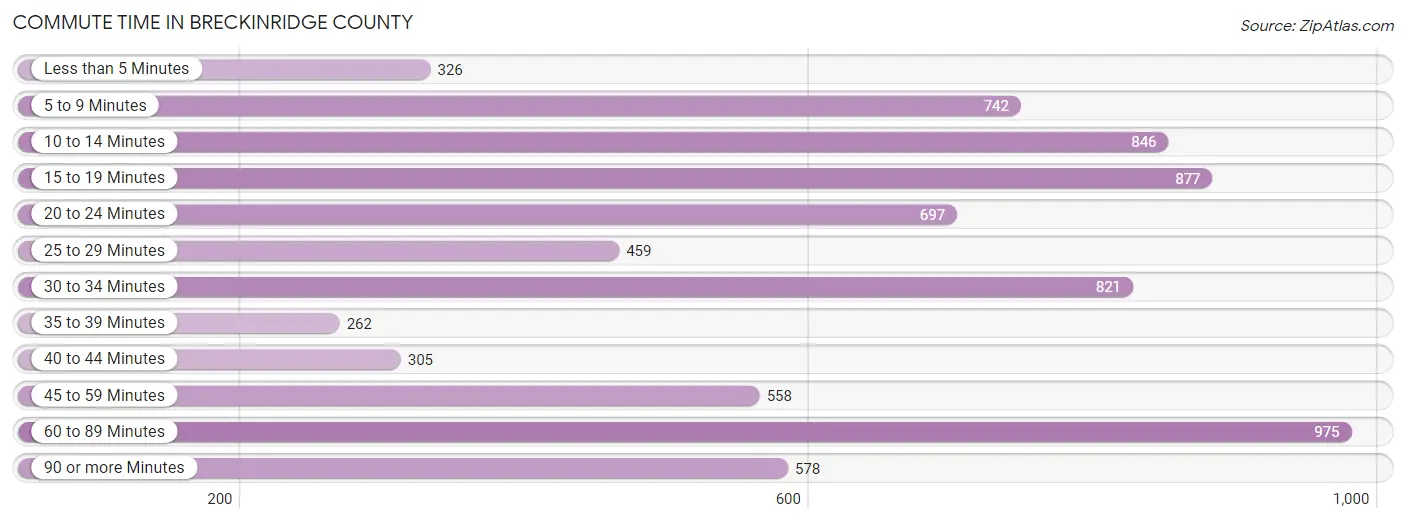
| Commute Time | # Commuters | % Commuters |
| Less than 5 Minutes | 326 | 4.4% |
| 5 to 9 Minutes | 742 | 10.0% |
| 10 to 14 Minutes | 846 | 11.4% |
| 15 to 19 Minutes | 877 | 11.8% |
| 20 to 24 Minutes | 697 | 9.4% |
| 25 to 29 Minutes | 459 | 6.2% |
| 30 to 34 Minutes | 821 | 11.0% |
| 35 to 39 Minutes | 262 | 3.5% |
| 40 to 44 Minutes | 305 | 4.1% |
| 45 to 59 Minutes | 558 | 7.5% |
| 60 to 89 Minutes | 975 | 13.1% |
| 90 or more Minutes | 578 | 7.8% |
Commute Time by Sex in Breckinridge County
The most common commute times in Breckinridge County are 60 to 89 minutes (591 commuters, 14.4%) for males and 15 to 19 minutes (444 commuters, 13.3%) for females.
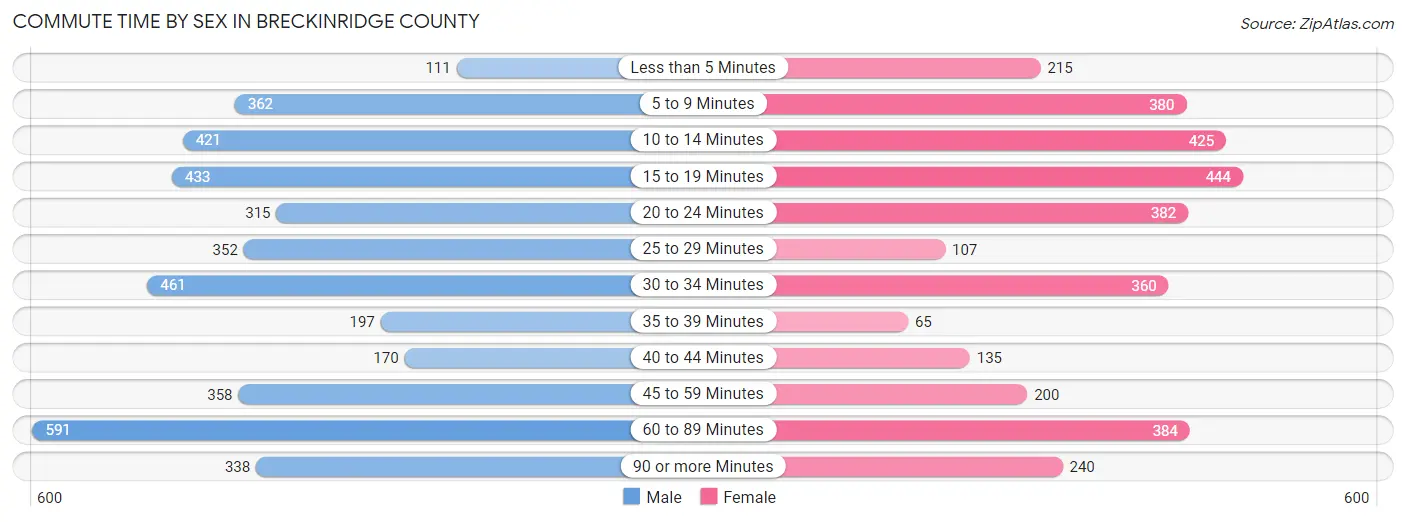
| Commute Time | Male | Female |
| Less than 5 Minutes | 111 (2.7%) | 215 (6.4%) |
| 5 to 9 Minutes | 362 (8.8%) | 380 (11.4%) |
| 10 to 14 Minutes | 421 (10.2%) | 425 (12.7%) |
| 15 to 19 Minutes | 433 (10.5%) | 444 (13.3%) |
| 20 to 24 Minutes | 315 (7.7%) | 382 (11.5%) |
| 25 to 29 Minutes | 352 (8.6%) | 107 (3.2%) |
| 30 to 34 Minutes | 461 (11.2%) | 360 (10.8%) |
| 35 to 39 Minutes | 197 (4.8%) | 65 (1.9%) |
| 40 to 44 Minutes | 170 (4.1%) | 135 (4.1%) |
| 45 to 59 Minutes | 358 (8.7%) | 200 (6.0%) |
| 60 to 89 Minutes | 591 (14.4%) | 384 (11.5%) |
| 90 or more Minutes | 338 (8.2%) | 240 (7.2%) |
Time of Departure to Work by Sex in Breckinridge County
The most frequent times of departure to work in Breckinridge County are 6:00 AM to 6:29 AM (542, 13.2%) for males and 7:00 AM to 7:29 AM (679, 20.3%) for females.
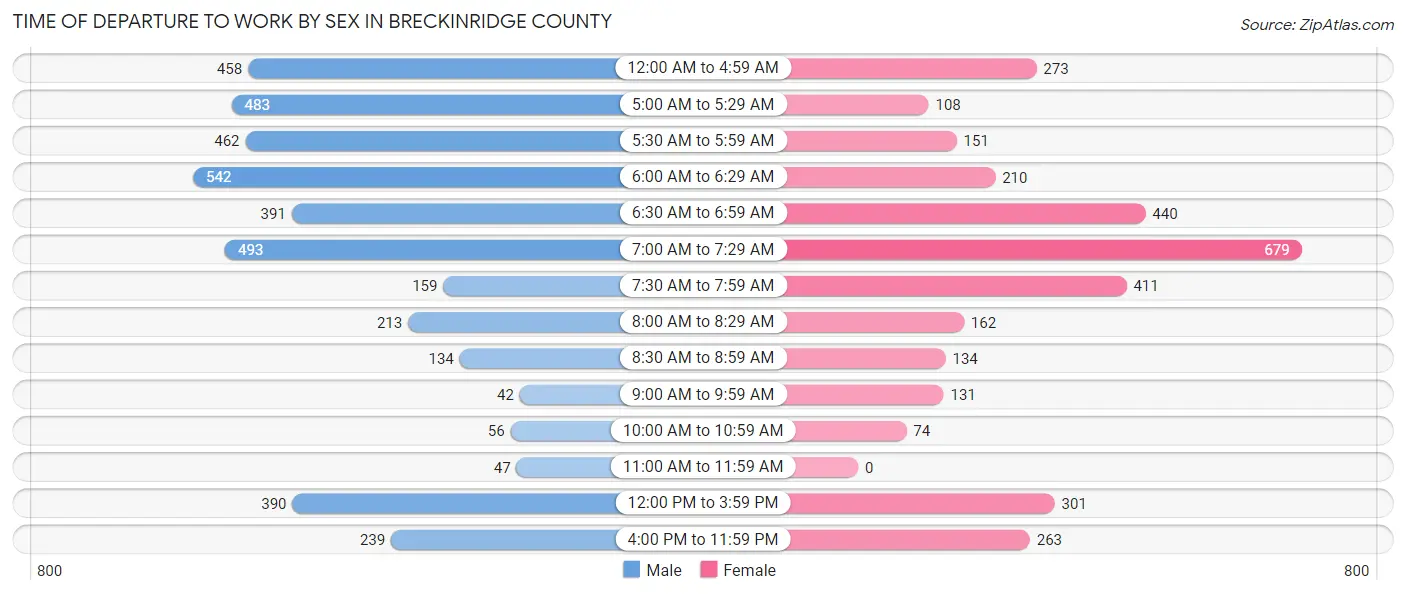
| Time of Departure | Male | Female |
| 12:00 AM to 4:59 AM | 458 (11.2%) | 273 (8.2%) |
| 5:00 AM to 5:29 AM | 483 (11.7%) | 108 (3.2%) |
| 5:30 AM to 5:59 AM | 462 (11.2%) | 151 (4.5%) |
| 6:00 AM to 6:29 AM | 542 (13.2%) | 210 (6.3%) |
| 6:30 AM to 6:59 AM | 391 (9.5%) | 440 (13.2%) |
| 7:00 AM to 7:29 AM | 493 (12.0%) | 679 (20.3%) |
| 7:30 AM to 7:59 AM | 159 (3.9%) | 411 (12.3%) |
| 8:00 AM to 8:29 AM | 213 (5.2%) | 162 (4.9%) |
| 8:30 AM to 8:59 AM | 134 (3.3%) | 134 (4.0%) |
| 9:00 AM to 9:59 AM | 42 (1.0%) | 131 (3.9%) |
| 10:00 AM to 10:59 AM | 56 (1.4%) | 74 (2.2%) |
| 11:00 AM to 11:59 AM | 47 (1.1%) | 0 (0.0%) |
| 12:00 PM to 3:59 PM | 390 (9.5%) | 301 (9.0%) |
| 4:00 PM to 11:59 PM | 239 (5.8%) | 263 (7.9%) |
| Total | 4,109 (100.0%) | 3,337 (100.0%) |
Housing Occupancy in Breckinridge County
Occupancy by Ownership in Breckinridge County
Of the total 7,542 dwellings in Breckinridge County, owner-occupied units account for 6,215 (82.4%), while renter-occupied units make up 1,327 (17.6%).
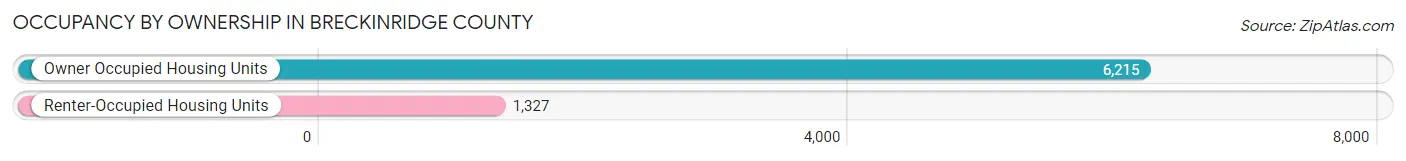
| Occupancy | # Housing Units | % Housing Units |
| Owner Occupied Housing Units | 6,215 | 82.4% |
| Renter-Occupied Housing Units | 1,327 | 17.6% |
| Total Occupied Housing Units | 7,542 | 100.0% |
Occupancy by Household Size in Breckinridge County
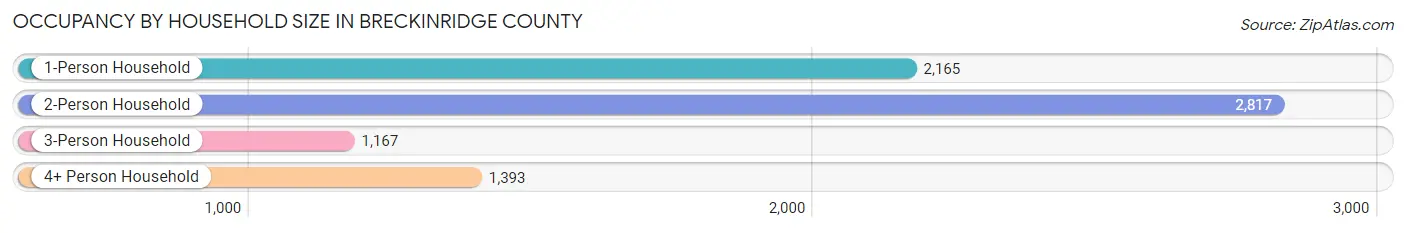
| Household Size | # Housing Units | % Housing Units |
| 1-Person Household | 2,165 | 28.7% |
| 2-Person Household | 2,817 | 37.3% |
| 3-Person Household | 1,167 | 15.5% |
| 4+ Person Household | 1,393 | 18.5% |
| Total Housing Units | 7,542 | 100.0% |
Occupancy by Ownership by Household Size in Breckinridge County
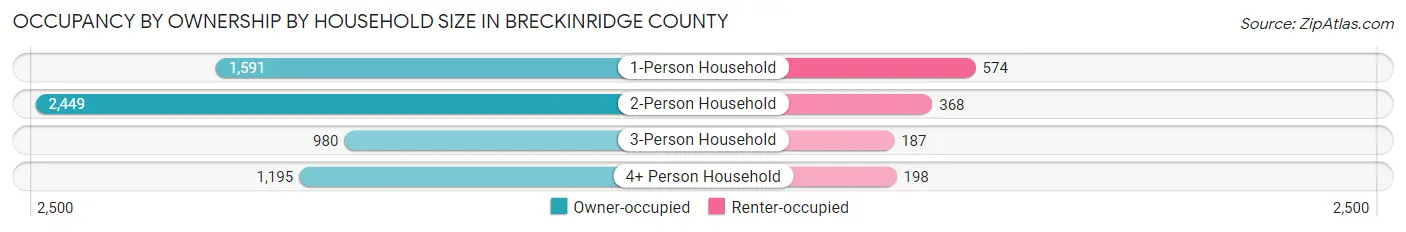
| Household Size | Owner-occupied | Renter-occupied |
| 1-Person Household | 1,591 (73.5%) | 574 (26.5%) |
| 2-Person Household | 2,449 (86.9%) | 368 (13.1%) |
| 3-Person Household | 980 (84.0%) | 187 (16.0%) |
| 4+ Person Household | 1,195 (85.8%) | 198 (14.2%) |
| Total Housing Units | 6,215 (82.4%) | 1,327 (17.6%) |
Occupancy by Educational Attainment in Breckinridge County
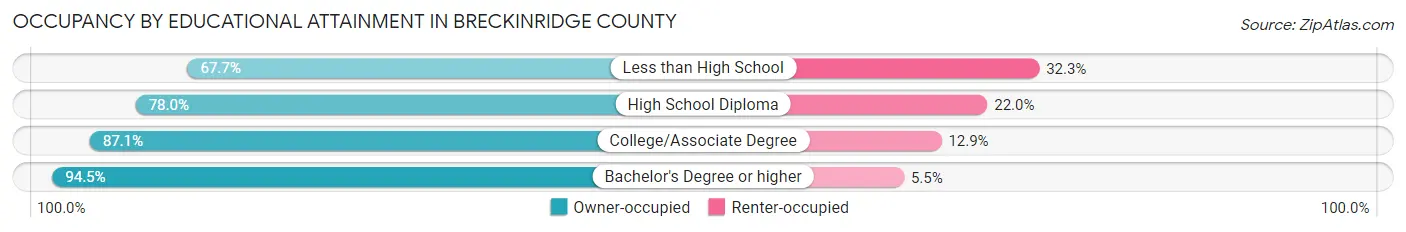
| Household Size | Owner-occupied | Renter-occupied |
| Less than High School | 536 (67.7%) | 256 (32.3%) |
| High School Diploma | 2,465 (78.0%) | 697 (22.0%) |
| College/Associate Degree | 2,066 (87.1%) | 307 (12.9%) |
| Bachelor's Degree or higher | 1,148 (94.5%) | 67 (5.5%) |
Occupancy by Age of Householder in Breckinridge County
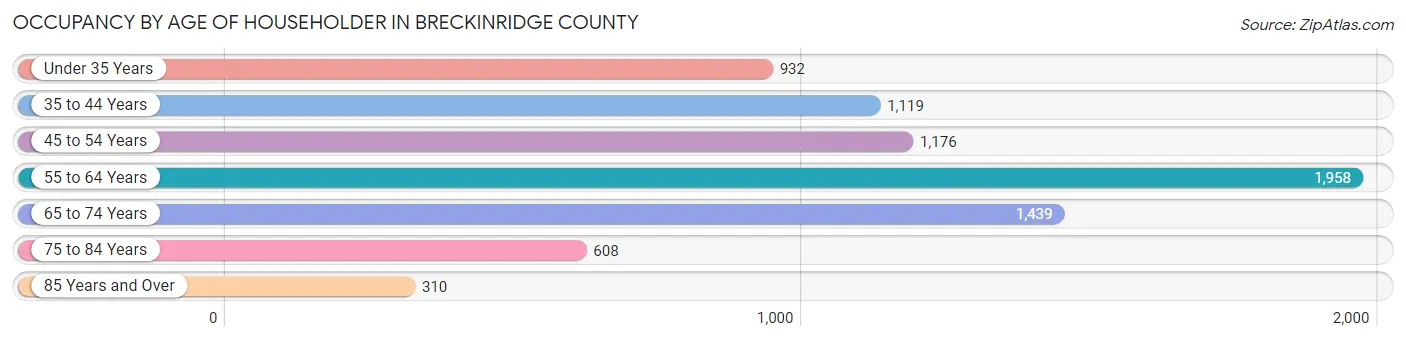
| Age Bracket | # Households | % Households |
| Under 35 Years | 932 | 12.4% |
| 35 to 44 Years | 1,119 | 14.8% |
| 45 to 54 Years | 1,176 | 15.6% |
| 55 to 64 Years | 1,958 | 26.0% |
| 65 to 74 Years | 1,439 | 19.1% |
| 75 to 84 Years | 608 | 8.1% |
| 85 Years and Over | 310 | 4.1% |
| Total | 7,542 | 100.0% |
Housing Finances in Breckinridge County
Median Income by Occupancy in Breckinridge County
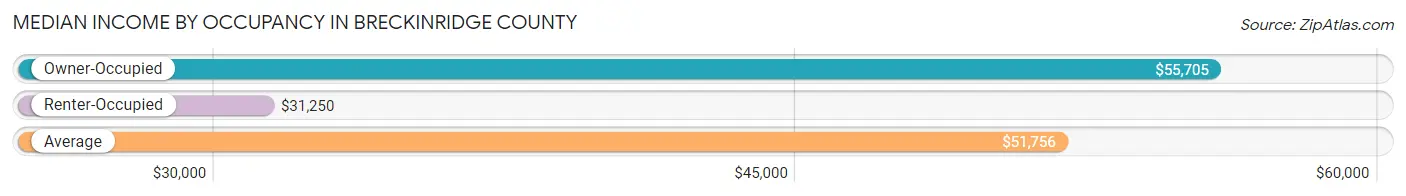
| Occupancy Type | # Households | Median Income |
| Owner-Occupied | 6,215 (82.4%) | $55,705 |
| Renter-Occupied | 1,327 (17.6%) | $31,250 |
| Average | 7,542 (100.0%) | $51,756 |
Occupancy by Householder Income Bracket in Breckinridge County
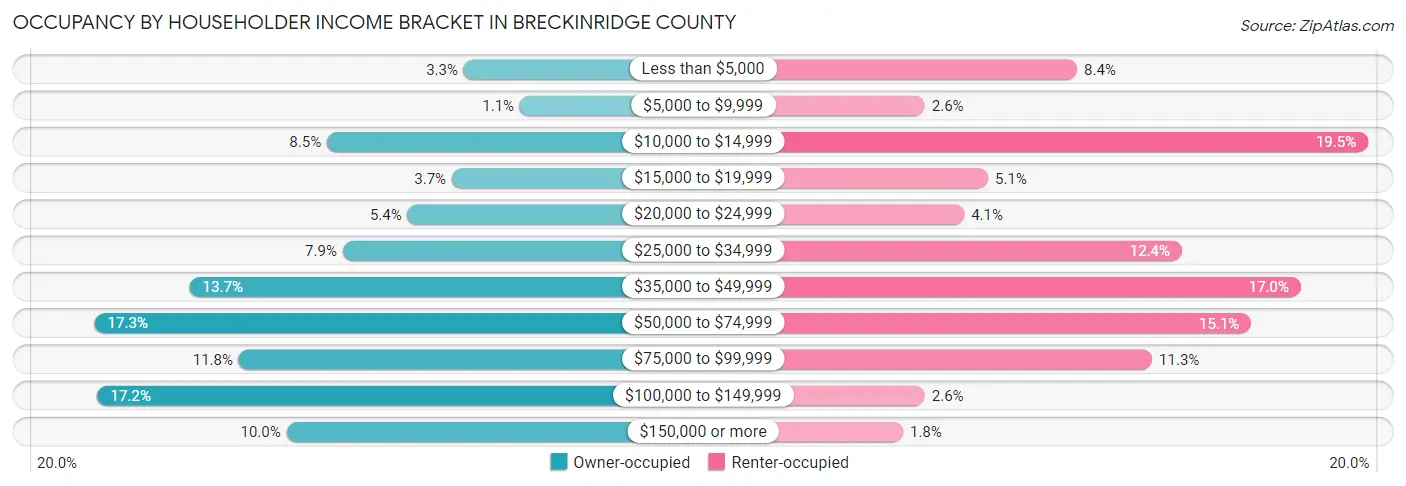
| Income Bracket | Owner-occupied | Renter-occupied |
| Less than $5,000 | 203 (3.3%) | 112 (8.4%) |
| $5,000 to $9,999 | 70 (1.1%) | 35 (2.6%) |
| $10,000 to $14,999 | 527 (8.5%) | 259 (19.5%) |
| $15,000 to $19,999 | 231 (3.7%) | 67 (5.1%) |
| $20,000 to $24,999 | 336 (5.4%) | 55 (4.1%) |
| $25,000 to $34,999 | 490 (7.9%) | 165 (12.4%) |
| $35,000 to $49,999 | 852 (13.7%) | 225 (17.0%) |
| $50,000 to $74,999 | 1,077 (17.3%) | 200 (15.1%) |
| $75,000 to $99,999 | 736 (11.8%) | 150 (11.3%) |
| $100,000 to $149,999 | 1,070 (17.2%) | 35 (2.6%) |
| $150,000 or more | 623 (10.0%) | 24 (1.8%) |
| Total | 6,215 (100.0%) | 1,327 (100.0%) |
Monthly Housing Cost Tiers in Breckinridge County
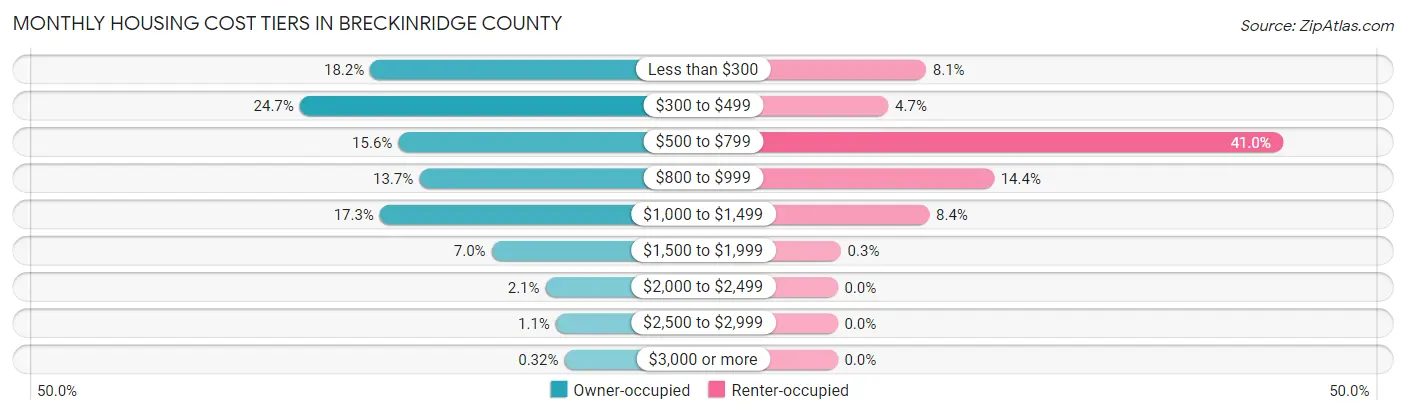
| Monthly Cost | Owner-occupied | Renter-occupied |
| Less than $300 | 1,131 (18.2%) | 108 (8.1%) |
| $300 to $499 | 1,534 (24.7%) | 62 (4.7%) |
| $500 to $799 | 970 (15.6%) | 544 (41.0%) |
| $800 to $999 | 851 (13.7%) | 191 (14.4%) |
| $1,000 to $1,499 | 1,076 (17.3%) | 112 (8.4%) |
| $1,500 to $1,999 | 436 (7.0%) | 4 (0.3%) |
| $2,000 to $2,499 | 128 (2.1%) | 0 (0.0%) |
| $2,500 to $2,999 | 69 (1.1%) | 0 (0.0%) |
| $3,000 or more | 20 (0.3%) | 0 (0.0%) |
| Total | 6,215 (100.0%) | 1,327 (100.0%) |
Physical Housing Characteristics in Breckinridge County
Housing Structures in Breckinridge County
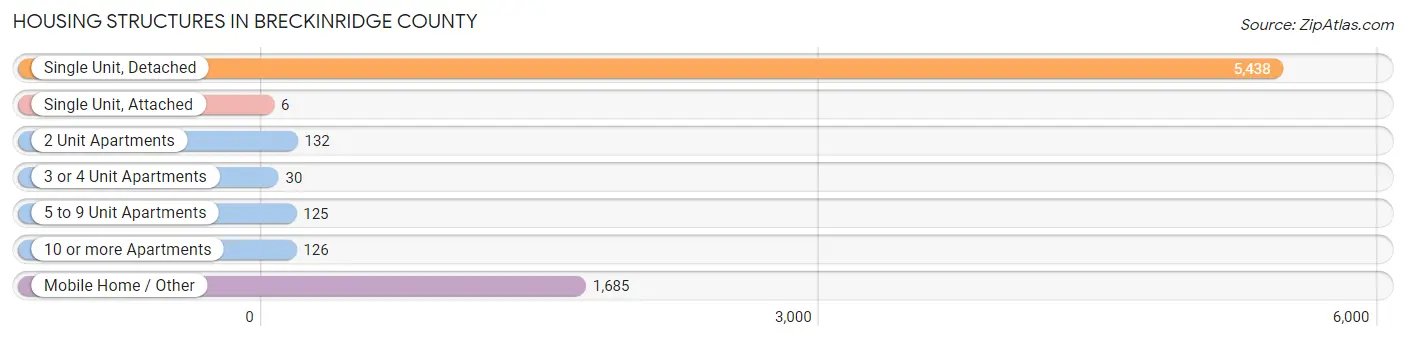
| Structure Type | # Housing Units | % Housing Units |
| Single Unit, Detached | 5,438 | 72.1% |
| Single Unit, Attached | 6 | 0.1% |
| 2 Unit Apartments | 132 | 1.8% |
| 3 or 4 Unit Apartments | 30 | 0.4% |
| 5 to 9 Unit Apartments | 125 | 1.7% |
| 10 or more Apartments | 126 | 1.7% |
| Mobile Home / Other | 1,685 | 22.3% |
| Total | 7,542 | 100.0% |
Housing Structures by Occupancy in Breckinridge County
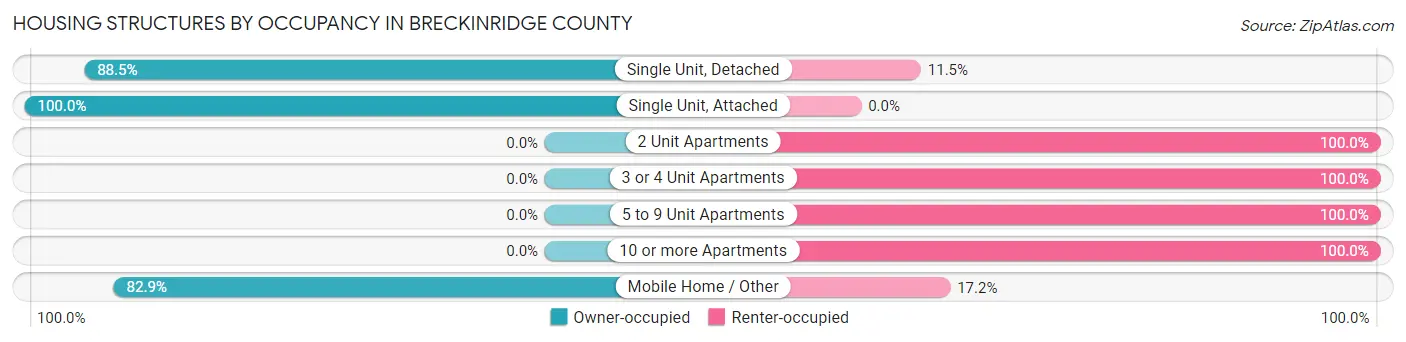
| Structure Type | Owner-occupied | Renter-occupied |
| Single Unit, Detached | 4,813 (88.5%) | 625 (11.5%) |
| Single Unit, Attached | 6 (100.0%) | 0 (0.0%) |
| 2 Unit Apartments | 0 (0.0%) | 132 (100.0%) |
| 3 or 4 Unit Apartments | 0 (0.0%) | 30 (100.0%) |
| 5 to 9 Unit Apartments | 0 (0.0%) | 125 (100.0%) |
| 10 or more Apartments | 0 (0.0%) | 126 (100.0%) |
| Mobile Home / Other | 1,396 (82.9%) | 289 (17.2%) |
| Total | 6,215 (82.4%) | 1,327 (17.6%) |
Housing Structures by Number of Rooms in Breckinridge County
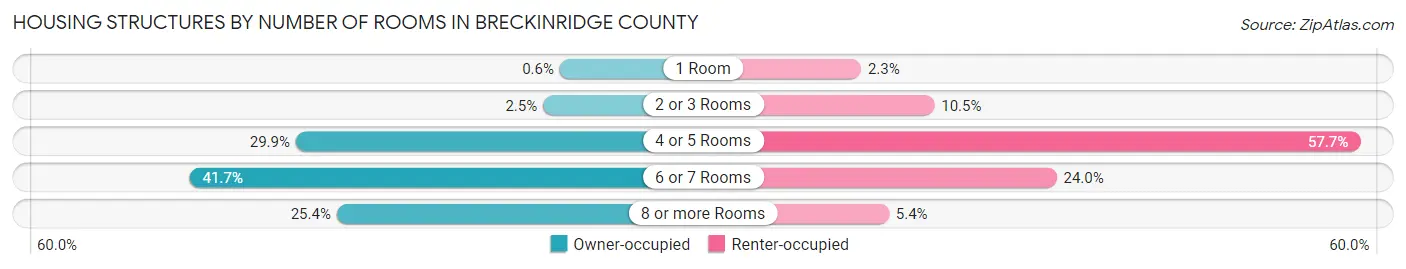
| Number of Rooms | Owner-occupied | Renter-occupied |
| 1 Room | 37 (0.6%) | 31 (2.3%) |
| 2 or 3 Rooms | 153 (2.5%) | 139 (10.5%) |
| 4 or 5 Rooms | 1,858 (29.9%) | 766 (57.7%) |
| 6 or 7 Rooms | 2,591 (41.7%) | 319 (24.0%) |
| 8 or more Rooms | 1,576 (25.4%) | 72 (5.4%) |
| Total | 6,215 (100.0%) | 1,327 (100.0%) |
Housing Structure by Heating Type in Breckinridge County
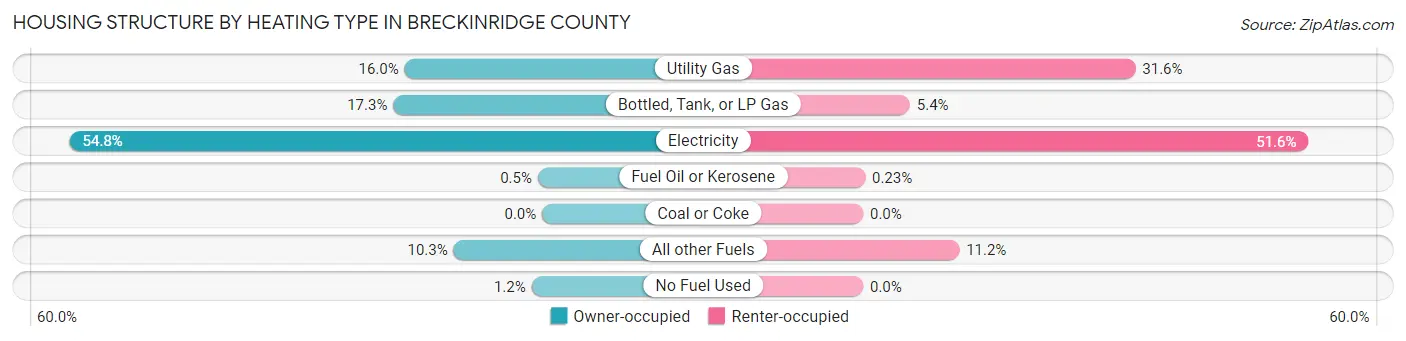
| Heating Type | Owner-occupied | Renter-occupied |
| Utility Gas | 991 (16.0%) | 419 (31.6%) |
| Bottled, Tank, or LP Gas | 1,073 (17.3%) | 72 (5.4%) |
| Electricity | 3,406 (54.8%) | 685 (51.6%) |
| Fuel Oil or Kerosene | 31 (0.5%) | 3 (0.2%) |
| Coal or Coke | 0 (0.0%) | 0 (0.0%) |
| All other Fuels | 638 (10.3%) | 148 (11.2%) |
| No Fuel Used | 76 (1.2%) | 0 (0.0%) |
| Total | 6,215 (100.0%) | 1,327 (100.0%) |
Household Vehicle Usage in Breckinridge County
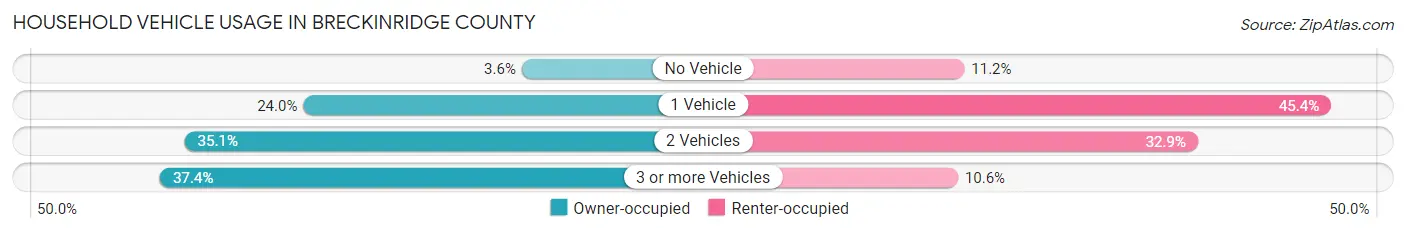
| Vehicles per Household | Owner-occupied | Renter-occupied |
| No Vehicle | 223 (3.6%) | 148 (11.2%) |
| 1 Vehicle | 1,491 (24.0%) | 602 (45.4%) |
| 2 Vehicles | 2,179 (35.1%) | 437 (32.9%) |
| 3 or more Vehicles | 2,322 (37.4%) | 140 (10.5%) |
| Total | 6,215 (100.0%) | 1,327 (100.0%) |
Real Estate & Mortgages in Breckinridge County
Real Estate and Mortgage Overview in Breckinridge County
| Characteristic | Without Mortgage | With Mortgage |
| Housing Units | 3,418 | 2,797 |
| Median Property Value | $113,200 | $139,900 |
| Median Household Income | $45,281 | $435 |
| Monthly Housing Costs | $369 | $20 |
| Real Estate Taxes | $736 | $81 |
Property Value by Mortgage Status in Breckinridge County
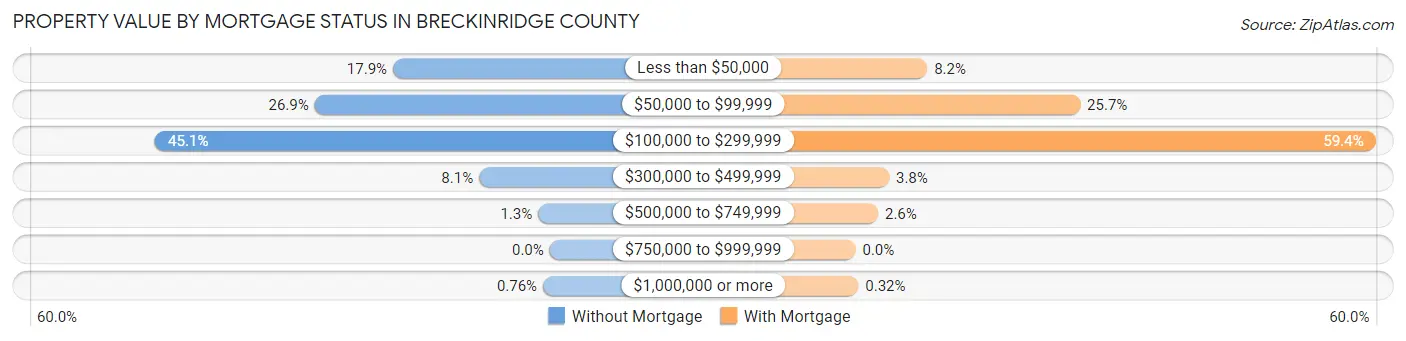
| Property Value | Without Mortgage | With Mortgage |
| Less than $50,000 | 612 (17.9%) | 229 (8.2%) |
| $50,000 to $99,999 | 918 (26.9%) | 718 (25.7%) |
| $100,000 to $299,999 | 1,541 (45.1%) | 1,662 (59.4%) |
| $300,000 to $499,999 | 276 (8.1%) | 107 (3.8%) |
| $500,000 to $749,999 | 45 (1.3%) | 72 (2.6%) |
| $750,000 to $999,999 | 0 (0.0%) | 0 (0.0%) |
| $1,000,000 or more | 26 (0.8%) | 9 (0.3%) |
| Total | 3,418 (100.0%) | 2,797 (100.0%) |
Household Income by Mortgage Status in Breckinridge County
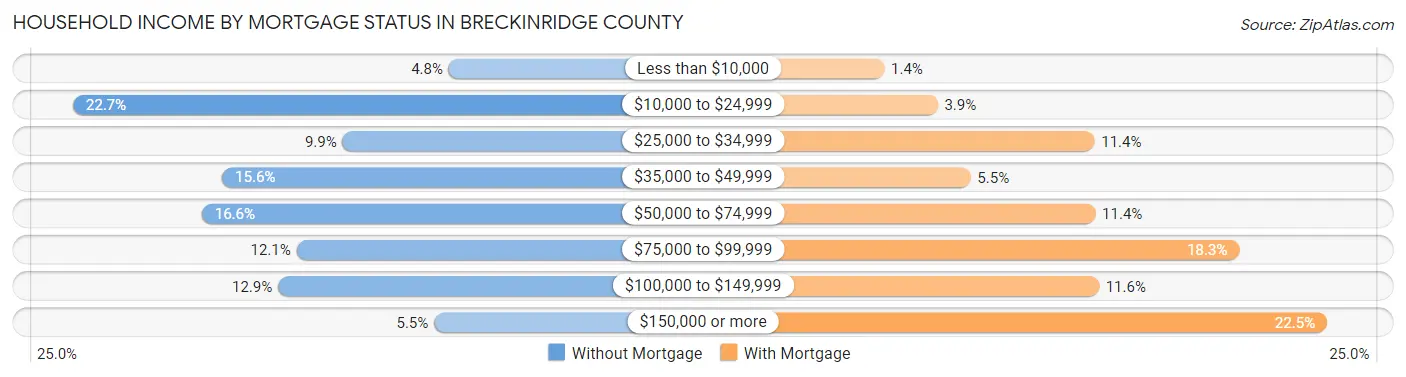
| Household Income | Without Mortgage | With Mortgage |
| Less than $10,000 | 164 (4.8%) | 38 (1.4%) |
| $10,000 to $24,999 | 776 (22.7%) | 109 (3.9%) |
| $25,000 to $34,999 | 337 (9.9%) | 318 (11.4%) |
| $35,000 to $49,999 | 533 (15.6%) | 153 (5.5%) |
| $50,000 to $74,999 | 566 (16.6%) | 319 (11.4%) |
| $75,000 to $99,999 | 412 (12.0%) | 511 (18.3%) |
| $100,000 to $149,999 | 442 (12.9%) | 324 (11.6%) |
| $150,000 or more | 188 (5.5%) | 628 (22.5%) |
| Total | 3,418 (100.0%) | 2,797 (100.0%) |
Property Value to Household Income Ratio in Breckinridge County
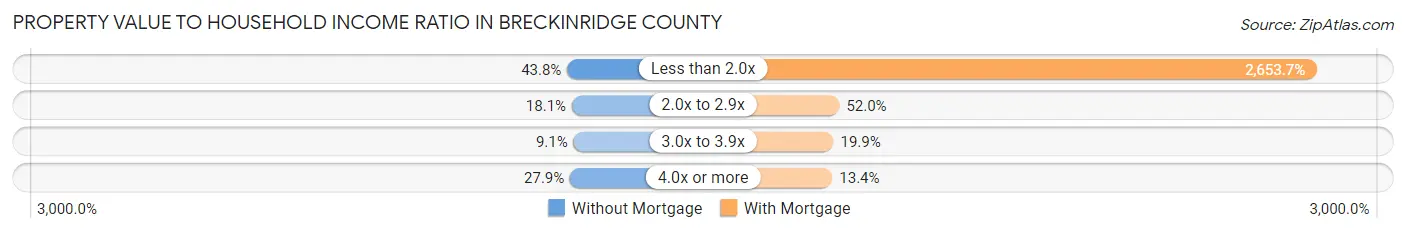
| Value-to-Income Ratio | Without Mortgage | With Mortgage |
| Less than 2.0x | 1,498 (43.8%) | 74,223 (2,653.7%) |
| 2.0x to 2.9x | 617 (18.0%) | 1,455 (52.0%) |
| 3.0x to 3.9x | 311 (9.1%) | 557 (19.9%) |
| 4.0x or more | 952 (27.9%) | 374 (13.4%) |
| Total | 3,418 (100.0%) | 2,797 (100.0%) |
Real Estate Taxes by Mortgage Status in Breckinridge County
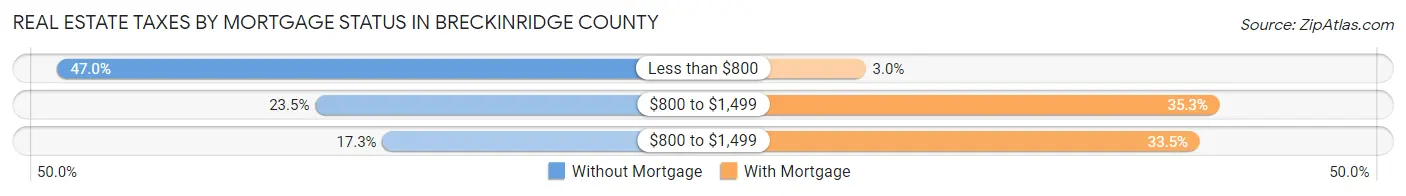
| Property Taxes | Without Mortgage | With Mortgage |
| Less than $800 | 1,606 (47.0%) | 83 (3.0%) |
| $800 to $1,499 | 802 (23.5%) | 988 (35.3%) |
| $800 to $1,499 | 592 (17.3%) | 937 (33.5%) |
| Total | 3,418 (100.0%) | 2,797 (100.0%) |
Health & Disability in Breckinridge County
Health Insurance Coverage by Age in Breckinridge County
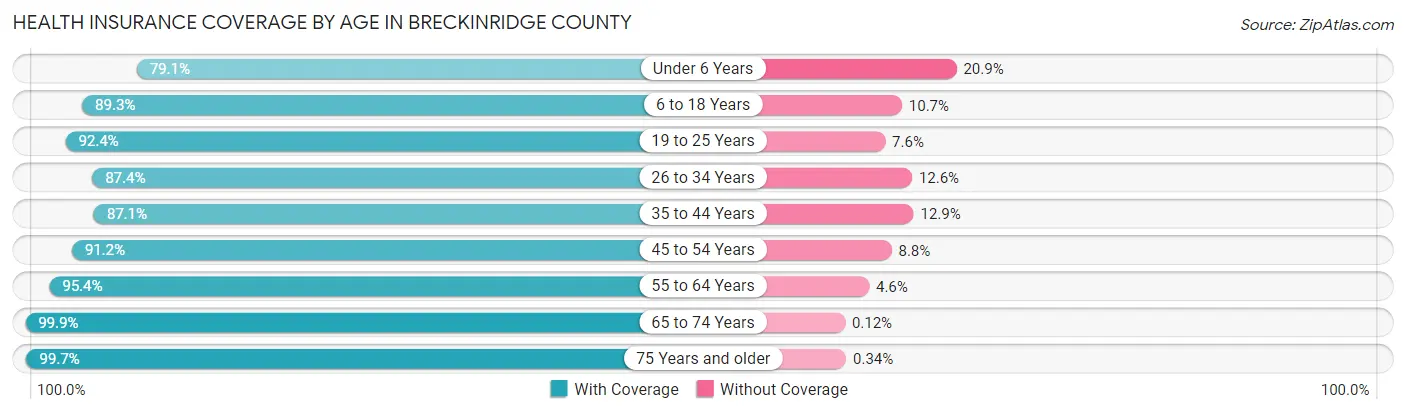
| Age Bracket | With Coverage | Without Coverage |
| Under 6 Years | 998 (79.1%) | 264 (20.9%) |
| 6 to 18 Years | 3,232 (89.3%) | 389 (10.7%) |
| 19 to 25 Years | 1,552 (92.4%) | 128 (7.6%) |
| 26 to 34 Years | 1,572 (87.4%) | 227 (12.6%) |
| 35 to 44 Years | 1,990 (87.1%) | 295 (12.9%) |
| 45 to 54 Years | 2,330 (91.2%) | 225 (8.8%) |
| 55 to 64 Years | 2,977 (95.4%) | 144 (4.6%) |
| 65 to 74 Years | 2,415 (99.9%) | 3 (0.1%) |
| 75 Years and older | 1,469 (99.7%) | 5 (0.3%) |
| Total | 18,535 (91.7%) | 1,680 (8.3%) |
Health Insurance Coverage by Citizenship Status in Breckinridge County
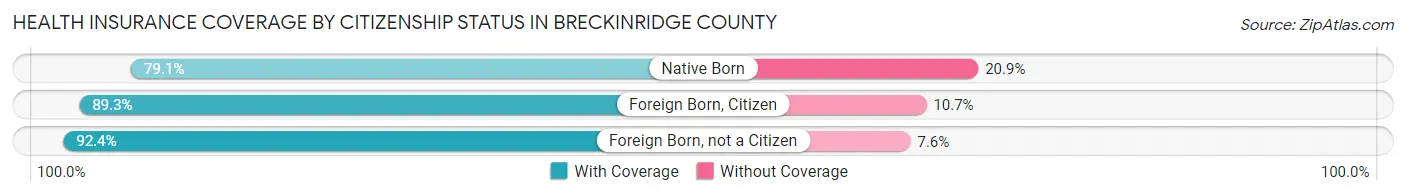
| Citizenship Status | With Coverage | Without Coverage |
| Native Born | 998 (79.1%) | 264 (20.9%) |
| Foreign Born, Citizen | 3,232 (89.3%) | 389 (10.7%) |
| Foreign Born, not a Citizen | 1,552 (92.4%) | 128 (7.6%) |
Health Insurance Coverage by Household Income in Breckinridge County
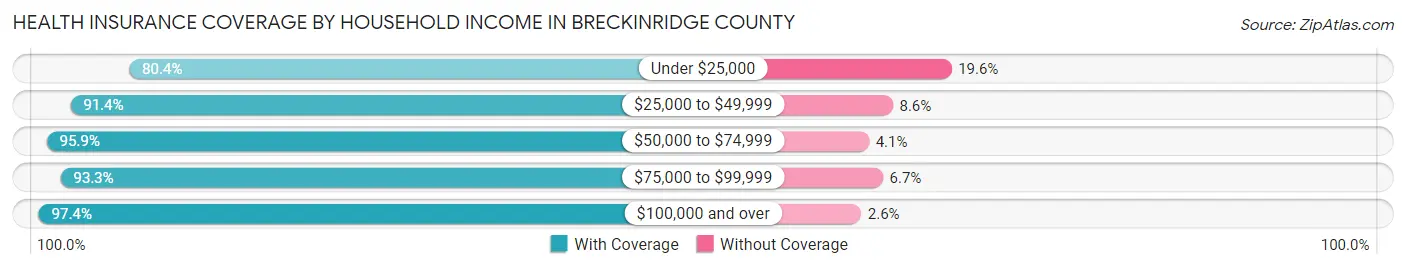
| Household Income | With Coverage | Without Coverage |
| Under $25,000 | 3,521 (80.4%) | 856 (19.6%) |
| $25,000 to $49,999 | 3,903 (91.4%) | 366 (8.6%) |
| $50,000 to $74,999 | 3,176 (95.9%) | 136 (4.1%) |
| $75,000 to $99,999 | 2,418 (93.3%) | 174 (6.7%) |
| $100,000 and over | 5,477 (97.4%) | 148 (2.6%) |
Public vs Private Health Insurance Coverage by Age in Breckinridge County
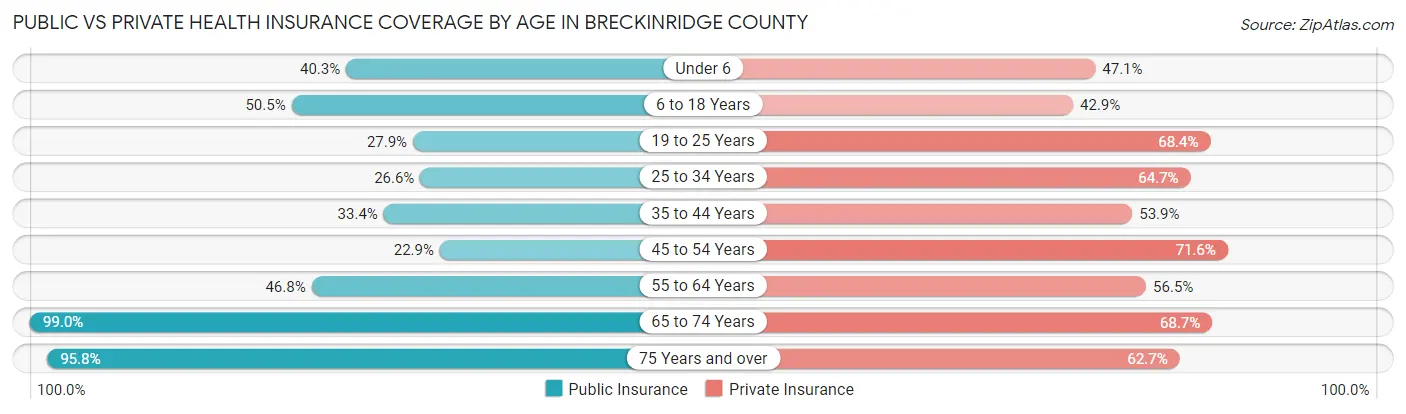
| Age Bracket | Public Insurance | Private Insurance |
| Under 6 | 509 (40.3%) | 594 (47.1%) |
| 6 to 18 Years | 1,827 (50.5%) | 1,555 (42.9%) |
| 19 to 25 Years | 469 (27.9%) | 1,149 (68.4%) |
| 25 to 34 Years | 478 (26.6%) | 1,164 (64.7%) |
| 35 to 44 Years | 762 (33.4%) | 1,232 (53.9%) |
| 45 to 54 Years | 586 (22.9%) | 1,830 (71.6%) |
| 55 to 64 Years | 1,459 (46.8%) | 1,763 (56.5%) |
| 65 to 74 Years | 2,394 (99.0%) | 1,662 (68.7%) |
| 75 Years and over | 1,412 (95.8%) | 924 (62.7%) |
| Total | 9,896 (48.9%) | 11,873 (58.7%) |
Disability Status by Sex by Age in Breckinridge County
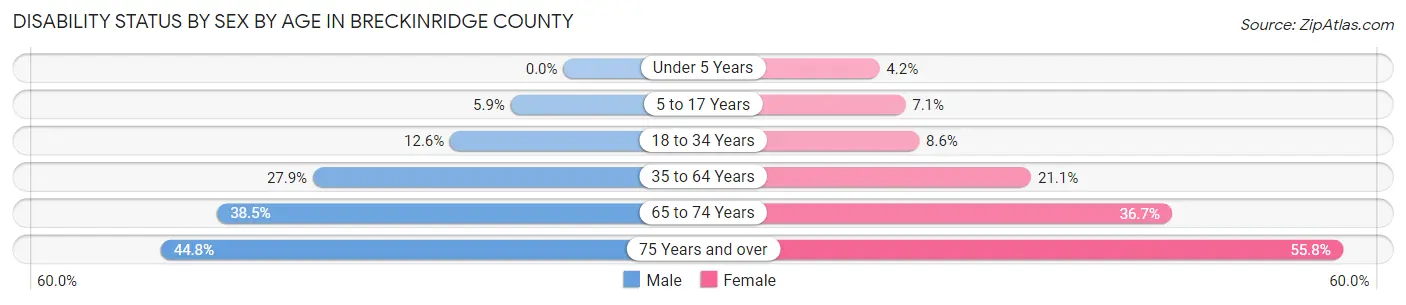
| Age Bracket | Male | Female |
| Under 5 Years | 0 (0.0%) | 23 (4.2%) |
| 5 to 17 Years | 107 (5.9%) | 117 (7.1%) |
| 18 to 34 Years | 236 (12.6%) | 160 (8.6%) |
| 35 to 64 Years | 1,110 (27.9%) | 839 (21.1%) |
| 65 to 74 Years | 464 (38.5%) | 446 (36.7%) |
| 75 Years and over | 295 (44.8%) | 455 (55.8%) |
Disability Class by Sex by Age in Breckinridge County
Disability Class: Hearing Difficulty
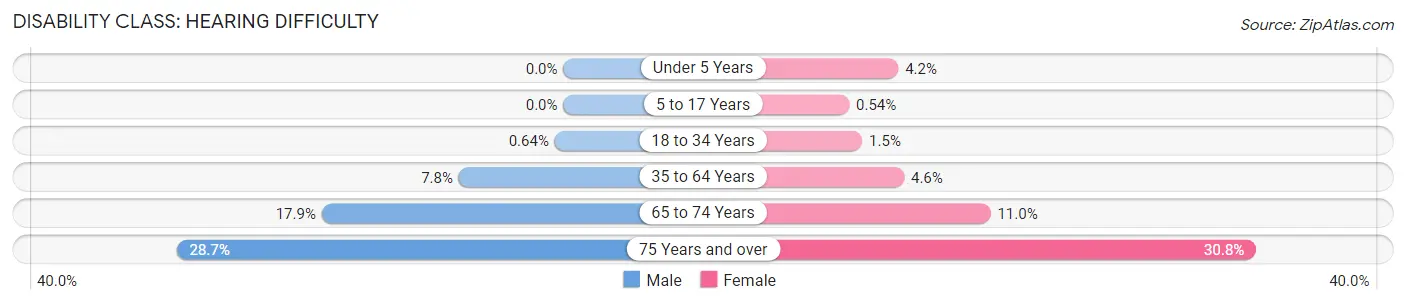
| Age Bracket | Male | Female |
| Under 5 Years | 0 (0.0%) | 23 (4.2%) |
| 5 to 17 Years | 0 (0.0%) | 9 (0.5%) |
| 18 to 34 Years | 12 (0.6%) | 28 (1.5%) |
| 35 to 64 Years | 309 (7.8%) | 184 (4.6%) |
| 65 to 74 Years | 216 (17.9%) | 134 (11.0%) |
| 75 Years and over | 189 (28.7%) | 251 (30.8%) |
Disability Class: Vision Difficulty
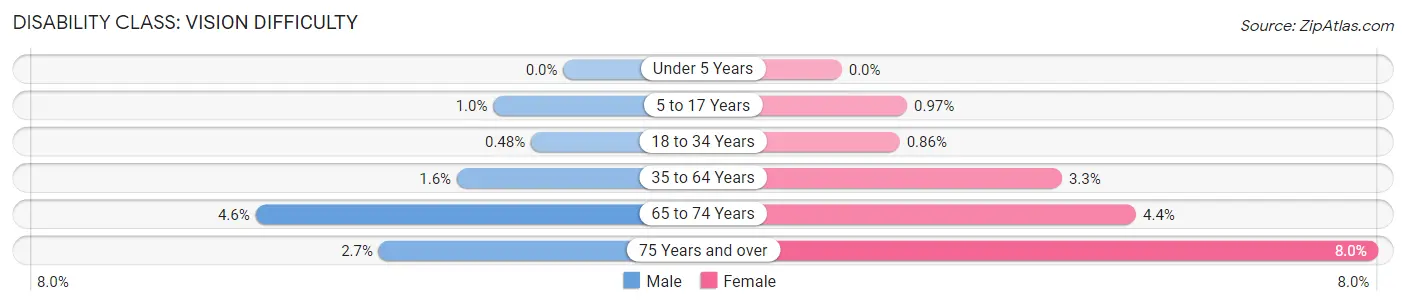
| Age Bracket | Male | Female |
| Under 5 Years | 0 (0.0%) | 0 (0.0%) |
| 5 to 17 Years | 19 (1.0%) | 16 (1.0%) |
| 18 to 34 Years | 9 (0.5%) | 16 (0.9%) |
| 35 to 64 Years | 63 (1.6%) | 130 (3.3%) |
| 65 to 74 Years | 55 (4.6%) | 53 (4.4%) |
| 75 Years and over | 18 (2.7%) | 65 (8.0%) |
Disability Class: Cognitive Difficulty
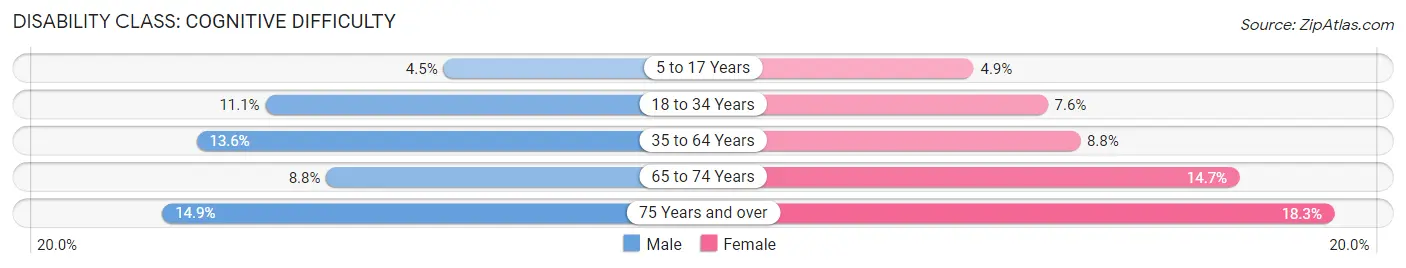
| Age Bracket | Male | Female |
| 5 to 17 Years | 81 (4.4%) | 81 (4.9%) |
| 18 to 34 Years | 207 (11.1%) | 142 (7.6%) |
| 35 to 64 Years | 542 (13.6%) | 352 (8.8%) |
| 65 to 74 Years | 106 (8.8%) | 179 (14.7%) |
| 75 Years and over | 98 (14.9%) | 149 (18.3%) |
Disability Class: Ambulatory Difficulty
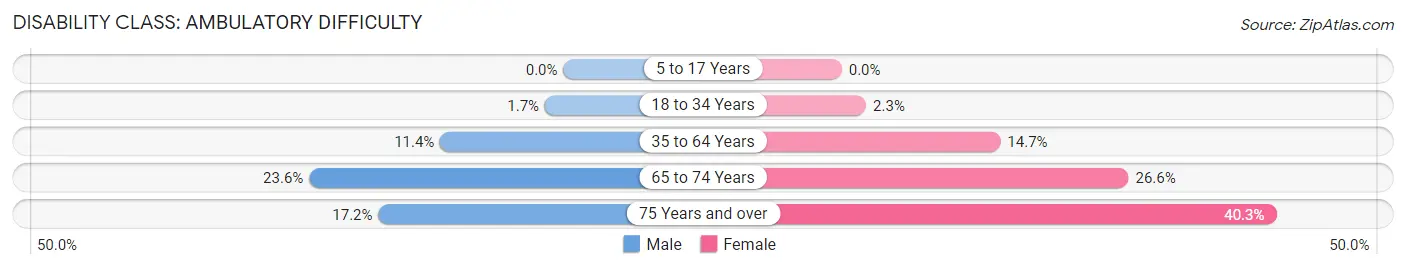
| Age Bracket | Male | Female |
| 5 to 17 Years | 0 (0.0%) | 0 (0.0%) |
| 18 to 34 Years | 32 (1.7%) | 42 (2.3%) |
| 35 to 64 Years | 455 (11.4%) | 586 (14.7%) |
| 65 to 74 Years | 284 (23.6%) | 323 (26.6%) |
| 75 Years and over | 113 (17.2%) | 329 (40.3%) |
Disability Class: Self-Care Difficulty
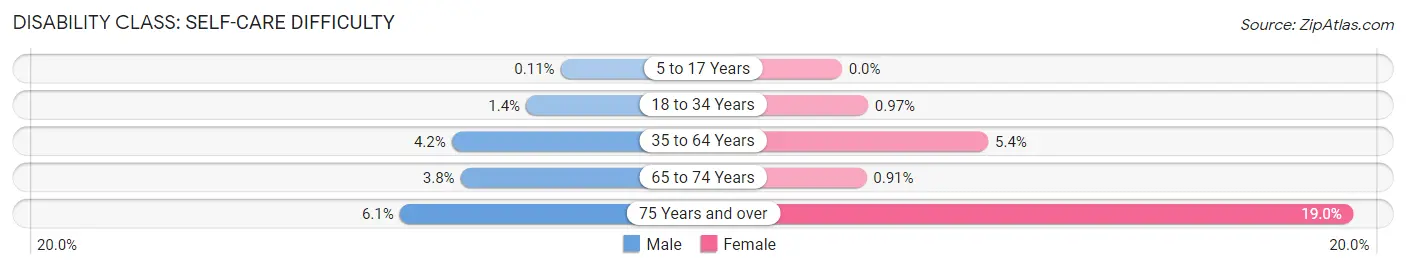
| Age Bracket | Male | Female |
| 5 to 17 Years | 2 (0.1%) | 0 (0.0%) |
| 18 to 34 Years | 26 (1.4%) | 18 (1.0%) |
| 35 to 64 Years | 165 (4.2%) | 216 (5.4%) |
| 65 to 74 Years | 46 (3.8%) | 11 (0.9%) |
| 75 Years and over | 40 (6.1%) | 155 (19.0%) |
Technology Access in Breckinridge County
Computing Device Access in Breckinridge County
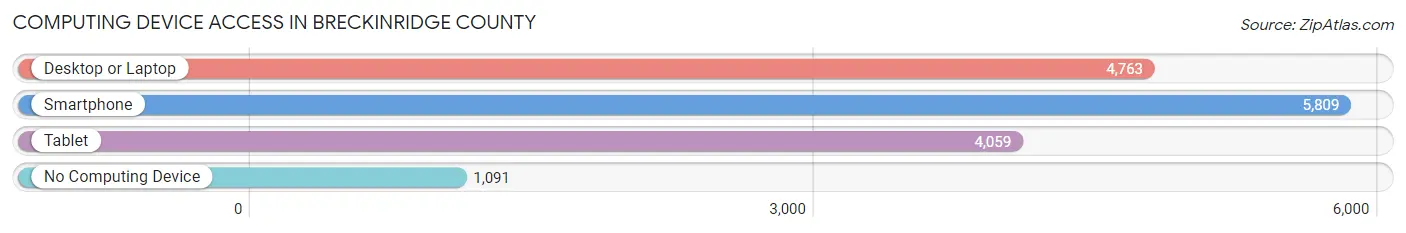
| Device Type | # Households | % Households |
| Desktop or Laptop | 4,763 | 63.1% |
| Smartphone | 5,809 | 77.0% |
| Tablet | 4,059 | 53.8% |
| No Computing Device | 1,091 | 14.5% |
| Total | 7,542 | 100.0% |
Internet Access in Breckinridge County
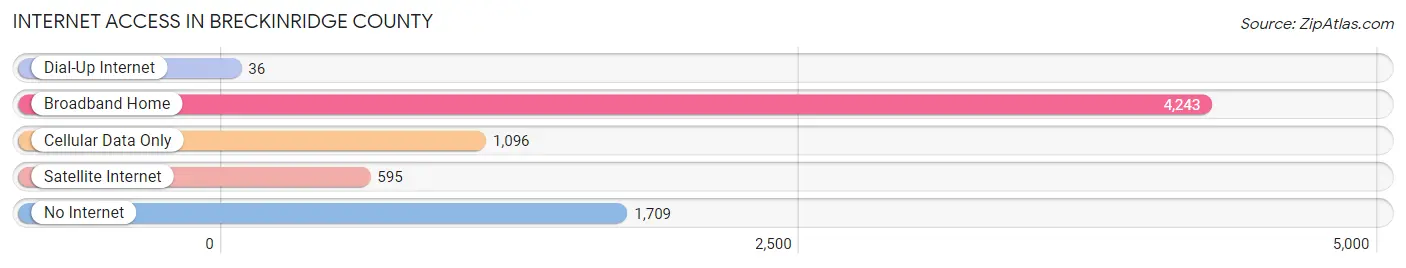
| Internet Type | # Households | % Households |
| Dial-Up Internet | 36 | 0.5% |
| Broadband Home | 4,243 | 56.3% |
| Cellular Data Only | 1,096 | 14.5% |
| Satellite Internet | 595 | 7.9% |
| No Internet | 1,709 | 22.7% |
| Total | 7,542 | 100.0% |
Breckinridge County Summary
Breckinridge County is located in the western part of Kentucky, in the heart of the state’s Bluegrass region. It is bordered by Hardin County to the north, Grayson County to the east, Meade County to the south, and Ohio County to the west. The county seat is Hardinsburg, and the county is named after John Breckinridge, the 14th Vice President of the United States.
History
Breckinridge County was formed in 1799 from parts of Hardin and Grayson counties. It was named after John Breckinridge, who was a U.S. Senator from Kentucky and the 14th Vice President of the United States. The county was originally part of the Shawnee Indian Reservation, and the first settlers arrived in the area in the late 1700s.
The county was an important part of the Underground Railroad, with many of the county’s residents helping to hide and transport escaped slaves. During the Civil War, the county was divided between Union and Confederate sympathizers, and the county was the site of several skirmishes.
Geography
Breckinridge County is located in the western part of Kentucky, in the heart of the state’s Bluegrass region. It is bordered by Hardin County to the north, Grayson County to the east, Meade County to the south, and Ohio County to the west. The county has a total area of 441 square miles, of which 437 square miles is land and 4 square miles is water.
The county is mostly flat, with some rolling hills in the northern and eastern parts. The highest point in the county is located in the northern part, at an elevation of 890 feet. The county is drained by the Ohio River, which forms its western border.
Economy
Breckinridge County’s economy is largely based on agriculture. The county is home to several large farms, and the main crops grown in the area are corn, soybeans, wheat, and hay. The county also has a thriving livestock industry, with cattle, hogs, and poultry being the main animals raised.
The county also has a strong manufacturing sector, with several factories producing a variety of products, including furniture, clothing, and automotive parts. The county is also home to several small businesses, including restaurants, retail stores, and service providers.
Demographics
As of the 2010 census, Breckinridge County had a population of 20,059. The population was spread out, with 48.3% male and 51.7% female. The median age was 41.7 years.
The racial makeup of the county was 95.2% White, 2.3% African American, 0.3% Native American, 0.3% Asian, 0.2% Pacific Islander, 0.7% from other races, and 1.2% from two or more races. Hispanic or Latino of any race were 1.7% of the population.
The median household income in the county was $41,945, and the median family income was $50,945. The per capita income was $20,945. About 11.2% of the population was below the poverty line.
Conclusion
Breckinridge County is located in the western part of Kentucky, in the heart of the state’s Bluegrass region. It was formed in 1799 and named after John Breckinridge, the 14th Vice President of the United States. The county has a total area of 441 square miles, and its economy is largely based on agriculture and manufacturing. As of the 2010 census, the county had a population of 20,059, with a median household income of $41,945. The county was an important part of the Underground Railroad, and it was divided between Union and Confederate sympathizers during the Civil War.
Common Questions
What is Per Capita Income in Breckinridge County?
Per Capita income in Breckinridge County is $27,733.
What is the Median Family Income in Breckinridge County?
Median Family Income in Breckinridge County is $64,675.
What is the Median Household income in Breckinridge County?
Median Household Income in Breckinridge County is $51,756.
What is Income or Wage Gap in Breckinridge County?
Income or Wage Gap in Breckinridge County is 40.4%.
Women in Breckinridge County earn 59.6 cents for every dollar earned by a man.
What is Family Income Deficit in Breckinridge County?
Family Income Deficit in Breckinridge County is $12,549.
Families that are below poverty line in Breckinridge County earn $12,549 less on average than the poverty threshold level.
What is Inequality or Gini Index in Breckinridge County?
Inequality or Gini Index in Breckinridge County is 0.46.
What is the Total Population of Breckinridge County?
Total Population of Breckinridge County is 20,528.
What is the Total Male Population of Breckinridge County?
Total Male Population of Breckinridge County is 10,403.
What is the Total Female Population of Breckinridge County?
Total Female Population of Breckinridge County is 10,125.
What is the Ratio of Males per 100 Females in Breckinridge County?
There are 102.75 Males per 100 Females in Breckinridge County.
What is the Ratio of Females per 100 Males in Breckinridge County?
There are 97.33 Females per 100 Males in Breckinridge County.
What is the Median Population Age in Breckinridge County?
Median Population Age in Breckinridge County is 42.3 Years.
What is the Average Family Size in Breckinridge County
Average Family Size in Breckinridge County is 3.3 People.
What is the Average Household Size in Breckinridge County
Average Household Size in Breckinridge County is 2.7 People.
How Large is the Labor Force in Breckinridge County?
There are 8,489 People in the Labor Forcein in Breckinridge County.
What is the Percentage of People in the Labor Force in Breckinridge County?
51.7% of People are in the Labor Force in Breckinridge County.
What is the Unemployment Rate in Breckinridge County?
Unemployment Rate in Breckinridge County is 7.7%.