Breathitt County, KY Map & Demographics
Breathitt County Map
Breathitt County Overview
$21,985
PER CAPITA INCOME
$52,216
AVG FAMILY INCOME
$38,209
AVG HOUSEHOLD INCOME
23.4%
WAGE / INCOME GAP [ % ]
76.6¢/ $1
WAGE / INCOME GAP [ $ ]
$11,185
FAMILY INCOME DEFICIT
0.46
INEQUALITY / GINI INDEX
13,580
TOTAL POPULATION
6,865
MALE POPULATION
6,715
FEMALE POPULATION
102.23
MALES / 100 FEMALES
97.82
FEMALES / 100 MALES
42.7
MEDIAN AGE
3.0
AVG FAMILY SIZE
2.4
AVG HOUSEHOLD SIZE
5,000
LABOR FORCE [ PEOPLE ]
45.1%
PERCENT IN LABOR FORCE
8.9%
UNEMPLOYMENT RATE
Breathitt County Area Codes
Income in Breathitt County
Income Overview in Breathitt County
Per Capita Income in Breathitt County is $21,985, while median incomes of families and households are $52,216 and $38,209 respectively.
| Characteristic | Number | Measure |
| Per Capita Income | 13,580 | $21,985 |
| Median Family Income | 3,582 | $52,216 |
| Mean Family Income | 3,582 | $61,064 |
| Median Household Income | 5,529 | $38,209 |
| Mean Household Income | 5,529 | $50,811 |
| Income Deficit | 3,582 | $11,185 |
| Wage / Income Gap (%) | 13,580 | 23.38% |
| Wage / Income Gap ($) | 13,580 | 76.62¢ per $1 |
| Gini / Inequality Index | 13,580 | 0.46 |
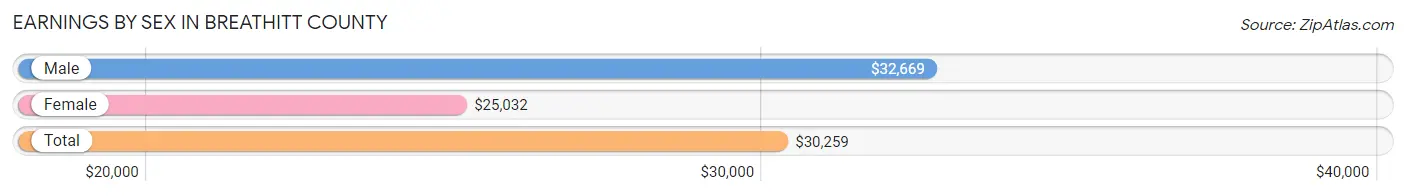
Earnings by Sex in Breathitt County
Average Earnings in Breathitt County are $30,259, $32,669 for men and $25,032 for women, a difference of 23.4%.
| Sex | Number | Average Earnings |
| Male | 2,679 (52.1%) | $32,669 |
| Female | 2,459 (47.9%) | $25,032 |
| Total | 5,138 (100.0%) | $30,259 |
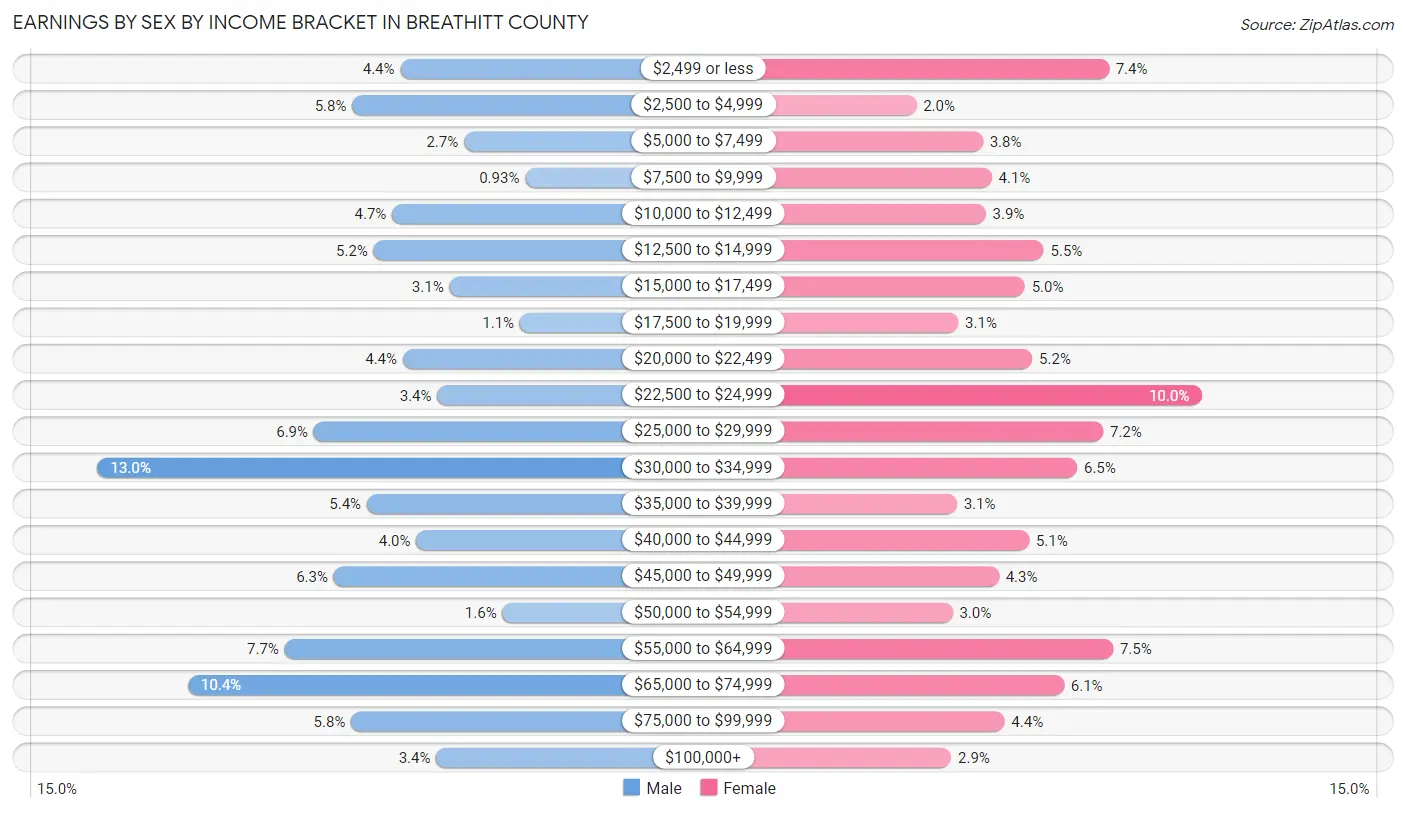
Earnings by Sex by Income Bracket in Breathitt County
The most common earnings brackets in Breathitt County are $30,000 to $34,999 for men (347 | 13.0%) and $22,500 to $24,999 for women (245 | 10.0%).
| Income | Male | Female |
| $2,499 or less | 119 (4.4%) | 181 (7.4%) |
| $2,500 to $4,999 | 155 (5.8%) | 48 (1.9%) |
| $5,000 to $7,499 | 71 (2.6%) | 94 (3.8%) |
| $7,500 to $9,999 | 25 (0.9%) | 100 (4.1%) |
| $10,000 to $12,499 | 125 (4.7%) | 96 (3.9%) |
| $12,500 to $14,999 | 139 (5.2%) | 136 (5.5%) |
| $15,000 to $17,499 | 82 (3.1%) | 123 (5.0%) |
| $17,500 to $19,999 | 29 (1.1%) | 77 (3.1%) |
| $20,000 to $22,499 | 117 (4.4%) | 128 (5.2%) |
| $22,500 to $24,999 | 91 (3.4%) | 245 (10.0%) |
| $25,000 to $29,999 | 184 (6.9%) | 177 (7.2%) |
| $30,000 to $34,999 | 347 (13.0%) | 159 (6.5%) |
| $35,000 to $39,999 | 144 (5.4%) | 76 (3.1%) |
| $40,000 to $44,999 | 107 (4.0%) | 126 (5.1%) |
| $45,000 to $49,999 | 169 (6.3%) | 105 (4.3%) |
| $50,000 to $54,999 | 42 (1.6%) | 73 (3.0%) |
| $55,000 to $64,999 | 206 (7.7%) | 184 (7.5%) |
| $65,000 to $74,999 | 279 (10.4%) | 150 (6.1%) |
| $75,000 to $99,999 | 156 (5.8%) | 109 (4.4%) |
| $100,000+ | 92 (3.4%) | 72 (2.9%) |
| Total | 2,679 (100.0%) | 2,459 (100.0%) |
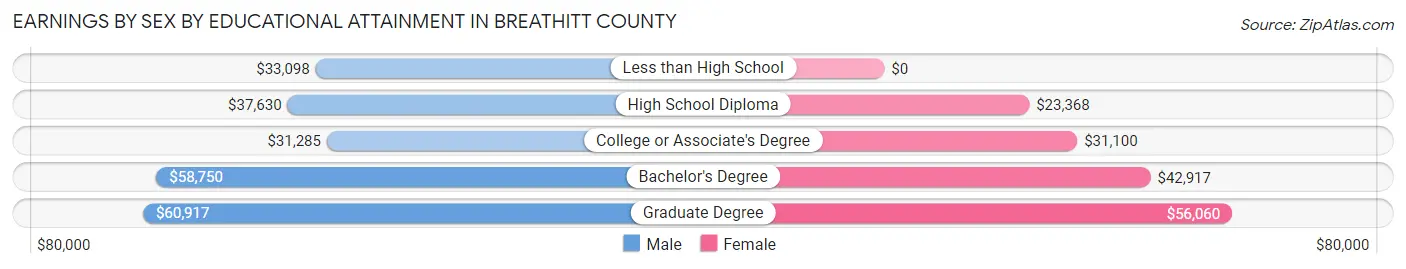
Earnings by Sex by Educational Attainment in Breathitt County
Average earnings in Breathitt County are $36,667 for men and $28,861 for women, a difference of 21.3%. Men with an educational attainment of graduate degree enjoy the highest average annual earnings of $60,917, while those with college or associate's degree education earn the least with $31,285. Women with an educational attainment of graduate degree earn the most with the average annual earnings of $56,060, while those with high school diploma education have the smallest earnings of $23,368.
| Educational Attainment | Male Income | Female Income |
| Less than High School | $33,098 | $0 |
| High School Diploma | $37,630 | $23,368 |
| College or Associate's Degree | $31,285 | $31,100 |
| Bachelor's Degree | $58,750 | $42,917 |
| Graduate Degree | $60,917 | $56,060 |
| Total | $36,667 | $28,861 |
Family Income in Breathitt County
Family Income Brackets in Breathitt County
According to the Breathitt County family income data, there are 856 families falling into the $50,000 to $74,999 income range, which is the most common income bracket and makes up 23.9% of all families. Conversely, the $200,000+ income bracket is the least frequent group with only 61 families (1.7%) belonging to this category.
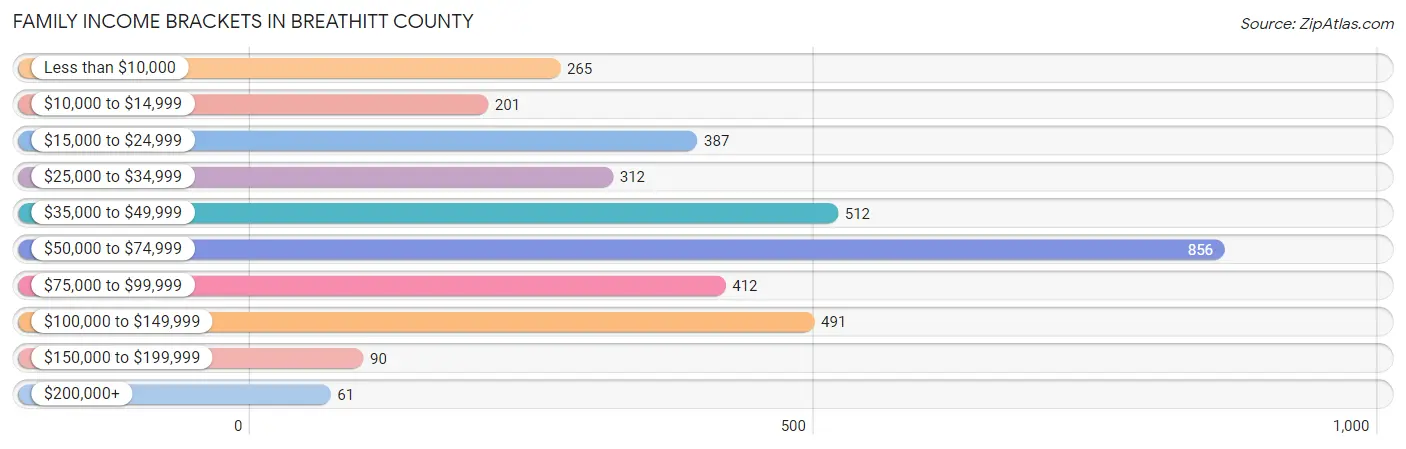
| Income Bracket | # Families | % Families |
| Less than $10,000 | 265 | 7.4% |
| $10,000 to $14,999 | 201 | 5.6% |
| $15,000 to $24,999 | 387 | 10.8% |
| $25,000 to $34,999 | 312 | 8.7% |
| $35,000 to $49,999 | 512 | 14.3% |
| $50,000 to $74,999 | 856 | 23.9% |
| $75,000 to $99,999 | 412 | 11.5% |
| $100,000 to $149,999 | 491 | 13.7% |
| $150,000 to $199,999 | 90 | 2.5% |
| $200,000+ | 61 | 1.7% |
Family Income by Famaliy Size in Breathitt County
5-person families (299 | 8.4%) account for the highest median family income in Breathitt County with $61,250 per family, while 2-person families (1,752 | 48.9%) have the highest median income of $22,622 per family member.
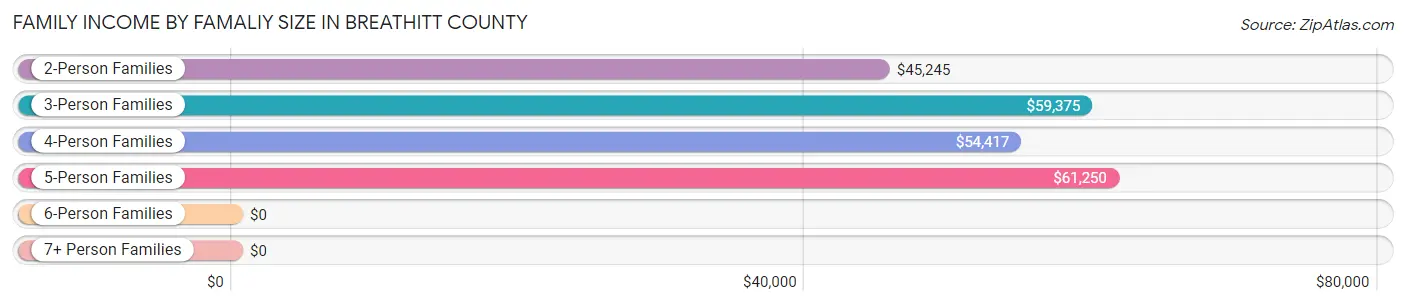
| Income Bracket | # Families | Median Income |
| 2-Person Families | 1,752 (48.9%) | $45,245 |
| 3-Person Families | 788 (22.0%) | $59,375 |
| 4-Person Families | 686 (19.2%) | $54,417 |
| 5-Person Families | 299 (8.4%) | $61,250 |
| 6-Person Families | 17 (0.5%) | $0 |
| 7+ Person Families | 40 (1.1%) | $0 |
| Total | 3,582 (100.0%) | $52,216 |
Family Income by Number of Earners in Breathitt County
The median family income in Breathitt County is $52,216, with families comprising 3+ earners (234) having the highest median family income of $78,730, while families with no earners (1,238) have the lowest median family income of $26,682, accounting for 6.5% and 34.6% of families, respectively.
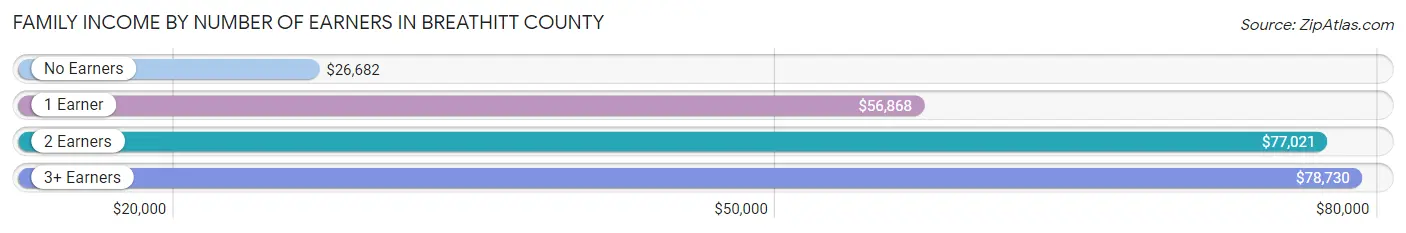
| Number of Earners | # Families | Median Income |
| No Earners | 1,238 (34.6%) | $26,682 |
| 1 Earner | 1,165 (32.5%) | $56,868 |
| 2 Earners | 945 (26.4%) | $77,021 |
| 3+ Earners | 234 (6.5%) | $78,730 |
| Total | 3,582 (100.0%) | $52,216 |
Household Income in Breathitt County
Household Income Brackets in Breathitt County
With 1,006 households falling in the category, the $50,000 to $74,999 income range is the most frequent in Breathitt County, accounting for 18.2% of all households. In contrast, only 66 households (1.2%) fall into the $200,000+ income bracket, making it the least populous group.
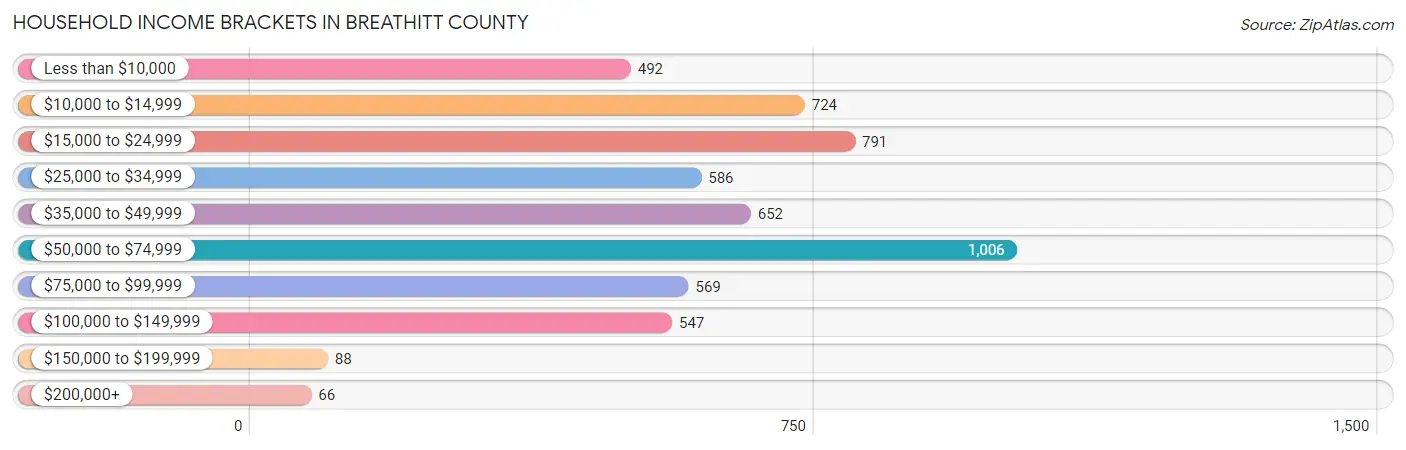
| Income Bracket | # Households | % Households |
| Less than $10,000 | 492 | 8.9% |
| $10,000 to $14,999 | 724 | 13.1% |
| $15,000 to $24,999 | 791 | 14.3% |
| $25,000 to $34,999 | 586 | 10.6% |
| $35,000 to $49,999 | 652 | 11.8% |
| $50,000 to $74,999 | 1,006 | 18.2% |
| $75,000 to $99,999 | 569 | 10.3% |
| $100,000 to $149,999 | 547 | 9.9% |
| $150,000 to $199,999 | 88 | 1.6% |
| $200,000+ | 66 | 1.2% |
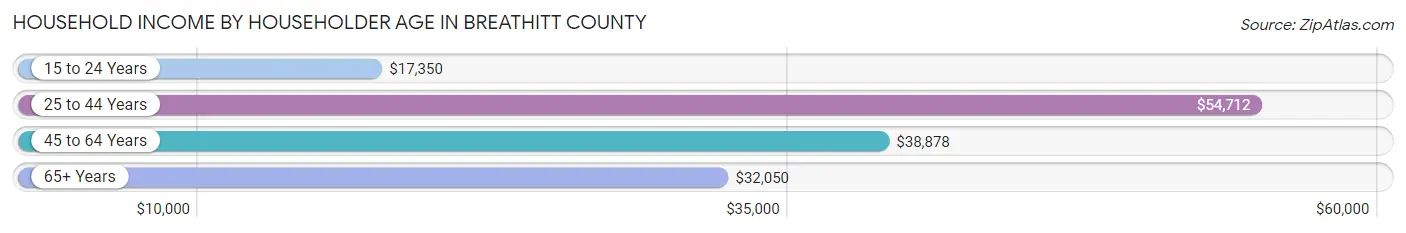
Household Income by Householder Age in Breathitt County
The median household income in Breathitt County is $38,209, with the highest median household income of $54,712 found in the 25 to 44 years age bracket for the primary householder. A total of 1,477 households (26.7%) fall into this category. Meanwhile, the 15 to 24 years age bracket for the primary householder has the lowest median household income of $17,350, with 149 households (2.7%) in this group.
| Income Bracket | # Households | Median Income |
| 15 to 24 Years | 149 (2.7%) | $17,350 |
| 25 to 44 Years | 1,477 (26.7%) | $54,712 |
| 45 to 64 Years | 2,340 (42.3%) | $38,878 |
| 65+ Years | 1,563 (28.3%) | $32,050 |
| Total | 5,529 (100.0%) | $38,209 |
Poverty in Breathitt County
Income Below Poverty by Sex and Age in Breathitt County
With 29.6% poverty level for males and 27.4% for females among the residents of Breathitt County, 18 to 24 year old males and under 5 year old females are the most vulnerable to poverty, with 335 males (61.9%) and 167 females (49.5%) in their respective age groups living below the poverty level.
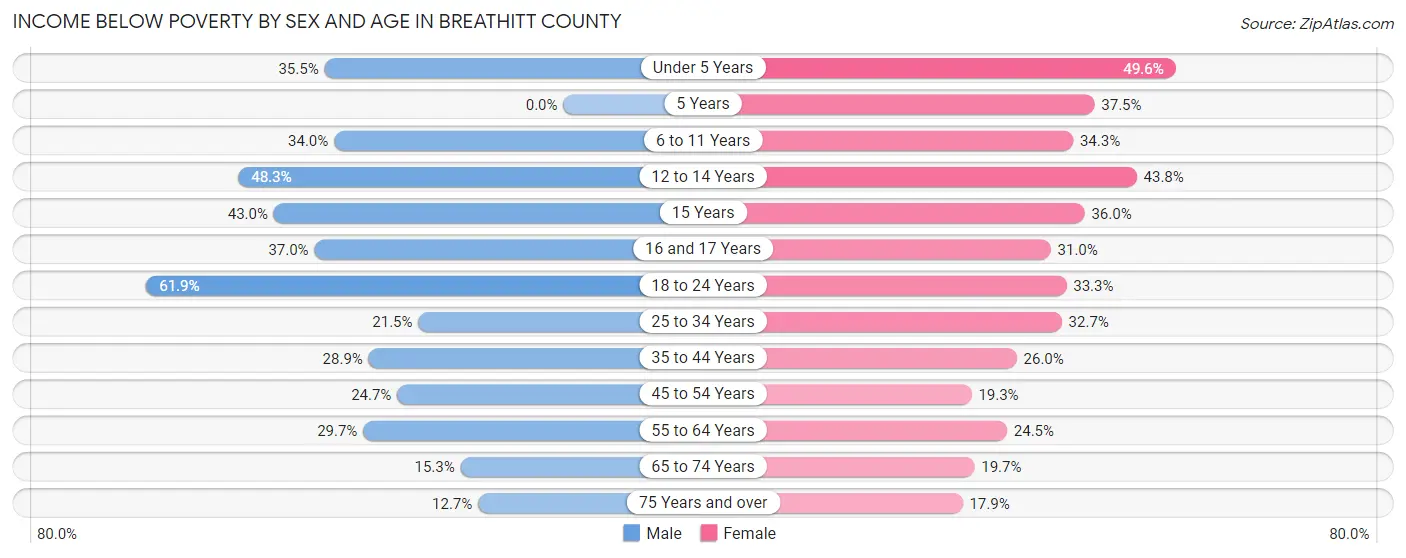
| Age Bracket | Male | Female |
| Under 5 Years | 144 (35.5%) | 167 (49.5%) |
| 5 Years | 0 (0.0%) | 18 (37.5%) |
| 6 to 11 Years | 160 (34.0%) | 126 (34.3%) |
| 12 to 14 Years | 125 (48.3%) | 109 (43.8%) |
| 15 Years | 43 (43.0%) | 40 (36.0%) |
| 16 and 17 Years | 51 (37.0%) | 40 (31.0%) |
| 18 to 24 Years | 335 (61.9%) | 147 (33.3%) |
| 25 to 34 Years | 189 (21.5%) | 256 (32.7%) |
| 35 to 44 Years | 255 (28.9%) | 222 (26.0%) |
| 45 to 54 Years | 226 (24.7%) | 180 (19.3%) |
| 55 to 64 Years | 318 (29.7%) | 249 (24.5%) |
| 65 to 74 Years | 115 (15.3%) | 160 (19.7%) |
| 75 Years and over | 40 (12.7%) | 86 (17.9%) |
| Total | 2,001 (29.6%) | 1,800 (27.4%) |
Income Above Poverty by Sex and Age in Breathitt County
According to the poverty statistics in Breathitt County, males aged 5 years and females aged 75 years and over are the age groups that are most secure financially, with 100.0% of males and 82.1% of females in these age groups living above the poverty line.
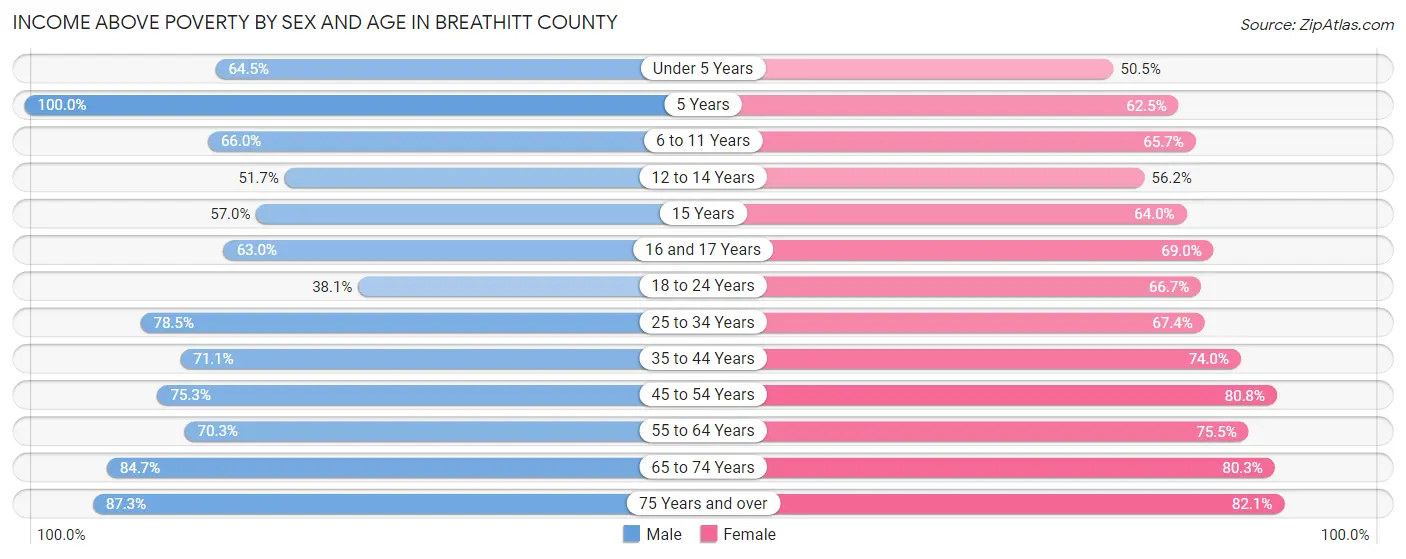
| Age Bracket | Male | Female |
| Under 5 Years | 262 (64.5%) | 170 (50.4%) |
| 5 Years | 41 (100.0%) | 30 (62.5%) |
| 6 to 11 Years | 310 (66.0%) | 241 (65.7%) |
| 12 to 14 Years | 134 (51.7%) | 140 (56.2%) |
| 15 Years | 57 (57.0%) | 71 (64.0%) |
| 16 and 17 Years | 87 (63.0%) | 89 (69.0%) |
| 18 to 24 Years | 206 (38.1%) | 294 (66.7%) |
| 25 to 34 Years | 689 (78.5%) | 528 (67.3%) |
| 35 to 44 Years | 627 (71.1%) | 633 (74.0%) |
| 45 to 54 Years | 690 (75.3%) | 755 (80.7%) |
| 55 to 64 Years | 752 (70.3%) | 767 (75.5%) |
| 65 to 74 Years | 638 (84.7%) | 653 (80.3%) |
| 75 Years and over | 276 (87.3%) | 394 (82.1%) |
| Total | 4,769 (70.4%) | 4,765 (72.6%) |
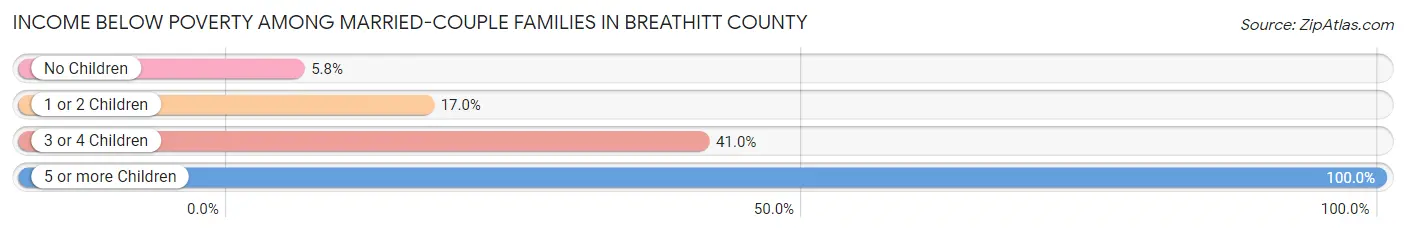
Income Below Poverty Among Married-Couple Families in Breathitt County
The poverty statistics for married-couple families in Breathitt County show that 13.0% or 331 of the total 2,538 families live below the poverty line. Families with 5 or more children have the highest poverty rate of 100.0%, comprising of 15 families. On the other hand, families with no children have the lowest poverty rate of 5.8%, which includes 80 families.
| Children | Above Poverty | Below Poverty |
| No Children | 1,308 (94.2%) | 80 (5.8%) |
| 1 or 2 Children | 794 (83.0%) | 163 (17.0%) |
| 3 or 4 Children | 105 (59.0%) | 73 (41.0%) |
| 5 or more Children | 0 (0.0%) | 15 (100.0%) |
| Total | 2,207 (87.0%) | 331 (13.0%) |
Income Below Poverty Among Single-Parent Households in Breathitt County
According to the poverty data in Breathitt County, 34.6% or 139 single-father households and 50.5% or 324 single-mother households are living below the poverty line. Among single-father households, those with 3 or 4 children have the highest poverty rate, with 22 households (100.0%) experiencing poverty. Likewise, among single-mother households, those with 3 or 4 children have the highest poverty rate, with 43 households (75.4%) falling below the poverty line.
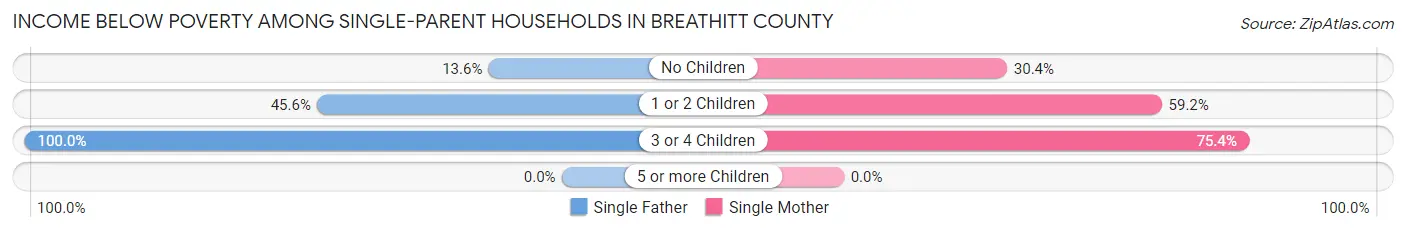
| Children | Single Father | Single Mother |
| No Children | 24 (13.6%) | 69 (30.4%) |
| 1 or 2 Children | 93 (45.6%) | 212 (59.2%) |
| 3 or 4 Children | 22 (100.0%) | 43 (75.4%) |
| 5 or more Children | 0 (0.0%) | 0 (0.0%) |
| Total | 139 (34.6%) | 324 (50.5%) |
Income Below Poverty Among Married-Couple vs Single-Parent Households in Breathitt County
The poverty data for Breathitt County shows that 331 of the married-couple family households (13.0%) and 463 of the single-parent households (44.4%) are living below the poverty level. Within the married-couple family households, those with 5 or more children have the highest poverty rate, with 15 households (100.0%) falling below the poverty line. Among the single-parent households, those with 3 or 4 children have the highest poverty rate, with 65 household (82.3%) living below poverty.

| Children | Married-Couple Families | Single-Parent Households |
| No Children | 80 (5.8%) | 93 (23.1%) |
| 1 or 2 Children | 163 (17.0%) | 305 (54.3%) |
| 3 or 4 Children | 73 (41.0%) | 65 (82.3%) |
| 5 or more Children | 15 (100.0%) | 0 (0.0%) |
| Total | 331 (13.0%) | 463 (44.4%) |
Race in Breathitt County
The most populous races in Breathitt County are White / Caucasian (13,058 | 96.2%), Two or more Races (227 | 1.7%), and Hispanic or Latino (157 | 1.2%).
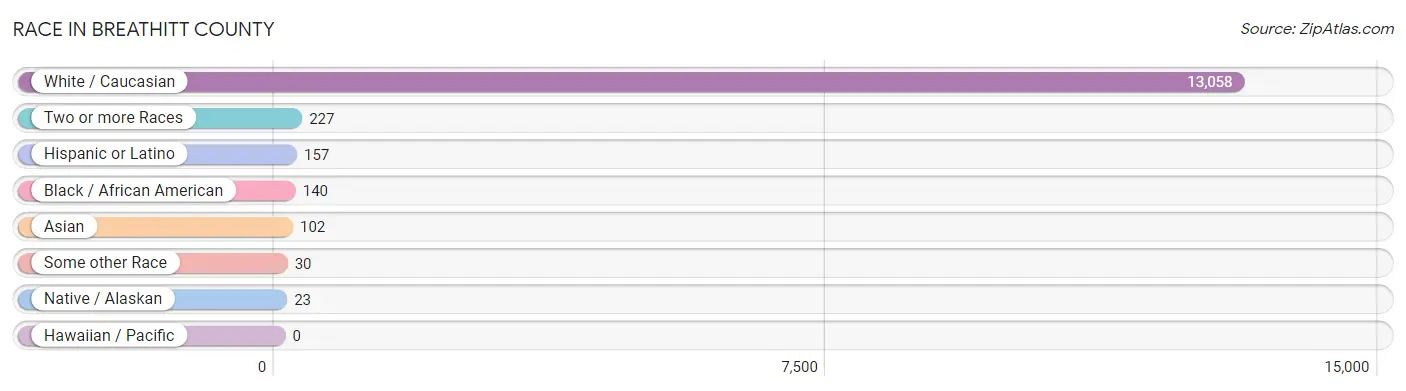
| Race | # Population | % Population |
| Asian | 102 | 0.7% |
| Black / African American | 140 | 1.0% |
| Hawaiian / Pacific | 0 | 0.0% |
| Hispanic or Latino | 157 | 1.2% |
| Native / Alaskan | 23 | 0.2% |
| White / Caucasian | 13,058 | 96.2% |
| Two or more Races | 227 | 1.7% |
| Some other Race | 30 | 0.2% |
| Total | 13,580 | 100.0% |
Ancestry in Breathitt County
The most populous ancestries reported in Breathitt County are American (5,214 | 38.4%), English (2,276 | 16.8%), German (605 | 4.5%), Irish (451 | 3.3%), and Scotch-Irish (182 | 1.3%), together accounting for 64.3% of all Breathitt County residents.
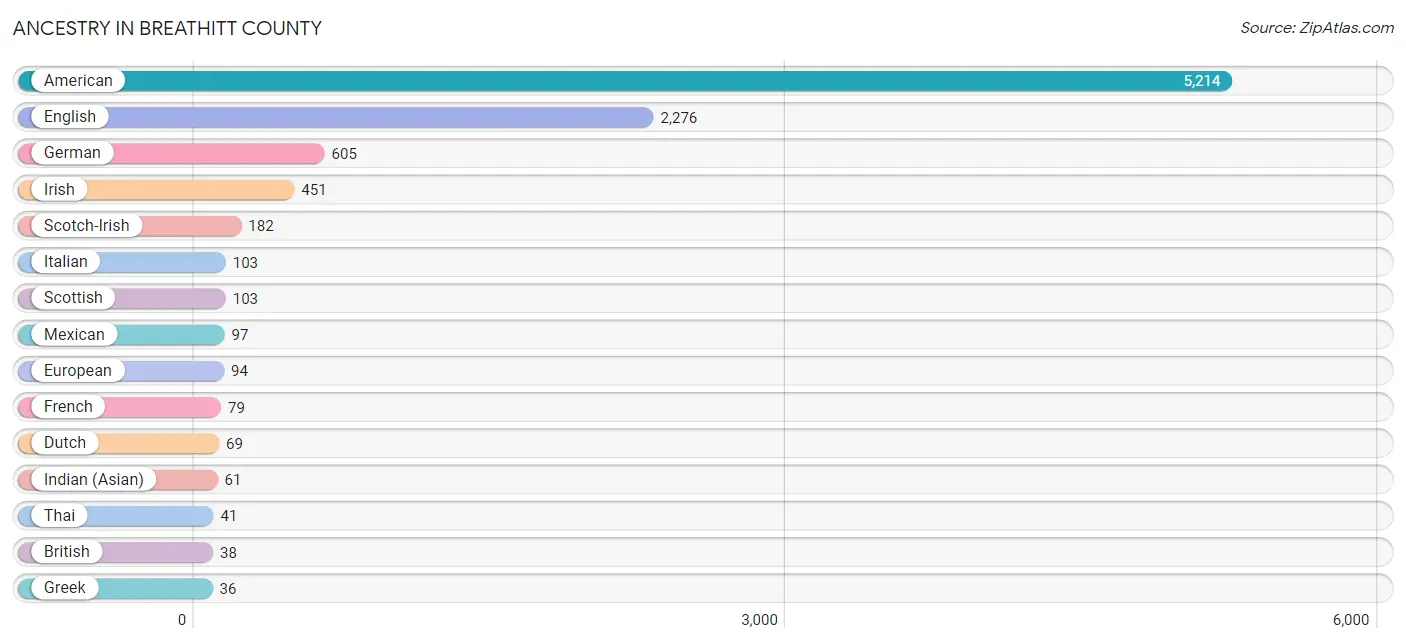
| Ancestry | # Population | % Population |
| American | 5,214 | 38.4% |
| Arab | 14 | 0.1% |
| British | 38 | 0.3% |
| Central American | 30 | 0.2% |
| Cherokee | 1 | 0.0% |
| Dutch | 69 | 0.5% |
| Eastern European | 25 | 0.2% |
| English | 2,276 | 16.8% |
| European | 94 | 0.7% |
| French | 79 | 0.6% |
| French Canadian | 11 | 0.1% |
| German | 605 | 4.5% |
| Greek | 36 | 0.3% |
| Guatemalan | 8 | 0.1% |
| Indian (Asian) | 61 | 0.4% |
| Irish | 451 | 3.3% |
| Italian | 103 | 0.8% |
| Jordanian | 14 | 0.1% |
| Mexican | 97 | 0.7% |
| Norwegian | 6 | 0.0% |
| Panamanian | 22 | 0.2% |
| Polish | 8 | 0.1% |
| Scotch-Irish | 182 | 1.3% |
| Scottish | 103 | 0.8% |
| Seminole | 1 | 0.0% |
| South American Indian | 23 | 0.2% |
| Swedish | 15 | 0.1% |
| Swiss | 5 | 0.0% |
| Thai | 41 | 0.3% |
| Ukrainian | 8 | 0.1% |
| Welsh | 24 | 0.2% | View All 31 Rows |
Immigrants in Breathitt County
The most numerous immigrant groups reported in Breathitt County came from Asia (106 | 0.8%), China (51 | 0.4%), Eastern Asia (51 | 0.4%), India (41 | 0.3%), and South Central Asia (41 | 0.3%), together accounting for 2.1% of all Breathitt County residents.
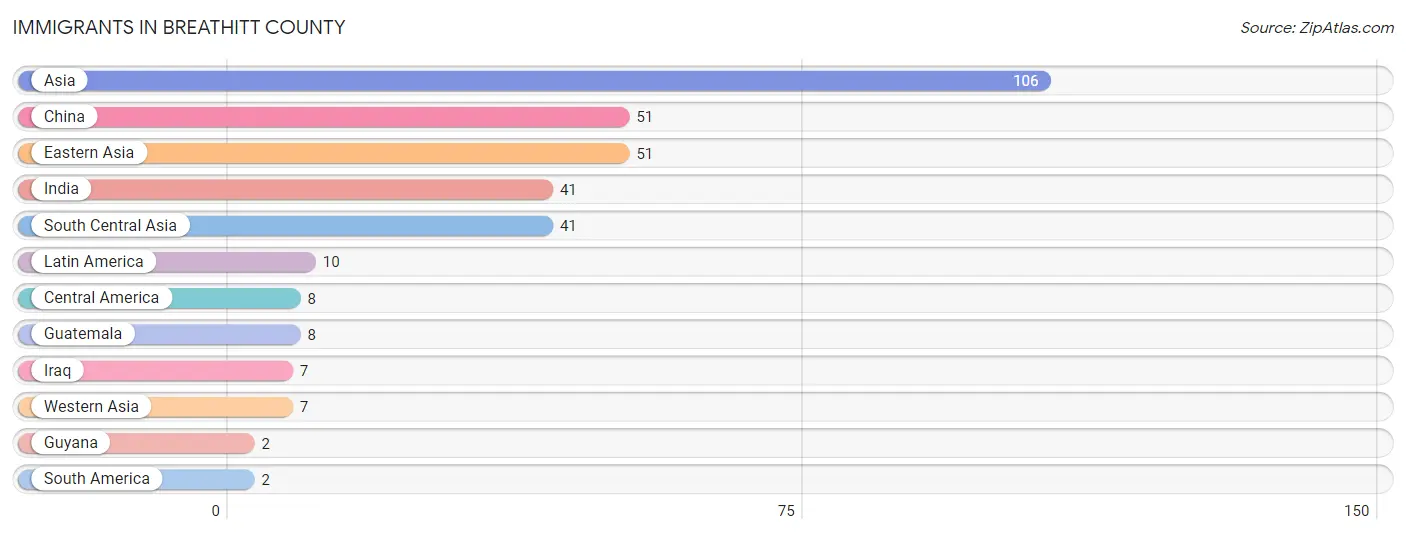
| Immigration Origin | # Population | % Population |
| Asia | 106 | 0.8% |
| Central America | 8 | 0.1% |
| China | 51 | 0.4% |
| Eastern Asia | 51 | 0.4% |
| Guatemala | 8 | 0.1% |
| Guyana | 2 | 0.0% |
| India | 41 | 0.3% |
| Iraq | 7 | 0.1% |
| Latin America | 10 | 0.1% |
| South America | 2 | 0.0% |
| South Central Asia | 41 | 0.3% |
| Western Asia | 7 | 0.1% | View All 12 Rows |
Sex and Age in Breathitt County
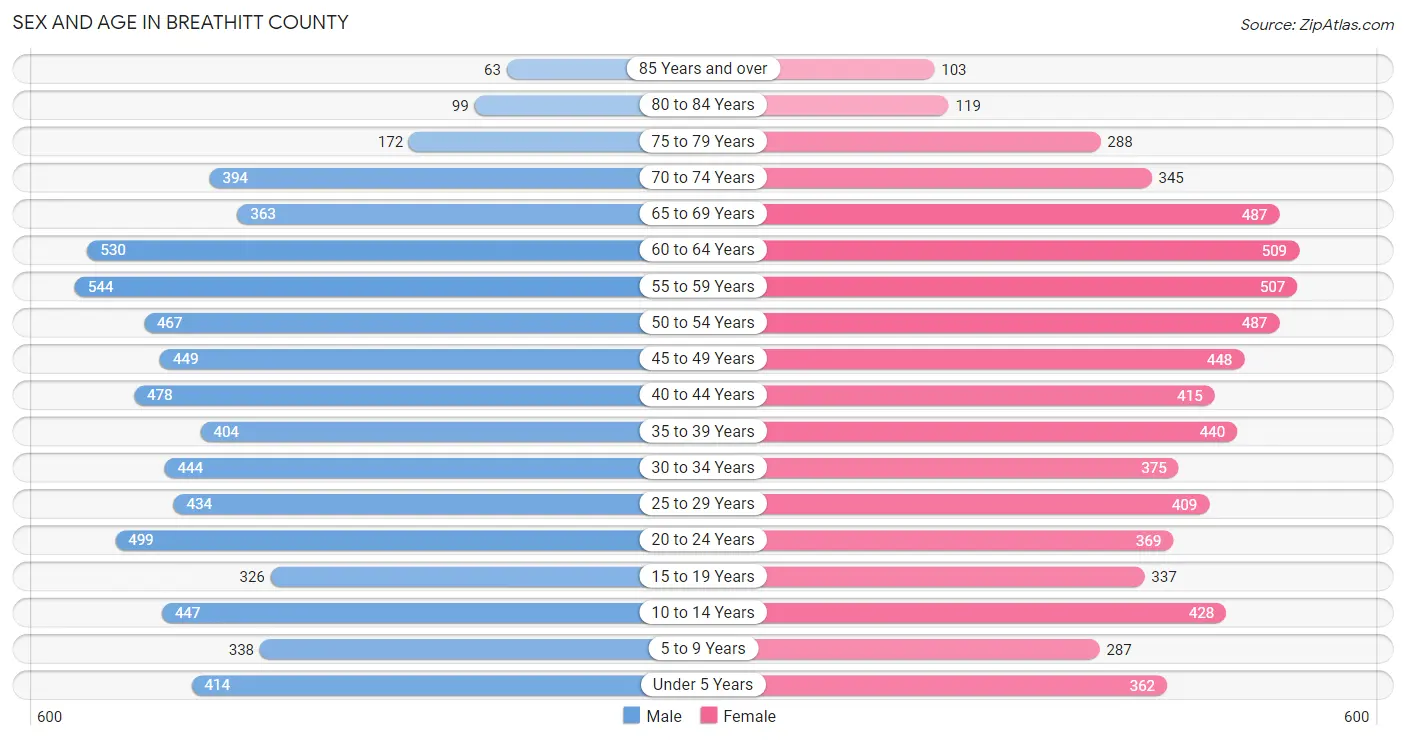
Sex and Age in Breathitt County
The most populous age groups in Breathitt County are 55 to 59 Years (544 | 7.9%) for men and 60 to 64 Years (509 | 7.6%) for women.
| Age Bracket | Male | Female |
| Under 5 Years | 414 (6.0%) | 362 (5.4%) |
| 5 to 9 Years | 338 (4.9%) | 287 (4.3%) |
| 10 to 14 Years | 447 (6.5%) | 428 (6.4%) |
| 15 to 19 Years | 326 (4.8%) | 337 (5.0%) |
| 20 to 24 Years | 499 (7.3%) | 369 (5.5%) |
| 25 to 29 Years | 434 (6.3%) | 409 (6.1%) |
| 30 to 34 Years | 444 (6.5%) | 375 (5.6%) |
| 35 to 39 Years | 404 (5.9%) | 440 (6.6%) |
| 40 to 44 Years | 478 (7.0%) | 415 (6.2%) |
| 45 to 49 Years | 449 (6.5%) | 448 (6.7%) |
| 50 to 54 Years | 467 (6.8%) | 487 (7.2%) |
| 55 to 59 Years | 544 (7.9%) | 507 (7.5%) |
| 60 to 64 Years | 530 (7.7%) | 509 (7.6%) |
| 65 to 69 Years | 363 (5.3%) | 487 (7.2%) |
| 70 to 74 Years | 394 (5.7%) | 345 (5.1%) |
| 75 to 79 Years | 172 (2.5%) | 288 (4.3%) |
| 80 to 84 Years | 99 (1.4%) | 119 (1.8%) |
| 85 Years and over | 63 (0.9%) | 103 (1.5%) |
| Total | 6,865 (100.0%) | 6,715 (100.0%) |
Families and Households in Breathitt County
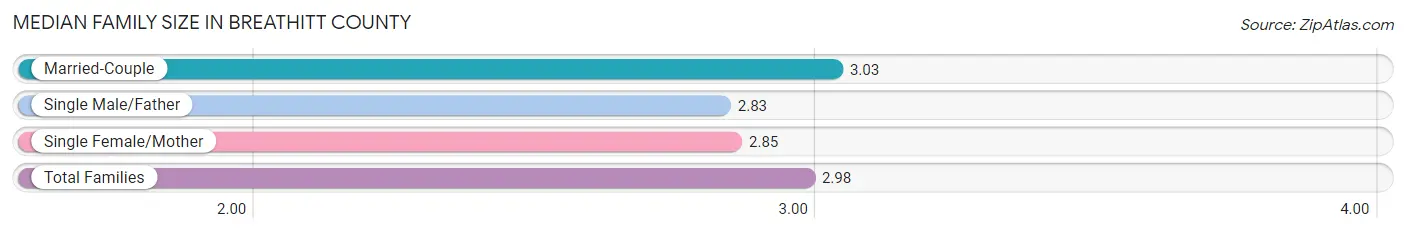
Median Family Size in Breathitt County
The median family size in Breathitt County is 2.98 persons per family, with married-couple families (2,538 | 70.9%) accounting for the largest median family size of 3.03 persons per family. On the other hand, single male/father families (402 | 11.2%) represent the smallest median family size with 2.83 persons per family.
| Family Type | # Families | Family Size |
| Married-Couple | 2,538 (70.9%) | 3.03 |
| Single Male/Father | 402 (11.2%) | 2.83 |
| Single Female/Mother | 642 (17.9%) | 2.85 |
| Total Families | 3,582 (100.0%) | 2.98 |
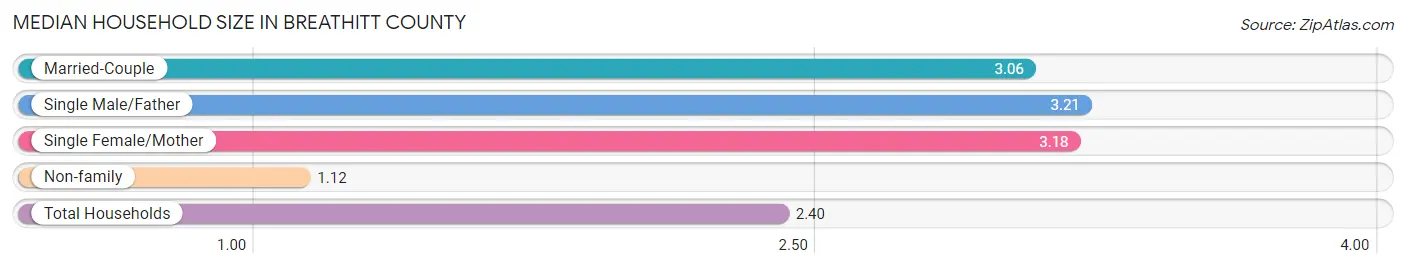
Median Household Size in Breathitt County
The median household size in Breathitt County is 2.40 persons per household, with single male/father households (402 | 7.3%) accounting for the largest median household size of 3.21 persons per household. non-family households (1,947 | 35.2%) represent the smallest median household size with 1.12 persons per household.
| Household Type | # Households | Household Size |
| Married-Couple | 2,538 (45.9%) | 3.06 |
| Single Male/Father | 402 (7.3%) | 3.21 |
| Single Female/Mother | 642 (11.6%) | 3.18 |
| Non-family | 1,947 (35.2%) | 1.12 |
| Total Households | 5,529 (100.0%) | 2.40 |
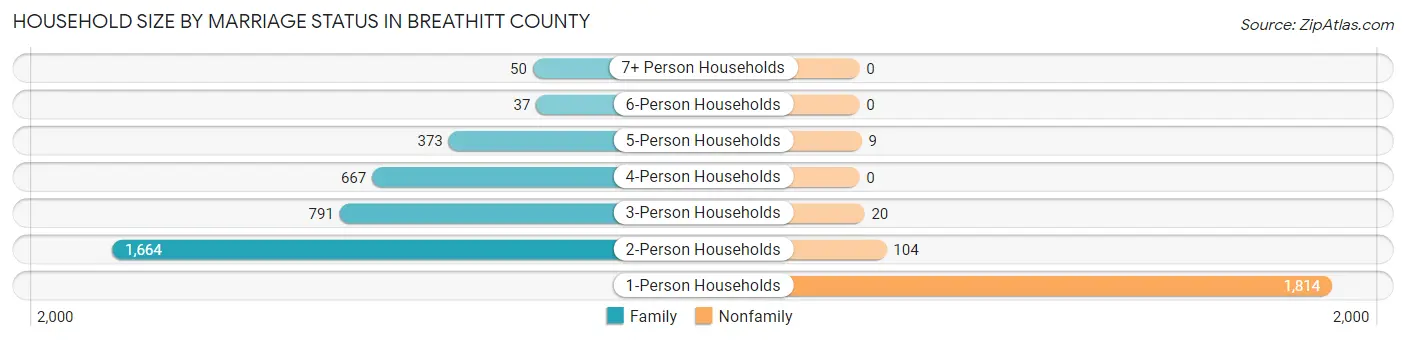
Household Size by Marriage Status in Breathitt County
Out of a total of 5,529 households in Breathitt County, 3,582 (64.8%) are family households, while 1,947 (35.2%) are nonfamily households. The most numerous type of family households are 2-person households, comprising 1,664, and the most common type of nonfamily households are 1-person households, comprising 1,814.
| Household Size | Family Households | Nonfamily Households |
| 1-Person Households | - | 1,814 (32.8%) |
| 2-Person Households | 1,664 (30.1%) | 104 (1.9%) |
| 3-Person Households | 791 (14.3%) | 20 (0.4%) |
| 4-Person Households | 667 (12.1%) | 0 (0.0%) |
| 5-Person Households | 373 (6.8%) | 9 (0.2%) |
| 6-Person Households | 37 (0.7%) | 0 (0.0%) |
| 7+ Person Households | 50 (0.9%) | 0 (0.0%) |
| Total | 3,582 (64.8%) | 1,947 (35.2%) |
Female Fertility in Breathitt County
Fertility by Age in Breathitt County
Average fertility rate in Breathitt County is 63.0 births per 1,000 women. Women in the age bracket of 20 to 34 years have the highest fertility rate with 137.0 births per 1,000 women. Women in the age bracket of 20 to 34 years acount for 85.9% of all women with births.
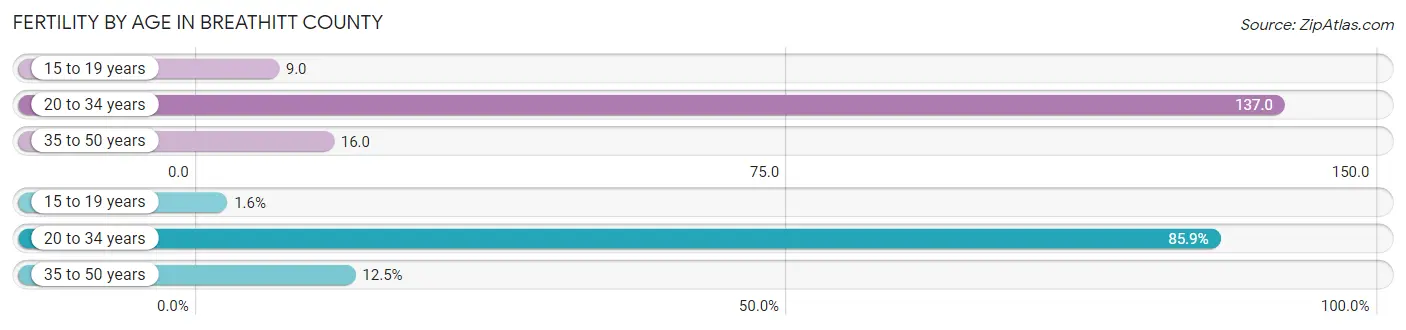
| Age Bracket | Women with Births | Births / 1,000 Women |
| 15 to 19 years | 3 (1.6%) | 9.0 |
| 20 to 34 years | 158 (85.9%) | 137.0 |
| 35 to 50 years | 23 (12.5%) | 16.0 |
| Total | 184 (100.0%) | 63.0 |
Fertility by Age by Marriage Status in Breathitt County
64.7% of women with births (184) in Breathitt County are married. The highest percentage of unmarried women with births falls into 15 to 19 years age bracket with 100.0% of them unmarried at the time of birth, while the lowest percentage of unmarried women with births belong to 35 to 50 years age bracket with 0.0% of them unmarried.
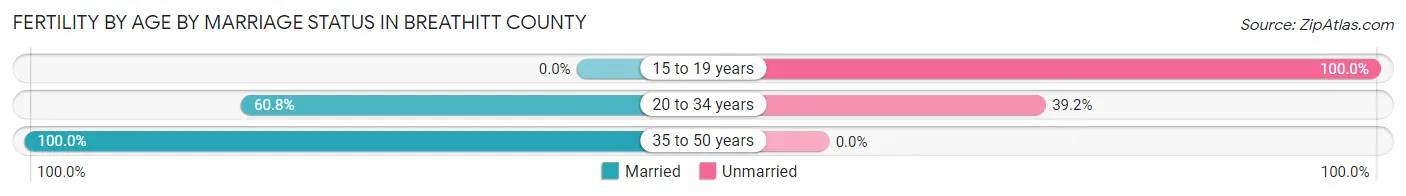
| Age Bracket | Married | Unmarried |
| 15 to 19 years | 0 (0.0%) | 3 (100.0%) |
| 20 to 34 years | 96 (60.8%) | 62 (39.2%) |
| 35 to 50 years | 23 (100.0%) | 0 (0.0%) |
| Total | 119 (64.7%) | 65 (35.3%) |
Fertility by Education in Breathitt County
Average fertility rate in Breathitt County is 63.0 births per 1,000 women. Women with the education attainment of college or associate's degree have the highest fertility rate of 86.0 births per 1,000 women, while women with the education attainment of less than high school have the lowest fertility at 8.0 births per 1,000 women. Women with the education attainment of college or associate's degree represent 46.7% of all women with births.
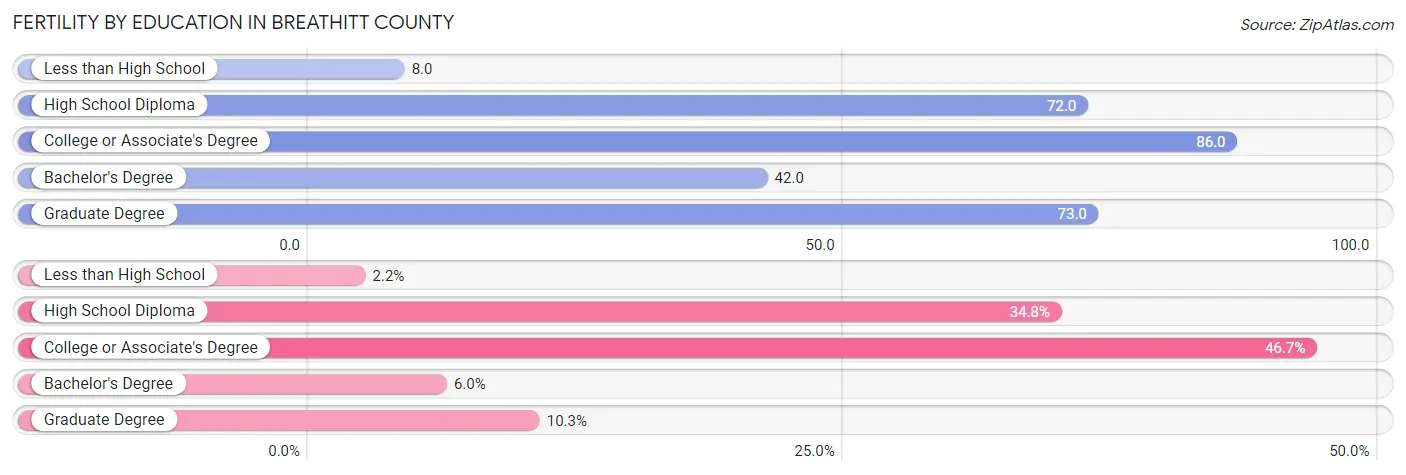
| Educational Attainment | Women with Births | Births / 1,000 Women |
| Less than High School | 4 (2.2%) | 8.0 |
| High School Diploma | 64 (34.8%) | 72.0 |
| College or Associate's Degree | 86 (46.7%) | 86.0 |
| Bachelor's Degree | 11 (6.0%) | 42.0 |
| Graduate Degree | 19 (10.3%) | 73.0 |
| Total | 184 (100.0%) | 63.0 |
Fertility by Education by Marriage Status in Breathitt County
35.3% of women with births in Breathitt County are unmarried. Women with the educational attainment of less than high school are most likely to be married with 100.0% of them married at childbirth, while women with the educational attainment of high school diploma are least likely to be married with 51.6% of them unmarried at childbirth.
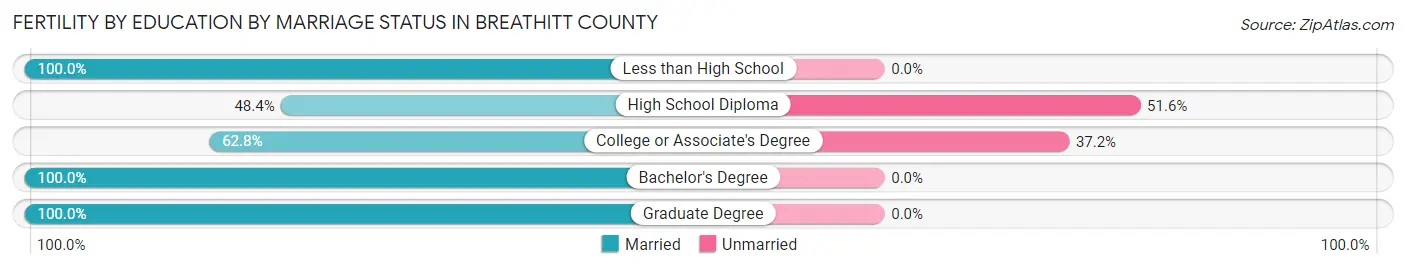
| Educational Attainment | Married | Unmarried |
| Less than High School | 4 (100.0%) | 0 (0.0%) |
| High School Diploma | 31 (48.4%) | 33 (51.6%) |
| College or Associate's Degree | 54 (62.8%) | 32 (37.2%) |
| Bachelor's Degree | 11 (100.0%) | 0 (0.0%) |
| Graduate Degree | 19 (100.0%) | 0 (0.0%) |
| Total | 119 (64.7%) | 65 (35.3%) |
Employment Characteristics in Breathitt County
Employment by Class of Employer in Breathitt County
Among the 4,508 employed individuals in Breathitt County, private company employees (2,682 | 59.5%), local government employees (606 | 13.4%), and state government employees (526 | 11.7%) make up the most common classes of employment.
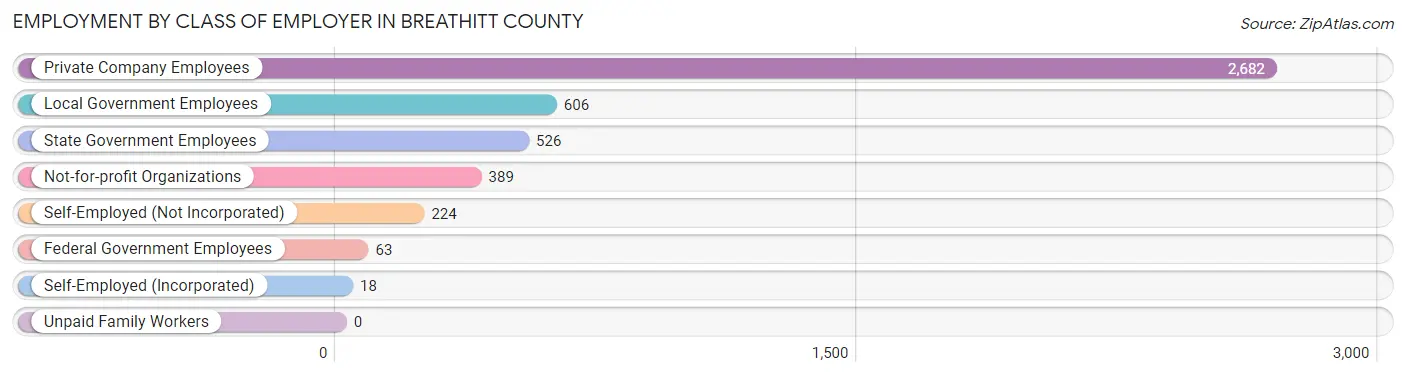
| Employer Class | # Employees | % Employees |
| Private Company Employees | 2,682 | 59.5% |
| Self-Employed (Incorporated) | 18 | 0.4% |
| Self-Employed (Not Incorporated) | 224 | 5.0% |
| Not-for-profit Organizations | 389 | 8.6% |
| Local Government Employees | 606 | 13.4% |
| State Government Employees | 526 | 11.7% |
| Federal Government Employees | 63 | 1.4% |
| Unpaid Family Workers | 0 | 0.0% |
| Total | 4,508 | 100.0% |
Employment Status by Age in Breathitt County
According to the labor force statistics for Breathitt County, out of the total population over 16 years of age (11,087), 45.1% or 5,000 individuals are in the labor force, with 8.9% or 445 of them unemployed. The age group with the highest labor force participation rate is 20 to 24 years, with 72.9% or 633 individuals in the labor force. Within the labor force, the 16 to 19 years age range has the highest percentage of unemployed individuals, with 55.0% or 55 of them being unemployed.
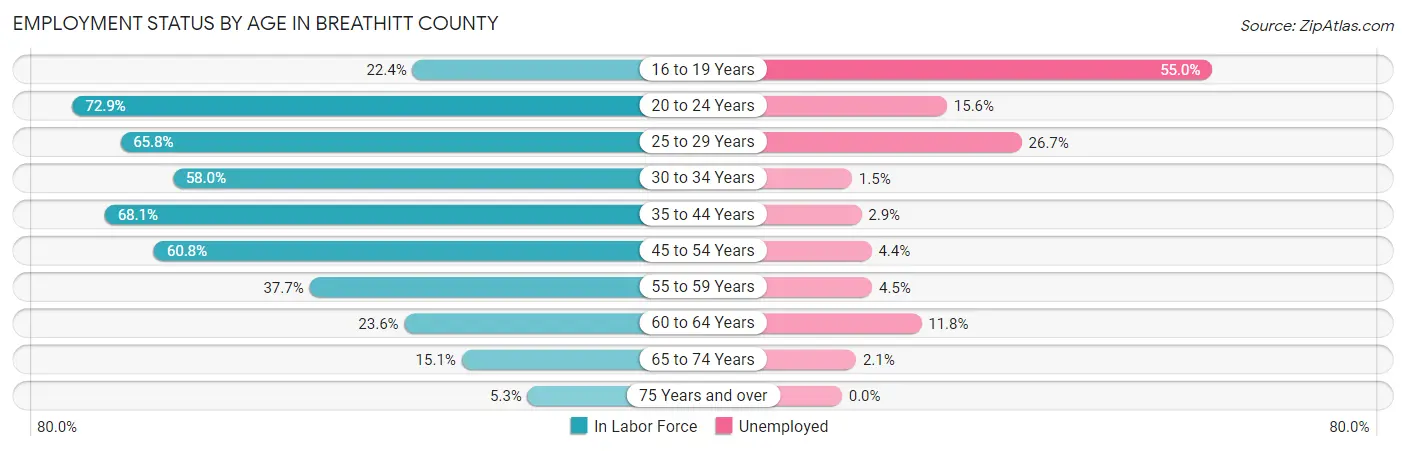
| Age Bracket | In Labor Force | Unemployed |
| 16 to 19 Years | 100 (22.4%) | 55 (55.0%) |
| 20 to 24 Years | 633 (72.9%) | 99 (15.6%) |
| 25 to 29 Years | 555 (65.8%) | 148 (26.7%) |
| 30 to 34 Years | 475 (58.0%) | 7 (1.5%) |
| 35 to 44 Years | 1,183 (68.1%) | 34 (2.9%) |
| 45 to 54 Years | 1,125 (60.8%) | 50 (4.4%) |
| 55 to 59 Years | 396 (37.7%) | 18 (4.5%) |
| 60 to 64 Years | 245 (23.6%) | 29 (11.8%) |
| 65 to 74 Years | 240 (15.1%) | 5 (2.1%) |
| 75 Years and over | 45 (5.3%) | 0 (0.0%) |
| Total | 5,000 (45.1%) | 445 (8.9%) |
Employment Status by Educational Attainment in Breathitt County
According to labor force statistics for Breathitt County, 54.2% of individuals (3,978) out of the total population between 25 and 64 years of age (7,340) are in the labor force, with 7.2% or 286 of them being unemployed. The group with the highest labor force participation rate are those with the educational attainment of bachelor's degree or higher, with 82.8% or 977 individuals in the labor force. Within the labor force, individuals with less than high school education have the highest percentage of unemployment, with 14.8% or 58 of them being unemployed.
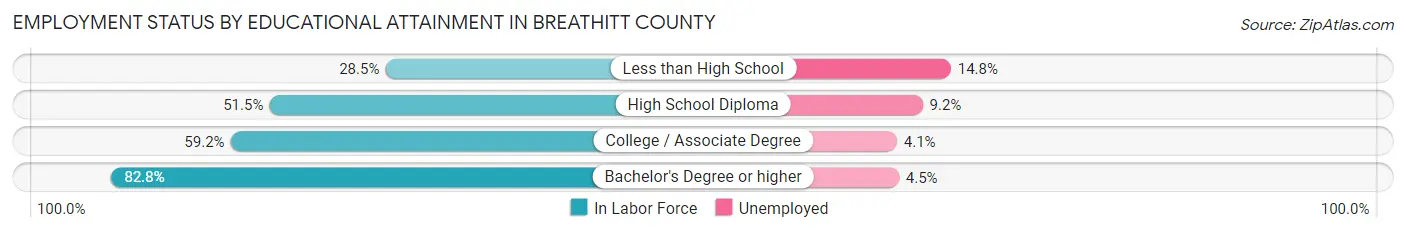
| Educational Attainment | In Labor Force | Unemployed |
| Less than High School | 393 (28.5%) | 204 (14.8%) |
| High School Diploma | 1,492 (51.5%) | 267 (9.2%) |
| College / Associate Degree | 1,116 (59.2%) | 77 (4.1%) |
| Bachelor's Degree or higher | 977 (82.8%) | 53 (4.5%) |
| Total | 3,978 (54.2%) | 528 (7.2%) |
Employment Occupations by Sex in Breathitt County
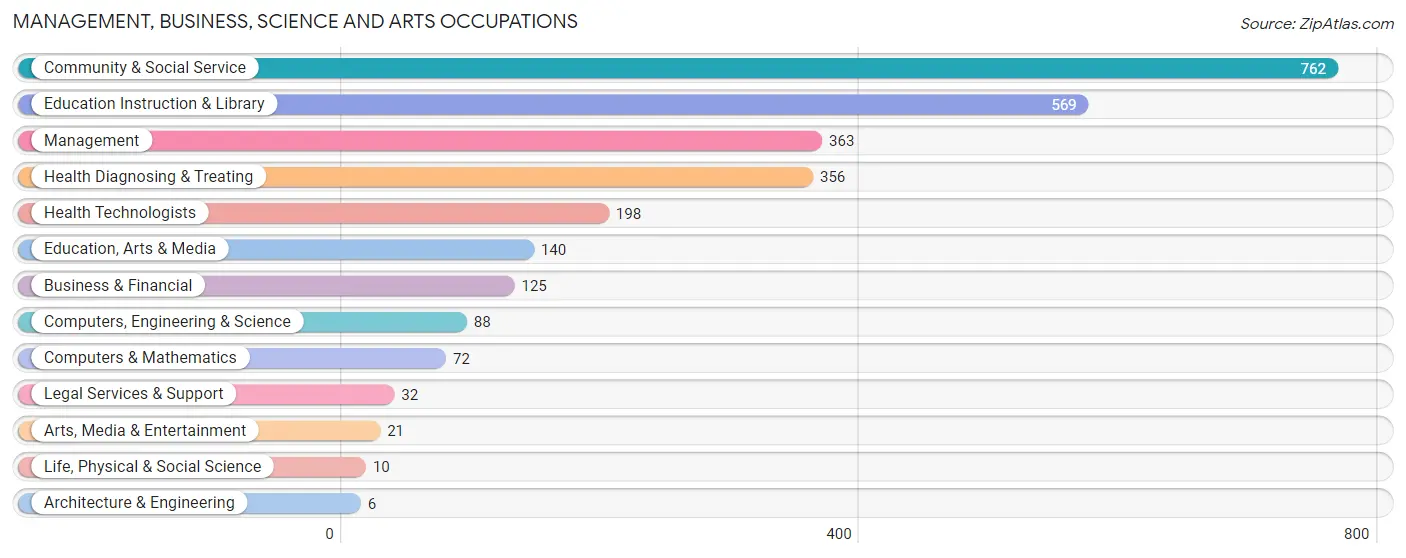
Management, Business, Science and Arts Occupations
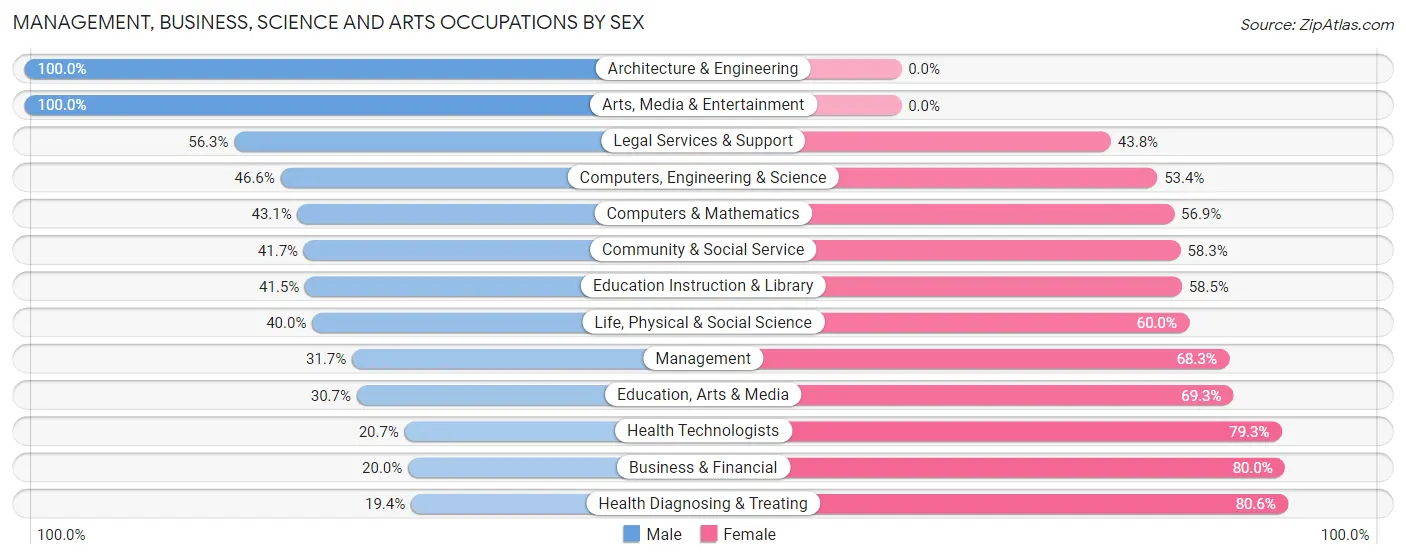
The most common Management, Business, Science and Arts occupations in Breathitt County are Community & Social Service (762 | 16.7%), Education Instruction & Library (569 | 12.5%), Management (363 | 8.0%), Health Diagnosing & Treating (356 | 7.8%), and Health Technologists (198 | 4.3%).
Management, Business, Science and Arts Occupations by Sex
Within the Management, Business, Science and Arts occupations in Breathitt County, the most male-oriented occupations are Architecture & Engineering (100.0%), Arts, Media & Entertainment (100.0%), and Legal Services & Support (56.2%), while the most female-oriented occupations are Health Diagnosing & Treating (80.6%), Business & Financial (80.0%), and Health Technologists (79.3%).
| Occupation | Male | Female |
| Management | 115 (31.7%) | 248 (68.3%) |
| Business & Financial | 25 (20.0%) | 100 (80.0%) |
| Computers, Engineering & Science | 41 (46.6%) | 47 (53.4%) |
| Computers & Mathematics | 31 (43.1%) | 41 (56.9%) |
| Architecture & Engineering | 6 (100.0%) | 0 (0.0%) |
| Life, Physical & Social Science | 4 (40.0%) | 6 (60.0%) |
| Community & Social Service | 318 (41.7%) | 444 (58.3%) |
| Education, Arts & Media | 43 (30.7%) | 97 (69.3%) |
| Legal Services & Support | 18 (56.2%) | 14 (43.8%) |
| Education Instruction & Library | 236 (41.5%) | 333 (58.5%) |
| Arts, Media & Entertainment | 21 (100.0%) | 0 (0.0%) |
| Health Diagnosing & Treating | 69 (19.4%) | 287 (80.6%) |
| Health Technologists | 41 (20.7%) | 157 (79.3%) |
| Total (Category) | 568 (33.5%) | 1,126 (66.5%) |
| Total (Overall) | 2,374 (52.1%) | 2,179 (47.9%) |
Services Occupations
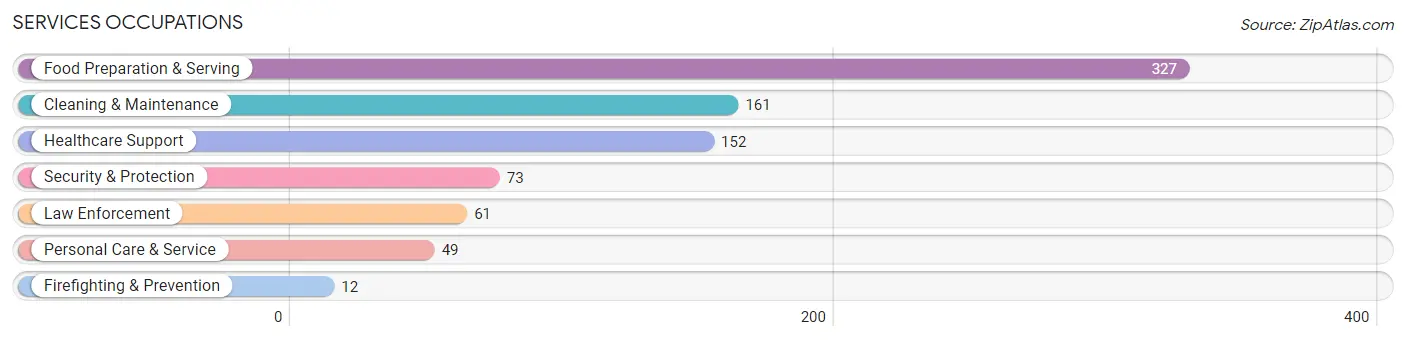
The most common Services occupations in Breathitt County are Food Preparation & Serving (327 | 7.2%), Cleaning & Maintenance (161 | 3.5%), Healthcare Support (152 | 3.3%), Security & Protection (73 | 1.6%), and Law Enforcement (61 | 1.3%).
Services Occupations by Sex
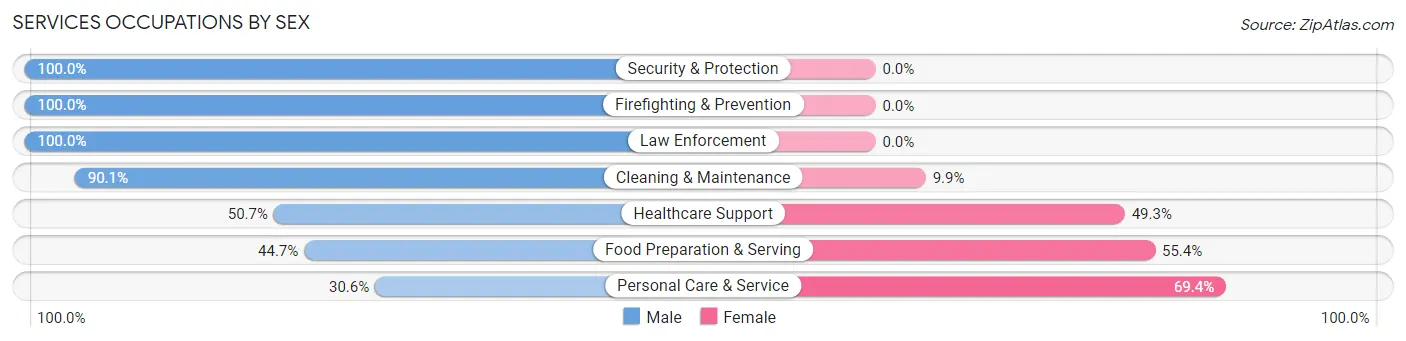
Within the Services occupations in Breathitt County, the most male-oriented occupations are Security & Protection (100.0%), Firefighting & Prevention (100.0%), and Law Enforcement (100.0%), while the most female-oriented occupations are Personal Care & Service (69.4%), Food Preparation & Serving (55.3%), and Healthcare Support (49.3%).
| Occupation | Male | Female |
| Healthcare Support | 77 (50.7%) | 75 (49.3%) |
| Security & Protection | 73 (100.0%) | 0 (0.0%) |
| Firefighting & Prevention | 12 (100.0%) | 0 (0.0%) |
| Law Enforcement | 61 (100.0%) | 0 (0.0%) |
| Food Preparation & Serving | 146 (44.7%) | 181 (55.3%) |
| Cleaning & Maintenance | 145 (90.1%) | 16 (9.9%) |
| Personal Care & Service | 15 (30.6%) | 34 (69.4%) |
| Total (Category) | 456 (59.8%) | 306 (40.2%) |
| Total (Overall) | 2,374 (52.1%) | 2,179 (47.9%) |
Sales and Office Occupations
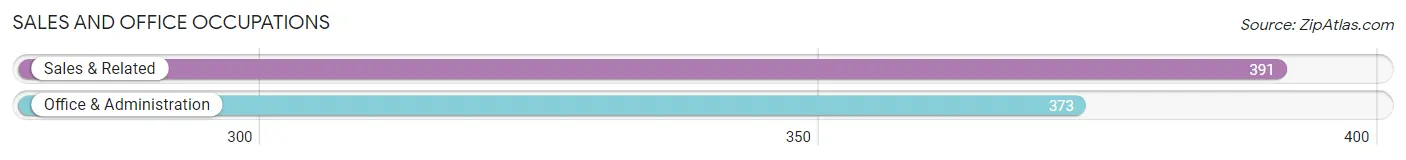
The most common Sales and Office occupations in Breathitt County are Sales & Related (391 | 8.6%), and Office & Administration (373 | 8.2%).
Sales and Office Occupations by Sex
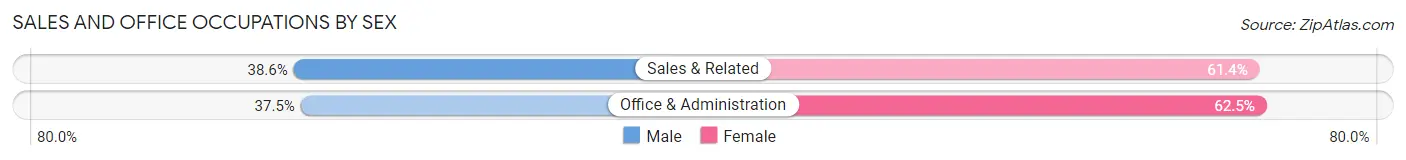
| Occupation | Male | Female |
| Sales & Related | 151 (38.6%) | 240 (61.4%) |
| Office & Administration | 140 (37.5%) | 233 (62.5%) |
| Total (Category) | 291 (38.1%) | 473 (61.9%) |
| Total (Overall) | 2,374 (52.1%) | 2,179 (47.9%) |
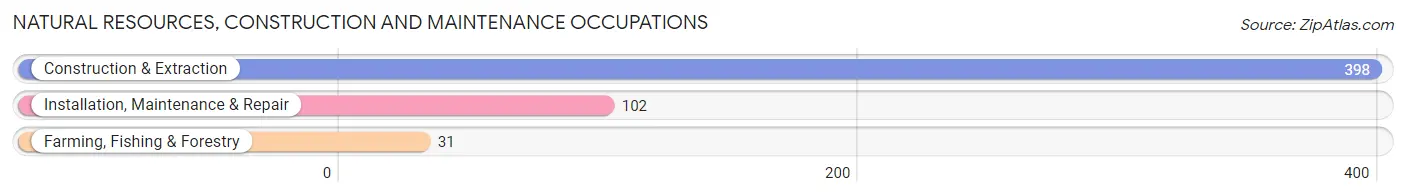
Natural Resources, Construction and Maintenance Occupations
The most common Natural Resources, Construction and Maintenance occupations in Breathitt County are Construction & Extraction (398 | 8.7%), Installation, Maintenance & Repair (102 | 2.2%), and Farming, Fishing & Forestry (31 | 0.7%).
Natural Resources, Construction and Maintenance Occupations by Sex
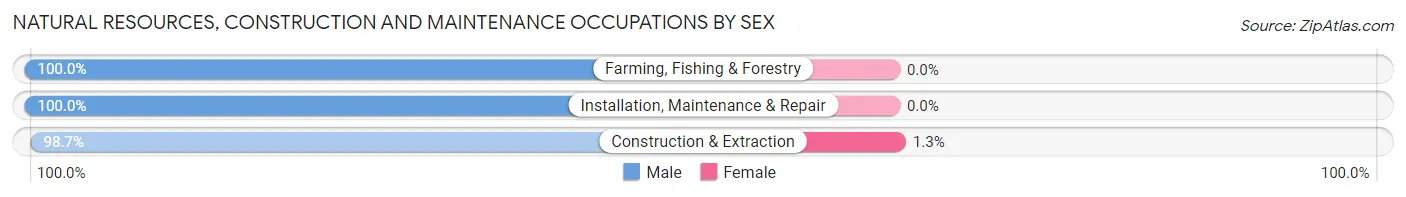
| Occupation | Male | Female |
| Farming, Fishing & Forestry | 31 (100.0%) | 0 (0.0%) |
| Construction & Extraction | 393 (98.7%) | 5 (1.3%) |
| Installation, Maintenance & Repair | 102 (100.0%) | 0 (0.0%) |
| Total (Category) | 526 (99.1%) | 5 (0.9%) |
| Total (Overall) | 2,374 (52.1%) | 2,179 (47.9%) |
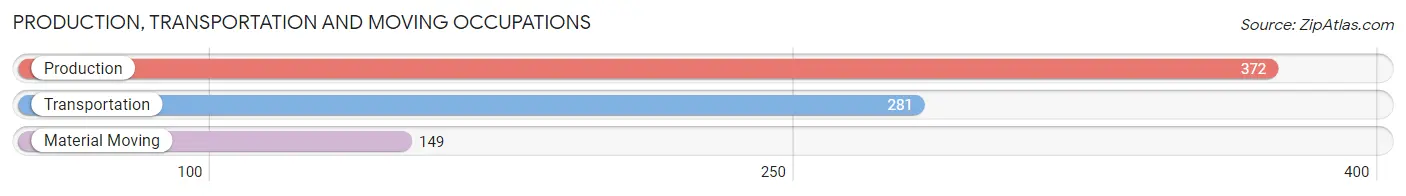
Production, Transportation and Moving Occupations
The most common Production, Transportation and Moving occupations in Breathitt County are Production (372 | 8.2%), Transportation (281 | 6.2%), and Material Moving (149 | 3.3%).
Production, Transportation and Moving Occupations by Sex
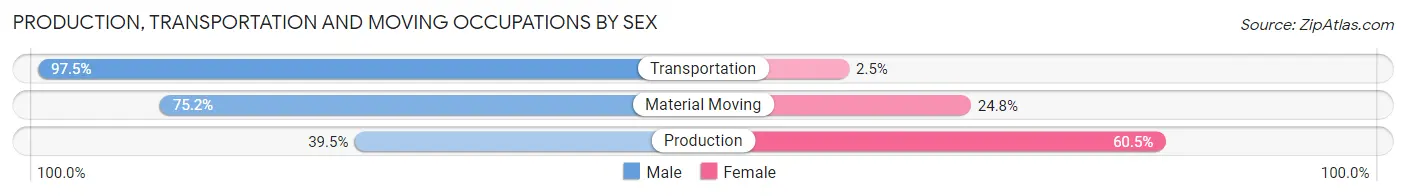
| Occupation | Male | Female |
| Production | 147 (39.5%) | 225 (60.5%) |
| Transportation | 274 (97.5%) | 7 (2.5%) |
| Material Moving | 112 (75.2%) | 37 (24.8%) |
| Total (Category) | 533 (66.5%) | 269 (33.5%) |
| Total (Overall) | 2,374 (52.1%) | 2,179 (47.9%) |
Employment Industries by Sex in Breathitt County
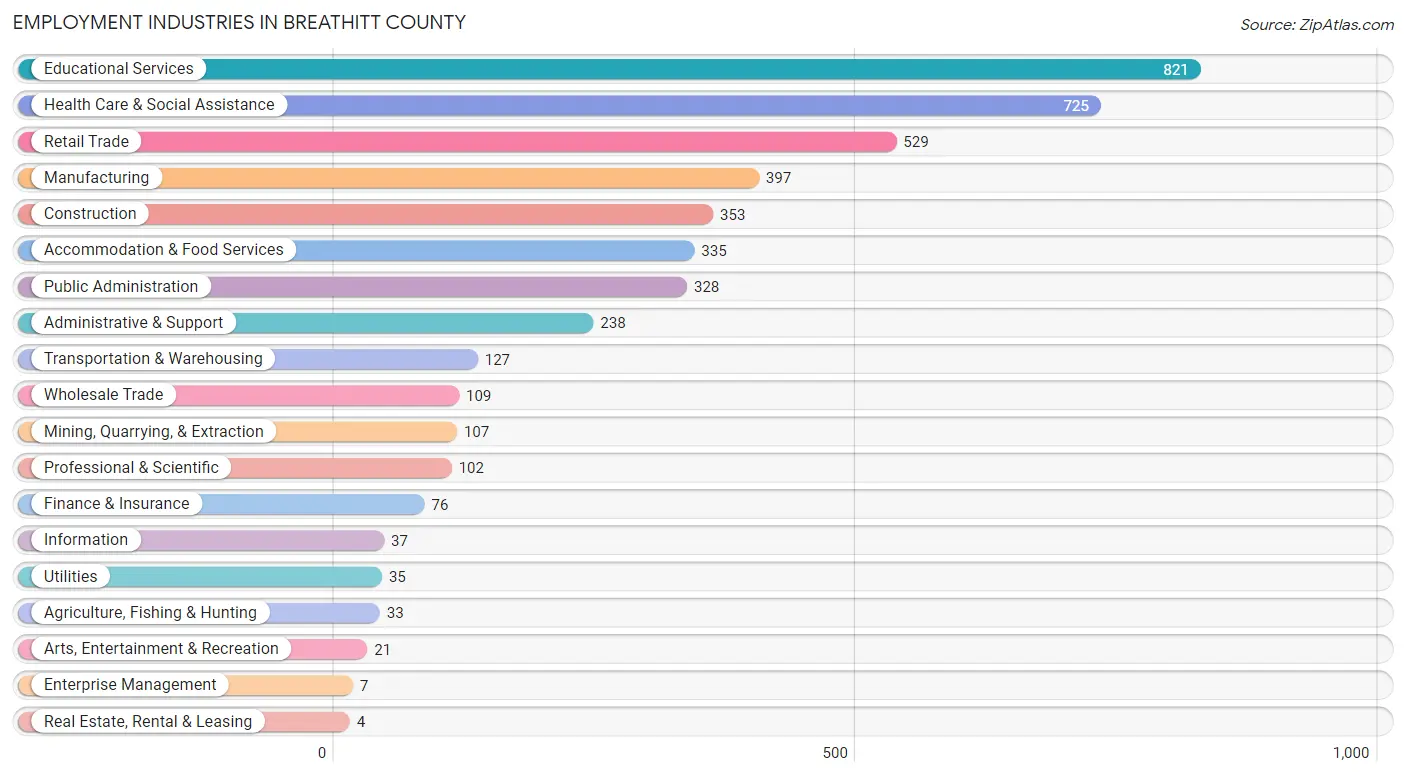
Employment Industries in Breathitt County
The major employment industries in Breathitt County include Educational Services (821 | 18.0%), Health Care & Social Assistance (725 | 15.9%), Retail Trade (529 | 11.6%), Manufacturing (397 | 8.7%), and Construction (353 | 7.7%).
Employment Industries by Sex in Breathitt County
The Breathitt County industries that see more men than women are Agriculture, Fishing & Hunting (100.0%), Enterprise Management (100.0%), and Construction (98.6%), whereas the industries that tend to have a higher number of women are Real Estate, Rental & Leasing (100.0%), Arts, Entertainment & Recreation (85.7%), and Information (73.0%).
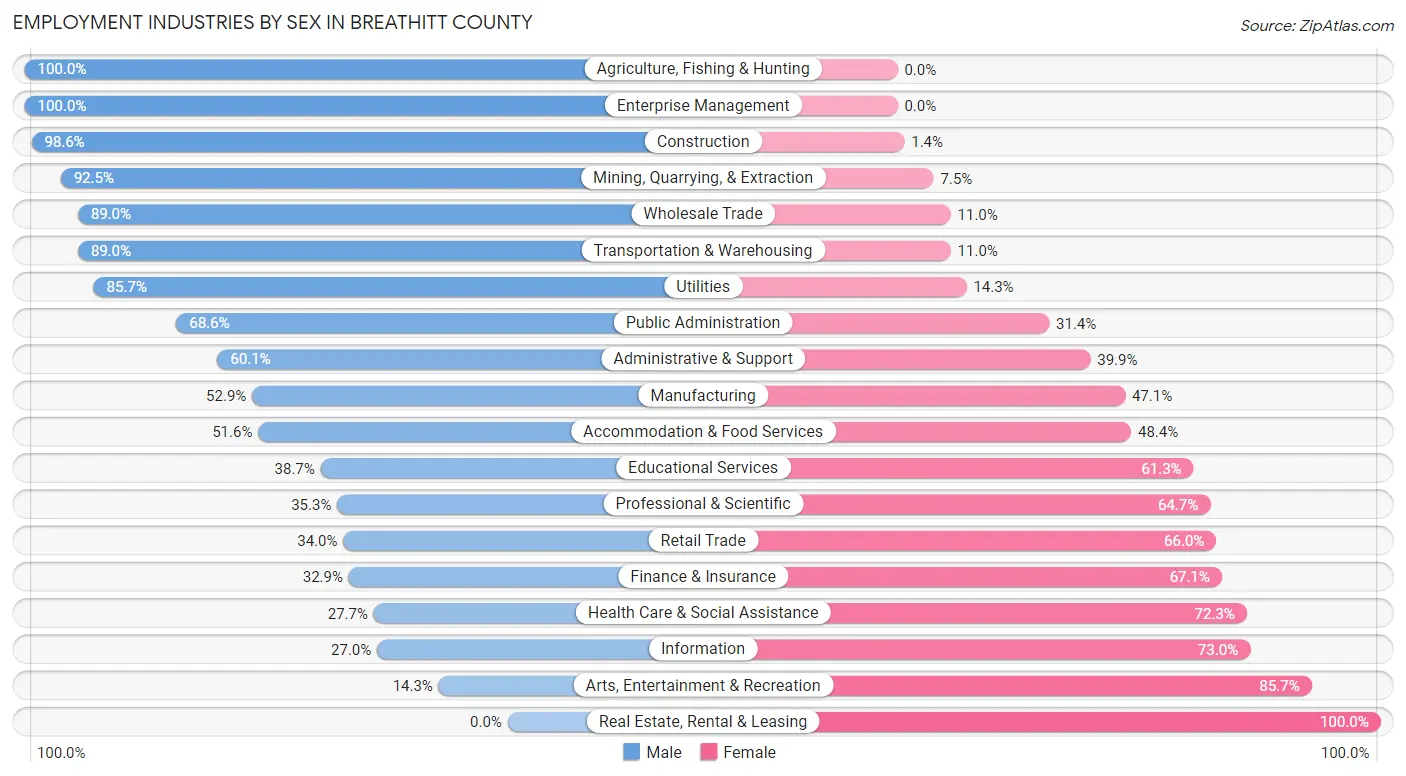
| Industry | Male | Female |
| Agriculture, Fishing & Hunting | 33 (100.0%) | 0 (0.0%) |
| Mining, Quarrying, & Extraction | 99 (92.5%) | 8 (7.5%) |
| Construction | 348 (98.6%) | 5 (1.4%) |
| Manufacturing | 210 (52.9%) | 187 (47.1%) |
| Wholesale Trade | 97 (89.0%) | 12 (11.0%) |
| Retail Trade | 180 (34.0%) | 349 (66.0%) |
| Transportation & Warehousing | 113 (89.0%) | 14 (11.0%) |
| Utilities | 30 (85.7%) | 5 (14.3%) |
| Information | 10 (27.0%) | 27 (73.0%) |
| Finance & Insurance | 25 (32.9%) | 51 (67.1%) |
| Real Estate, Rental & Leasing | 0 (0.0%) | 4 (100.0%) |
| Professional & Scientific | 36 (35.3%) | 66 (64.7%) |
| Enterprise Management | 7 (100.0%) | 0 (0.0%) |
| Administrative & Support | 143 (60.1%) | 95 (39.9%) |
| Educational Services | 318 (38.7%) | 503 (61.3%) |
| Health Care & Social Assistance | 201 (27.7%) | 524 (72.3%) |
| Arts, Entertainment & Recreation | 3 (14.3%) | 18 (85.7%) |
| Accommodation & Food Services | 173 (51.6%) | 162 (48.4%) |
| Public Administration | 225 (68.6%) | 103 (31.4%) |
| Total | 2,374 (52.1%) | 2,179 (47.9%) |
Education in Breathitt County
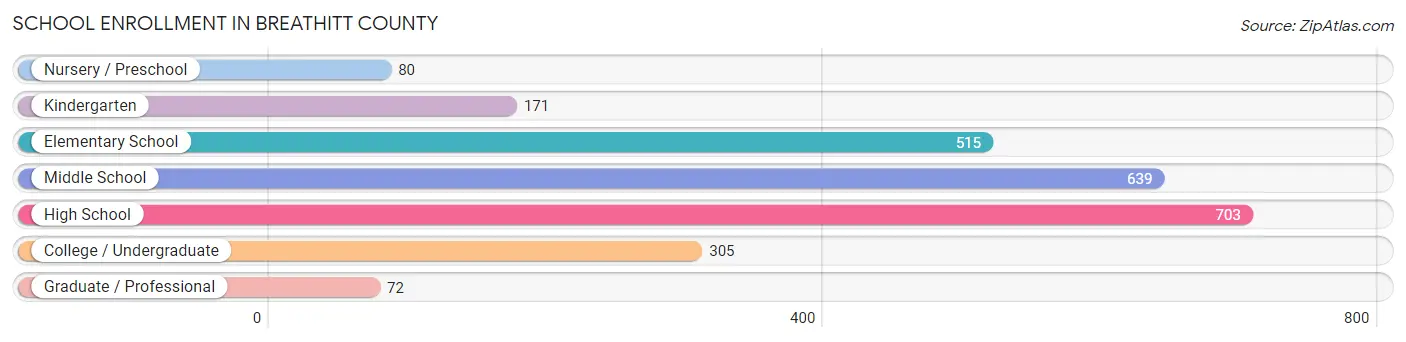
School Enrollment in Breathitt County
The most common levels of schooling among the 2,485 students in Breathitt County are high school (703 | 28.3%), middle school (639 | 25.7%), and elementary school (515 | 20.7%).
| School Level | # Students | % Students |
| Nursery / Preschool | 80 | 3.2% |
| Kindergarten | 171 | 6.9% |
| Elementary School | 515 | 20.7% |
| Middle School | 639 | 25.7% |
| High School | 703 | 28.3% |
| College / Undergraduate | 305 | 12.3% |
| Graduate / Professional | 72 | 2.9% |
| Total | 2,485 | 100.0% |
School Enrollment by Age by Funding Source in Breathitt County
Out of a total of 2,485 students who are enrolled in schools in Breathitt County, 425 (17.1%) attend a private institution, while the remaining 2,060 (82.9%) are enrolled in public schools. The age group of 25 to 34 year olds has the highest likelihood of being enrolled in private schools, with 23 (30.3% in the age bracket) enrolled. Conversely, the age group of 3 to 4 year olds has the lowest likelihood of being enrolled in a private school, with 70 (100.0% in the age bracket) attending a public institution.
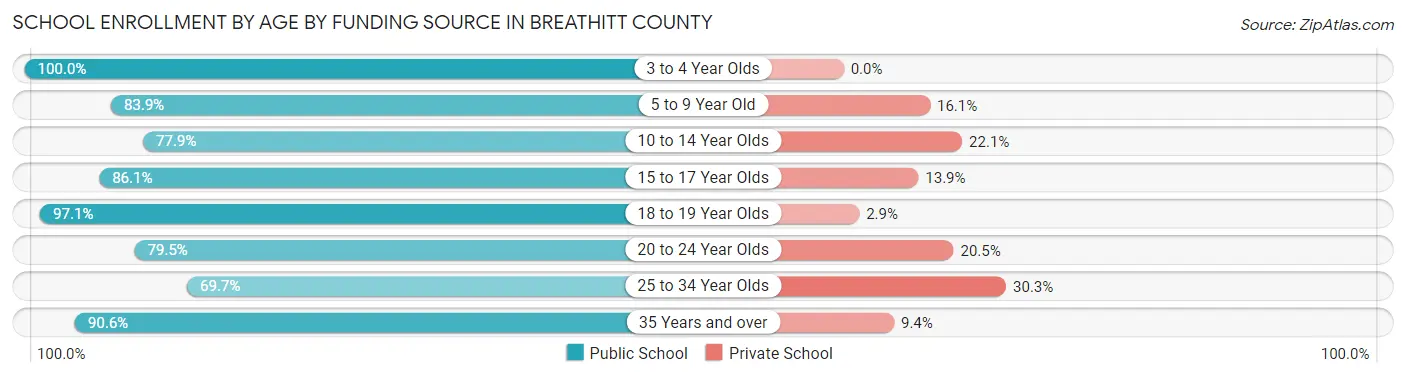
| Age Bracket | Public School | Private School |
| 3 to 4 Year Olds | 70 (100.0%) | 0 (0.0%) |
| 5 to 9 Year Old | 511 (83.9%) | 98 (16.1%) |
| 10 to 14 Year Olds | 671 (77.9%) | 190 (22.1%) |
| 15 to 17 Year Olds | 427 (86.1%) | 69 (13.9%) |
| 18 to 19 Year Olds | 134 (97.1%) | 4 (2.9%) |
| 20 to 24 Year Olds | 136 (79.5%) | 35 (20.5%) |
| 25 to 34 Year Olds | 53 (69.7%) | 23 (30.3%) |
| 35 Years and over | 58 (90.6%) | 6 (9.4%) |
| Total | 2,060 (82.9%) | 425 (17.1%) |
Educational Attainment by Field of Study in Breathitt County
Education (593 | 34.1%), arts & humanities (259 | 14.9%), science & technology (240 | 13.8%), business (164 | 9.4%), and liberal arts & history (110 | 6.3%) are the most common fields of study among 1,740 individuals in Breathitt County who have obtained a bachelor's degree or higher.
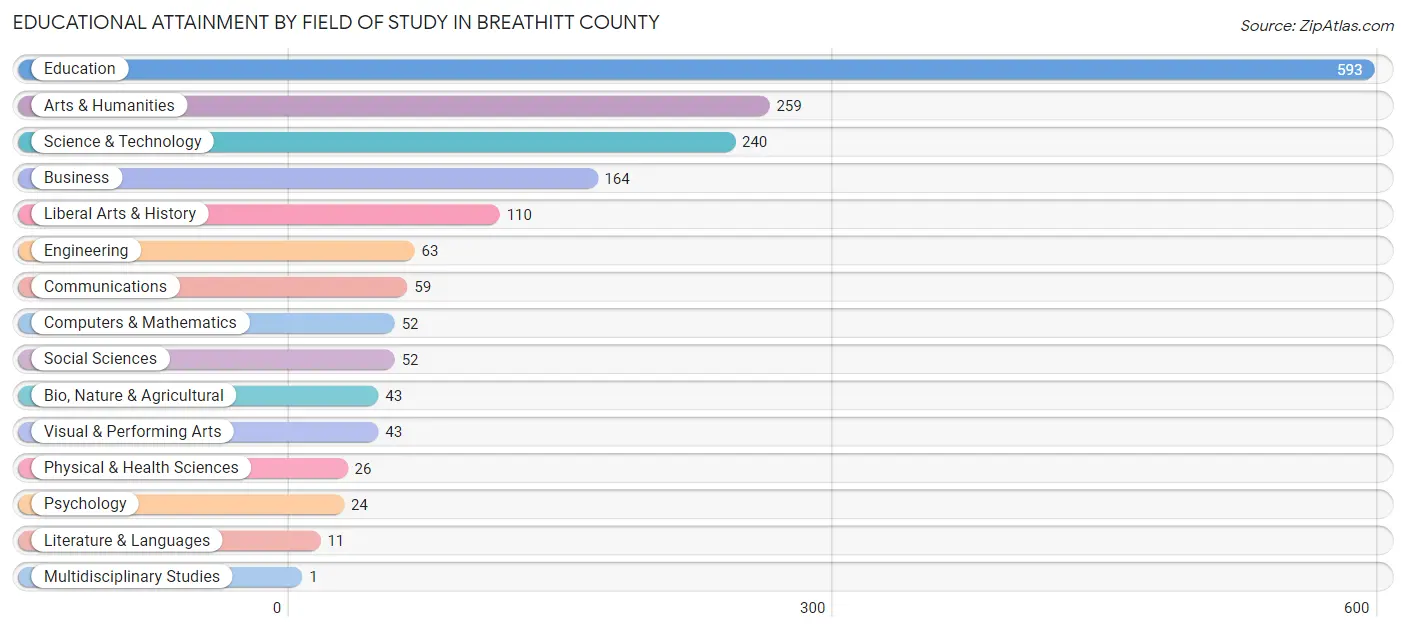
| Field of Study | # Graduates | % Graduates |
| Computers & Mathematics | 52 | 3.0% |
| Bio, Nature & Agricultural | 43 | 2.5% |
| Physical & Health Sciences | 26 | 1.5% |
| Psychology | 24 | 1.4% |
| Social Sciences | 52 | 3.0% |
| Engineering | 63 | 3.6% |
| Multidisciplinary Studies | 1 | 0.1% |
| Science & Technology | 240 | 13.8% |
| Business | 164 | 9.4% |
| Education | 593 | 34.1% |
| Literature & Languages | 11 | 0.6% |
| Liberal Arts & History | 110 | 6.3% |
| Visual & Performing Arts | 43 | 2.5% |
| Communications | 59 | 3.4% |
| Arts & Humanities | 259 | 14.9% |
| Total | 1,740 | 100.0% |
Transportation & Commute in Breathitt County
Vehicle Availability by Sex in Breathitt County
The most prevalent vehicle ownership categories in Breathitt County are males with 2 vehicles (728, accounting for 32.6%) and females with 2 vehicles (759, making up 33.6%).
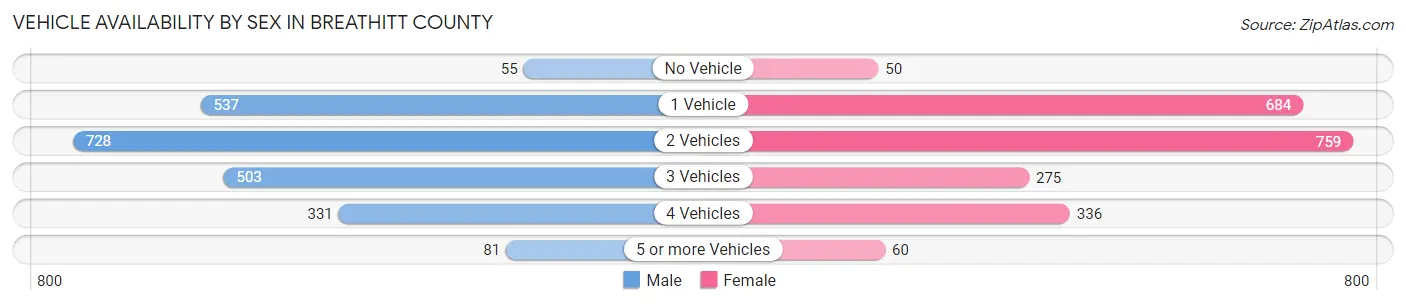
| Vehicles Available | Male | Female |
| No Vehicle | 55 (2.5%) | 50 (2.3%) |
| 1 Vehicle | 537 (24.0%) | 684 (31.6%) |
| 2 Vehicles | 728 (32.6%) | 759 (35.1%) |
| 3 Vehicles | 503 (22.5%) | 275 (12.7%) |
| 4 Vehicles | 331 (14.8%) | 336 (15.5%) |
| 5 or more Vehicles | 81 (3.6%) | 60 (2.8%) |
| Total | 2,235 (100.0%) | 2,164 (100.0%) |
Commute Time in Breathitt County
The most frequently occuring commute durations in Breathitt County are 5 to 9 minutes (818 commuters, 18.7%), 30 to 34 minutes (612 commuters, 14.0%), and 15 to 19 minutes (560 commuters, 12.8%).
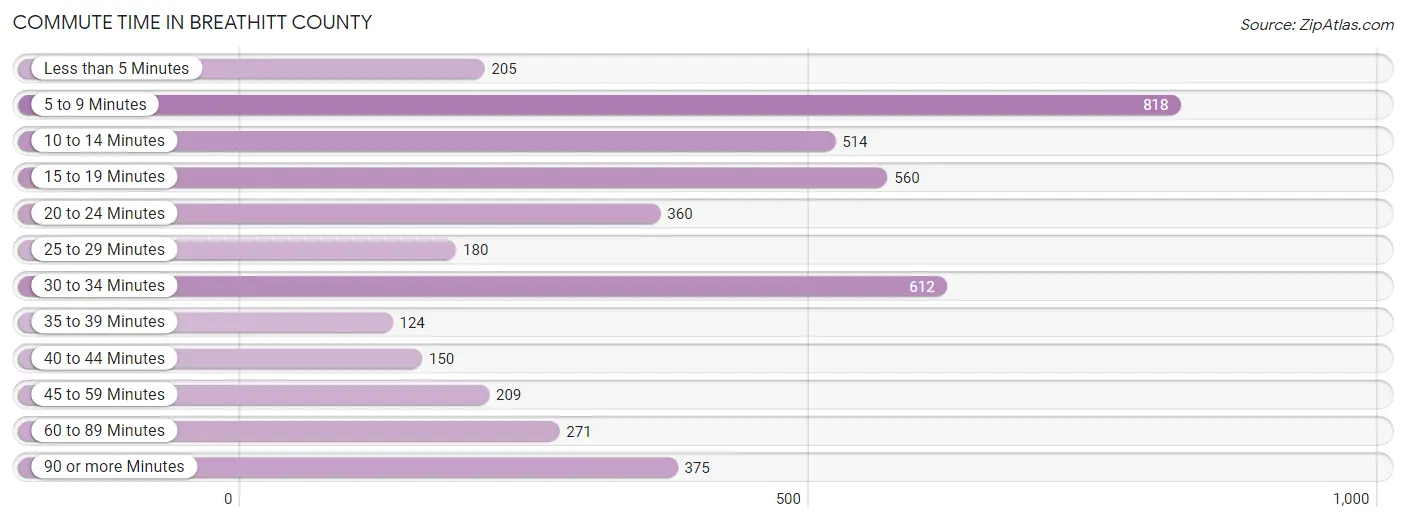
| Commute Time | # Commuters | % Commuters |
| Less than 5 Minutes | 205 | 4.7% |
| 5 to 9 Minutes | 818 | 18.7% |
| 10 to 14 Minutes | 514 | 11.7% |
| 15 to 19 Minutes | 560 | 12.8% |
| 20 to 24 Minutes | 360 | 8.2% |
| 25 to 29 Minutes | 180 | 4.1% |
| 30 to 34 Minutes | 612 | 14.0% |
| 35 to 39 Minutes | 124 | 2.8% |
| 40 to 44 Minutes | 150 | 3.4% |
| 45 to 59 Minutes | 209 | 4.8% |
| 60 to 89 Minutes | 271 | 6.2% |
| 90 or more Minutes | 375 | 8.6% |
Commute Time by Sex in Breathitt County
The most common commute times in Breathitt County are 10 to 14 minutes (329 commuters, 14.4%) for males and 5 to 9 minutes (495 commuters, 23.7%) for females.
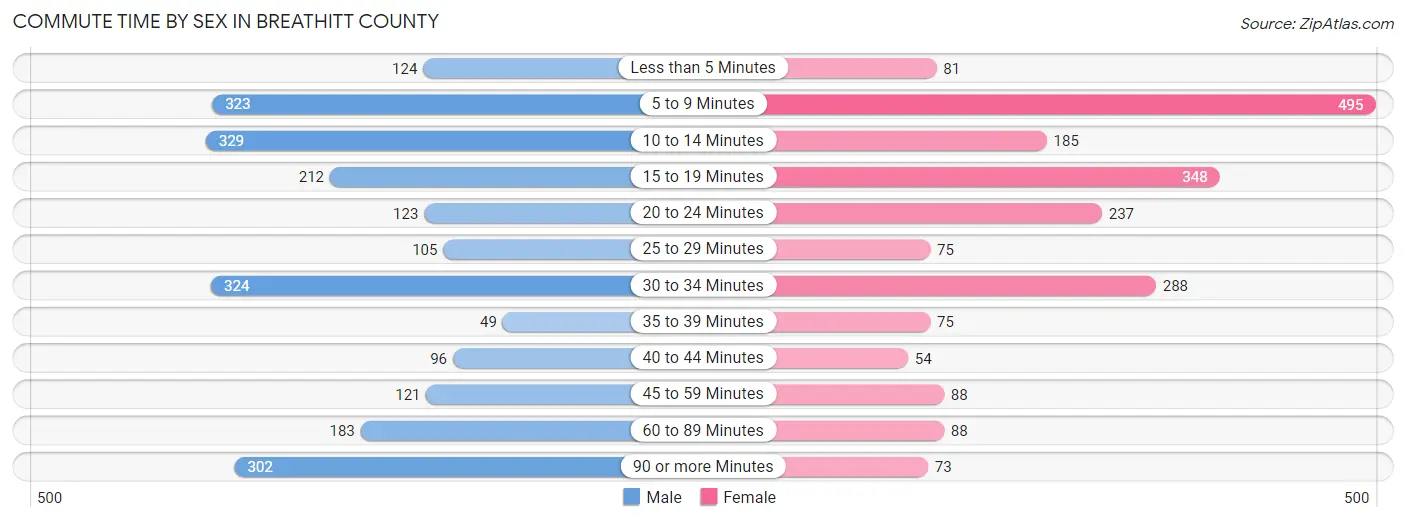
| Commute Time | Male | Female |
| Less than 5 Minutes | 124 (5.4%) | 81 (3.9%) |
| 5 to 9 Minutes | 323 (14.1%) | 495 (23.7%) |
| 10 to 14 Minutes | 329 (14.4%) | 185 (8.9%) |
| 15 to 19 Minutes | 212 (9.2%) | 348 (16.7%) |
| 20 to 24 Minutes | 123 (5.4%) | 237 (11.4%) |
| 25 to 29 Minutes | 105 (4.6%) | 75 (3.6%) |
| 30 to 34 Minutes | 324 (14.1%) | 288 (13.8%) |
| 35 to 39 Minutes | 49 (2.1%) | 75 (3.6%) |
| 40 to 44 Minutes | 96 (4.2%) | 54 (2.6%) |
| 45 to 59 Minutes | 121 (5.3%) | 88 (4.2%) |
| 60 to 89 Minutes | 183 (8.0%) | 88 (4.2%) |
| 90 or more Minutes | 302 (13.2%) | 73 (3.5%) |
Time of Departure to Work by Sex in Breathitt County
The most frequent times of departure to work in Breathitt County are 7:30 AM to 7:59 AM (353, 15.4%) for males and 7:30 AM to 7:59 AM (450, 21.6%) for females.
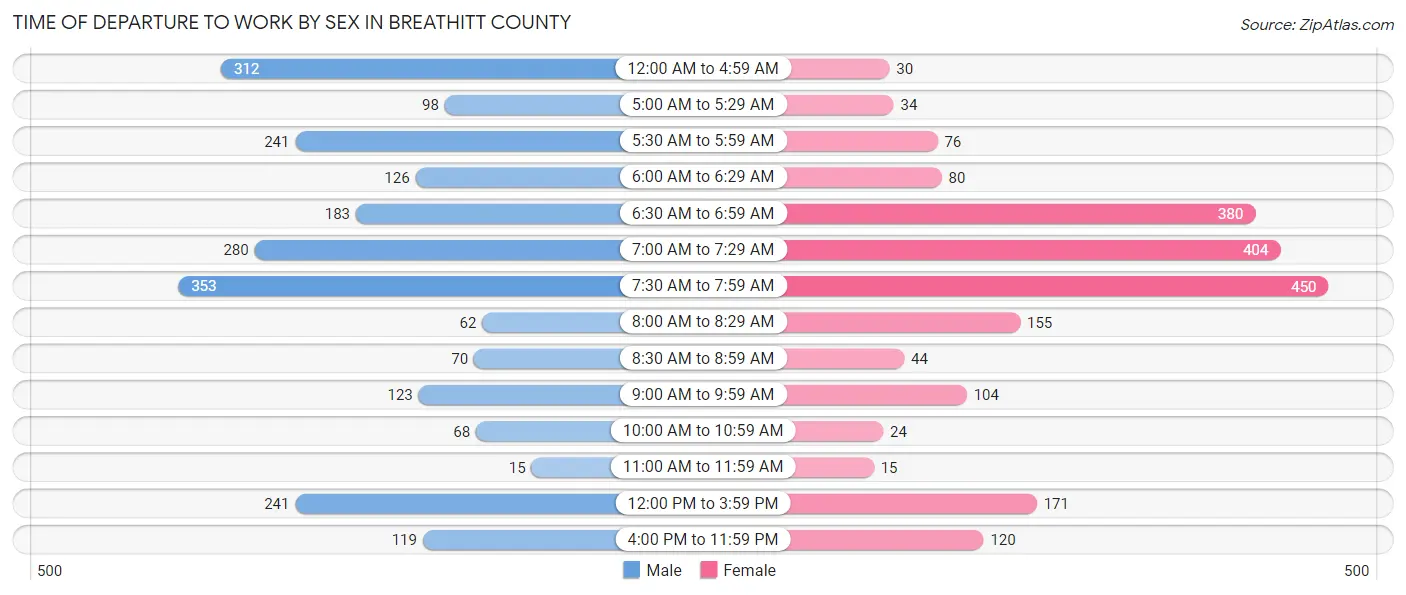
| Time of Departure | Male | Female |
| 12:00 AM to 4:59 AM | 312 (13.6%) | 30 (1.4%) |
| 5:00 AM to 5:29 AM | 98 (4.3%) | 34 (1.6%) |
| 5:30 AM to 5:59 AM | 241 (10.5%) | 76 (3.6%) |
| 6:00 AM to 6:29 AM | 126 (5.5%) | 80 (3.8%) |
| 6:30 AM to 6:59 AM | 183 (8.0%) | 380 (18.2%) |
| 7:00 AM to 7:29 AM | 280 (12.2%) | 404 (19.4%) |
| 7:30 AM to 7:59 AM | 353 (15.4%) | 450 (21.6%) |
| 8:00 AM to 8:29 AM | 62 (2.7%) | 155 (7.4%) |
| 8:30 AM to 8:59 AM | 70 (3.1%) | 44 (2.1%) |
| 9:00 AM to 9:59 AM | 123 (5.4%) | 104 (5.0%) |
| 10:00 AM to 10:59 AM | 68 (3.0%) | 24 (1.1%) |
| 11:00 AM to 11:59 AM | 15 (0.6%) | 15 (0.7%) |
| 12:00 PM to 3:59 PM | 241 (10.5%) | 171 (8.2%) |
| 4:00 PM to 11:59 PM | 119 (5.2%) | 120 (5.8%) |
| Total | 2,291 (100.0%) | 2,087 (100.0%) |
Housing Occupancy in Breathitt County
Occupancy by Ownership in Breathitt County
Of the total 5,529 dwellings in Breathitt County, owner-occupied units account for 4,031 (72.9%), while renter-occupied units make up 1,498 (27.1%).
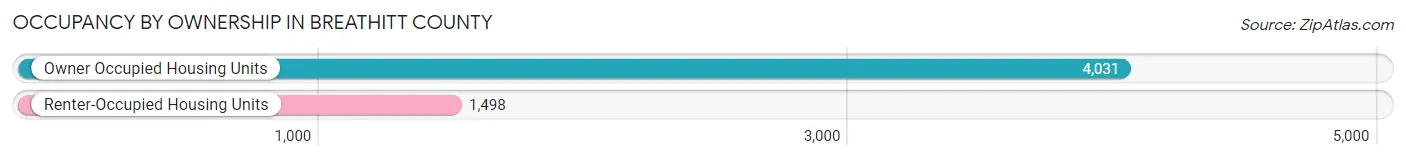
| Occupancy | # Housing Units | % Housing Units |
| Owner Occupied Housing Units | 4,031 | 72.9% |
| Renter-Occupied Housing Units | 1,498 | 27.1% |
| Total Occupied Housing Units | 5,529 | 100.0% |
Occupancy by Household Size in Breathitt County
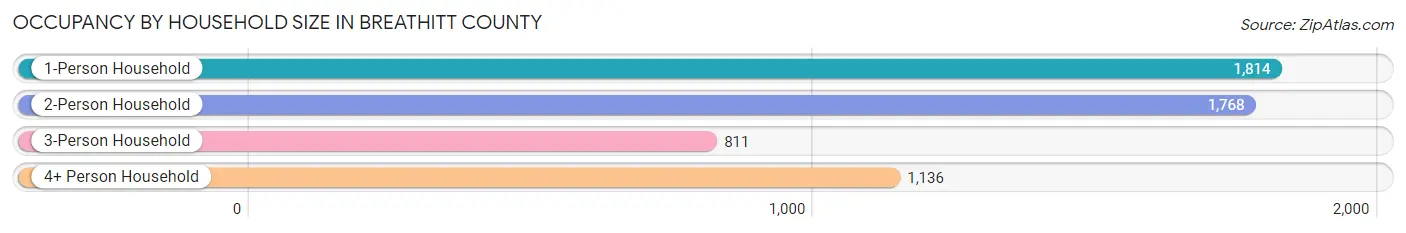
| Household Size | # Housing Units | % Housing Units |
| 1-Person Household | 1,814 | 32.8% |
| 2-Person Household | 1,768 | 32.0% |
| 3-Person Household | 811 | 14.7% |
| 4+ Person Household | 1,136 | 20.5% |
| Total Housing Units | 5,529 | 100.0% |
Occupancy by Ownership by Household Size in Breathitt County
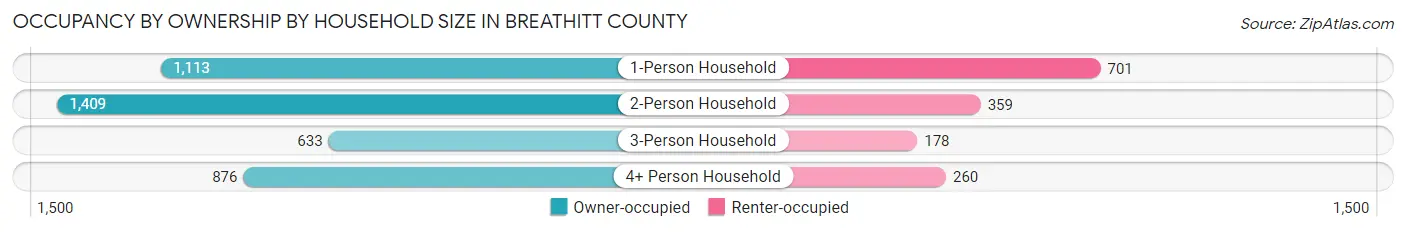
| Household Size | Owner-occupied | Renter-occupied |
| 1-Person Household | 1,113 (61.4%) | 701 (38.6%) |
| 2-Person Household | 1,409 (79.7%) | 359 (20.3%) |
| 3-Person Household | 633 (78.0%) | 178 (22.0%) |
| 4+ Person Household | 876 (77.1%) | 260 (22.9%) |
| Total Housing Units | 4,031 (72.9%) | 1,498 (27.1%) |
Occupancy by Educational Attainment in Breathitt County
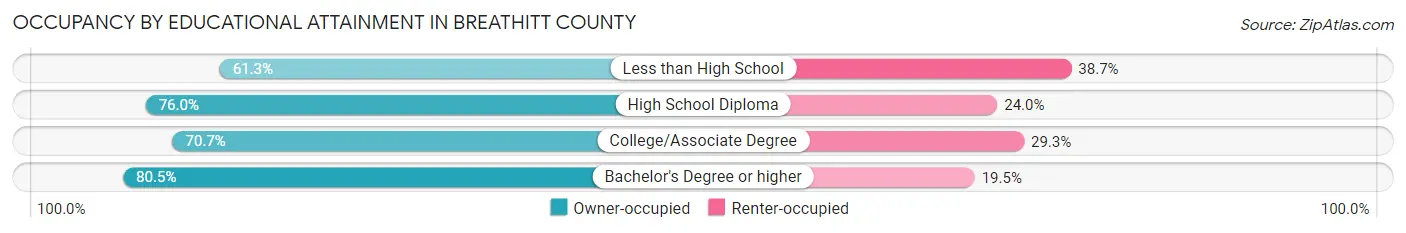
| Household Size | Owner-occupied | Renter-occupied |
| Less than High School | 616 (61.3%) | 389 (38.7%) |
| High School Diploma | 1,759 (76.0%) | 556 (24.0%) |
| College/Associate Degree | 878 (70.7%) | 364 (29.3%) |
| Bachelor's Degree or higher | 778 (80.5%) | 189 (19.5%) |
Occupancy by Age of Householder in Breathitt County
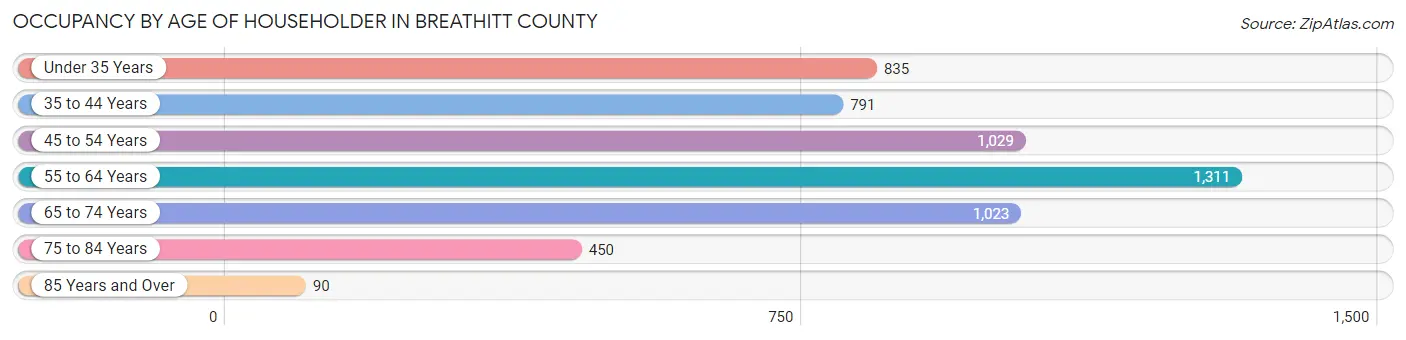
| Age Bracket | # Households | % Households |
| Under 35 Years | 835 | 15.1% |
| 35 to 44 Years | 791 | 14.3% |
| 45 to 54 Years | 1,029 | 18.6% |
| 55 to 64 Years | 1,311 | 23.7% |
| 65 to 74 Years | 1,023 | 18.5% |
| 75 to 84 Years | 450 | 8.1% |
| 85 Years and Over | 90 | 1.6% |
| Total | 5,529 | 100.0% |
Housing Finances in Breathitt County
Median Income by Occupancy in Breathitt County
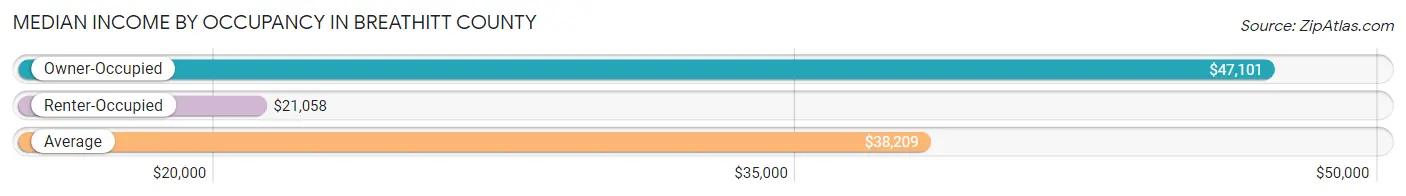
| Occupancy Type | # Households | Median Income |
| Owner-Occupied | 4,031 (72.9%) | $47,101 |
| Renter-Occupied | 1,498 (27.1%) | $21,058 |
| Average | 5,529 (100.0%) | $38,209 |
Occupancy by Householder Income Bracket in Breathitt County
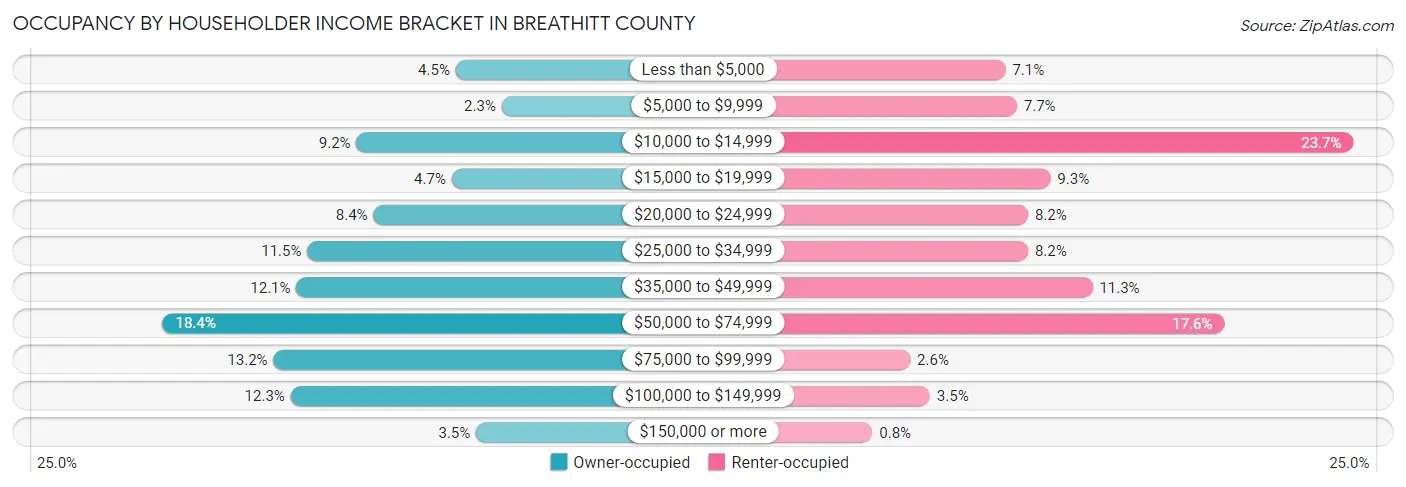
| Income Bracket | Owner-occupied | Renter-occupied |
| Less than $5,000 | 180 (4.5%) | 107 (7.1%) |
| $5,000 to $9,999 | 92 (2.3%) | 115 (7.7%) |
| $10,000 to $14,999 | 371 (9.2%) | 355 (23.7%) |
| $15,000 to $19,999 | 188 (4.7%) | 139 (9.3%) |
| $20,000 to $24,999 | 338 (8.4%) | 123 (8.2%) |
| $25,000 to $34,999 | 465 (11.5%) | 123 (8.2%) |
| $35,000 to $49,999 | 486 (12.1%) | 169 (11.3%) |
| $50,000 to $74,999 | 743 (18.4%) | 263 (17.6%) |
| $75,000 to $99,999 | 530 (13.2%) | 39 (2.6%) |
| $100,000 to $149,999 | 497 (12.3%) | 53 (3.5%) |
| $150,000 or more | 141 (3.5%) | 12 (0.8%) |
| Total | 4,031 (100.0%) | 1,498 (100.0%) |
Monthly Housing Cost Tiers in Breathitt County
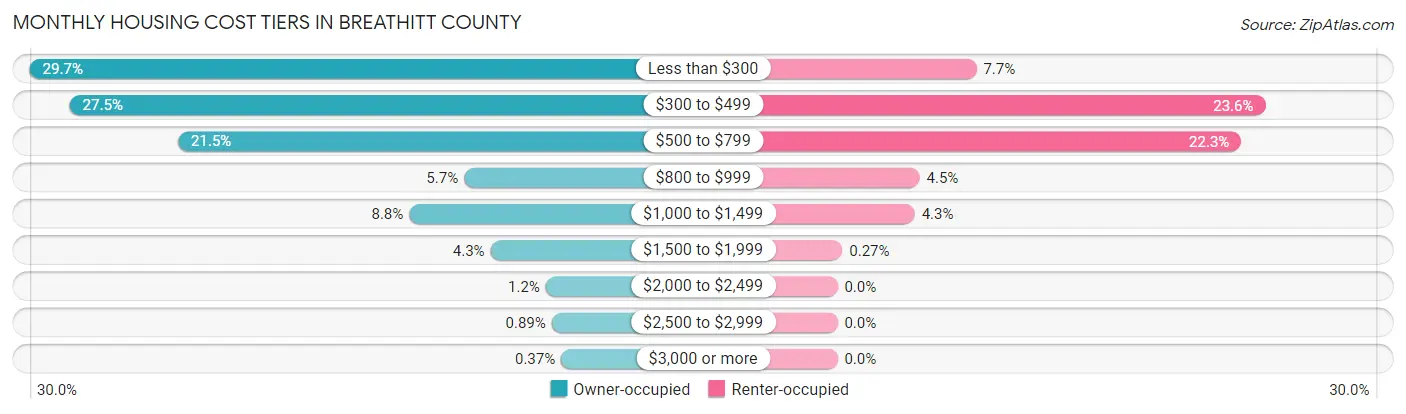
| Monthly Cost | Owner-occupied | Renter-occupied |
| Less than $300 | 1,198 (29.7%) | 115 (7.7%) |
| $300 to $499 | 1,109 (27.5%) | 354 (23.6%) |
| $500 to $799 | 868 (21.5%) | 334 (22.3%) |
| $800 to $999 | 231 (5.7%) | 68 (4.5%) |
| $1,000 to $1,499 | 353 (8.8%) | 64 (4.3%) |
| $1,500 to $1,999 | 172 (4.3%) | 4 (0.3%) |
| $2,000 to $2,499 | 49 (1.2%) | 0 (0.0%) |
| $2,500 to $2,999 | 36 (0.9%) | 0 (0.0%) |
| $3,000 or more | 15 (0.4%) | 0 (0.0%) |
| Total | 4,031 (100.0%) | 1,498 (100.0%) |
Physical Housing Characteristics in Breathitt County
Housing Structures in Breathitt County
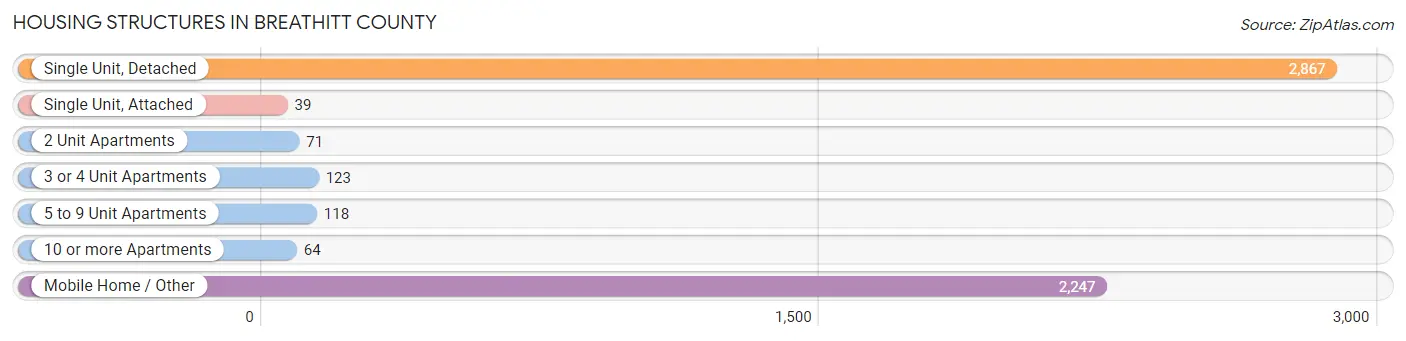
| Structure Type | # Housing Units | % Housing Units |
| Single Unit, Detached | 2,867 | 51.8% |
| Single Unit, Attached | 39 | 0.7% |
| 2 Unit Apartments | 71 | 1.3% |
| 3 or 4 Unit Apartments | 123 | 2.2% |
| 5 to 9 Unit Apartments | 118 | 2.1% |
| 10 or more Apartments | 64 | 1.2% |
| Mobile Home / Other | 2,247 | 40.6% |
| Total | 5,529 | 100.0% |
Housing Structures by Occupancy in Breathitt County
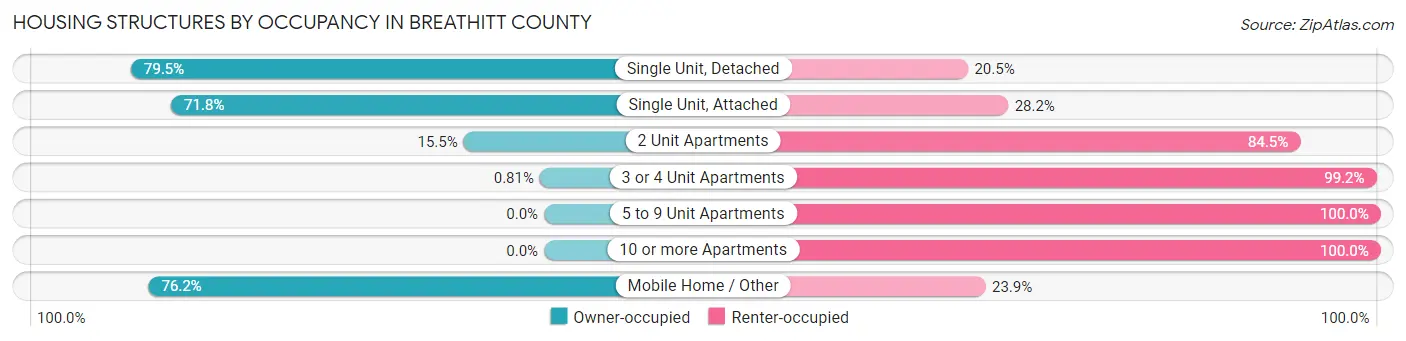
| Structure Type | Owner-occupied | Renter-occupied |
| Single Unit, Detached | 2,280 (79.5%) | 587 (20.5%) |
| Single Unit, Attached | 28 (71.8%) | 11 (28.2%) |
| 2 Unit Apartments | 11 (15.5%) | 60 (84.5%) |
| 3 or 4 Unit Apartments | 1 (0.8%) | 122 (99.2%) |
| 5 to 9 Unit Apartments | 0 (0.0%) | 118 (100.0%) |
| 10 or more Apartments | 0 (0.0%) | 64 (100.0%) |
| Mobile Home / Other | 1,711 (76.1%) | 536 (23.8%) |
| Total | 4,031 (72.9%) | 1,498 (27.1%) |
Housing Structures by Number of Rooms in Breathitt County
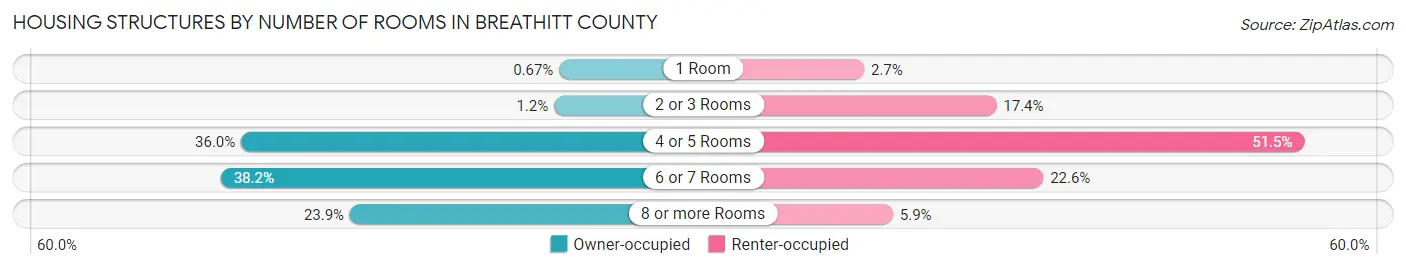
| Number of Rooms | Owner-occupied | Renter-occupied |
| 1 Room | 27 (0.7%) | 40 (2.7%) |
| 2 or 3 Rooms | 50 (1.2%) | 260 (17.4%) |
| 4 or 5 Rooms | 1,450 (36.0%) | 772 (51.5%) |
| 6 or 7 Rooms | 1,541 (38.2%) | 338 (22.6%) |
| 8 or more Rooms | 963 (23.9%) | 88 (5.9%) |
| Total | 4,031 (100.0%) | 1,498 (100.0%) |
Housing Structure by Heating Type in Breathitt County
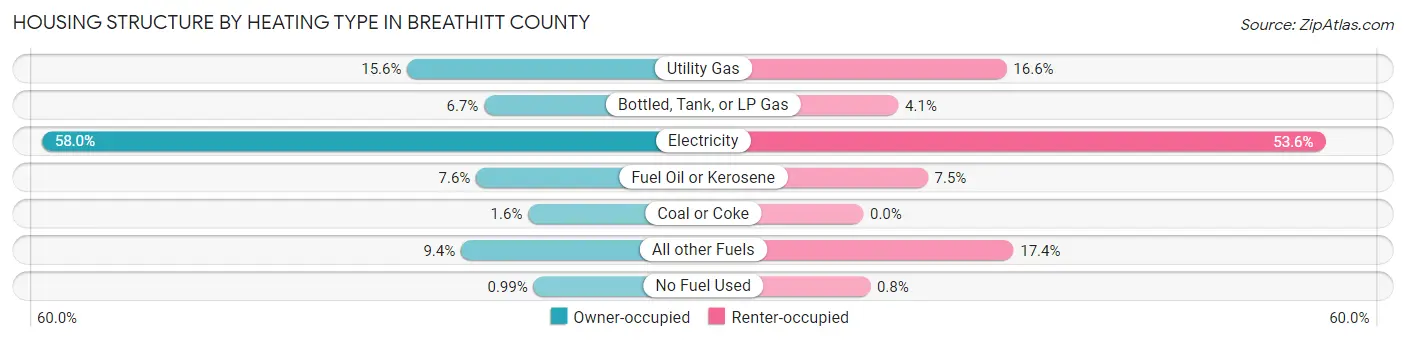
| Heating Type | Owner-occupied | Renter-occupied |
| Utility Gas | 630 (15.6%) | 249 (16.6%) |
| Bottled, Tank, or LP Gas | 271 (6.7%) | 61 (4.1%) |
| Electricity | 2,338 (58.0%) | 803 (53.6%) |
| Fuel Oil or Kerosene | 308 (7.6%) | 112 (7.5%) |
| Coal or Coke | 65 (1.6%) | 0 (0.0%) |
| All other Fuels | 379 (9.4%) | 261 (17.4%) |
| No Fuel Used | 40 (1.0%) | 12 (0.8%) |
| Total | 4,031 (100.0%) | 1,498 (100.0%) |
Household Vehicle Usage in Breathitt County
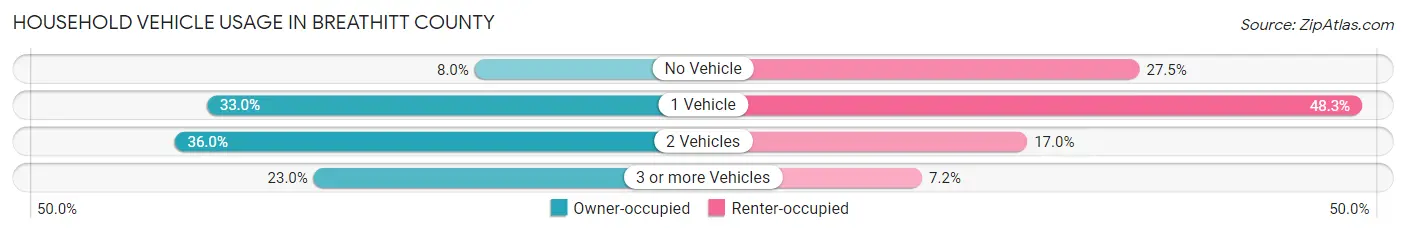
| Vehicles per Household | Owner-occupied | Renter-occupied |
| No Vehicle | 322 (8.0%) | 412 (27.5%) |
| 1 Vehicle | 1,330 (33.0%) | 723 (48.3%) |
| 2 Vehicles | 1,451 (36.0%) | 255 (17.0%) |
| 3 or more Vehicles | 928 (23.0%) | 108 (7.2%) |
| Total | 4,031 (100.0%) | 1,498 (100.0%) |
Real Estate & Mortgages in Breathitt County
Real Estate and Mortgage Overview in Breathitt County
| Characteristic | Without Mortgage | With Mortgage |
| Housing Units | 2,902 | 1,129 |
| Median Property Value | $48,400 | $117,300 |
| Median Household Income | $35,291 | $112 |
| Monthly Housing Costs | $344 | $10 |
| Real Estate Taxes | $377 | $103 |
Property Value by Mortgage Status in Breathitt County
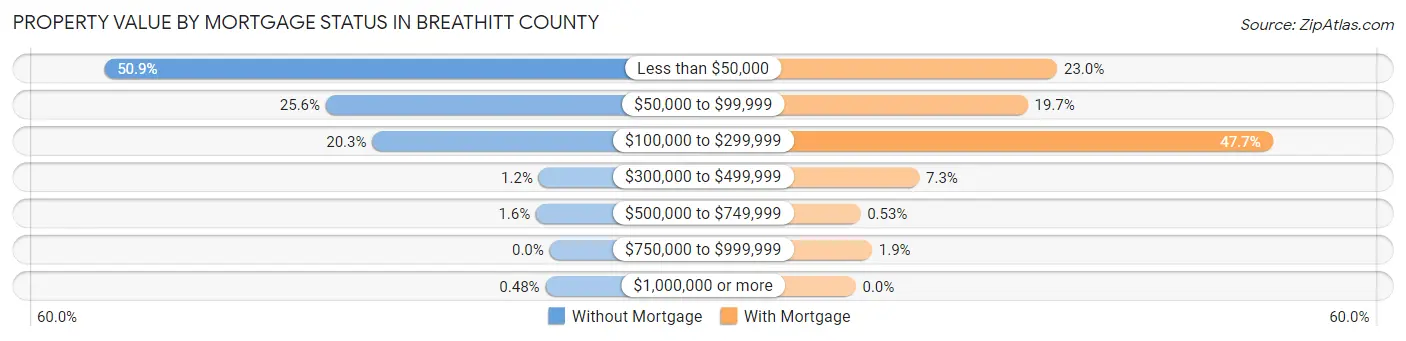
| Property Value | Without Mortgage | With Mortgage |
| Less than $50,000 | 1,477 (50.9%) | 260 (23.0%) |
| $50,000 to $99,999 | 742 (25.6%) | 222 (19.7%) |
| $100,000 to $299,999 | 588 (20.3%) | 538 (47.6%) |
| $300,000 to $499,999 | 36 (1.2%) | 82 (7.3%) |
| $500,000 to $749,999 | 45 (1.5%) | 6 (0.5%) |
| $750,000 to $999,999 | 0 (0.0%) | 21 (1.9%) |
| $1,000,000 or more | 14 (0.5%) | 0 (0.0%) |
| Total | 2,902 (100.0%) | 1,129 (100.0%) |
Household Income by Mortgage Status in Breathitt County
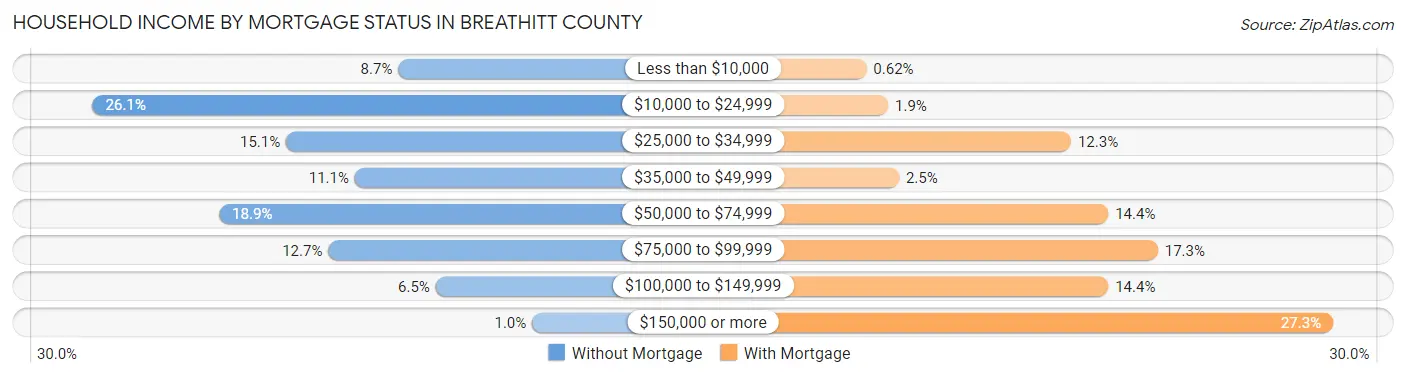
| Household Income | Without Mortgage | With Mortgage |
| Less than $10,000 | 251 (8.6%) | 7 (0.6%) |
| $10,000 to $24,999 | 758 (26.1%) | 21 (1.9%) |
| $25,000 to $34,999 | 437 (15.1%) | 139 (12.3%) |
| $35,000 to $49,999 | 323 (11.1%) | 28 (2.5%) |
| $50,000 to $74,999 | 548 (18.9%) | 163 (14.4%) |
| $75,000 to $99,999 | 367 (12.7%) | 195 (17.3%) |
| $100,000 to $149,999 | 189 (6.5%) | 163 (14.4%) |
| $150,000 or more | 29 (1.0%) | 308 (27.3%) |
| Total | 2,902 (100.0%) | 1,129 (100.0%) |
Property Value to Household Income Ratio in Breathitt County
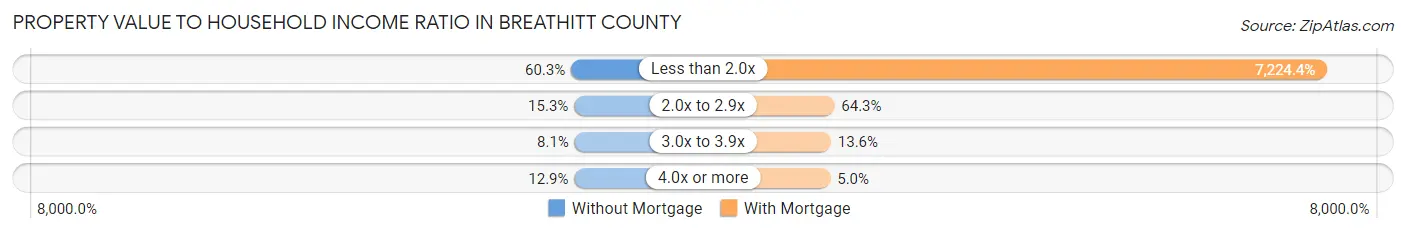
| Value-to-Income Ratio | Without Mortgage | With Mortgage |
| Less than 2.0x | 1,750 (60.3%) | 81,563 (7,224.4%) |
| 2.0x to 2.9x | 445 (15.3%) | 726 (64.3%) |
| 3.0x to 3.9x | 234 (8.1%) | 154 (13.6%) |
| 4.0x or more | 374 (12.9%) | 56 (5.0%) |
| Total | 2,902 (100.0%) | 1,129 (100.0%) |
Real Estate Taxes by Mortgage Status in Breathitt County
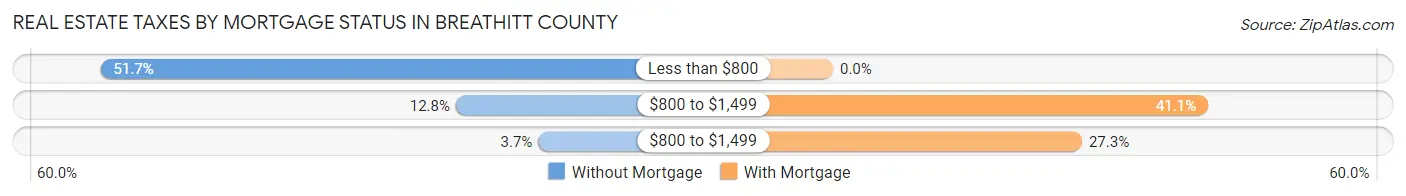
| Property Taxes | Without Mortgage | With Mortgage |
| Less than $800 | 1,500 (51.7%) | 0 (0.0%) |
| $800 to $1,499 | 370 (12.8%) | 464 (41.1%) |
| $800 to $1,499 | 108 (3.7%) | 308 (27.3%) |
| Total | 2,902 (100.0%) | 1,129 (100.0%) |
Health & Disability in Breathitt County
Health Insurance Coverage by Age in Breathitt County
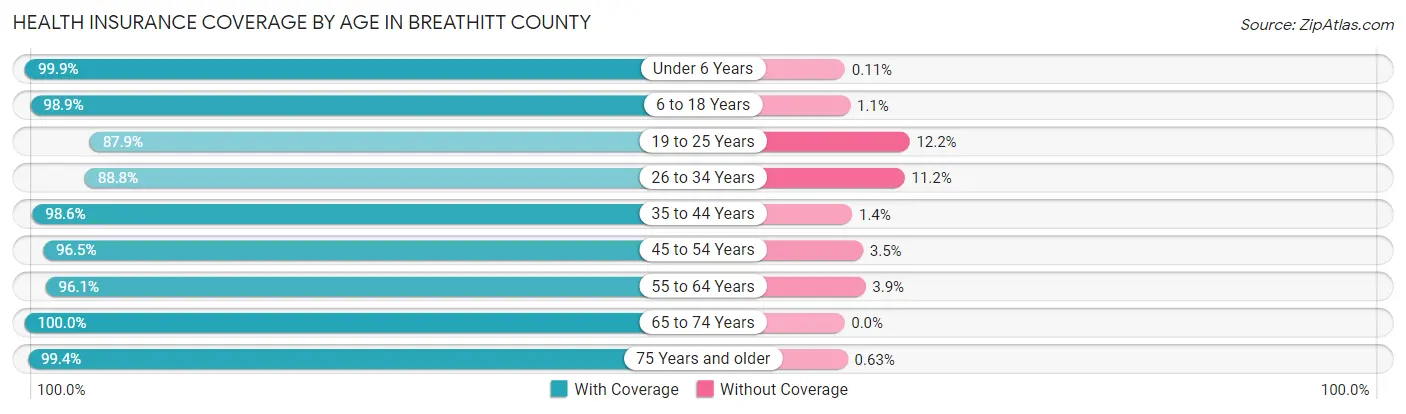
| Age Bracket | With Coverage | Without Coverage |
| Under 6 Years | 886 (99.9%) | 1 (0.1%) |
| 6 to 18 Years | 1,948 (98.9%) | 21 (1.1%) |
| 19 to 25 Years | 1,012 (87.8%) | 140 (12.1%) |
| 26 to 34 Years | 1,279 (88.8%) | 162 (11.2%) |
| 35 to 44 Years | 1,712 (98.6%) | 25 (1.4%) |
| 45 to 54 Years | 1,787 (96.5%) | 64 (3.5%) |
| 55 to 64 Years | 2,004 (96.1%) | 82 (3.9%) |
| 65 to 74 Years | 1,566 (100.0%) | 0 (0.0%) |
| 75 Years and older | 791 (99.4%) | 5 (0.6%) |
| Total | 12,985 (96.3%) | 500 (3.7%) |
Health Insurance Coverage by Citizenship Status in Breathitt County
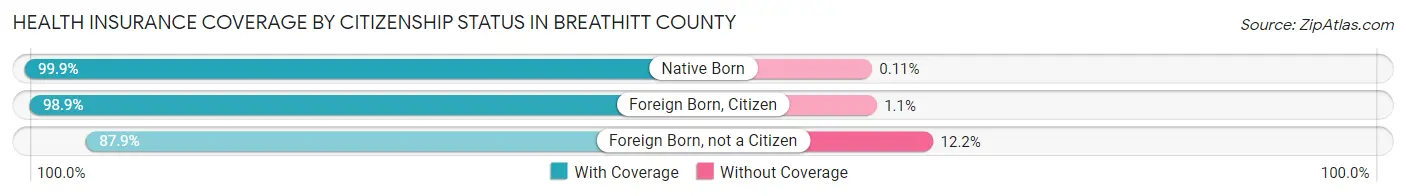
| Citizenship Status | With Coverage | Without Coverage |
| Native Born | 886 (99.9%) | 1 (0.1%) |
| Foreign Born, Citizen | 1,948 (98.9%) | 21 (1.1%) |
| Foreign Born, not a Citizen | 1,012 (87.8%) | 140 (12.1%) |
Health Insurance Coverage by Household Income in Breathitt County
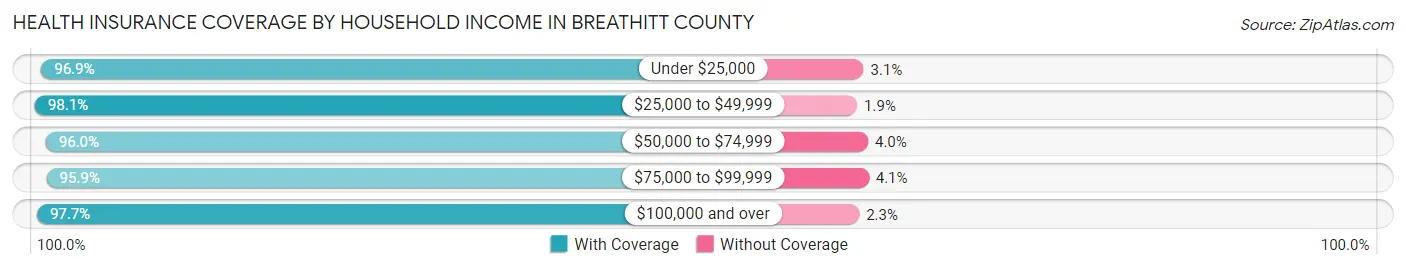
| Household Income | With Coverage | Without Coverage |
| Under $25,000 | 3,728 (96.9%) | 121 (3.1%) |
| $25,000 to $49,999 | 2,732 (98.1%) | 54 (1.9%) |
| $50,000 to $74,999 | 2,628 (96.0%) | 109 (4.0%) |
| $75,000 to $99,999 | 1,631 (95.9%) | 70 (4.1%) |
| $100,000 and over | 2,151 (97.7%) | 51 (2.3%) |
Public vs Private Health Insurance Coverage by Age in Breathitt County
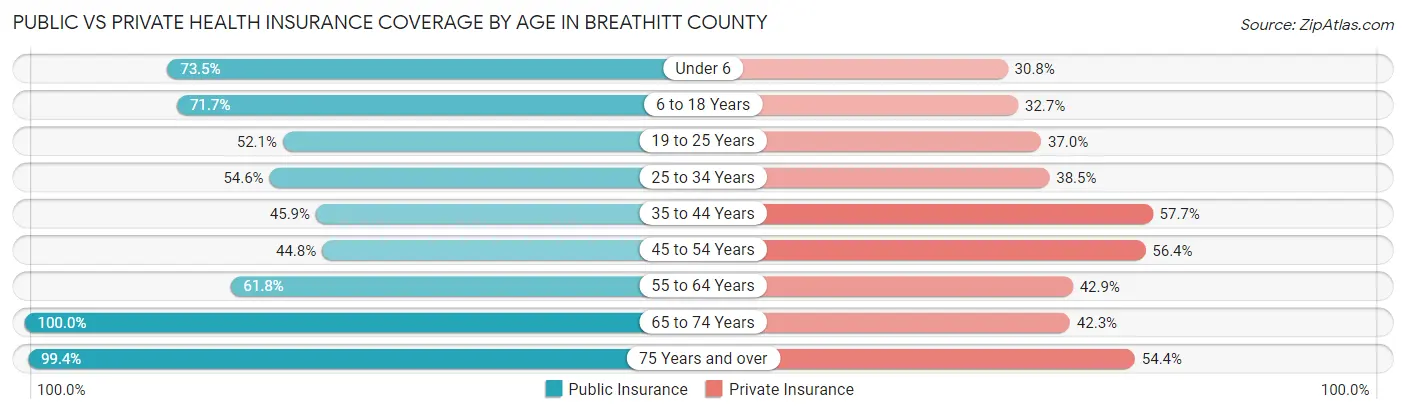
| Age Bracket | Public Insurance | Private Insurance |
| Under 6 | 652 (73.5%) | 273 (30.8%) |
| 6 to 18 Years | 1,412 (71.7%) | 644 (32.7%) |
| 19 to 25 Years | 600 (52.1%) | 426 (37.0%) |
| 25 to 34 Years | 786 (54.5%) | 555 (38.5%) |
| 35 to 44 Years | 798 (45.9%) | 1,002 (57.7%) |
| 45 to 54 Years | 829 (44.8%) | 1,043 (56.4%) |
| 55 to 64 Years | 1,289 (61.8%) | 894 (42.9%) |
| 65 to 74 Years | 1,566 (100.0%) | 663 (42.3%) |
| 75 Years and over | 791 (99.4%) | 433 (54.4%) |
| Total | 8,723 (64.7%) | 5,933 (44.0%) |
Disability Status by Sex by Age in Breathitt County
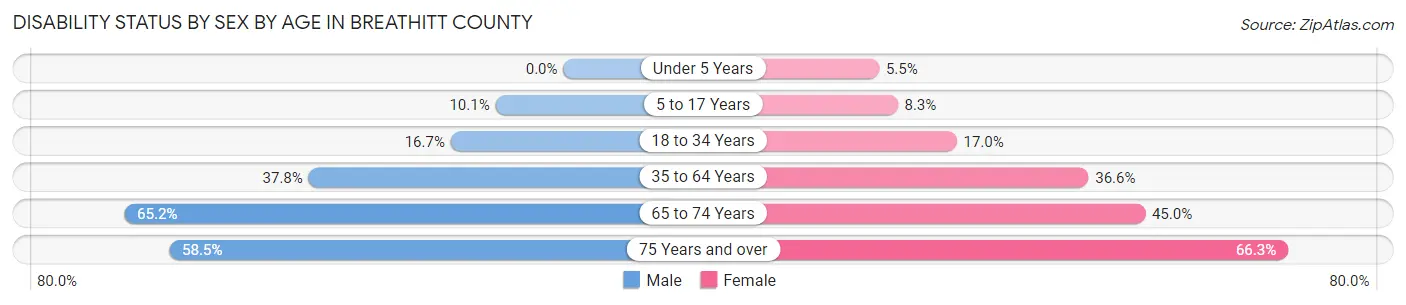
| Age Bracket | Male | Female |
| Under 5 Years | 0 (0.0%) | 20 (5.5%) |
| 5 to 17 Years | 103 (10.1%) | 79 (8.3%) |
| 18 to 34 Years | 242 (16.7%) | 213 (17.0%) |
| 35 to 64 Years | 1,085 (37.8%) | 1,027 (36.6%) |
| 65 to 74 Years | 491 (65.2%) | 366 (45.0%) |
| 75 Years and over | 185 (58.5%) | 318 (66.2%) |
Disability Class by Sex by Age in Breathitt County
Disability Class: Hearing Difficulty
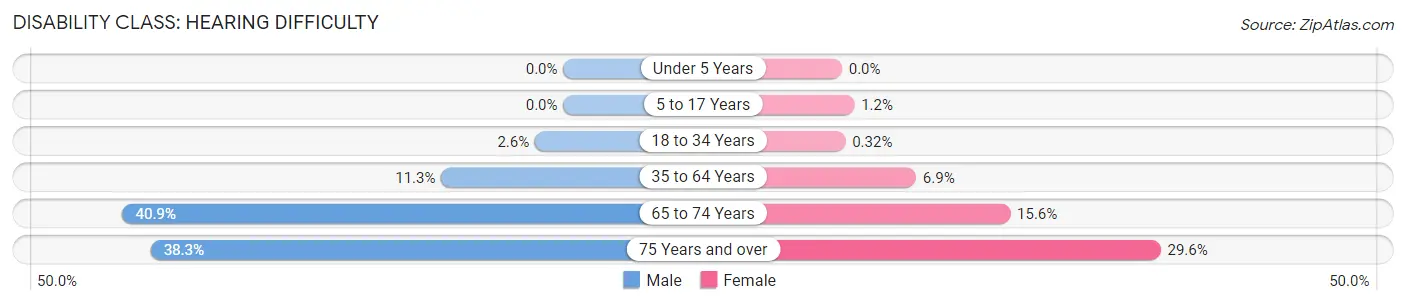
| Age Bracket | Male | Female |
| Under 5 Years | 0 (0.0%) | 0 (0.0%) |
| 5 to 17 Years | 0 (0.0%) | 11 (1.1%) |
| 18 to 34 Years | 38 (2.6%) | 4 (0.3%) |
| 35 to 64 Years | 325 (11.3%) | 193 (6.9%) |
| 65 to 74 Years | 308 (40.9%) | 127 (15.6%) |
| 75 Years and over | 121 (38.3%) | 142 (29.6%) |
Disability Class: Vision Difficulty
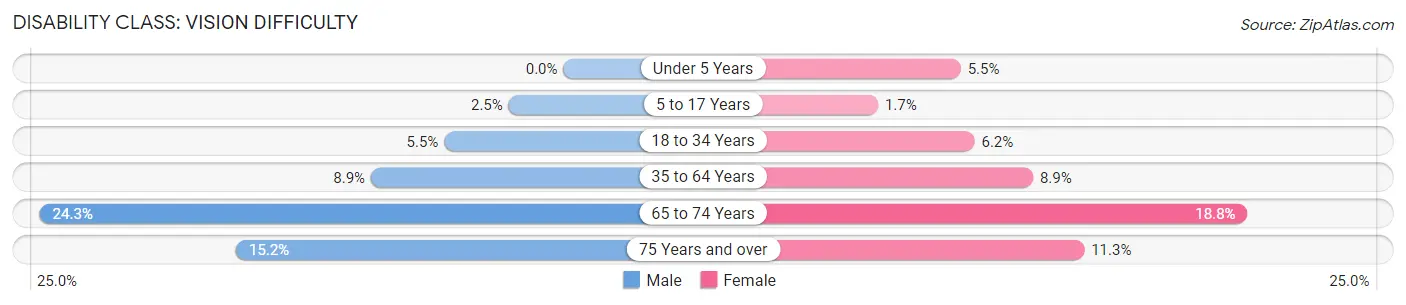
| Age Bracket | Male | Female |
| Under 5 Years | 0 (0.0%) | 20 (5.5%) |
| 5 to 17 Years | 26 (2.5%) | 16 (1.7%) |
| 18 to 34 Years | 80 (5.5%) | 77 (6.2%) |
| 35 to 64 Years | 256 (8.9%) | 249 (8.9%) |
| 65 to 74 Years | 183 (24.3%) | 153 (18.8%) |
| 75 Years and over | 48 (15.2%) | 54 (11.3%) |
Disability Class: Cognitive Difficulty
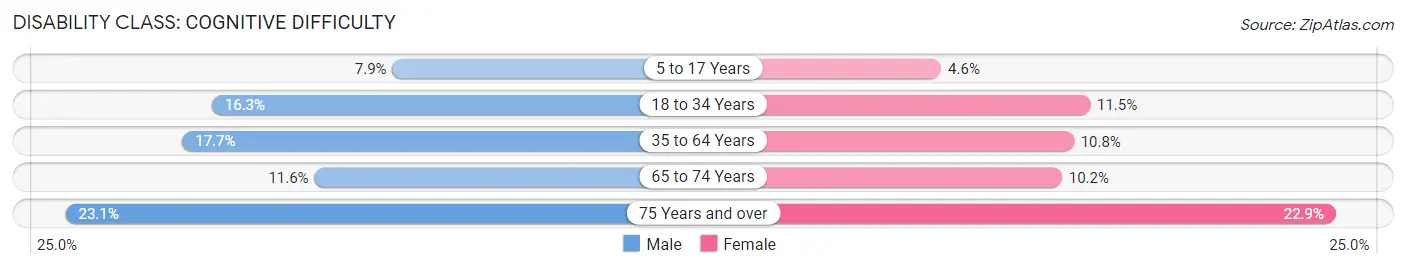
| Age Bracket | Male | Female |
| 5 to 17 Years | 81 (7.9%) | 44 (4.6%) |
| 18 to 34 Years | 236 (16.3%) | 144 (11.5%) |
| 35 to 64 Years | 507 (17.7%) | 302 (10.8%) |
| 65 to 74 Years | 87 (11.6%) | 83 (10.2%) |
| 75 Years and over | 73 (23.1%) | 110 (22.9%) |
Disability Class: Ambulatory Difficulty
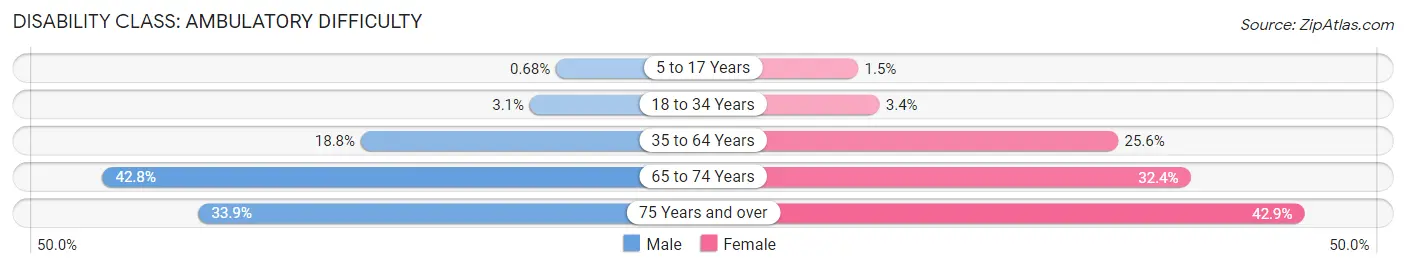
| Age Bracket | Male | Female |
| 5 to 17 Years | 7 (0.7%) | 14 (1.5%) |
| 18 to 34 Years | 45 (3.1%) | 43 (3.4%) |
| 35 to 64 Years | 539 (18.8%) | 718 (25.6%) |
| 65 to 74 Years | 322 (42.8%) | 263 (32.4%) |
| 75 Years and over | 107 (33.9%) | 206 (42.9%) |
Disability Class: Self-Care Difficulty
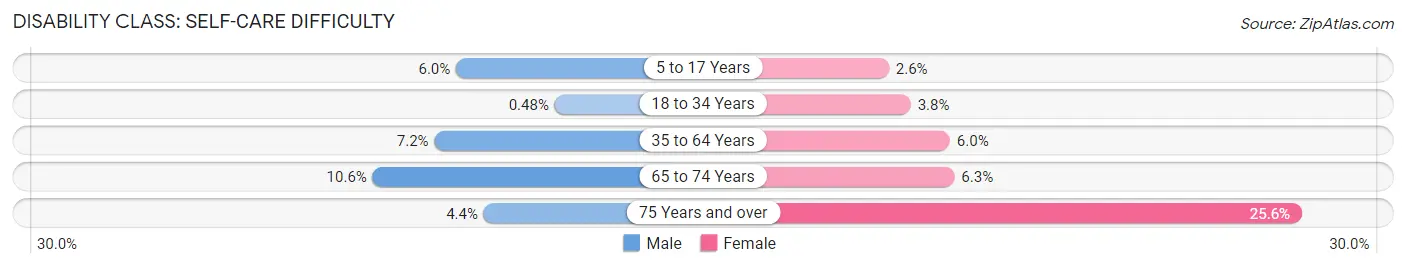
| Age Bracket | Male | Female |
| 5 to 17 Years | 61 (6.0%) | 25 (2.6%) |
| 18 to 34 Years | 7 (0.5%) | 48 (3.8%) |
| 35 to 64 Years | 206 (7.2%) | 169 (6.0%) |
| 65 to 74 Years | 80 (10.6%) | 51 (6.3%) |
| 75 Years and over | 14 (4.4%) | 123 (25.6%) |
Technology Access in Breathitt County
Computing Device Access in Breathitt County
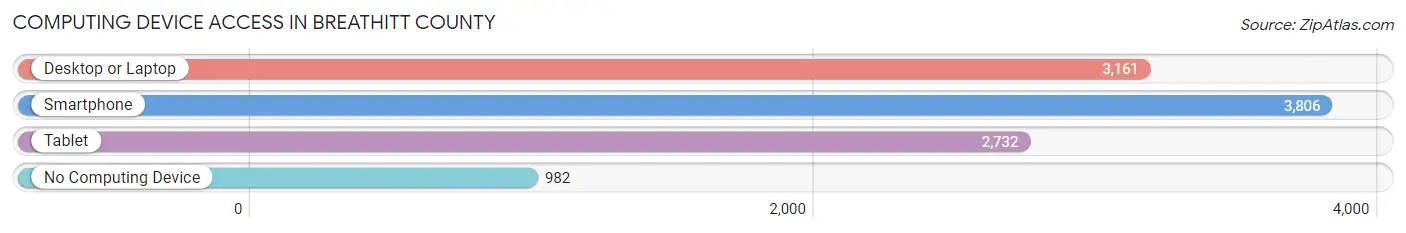
| Device Type | # Households | % Households |
| Desktop or Laptop | 3,161 | 57.2% |
| Smartphone | 3,806 | 68.8% |
| Tablet | 2,732 | 49.4% |
| No Computing Device | 982 | 17.8% |
| Total | 5,529 | 100.0% |
Internet Access in Breathitt County
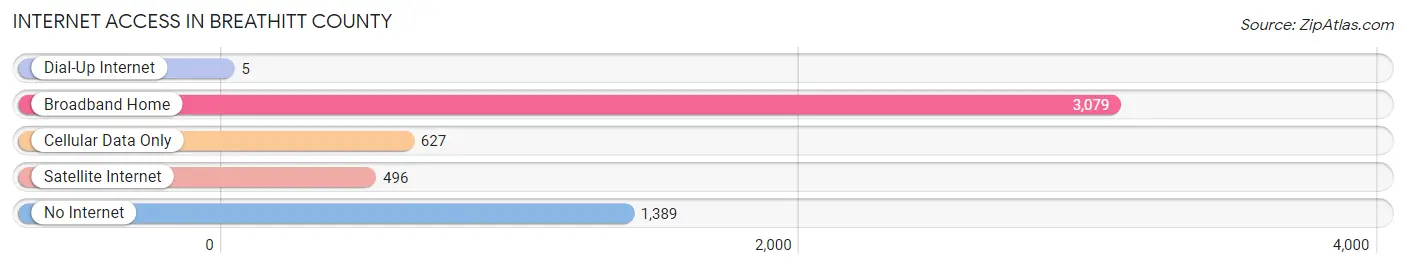
| Internet Type | # Households | % Households |
| Dial-Up Internet | 5 | 0.1% |
| Broadband Home | 3,079 | 55.7% |
| Cellular Data Only | 627 | 11.3% |
| Satellite Internet | 496 | 9.0% |
| No Internet | 1,389 | 25.1% |
| Total | 5,529 | 100.0% |
Breathitt County Summary
Breathitt County is located in the eastern part of Kentucky, in the Appalachian Mountains. It is bordered by Lee, Owsley, Perry, Knott, and Wolfe counties. The county seat is Jackson, and the county was formed in 1839 from parts of Clay, Floyd, and Perry counties. The county was named after Governor John Breathitt.
Geography
Breathitt County is located in the Appalachian Mountains and is part of the Eastern Coal Field region of Kentucky. The county is mostly mountainous, with the highest point being the summit of Big Black Mountain at 2,890 feet. The county is drained by the North Fork of the Kentucky River, which flows through the county from north to south. The county has a total area of 437 square miles, of which 435 square miles is land and 2 square miles is water.
Economy
The economy of Breathitt County is largely based on agriculture and forestry. The county is home to several large farms, and the main crops grown are corn, soybeans, and tobacco. The county also has a large timber industry, with the main products being hardwood lumber and pulpwood.
The county also has a large coal mining industry, with the main products being bituminous coal and lignite. The county is home to several large coal mines, and the coal industry is the largest employer in the county.
Demographics
As of the 2010 census, the population of Breathitt County was 13,878. The population density was 32 people per square mile. The racial makeup of the county was 97.3% White, 0.7% African American, 0.2% Native American, 0.2% Asian, 0.1% Pacific Islander, 0.5% from other races, and 1.1% from two or more races. Hispanic or Latino of any race were 1.2% of the population.
The median income for a household in the county was $25,945, and the median income for a family was $31,944. The per capita income for the county was $14,945. About 22.2% of the population was below the poverty line.
Conclusion
Breathitt County is located in the Appalachian Mountains of eastern Kentucky. The county is largely rural and is home to a large agricultural and forestry industry. The county also has a large coal mining industry, which is the largest employer in the county. The population of the county is mostly white, with a small percentage of African Americans, Native Americans, and other races. The median income for a household in the county is below the national average, and the poverty rate is higher than the national average.
Common Questions
What is Per Capita Income in Breathitt County?
Per Capita income in Breathitt County is $21,985.
What is the Median Family Income in Breathitt County?
Median Family Income in Breathitt County is $52,216.
What is the Median Household income in Breathitt County?
Median Household Income in Breathitt County is $38,209.
What is Income or Wage Gap in Breathitt County?
Income or Wage Gap in Breathitt County is 23.4%.
Women in Breathitt County earn 76.6 cents for every dollar earned by a man.
What is Family Income Deficit in Breathitt County?
Family Income Deficit in Breathitt County is $11,185.
Families that are below poverty line in Breathitt County earn $11,185 less on average than the poverty threshold level.
What is Inequality or Gini Index in Breathitt County?
Inequality or Gini Index in Breathitt County is 0.46.
What is the Total Population of Breathitt County?
Total Population of Breathitt County is 13,580.
What is the Total Male Population of Breathitt County?
Total Male Population of Breathitt County is 6,865.
What is the Total Female Population of Breathitt County?
Total Female Population of Breathitt County is 6,715.
What is the Ratio of Males per 100 Females in Breathitt County?
There are 102.23 Males per 100 Females in Breathitt County.
What is the Ratio of Females per 100 Males in Breathitt County?
There are 97.82 Females per 100 Males in Breathitt County.
What is the Median Population Age in Breathitt County?
Median Population Age in Breathitt County is 42.7 Years.
What is the Average Family Size in Breathitt County
Average Family Size in Breathitt County is 3.0 People.
What is the Average Household Size in Breathitt County
Average Household Size in Breathitt County is 2.4 People.
How Large is the Labor Force in Breathitt County?
There are 5,000 People in the Labor Forcein in Breathitt County.
What is the Percentage of People in the Labor Force in Breathitt County?
45.1% of People are in the Labor Force in Breathitt County.
What is the Unemployment Rate in Breathitt County?
Unemployment Rate in Breathitt County is 8.9%.