Bracken County, KY Map & Demographics
Bracken County Map
Bracken County Overview
$29,164
PER CAPITA INCOME
$77,524
AVG FAMILY INCOME
$59,911
AVG HOUSEHOLD INCOME
39.5%
WAGE / INCOME GAP [ % ]
60.5¢/ $1
WAGE / INCOME GAP [ $ ]
$13,395
FAMILY INCOME DEFICIT
0.43
INEQUALITY / GINI INDEX
8,420
TOTAL POPULATION
4,238
MALE POPULATION
4,182
FEMALE POPULATION
101.34
MALES / 100 FEMALES
98.68
FEMALES / 100 MALES
41.7
MEDIAN AGE
3.2
AVG FAMILY SIZE
2.7
AVG HOUSEHOLD SIZE
3,952
LABOR FORCE [ PEOPLE ]
59.2%
PERCENT IN LABOR FORCE
6.2%
UNEMPLOYMENT RATE
Bracken County Area Codes
Income in Bracken County
Income Overview in Bracken County
Per Capita Income in Bracken County is $29,164, while median incomes of families and households are $77,524 and $59,911 respectively.
| Characteristic | Number | Measure |
| Per Capita Income | 8,420 | $29,164 |
| Median Family Income | 2,227 | $77,524 |
| Mean Family Income | 2,227 | $86,881 |
| Median Household Income | 3,138 | $59,911 |
| Mean Household Income | 3,138 | $78,058 |
| Income Deficit | 2,227 | $13,395 |
| Wage / Income Gap (%) | 8,420 | 39.55% |
| Wage / Income Gap ($) | 8,420 | 60.45¢ per $1 |
| Gini / Inequality Index | 8,420 | 0.43 |
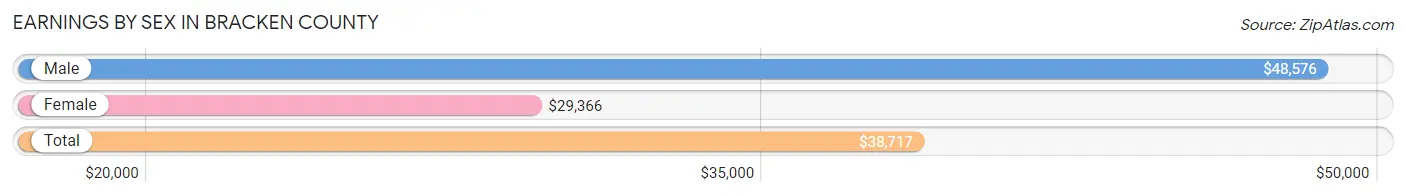
Earnings by Sex in Bracken County
Average Earnings in Bracken County are $38,717, $48,576 for men and $29,366 for women, a difference of 39.6%.
| Sex | Number | Average Earnings |
| Male | 2,231 (53.2%) | $48,576 |
| Female | 1,963 (46.8%) | $29,366 |
| Total | 4,194 (100.0%) | $38,717 |
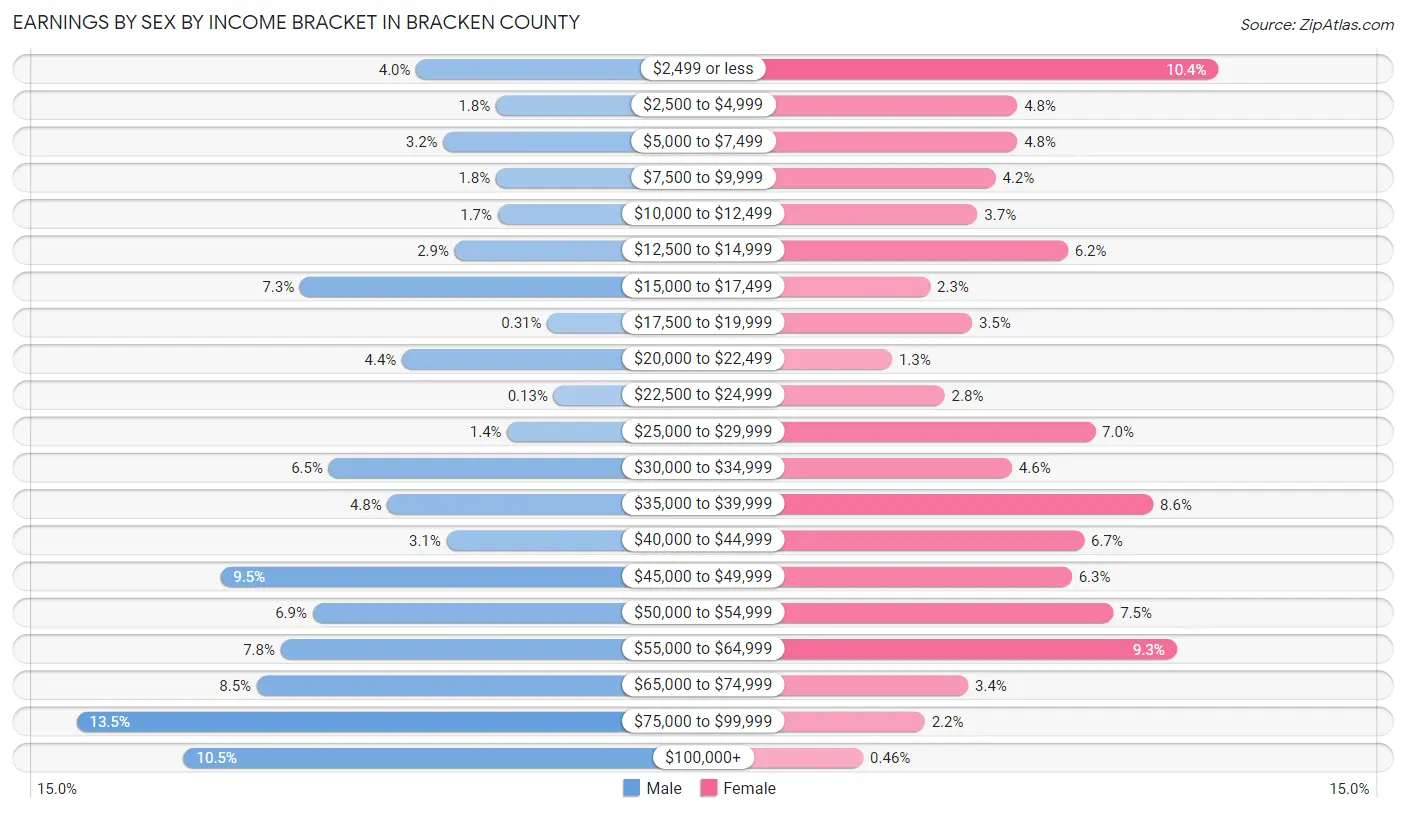
Earnings by Sex by Income Bracket in Bracken County
The most common earnings brackets in Bracken County are $75,000 to $99,999 for men (302 | 13.5%) and $2,499 or less for women (205 | 10.4%).
| Income | Male | Female |
| $2,499 or less | 89 (4.0%) | 205 (10.4%) |
| $2,500 to $4,999 | 39 (1.8%) | 94 (4.8%) |
| $5,000 to $7,499 | 72 (3.2%) | 94 (4.8%) |
| $7,500 to $9,999 | 39 (1.8%) | 82 (4.2%) |
| $10,000 to $12,499 | 38 (1.7%) | 72 (3.7%) |
| $12,500 to $14,999 | 65 (2.9%) | 122 (6.2%) |
| $15,000 to $17,499 | 162 (7.3%) | 46 (2.3%) |
| $17,500 to $19,999 | 7 (0.3%) | 69 (3.5%) |
| $20,000 to $22,499 | 98 (4.4%) | 25 (1.3%) |
| $22,500 to $24,999 | 3 (0.1%) | 54 (2.8%) |
| $25,000 to $29,999 | 32 (1.4%) | 137 (7.0%) |
| $30,000 to $34,999 | 144 (6.5%) | 91 (4.6%) |
| $35,000 to $39,999 | 107 (4.8%) | 169 (8.6%) |
| $40,000 to $44,999 | 70 (3.1%) | 131 (6.7%) |
| $45,000 to $49,999 | 212 (9.5%) | 124 (6.3%) |
| $50,000 to $54,999 | 154 (6.9%) | 147 (7.5%) |
| $55,000 to $64,999 | 174 (7.8%) | 182 (9.3%) |
| $65,000 to $74,999 | 189 (8.5%) | 67 (3.4%) |
| $75,000 to $99,999 | 302 (13.5%) | 43 (2.2%) |
| $100,000+ | 235 (10.5%) | 9 (0.5%) |
| Total | 2,231 (100.0%) | 1,963 (100.0%) |
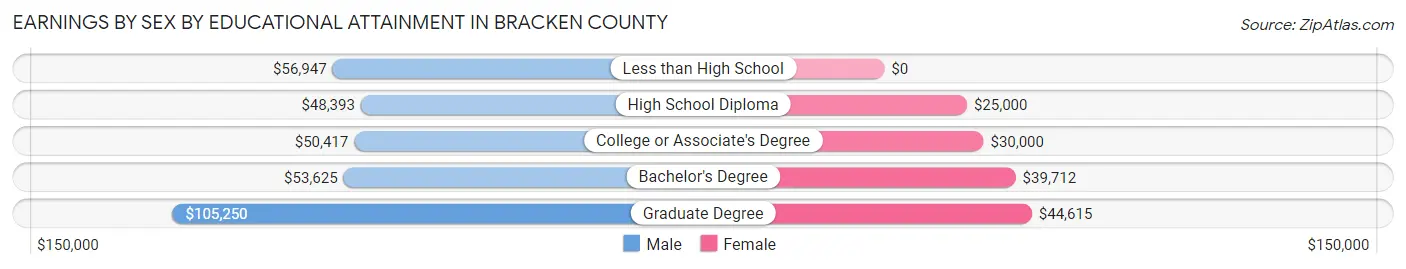
Earnings by Sex by Educational Attainment in Bracken County
Average earnings in Bracken County are $51,690 for men and $35,263 for women, a difference of 31.8%. Men with an educational attainment of graduate degree enjoy the highest average annual earnings of $105,250, while those with high school diploma education earn the least with $48,393. Women with an educational attainment of graduate degree earn the most with the average annual earnings of $44,615, while those with high school diploma education have the smallest earnings of $25,000.
| Educational Attainment | Male Income | Female Income |
| Less than High School | $56,947 | $0 |
| High School Diploma | $48,393 | $25,000 |
| College or Associate's Degree | $50,417 | $30,000 |
| Bachelor's Degree | $53,625 | $39,712 |
| Graduate Degree | $105,250 | $44,615 |
| Total | $51,690 | $35,263 |
Family Income in Bracken County
Family Income Brackets in Bracken County
According to the Bracken County family income data, there are 494 families falling into the $100,000 to $149,999 income range, which is the most common income bracket and makes up 22.2% of all families. Conversely, the $10,000 to $14,999 income bracket is the least frequent group with only 38 families (1.7%) belonging to this category.
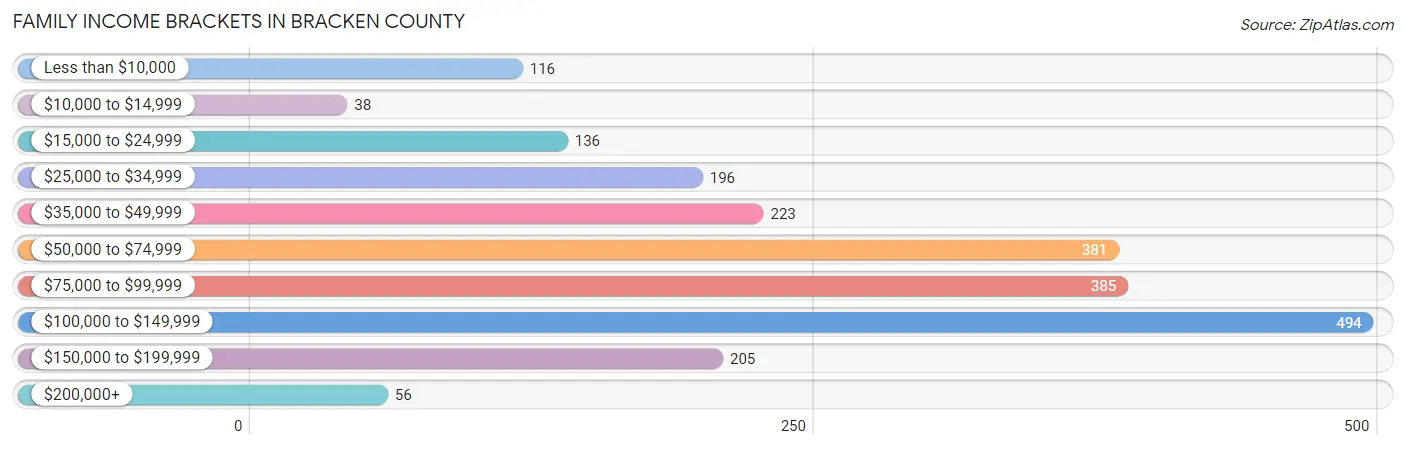
| Income Bracket | # Families | % Families |
| Less than $10,000 | 116 | 5.2% |
| $10,000 to $14,999 | 38 | 1.7% |
| $15,000 to $24,999 | 136 | 6.1% |
| $25,000 to $34,999 | 196 | 8.8% |
| $35,000 to $49,999 | 223 | 10.0% |
| $50,000 to $74,999 | 381 | 17.1% |
| $75,000 to $99,999 | 385 | 17.3% |
| $100,000 to $149,999 | 494 | 22.2% |
| $150,000 to $199,999 | 205 | 9.2% |
| $200,000+ | 56 | 2.5% |
Family Income by Famaliy Size in Bracken County
4-person families (336 | 15.1%) account for the highest median family income in Bracken County with $103,068 per family, while 2-person families (1,099 | 49.3%) have the highest median income of $34,420 per family member.
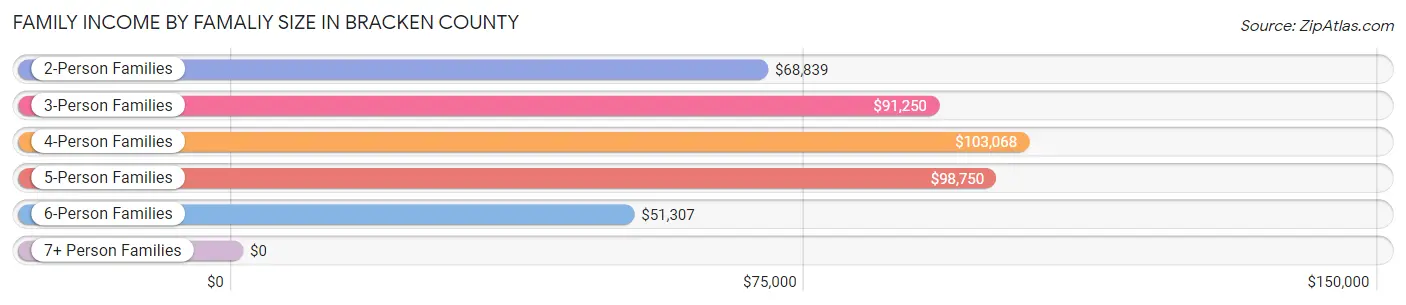
| Income Bracket | # Families | Median Income |
| 2-Person Families | 1,099 (49.3%) | $68,839 |
| 3-Person Families | 485 (21.8%) | $91,250 |
| 4-Person Families | 336 (15.1%) | $103,068 |
| 5-Person Families | 158 (7.1%) | $98,750 |
| 6-Person Families | 77 (3.5%) | $51,307 |
| 7+ Person Families | 72 (3.2%) | $0 |
| Total | 2,227 (100.0%) | $77,524 |
Family Income by Number of Earners in Bracken County
The median family income in Bracken County is $77,524, with families comprising 3+ earners (274) having the highest median family income of $122,014, while families with no earners (439) have the lowest median family income of $26,308, accounting for 12.3% and 19.7% of families, respectively.
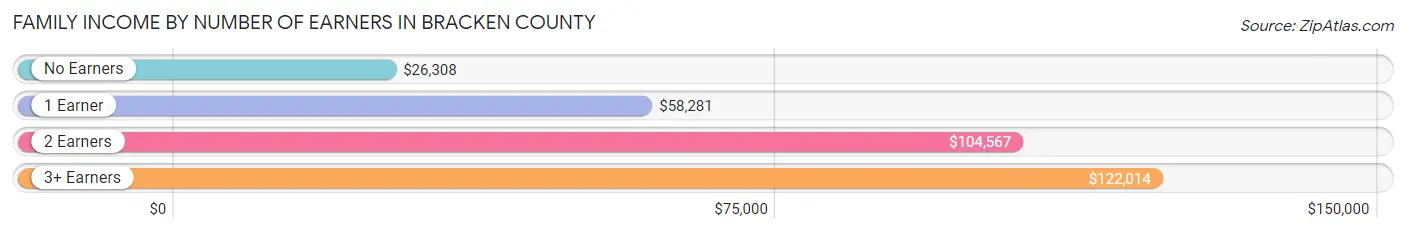
| Number of Earners | # Families | Median Income |
| No Earners | 439 (19.7%) | $26,308 |
| 1 Earner | 609 (27.4%) | $58,281 |
| 2 Earners | 905 (40.6%) | $104,567 |
| 3+ Earners | 274 (12.3%) | $122,014 |
| Total | 2,227 (100.0%) | $77,524 |
Household Income in Bracken County
Household Income Brackets in Bracken County
With 552 households falling in the category, the $50,000 to $74,999 income range is the most frequent in Bracken County, accounting for 17.6% of all households. In contrast, only 78 households (2.5%) fall into the $200,000+ income bracket, making it the least populous group.
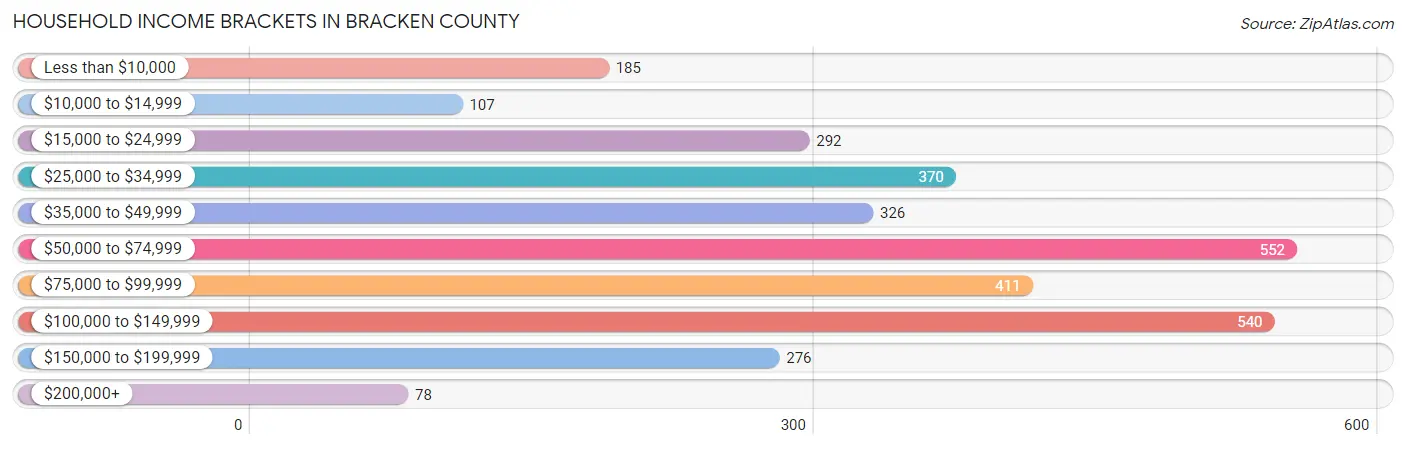
| Income Bracket | # Households | % Households |
| Less than $10,000 | 185 | 5.9% |
| $10,000 to $14,999 | 107 | 3.4% |
| $15,000 to $24,999 | 292 | 9.3% |
| $25,000 to $34,999 | 370 | 11.8% |
| $35,000 to $49,999 | 326 | 10.4% |
| $50,000 to $74,999 | 552 | 17.6% |
| $75,000 to $99,999 | 411 | 13.1% |
| $100,000 to $149,999 | 540 | 17.2% |
| $150,000 to $199,999 | 276 | 8.8% |
| $200,000+ | 78 | 2.5% |
Household Income by Householder Age in Bracken County
The median household income in Bracken County is $59,911, with the highest median household income of $82,273 found in the 25 to 44 years age bracket for the primary householder. A total of 778 households (24.8%) fall into this category. Meanwhile, the 65+ years age bracket for the primary householder has the lowest median household income of $39,255, with 961 households (30.6%) in this group.
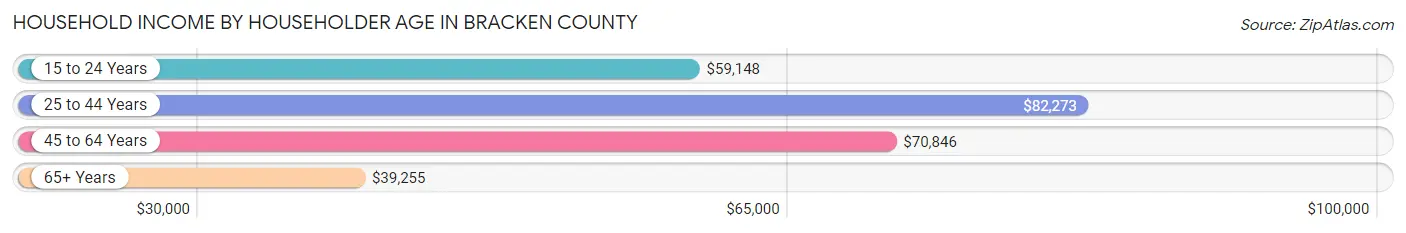
| Income Bracket | # Households | Median Income |
| 15 to 24 Years | 58 (1.8%) | $59,148 |
| 25 to 44 Years | 778 (24.8%) | $82,273 |
| 45 to 64 Years | 1,341 (42.7%) | $70,846 |
| 65+ Years | 961 (30.6%) | $39,255 |
| Total | 3,138 (100.0%) | $59,911 |
Poverty in Bracken County
Income Below Poverty by Sex and Age in Bracken County
With 14.6% poverty level for males and 19.4% for females among the residents of Bracken County, 16 and 17 year old males and 15 year old females are the most vulnerable to poverty, with 63 males (62.4%) and 34 females (100.0%) in their respective age groups living below the poverty level.
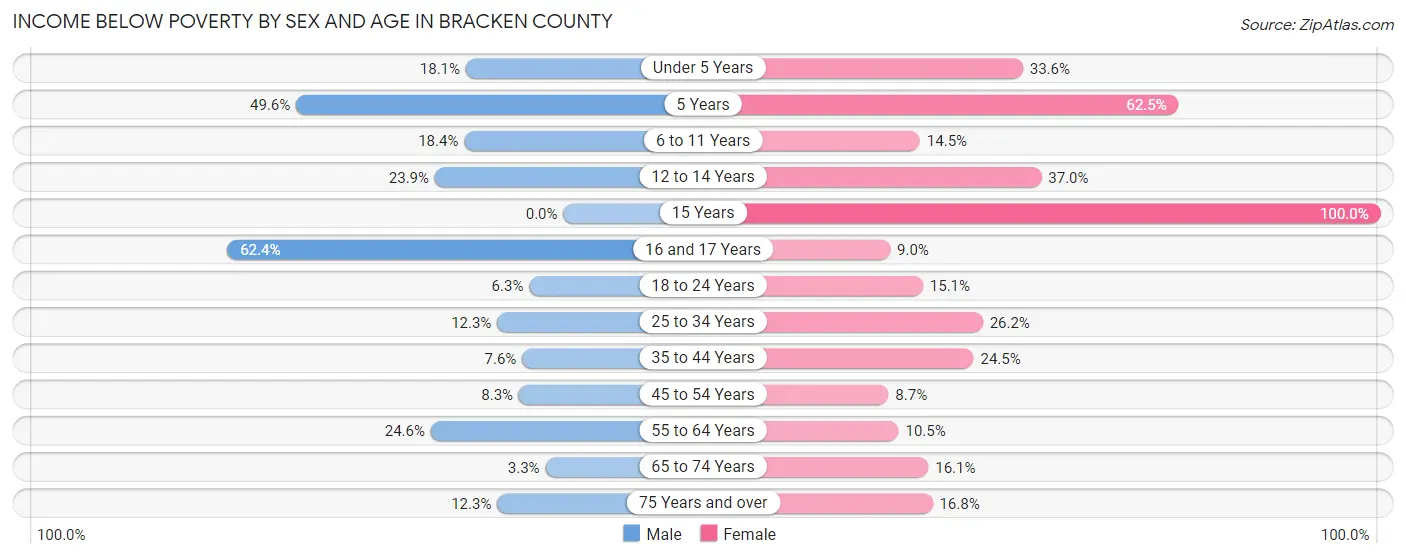
| Age Bracket | Male | Female |
| Under 5 Years | 42 (18.1%) | 88 (33.6%) |
| 5 Years | 62 (49.6%) | 15 (62.5%) |
| 6 to 11 Years | 53 (18.4%) | 39 (14.5%) |
| 12 to 14 Years | 26 (23.8%) | 80 (37.0%) |
| 15 Years | 0 (0.0%) | 34 (100.0%) |
| 16 and 17 Years | 63 (62.4%) | 12 (9.0%) |
| 18 to 24 Years | 21 (6.3%) | 45 (15.0%) |
| 25 to 34 Years | 55 (12.3%) | 136 (26.2%) |
| 35 to 44 Years | 43 (7.6%) | 122 (24.4%) |
| 45 to 54 Years | 47 (8.3%) | 46 (8.6%) |
| 55 to 64 Years | 153 (24.6%) | 65 (10.5%) |
| 65 to 74 Years | 15 (3.3%) | 70 (16.1%) |
| 75 Years and over | 27 (12.3%) | 51 (16.8%) |
| Total | 607 (14.6%) | 803 (19.4%) |
Income Above Poverty by Sex and Age in Bracken County
According to the poverty statistics in Bracken County, males aged 15 years and females aged 45 to 54 years are the age groups that are most secure financially, with 100.0% of males and 91.3% of females in these age groups living above the poverty line.
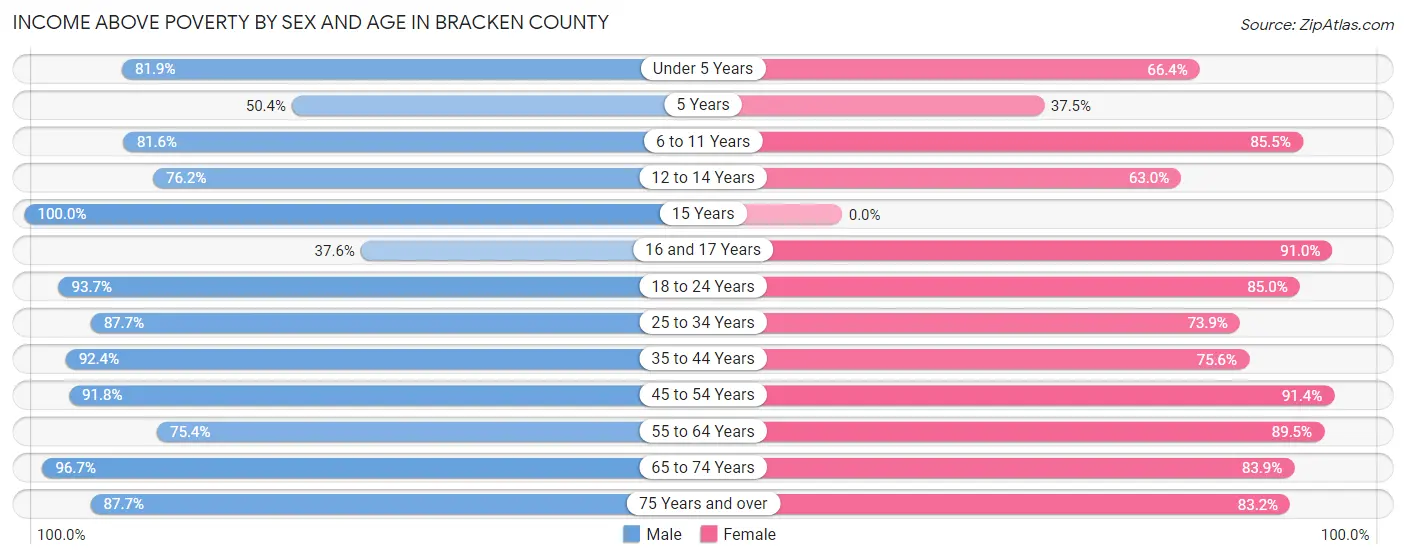
| Age Bracket | Male | Female |
| Under 5 Years | 190 (81.9%) | 174 (66.4%) |
| 5 Years | 63 (50.4%) | 9 (37.5%) |
| 6 to 11 Years | 235 (81.6%) | 230 (85.5%) |
| 12 to 14 Years | 83 (76.1%) | 136 (63.0%) |
| 15 Years | 106 (100.0%) | 0 (0.0%) |
| 16 and 17 Years | 38 (37.6%) | 122 (91.0%) |
| 18 to 24 Years | 311 (93.7%) | 254 (85.0%) |
| 25 to 34 Years | 393 (87.7%) | 384 (73.9%) |
| 35 to 44 Years | 520 (92.4%) | 377 (75.5%) |
| 45 to 54 Years | 523 (91.7%) | 486 (91.3%) |
| 55 to 64 Years | 469 (75.4%) | 552 (89.5%) |
| 65 to 74 Years | 436 (96.7%) | 366 (83.9%) |
| 75 Years and over | 193 (87.7%) | 252 (83.2%) |
| Total | 3,560 (85.4%) | 3,342 (80.6%) |
Income Below Poverty Among Married-Couple Families in Bracken County
The poverty statistics for married-couple families in Bracken County show that 6.0% or 101 of the total 1,684 families live below the poverty line. Families with 5 or more children have the highest poverty rate of 38.5%, comprising of 5 families. On the other hand, families with 1 or 2 children have the lowest poverty rate of 1.1%, which includes 4 families.
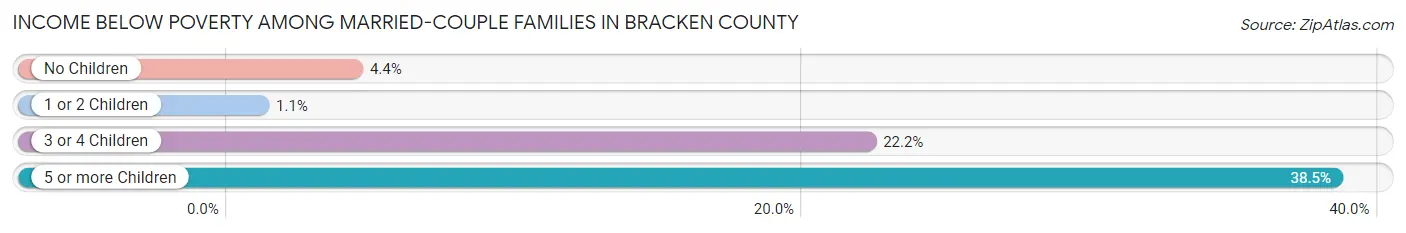
| Children | Above Poverty | Below Poverty |
| No Children | 1,055 (95.7%) | 48 (4.3%) |
| 1 or 2 Children | 366 (98.9%) | 4 (1.1%) |
| 3 or 4 Children | 154 (77.8%) | 44 (22.2%) |
| 5 or more Children | 8 (61.5%) | 5 (38.5%) |
| Total | 1,583 (94.0%) | 101 (6.0%) |
Income Below Poverty Among Single-Parent Households in Bracken County
According to the poverty data in Bracken County, 14.2% or 29 single-father households and 37.2% or 126 single-mother households are living below the poverty line. Among single-father households, those with 3 or 4 children have the highest poverty rate, with 12 households (66.7%) experiencing poverty. Likewise, among single-mother households, those with 1 or 2 children have the highest poverty rate, with 80 households (39.2%) falling below the poverty line.
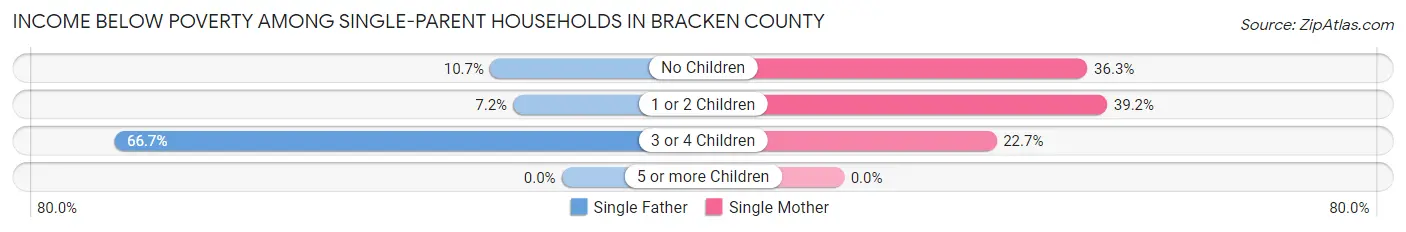
| Children | Single Father | Single Mother |
| No Children | 11 (10.7%) | 41 (36.3%) |
| 1 or 2 Children | 6 (7.2%) | 80 (39.2%) |
| 3 or 4 Children | 12 (66.7%) | 5 (22.7%) |
| 5 or more Children | 0 (0.0%) | 0 (0.0%) |
| Total | 29 (14.2%) | 126 (37.2%) |
Income Below Poverty Among Married-Couple vs Single-Parent Households in Bracken County
The poverty data for Bracken County shows that 101 of the married-couple family households (6.0%) and 155 of the single-parent households (28.5%) are living below the poverty level. Within the married-couple family households, those with 5 or more children have the highest poverty rate, with 5 households (38.5%) falling below the poverty line. Among the single-parent households, those with 3 or 4 children have the highest poverty rate, with 17 household (42.5%) living below poverty.
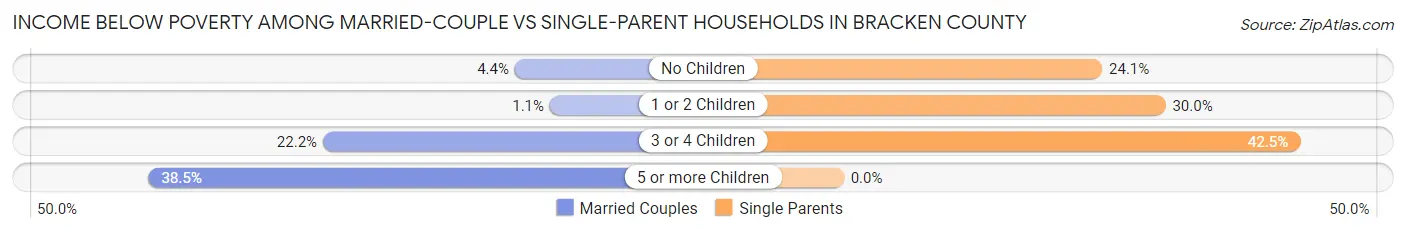
| Children | Married-Couple Families | Single-Parent Households |
| No Children | 48 (4.3%) | 52 (24.1%) |
| 1 or 2 Children | 4 (1.1%) | 86 (30.0%) |
| 3 or 4 Children | 44 (22.2%) | 17 (42.5%) |
| 5 or more Children | 5 (38.5%) | 0 (0.0%) |
| Total | 101 (6.0%) | 155 (28.5%) |
Race in Bracken County
The most populous races in Bracken County are White / Caucasian (8,090 | 96.1%), Native / Alaskan (134 | 1.6%), and Black / African American (115 | 1.4%).
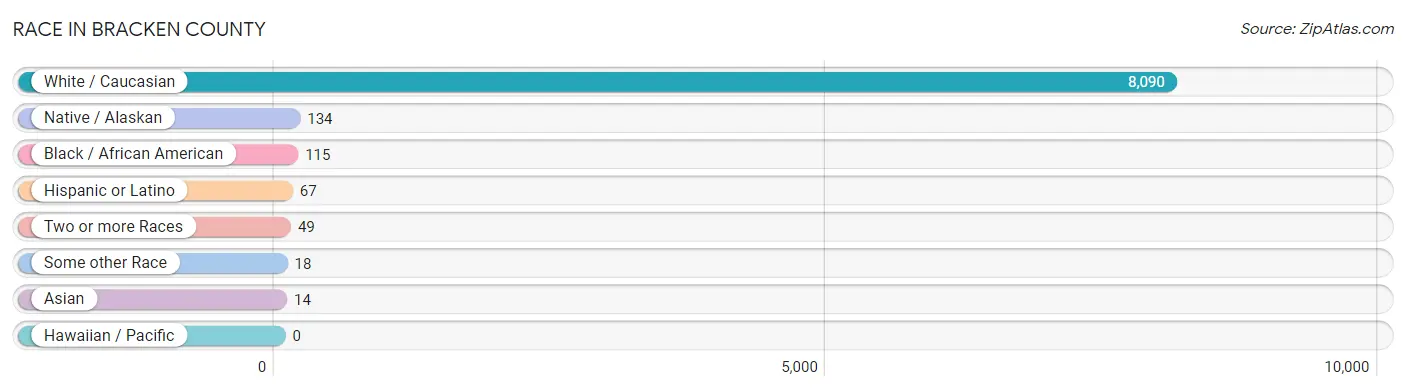
| Race | # Population | % Population |
| Asian | 14 | 0.2% |
| Black / African American | 115 | 1.4% |
| Hawaiian / Pacific | 0 | 0.0% |
| Hispanic or Latino | 67 | 0.8% |
| Native / Alaskan | 134 | 1.6% |
| White / Caucasian | 8,090 | 96.1% |
| Two or more Races | 49 | 0.6% |
| Some other Race | 18 | 0.2% |
| Total | 8,420 | 100.0% |
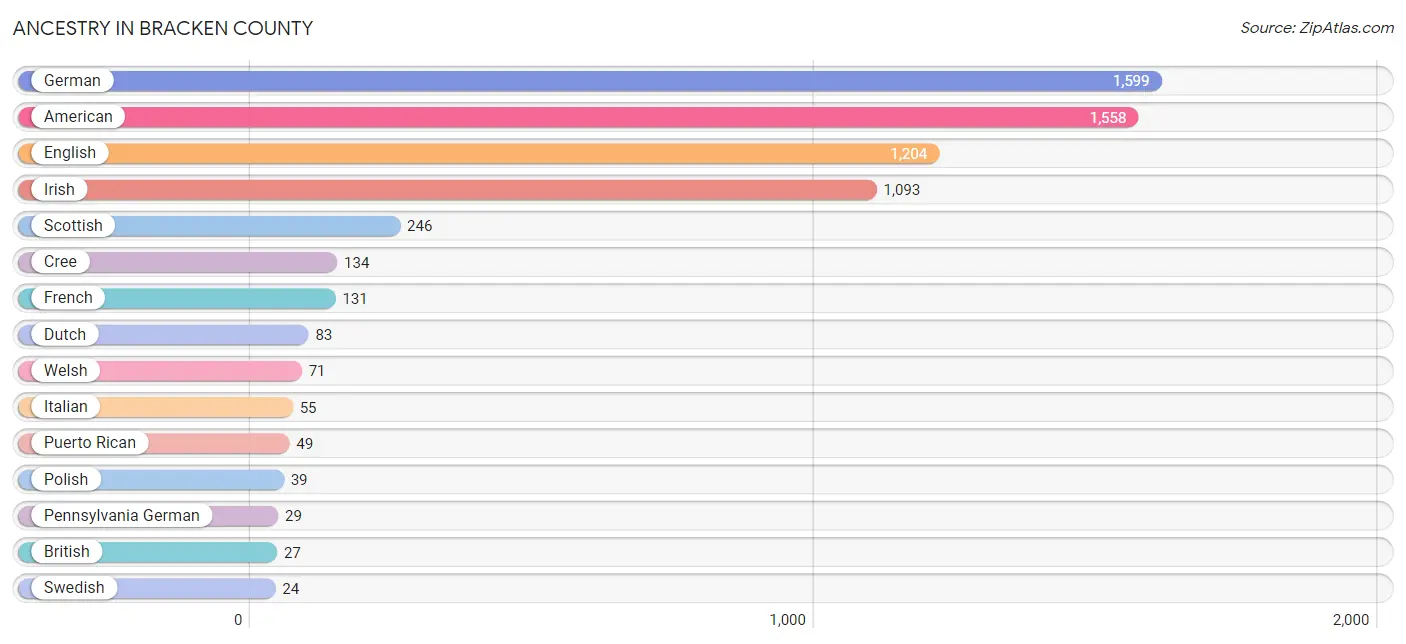
Ancestry in Bracken County
The most populous ancestries reported in Bracken County are German (1,599 | 19.0%), American (1,558 | 18.5%), English (1,204 | 14.3%), Irish (1,093 | 13.0%), and Scottish (246 | 2.9%), together accounting for 67.7% of all Bracken County residents.
| Ancestry | # Population | % Population |
| American | 1,558 | 18.5% |
| Arab | 16 | 0.2% |
| British | 27 | 0.3% |
| Celtic | 12 | 0.1% |
| Central American | 18 | 0.2% |
| Cree | 134 | 1.6% |
| Dutch | 83 | 1.0% |
| Eastern European | 2 | 0.0% |
| English | 1,204 | 14.3% |
| European | 5 | 0.1% |
| French | 131 | 1.6% |
| German | 1,599 | 19.0% |
| Greek | 11 | 0.1% |
| Guatemalan | 18 | 0.2% |
| Hungarian | 10 | 0.1% |
| Indian (Asian) | 14 | 0.2% |
| Iranian | 10 | 0.1% |
| Irish | 1,093 | 13.0% |
| Italian | 55 | 0.6% |
| Latvian | 7 | 0.1% |
| New Zealander | 7 | 0.1% |
| Norwegian | 9 | 0.1% |
| Pennsylvania German | 29 | 0.3% |
| Polish | 39 | 0.5% |
| Puerto Rican | 49 | 0.6% |
| Russian | 21 | 0.3% |
| Scotch-Irish | 17 | 0.2% |
| Scottish | 246 | 2.9% |
| Slavic | 3 | 0.0% |
| Slovene | 10 | 0.1% |
| Swedish | 24 | 0.3% |
| Swiss | 8 | 0.1% |
| Welsh | 71 | 0.8% | View All 33 Rows |
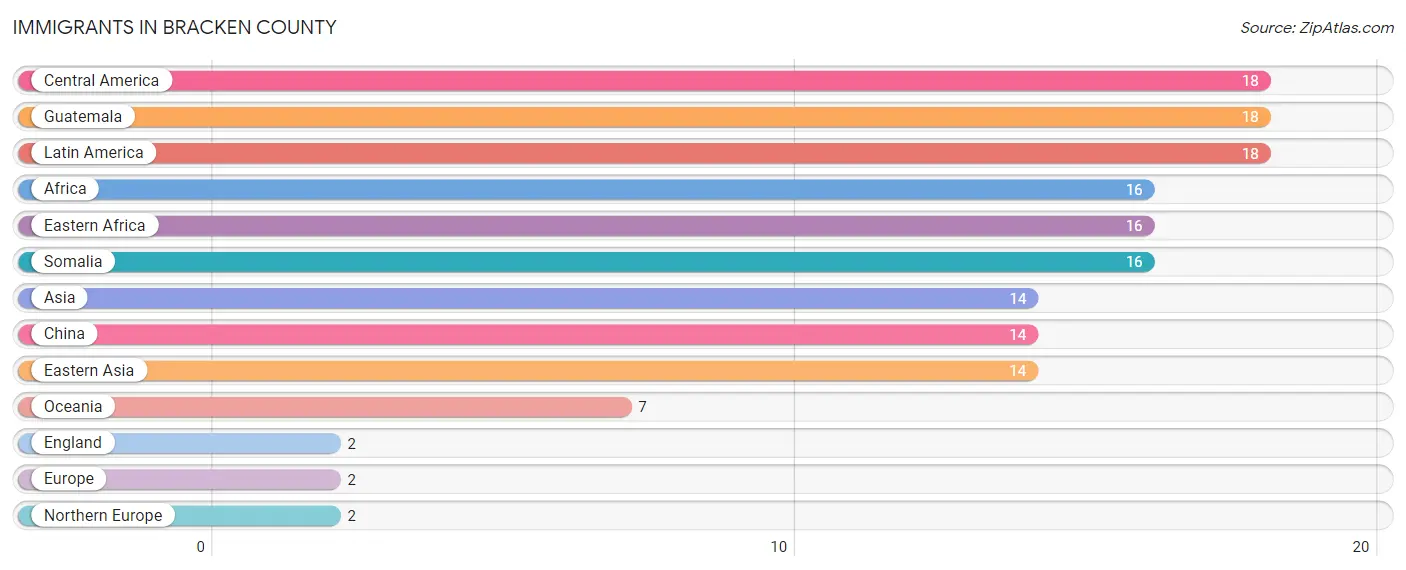
Immigrants in Bracken County
The most numerous immigrant groups reported in Bracken County came from Central America (18 | 0.2%), Guatemala (18 | 0.2%), Latin America (18 | 0.2%), Africa (16 | 0.2%), and Eastern Africa (16 | 0.2%), together accounting for 1.0% of all Bracken County residents.
| Immigration Origin | # Population | % Population |
| Africa | 16 | 0.2% |
| Asia | 14 | 0.2% |
| Central America | 18 | 0.2% |
| China | 14 | 0.2% |
| Eastern Africa | 16 | 0.2% |
| Eastern Asia | 14 | 0.2% |
| England | 2 | 0.0% |
| Europe | 2 | 0.0% |
| Guatemala | 18 | 0.2% |
| Latin America | 18 | 0.2% |
| Northern Europe | 2 | 0.0% |
| Oceania | 7 | 0.1% |
| Somalia | 16 | 0.2% | View All 13 Rows |
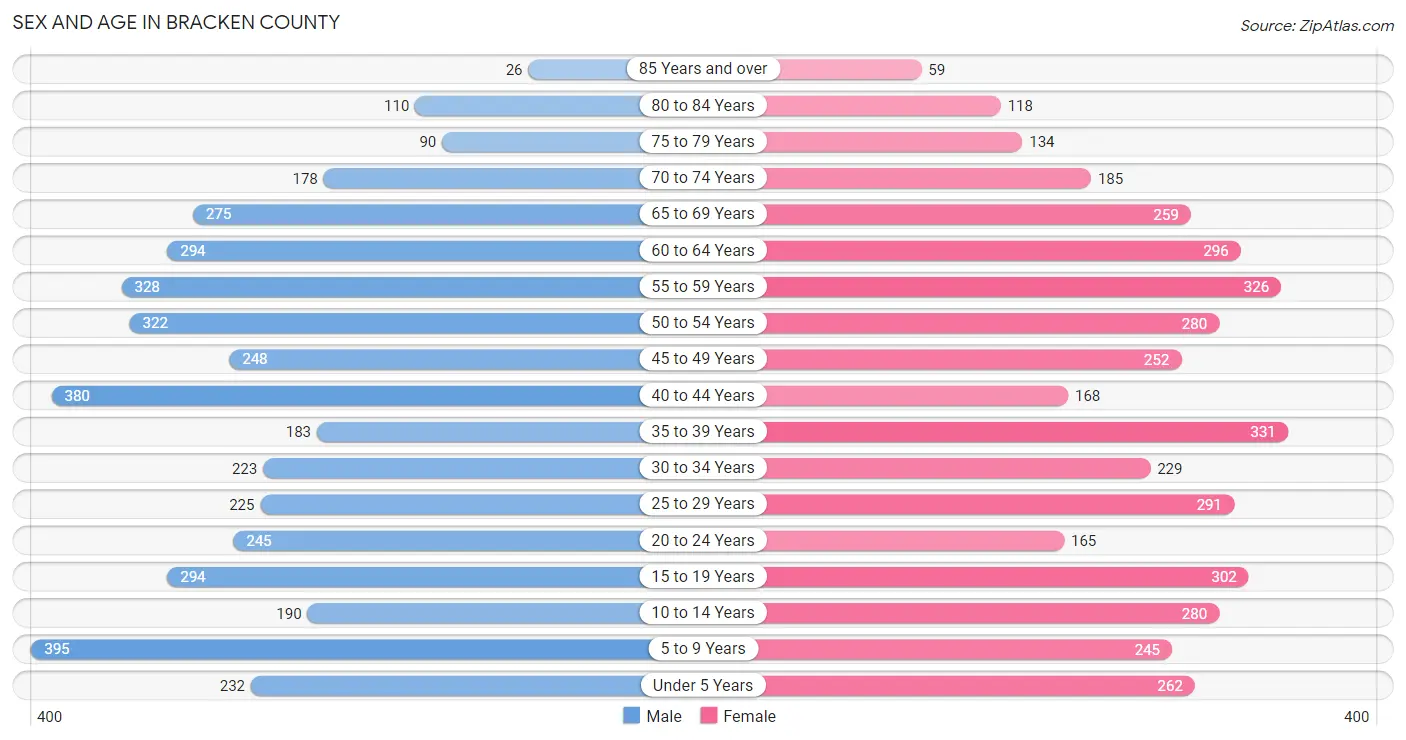
Sex and Age in Bracken County
Sex and Age in Bracken County
The most populous age groups in Bracken County are 5 to 9 Years (395 | 9.3%) for men and 35 to 39 Years (331 | 7.9%) for women.
| Age Bracket | Male | Female |
| Under 5 Years | 232 (5.5%) | 262 (6.3%) |
| 5 to 9 Years | 395 (9.3%) | 245 (5.9%) |
| 10 to 14 Years | 190 (4.5%) | 280 (6.7%) |
| 15 to 19 Years | 294 (6.9%) | 302 (7.2%) |
| 20 to 24 Years | 245 (5.8%) | 165 (4.0%) |
| 25 to 29 Years | 225 (5.3%) | 291 (7.0%) |
| 30 to 34 Years | 223 (5.3%) | 229 (5.5%) |
| 35 to 39 Years | 183 (4.3%) | 331 (7.9%) |
| 40 to 44 Years | 380 (9.0%) | 168 (4.0%) |
| 45 to 49 Years | 248 (5.9%) | 252 (6.0%) |
| 50 to 54 Years | 322 (7.6%) | 280 (6.7%) |
| 55 to 59 Years | 328 (7.7%) | 326 (7.8%) |
| 60 to 64 Years | 294 (6.9%) | 296 (7.1%) |
| 65 to 69 Years | 275 (6.5%) | 259 (6.2%) |
| 70 to 74 Years | 178 (4.2%) | 185 (4.4%) |
| 75 to 79 Years | 90 (2.1%) | 134 (3.2%) |
| 80 to 84 Years | 110 (2.6%) | 118 (2.8%) |
| 85 Years and over | 26 (0.6%) | 59 (1.4%) |
| Total | 4,238 (100.0%) | 4,182 (100.0%) |
Families and Households in Bracken County
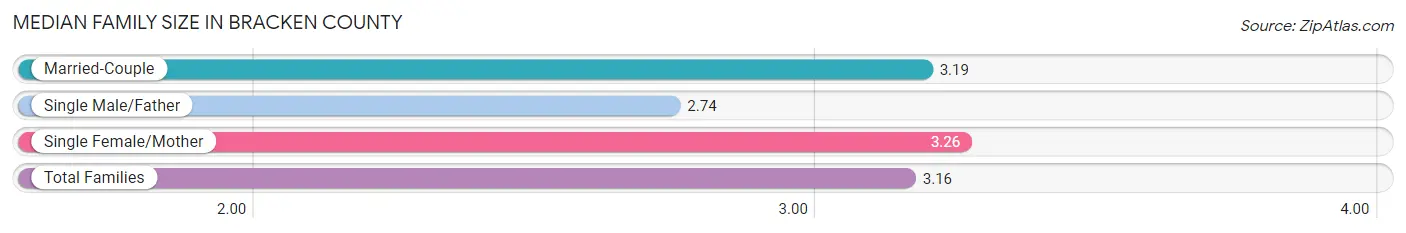
Median Family Size in Bracken County
The median family size in Bracken County is 3.16 persons per family, with single female/mother families (339 | 15.2%) accounting for the largest median family size of 3.26 persons per family. On the other hand, single male/father families (204 | 9.2%) represent the smallest median family size with 2.74 persons per family.
| Family Type | # Families | Family Size |
| Married-Couple | 1,684 (75.6%) | 3.19 |
| Single Male/Father | 204 (9.2%) | 2.74 |
| Single Female/Mother | 339 (15.2%) | 3.26 |
| Total Families | 2,227 (100.0%) | 3.16 |
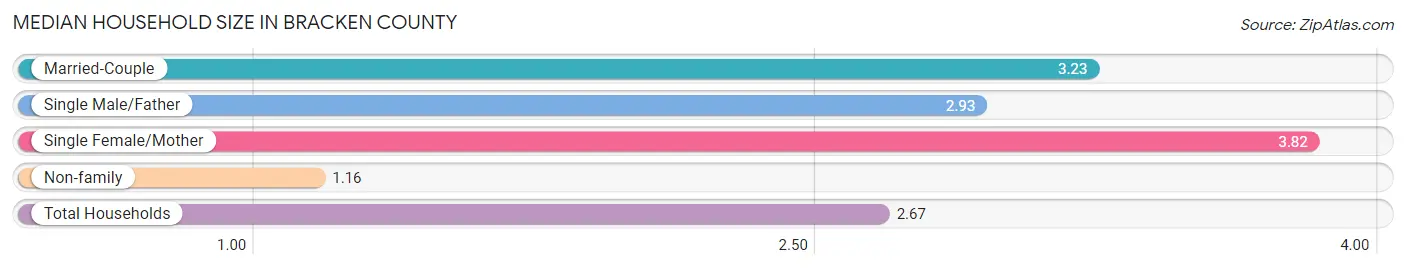
Median Household Size in Bracken County
The median household size in Bracken County is 2.67 persons per household, with single female/mother households (339 | 10.8%) accounting for the largest median household size of 3.82 persons per household. non-family households (911 | 29.0%) represent the smallest median household size with 1.16 persons per household.
| Household Type | # Households | Household Size |
| Married-Couple | 1,684 (53.7%) | 3.23 |
| Single Male/Father | 204 (6.5%) | 2.93 |
| Single Female/Mother | 339 (10.8%) | 3.82 |
| Non-family | 911 (29.0%) | 1.16 |
| Total Households | 3,138 (100.0%) | 2.67 |
Household Size by Marriage Status in Bracken County
Out of a total of 3,138 households in Bracken County, 2,227 (71.0%) are family households, while 911 (29.0%) are nonfamily households. The most numerous type of family households are 2-person households, comprising 1,036, and the most common type of nonfamily households are 1-person households, comprising 757.
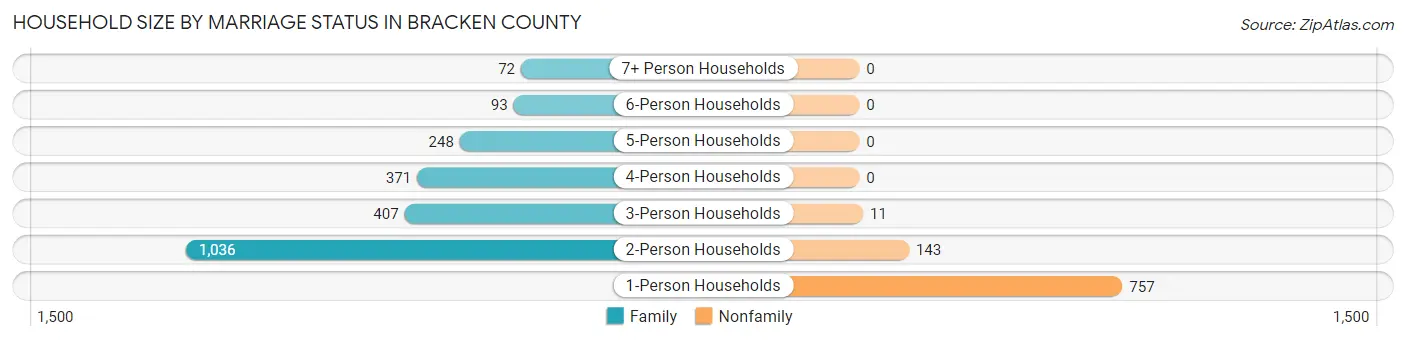
| Household Size | Family Households | Nonfamily Households |
| 1-Person Households | - | 757 (24.1%) |
| 2-Person Households | 1,036 (33.0%) | 143 (4.6%) |
| 3-Person Households | 407 (13.0%) | 11 (0.4%) |
| 4-Person Households | 371 (11.8%) | 0 (0.0%) |
| 5-Person Households | 248 (7.9%) | 0 (0.0%) |
| 6-Person Households | 93 (3.0%) | 0 (0.0%) |
| 7+ Person Households | 72 (2.3%) | 0 (0.0%) |
| Total | 2,227 (71.0%) | 911 (29.0%) |
Female Fertility in Bracken County
Fertility by Age in Bracken County
Average fertility rate in Bracken County is 45.0 births per 1,000 women. Women in the age bracket of 20 to 34 years have the highest fertility rate with 73.0 births per 1,000 women. Women in the age bracket of 20 to 34 years acount for 62.5% of all women with births.
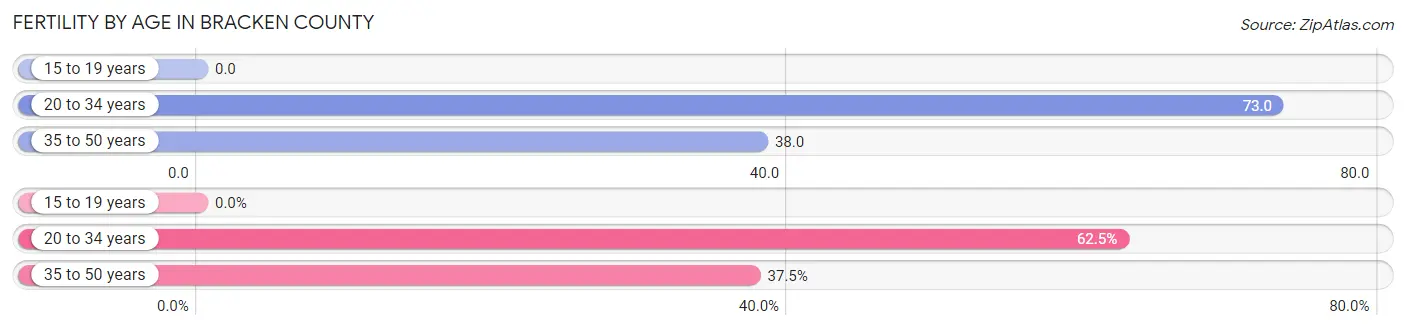
| Age Bracket | Women with Births | Births / 1,000 Women |
| 15 to 19 years | 0 (0.0%) | 0.0 |
| 20 to 34 years | 50 (62.5%) | 73.0 |
| 35 to 50 years | 30 (37.5%) | 38.0 |
| Total | 80 (100.0%) | 45.0 |
Fertility by Age by Marriage Status in Bracken County
87.5% of women with births (80) in Bracken County are married. The highest percentage of unmarried women with births falls into 20 to 34 years age bracket with 20.0% of them unmarried at the time of birth, while the lowest percentage of unmarried women with births belong to 35 to 50 years age bracket with 0.0% of them unmarried.
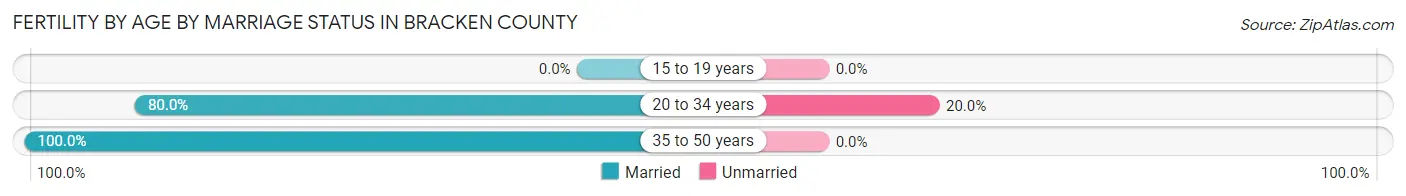
| Age Bracket | Married | Unmarried |
| 15 to 19 years | 0 (0.0%) | 0 (0.0%) |
| 20 to 34 years | 40 (80.0%) | 10 (20.0%) |
| 35 to 50 years | 30 (100.0%) | 0 (0.0%) |
| Total | 70 (87.5%) | 10 (12.5%) |
Fertility by Education in Bracken County
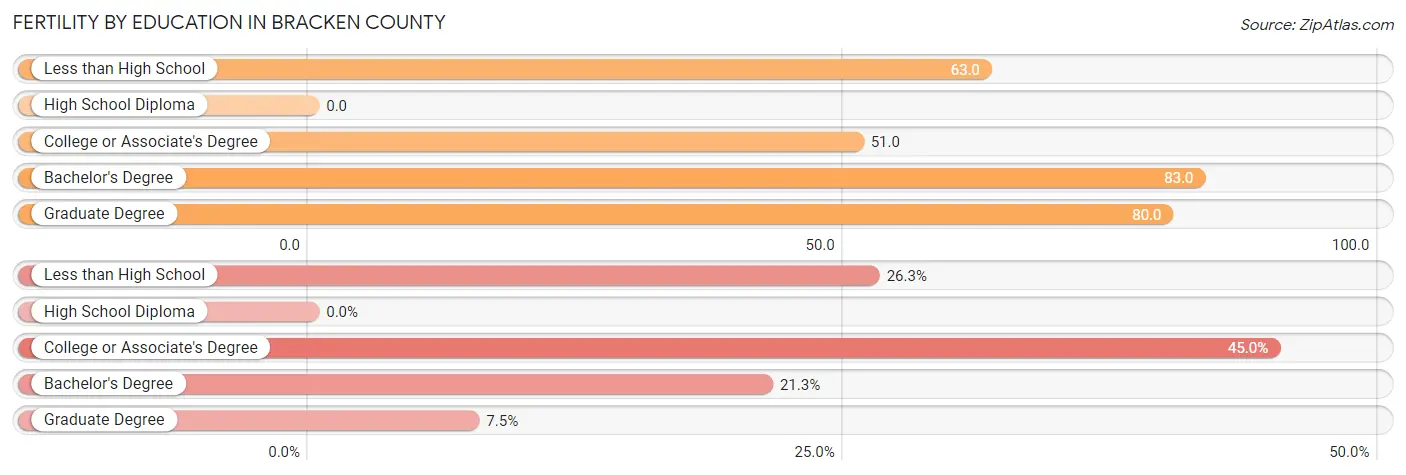
| Educational Attainment | Women with Births | Births / 1,000 Women |
| Less than High School | 21 (26.3%) | 63.0 |
| High School Diploma | 0 (0.0%) | 0.0 |
| College or Associate's Degree | 36 (45.0%) | 51.0 |
| Bachelor's Degree | 17 (21.2%) | 83.0 |
| Graduate Degree | 6 (7.5%) | 80.0 |
| Total | 80 (100.0%) | 45.0 |
Fertility by Education by Marriage Status in Bracken County
12.5% of women with births in Bracken County are unmarried. Women with the educational attainment of less than high school are most likely to be married with 100.0% of them married at childbirth, while women with the educational attainment of college or associate's degree are least likely to be married with 27.8% of them unmarried at childbirth.
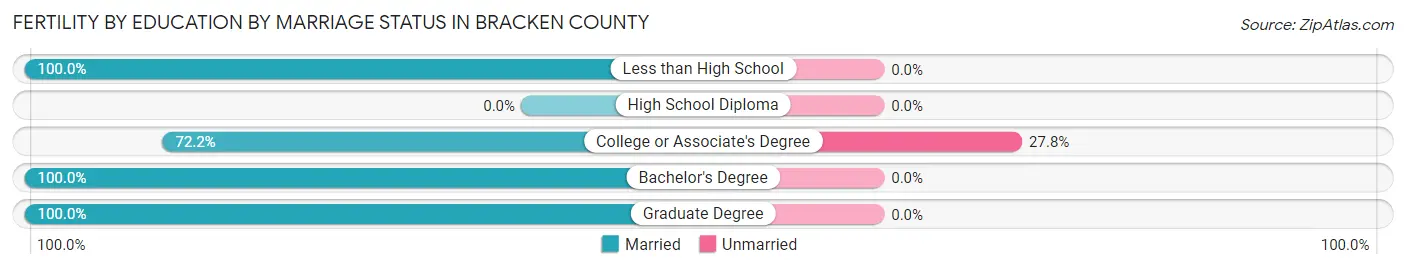
| Educational Attainment | Married | Unmarried |
| Less than High School | 21 (100.0%) | 0 (0.0%) |
| High School Diploma | 0 (0.0%) | 0 (0.0%) |
| College or Associate's Degree | 26 (72.2%) | 10 (27.8%) |
| Bachelor's Degree | 17 (100.0%) | 0 (0.0%) |
| Graduate Degree | 6 (100.0%) | 0 (0.0%) |
| Total | 70 (87.5%) | 10 (12.5%) |
Employment Characteristics in Bracken County
Employment by Class of Employer in Bracken County
Among the 3,557 employed individuals in Bracken County, private company employees (2,496 | 70.2%), not-for-profit organizations (303 | 8.5%), and self-employed (not incorporated) (252 | 7.1%) make up the most common classes of employment.
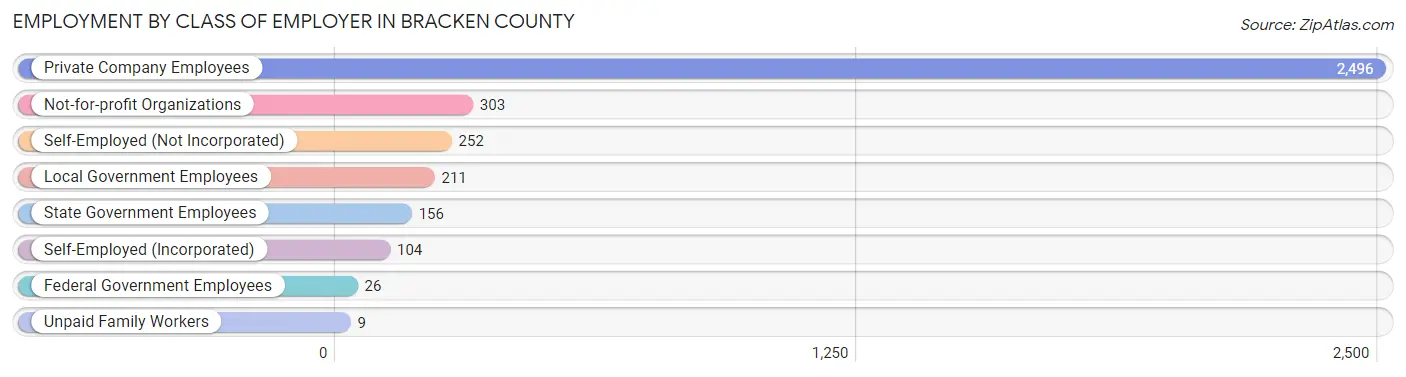
| Employer Class | # Employees | % Employees |
| Private Company Employees | 2,496 | 70.2% |
| Self-Employed (Incorporated) | 104 | 2.9% |
| Self-Employed (Not Incorporated) | 252 | 7.1% |
| Not-for-profit Organizations | 303 | 8.5% |
| Local Government Employees | 211 | 5.9% |
| State Government Employees | 156 | 4.4% |
| Federal Government Employees | 26 | 0.7% |
| Unpaid Family Workers | 9 | 0.3% |
| Total | 3,557 | 100.0% |
Employment Status by Age in Bracken County
According to the labor force statistics for Bracken County, out of the total population over 16 years of age (6,676), 59.2% or 3,952 individuals are in the labor force, with 6.2% or 245 of them unemployed. The age group with the highest labor force participation rate is 25 to 29 years, with 87.4% or 451 individuals in the labor force. Within the labor force, the 16 to 19 years age range has the highest percentage of unemployed individuals, with 18.4% or 41 of them being unemployed.
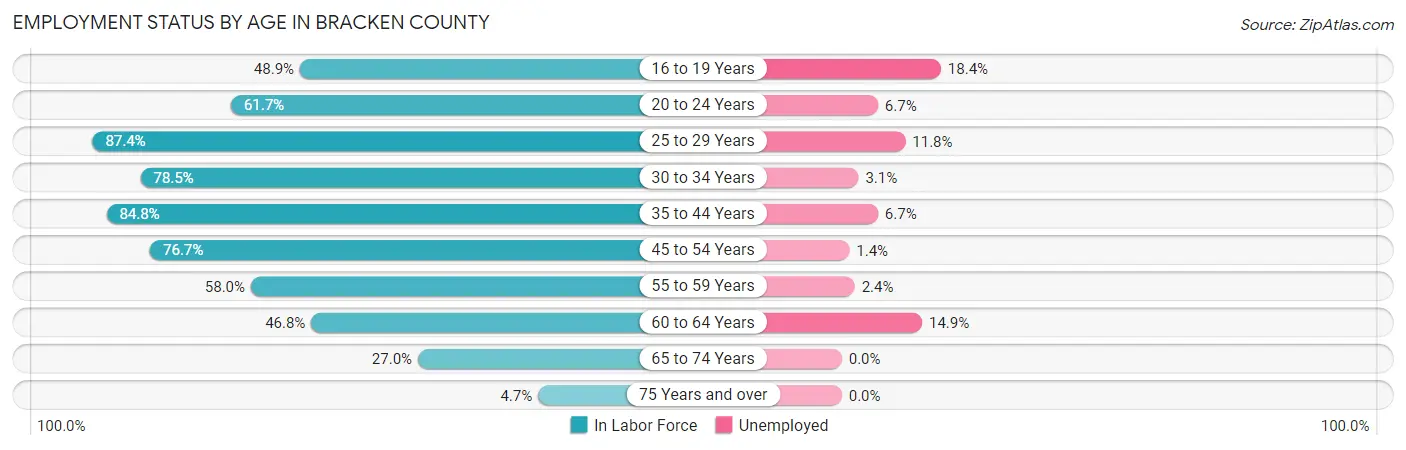
| Age Bracket | In Labor Force | Unemployed |
| 16 to 19 Years | 223 (48.9%) | 41 (18.4%) |
| 20 to 24 Years | 253 (61.7%) | 17 (6.7%) |
| 25 to 29 Years | 451 (87.4%) | 53 (11.8%) |
| 30 to 34 Years | 355 (78.5%) | 11 (3.1%) |
| 35 to 44 Years | 901 (84.8%) | 60 (6.7%) |
| 45 to 54 Years | 845 (76.7%) | 12 (1.4%) |
| 55 to 59 Years | 379 (58.0%) | 9 (2.4%) |
| 60 to 64 Years | 276 (46.8%) | 41 (14.9%) |
| 65 to 74 Years | 242 (27.0%) | 0 (0.0%) |
| 75 Years and over | 25 (4.7%) | 0 (0.0%) |
| Total | 3,952 (59.2%) | 245 (6.2%) |
Employment Status by Educational Attainment in Bracken County
According to labor force statistics for Bracken County, 73.3% of individuals (3,208) out of the total population between 25 and 64 years of age (4,376) are in the labor force, with 5.8% or 186 of them being unemployed. The group with the highest labor force participation rate are those with the educational attainment of bachelor's degree or higher, with 92.9% or 784 individuals in the labor force. Within the labor force, individuals with high school diploma education have the highest percentage of unemployment, with 6.9% or 89 of them being unemployed.
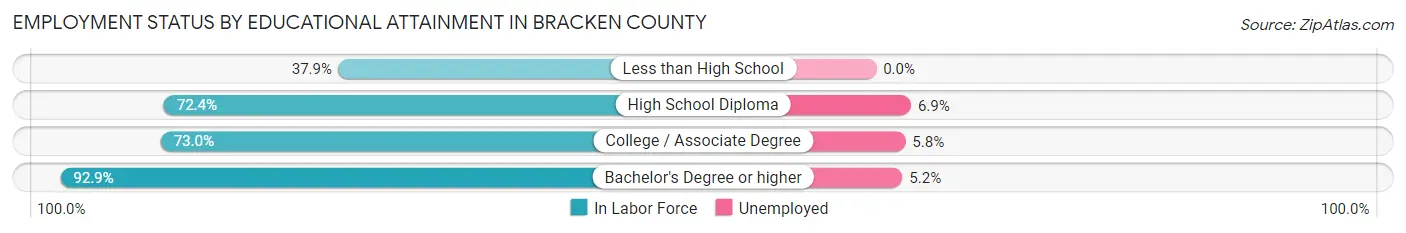
| Educational Attainment | In Labor Force | Unemployed |
| Less than High School | 156 (37.9%) | 0 (0.0%) |
| High School Diploma | 1,295 (72.4%) | 123 (6.9%) |
| College / Associate Degree | 972 (73.0%) | 77 (5.8%) |
| Bachelor's Degree or higher | 784 (92.9%) | 44 (5.2%) |
| Total | 3,208 (73.3%) | 254 (5.8%) |
Employment Occupations by Sex in Bracken County
Management, Business, Science and Arts Occupations
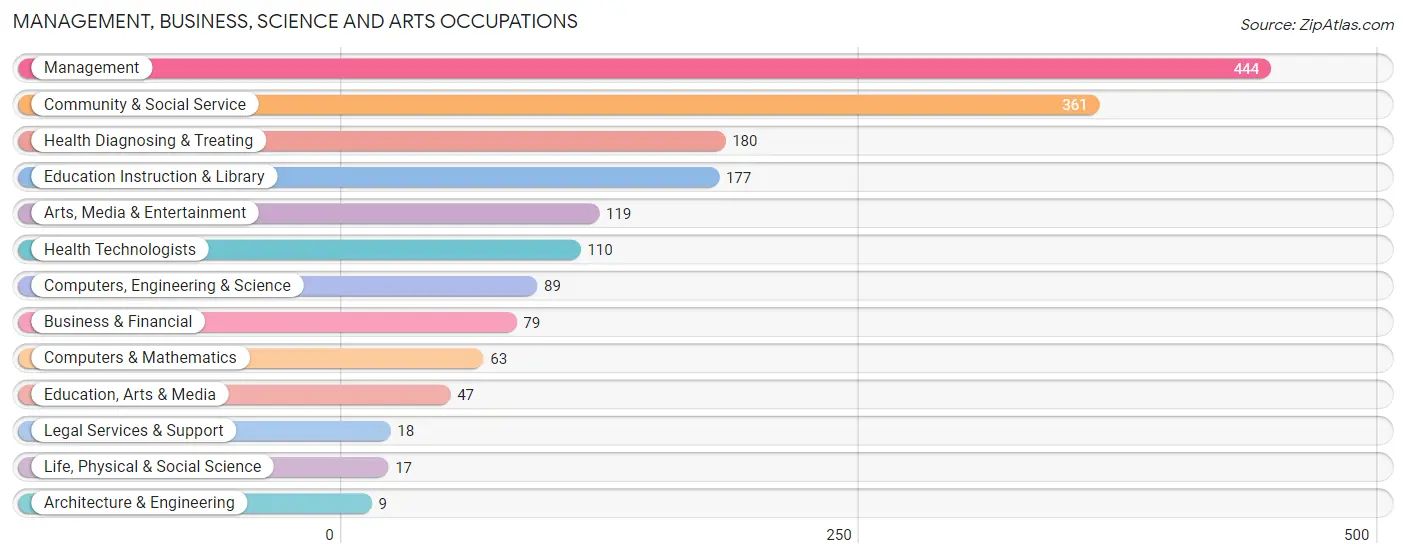
The most common Management, Business, Science and Arts occupations in Bracken County are Management (444 | 12.0%), Community & Social Service (361 | 9.7%), Health Diagnosing & Treating (180 | 4.9%), Education Instruction & Library (177 | 4.8%), and Arts, Media & Entertainment (119 | 3.2%).
Management, Business, Science and Arts Occupations by Sex
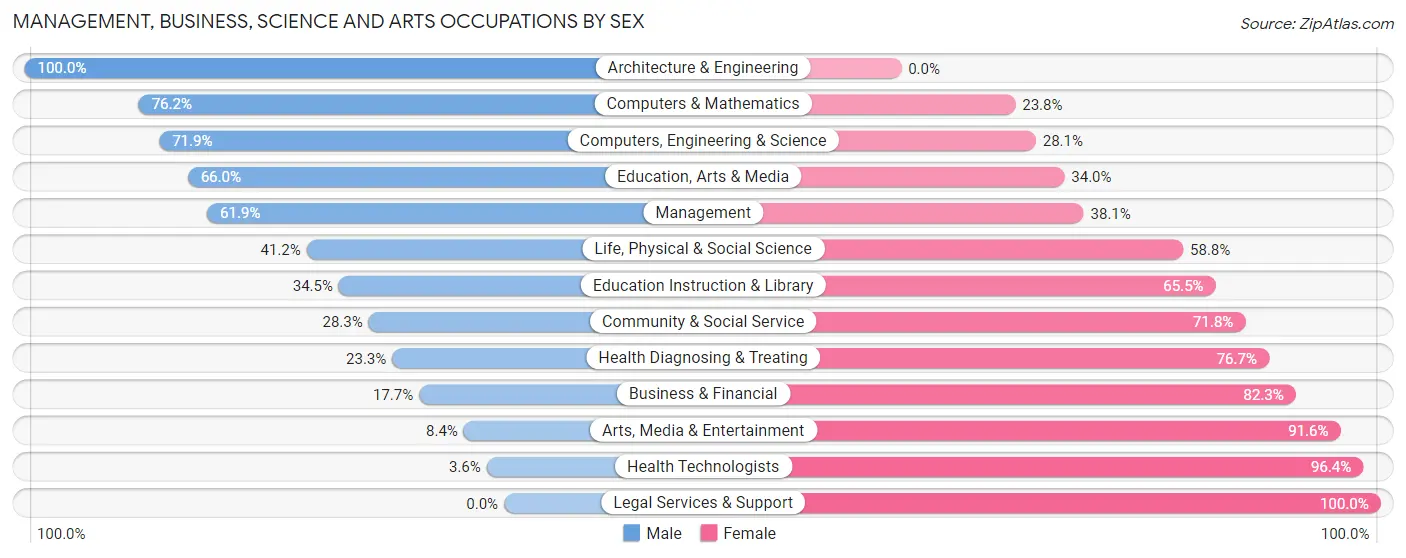
Within the Management, Business, Science and Arts occupations in Bracken County, the most male-oriented occupations are Architecture & Engineering (100.0%), Computers & Mathematics (76.2%), and Computers, Engineering & Science (71.9%), while the most female-oriented occupations are Legal Services & Support (100.0%), Health Technologists (96.4%), and Arts, Media & Entertainment (91.6%).
| Occupation | Male | Female |
| Management | 275 (61.9%) | 169 (38.1%) |
| Business & Financial | 14 (17.7%) | 65 (82.3%) |
| Computers, Engineering & Science | 64 (71.9%) | 25 (28.1%) |
| Computers & Mathematics | 48 (76.2%) | 15 (23.8%) |
| Architecture & Engineering | 9 (100.0%) | 0 (0.0%) |
| Life, Physical & Social Science | 7 (41.2%) | 10 (58.8%) |
| Community & Social Service | 102 (28.2%) | 259 (71.8%) |
| Education, Arts & Media | 31 (66.0%) | 16 (34.0%) |
| Legal Services & Support | 0 (0.0%) | 18 (100.0%) |
| Education Instruction & Library | 61 (34.5%) | 116 (65.5%) |
| Arts, Media & Entertainment | 10 (8.4%) | 109 (91.6%) |
| Health Diagnosing & Treating | 42 (23.3%) | 138 (76.7%) |
| Health Technologists | 4 (3.6%) | 106 (96.4%) |
| Total (Category) | 497 (43.1%) | 656 (56.9%) |
| Total (Overall) | 2,089 (56.4%) | 1,617 (43.6%) |
Services Occupations
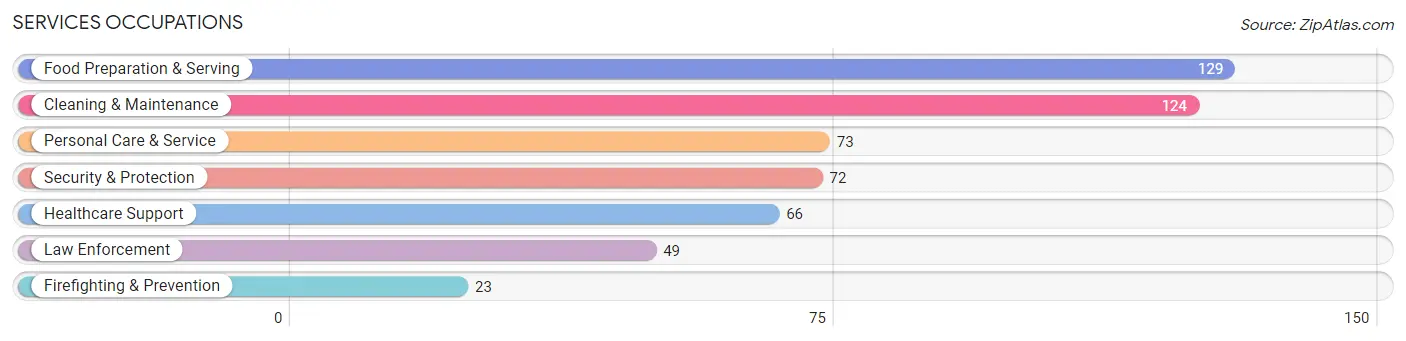
The most common Services occupations in Bracken County are Food Preparation & Serving (129 | 3.5%), Cleaning & Maintenance (124 | 3.4%), Personal Care & Service (73 | 2.0%), Security & Protection (72 | 1.9%), and Healthcare Support (66 | 1.8%).
Services Occupations by Sex
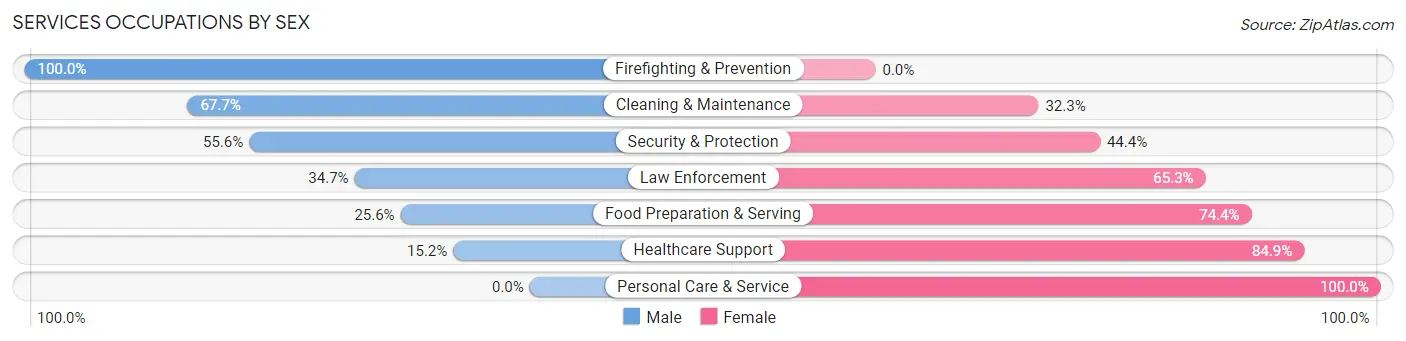
Within the Services occupations in Bracken County, the most male-oriented occupations are Firefighting & Prevention (100.0%), Cleaning & Maintenance (67.7%), and Security & Protection (55.6%), while the most female-oriented occupations are Personal Care & Service (100.0%), Healthcare Support (84.9%), and Food Preparation & Serving (74.4%).
| Occupation | Male | Female |
| Healthcare Support | 10 (15.1%) | 56 (84.9%) |
| Security & Protection | 40 (55.6%) | 32 (44.4%) |
| Firefighting & Prevention | 23 (100.0%) | 0 (0.0%) |
| Law Enforcement | 17 (34.7%) | 32 (65.3%) |
| Food Preparation & Serving | 33 (25.6%) | 96 (74.4%) |
| Cleaning & Maintenance | 84 (67.7%) | 40 (32.3%) |
| Personal Care & Service | 0 (0.0%) | 73 (100.0%) |
| Total (Category) | 167 (36.0%) | 297 (64.0%) |
| Total (Overall) | 2,089 (56.4%) | 1,617 (43.6%) |
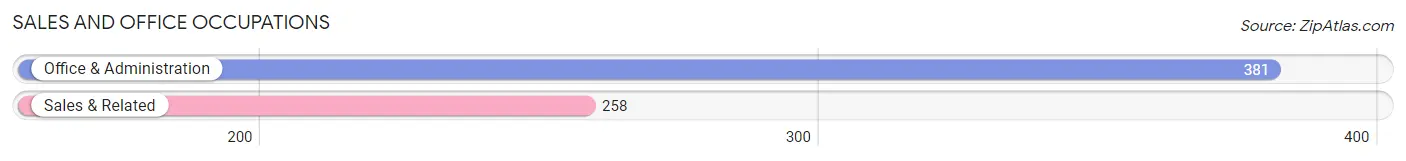
Sales and Office Occupations
The most common Sales and Office occupations in Bracken County are Office & Administration (381 | 10.3%), and Sales & Related (258 | 7.0%).
Sales and Office Occupations by Sex
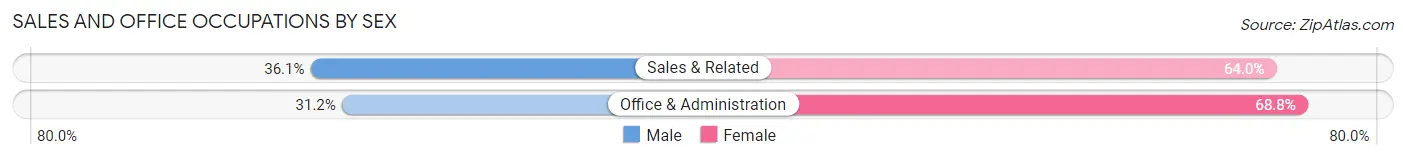
| Occupation | Male | Female |
| Sales & Related | 93 (36.0%) | 165 (63.9%) |
| Office & Administration | 119 (31.2%) | 262 (68.8%) |
| Total (Category) | 212 (33.2%) | 427 (66.8%) |
| Total (Overall) | 2,089 (56.4%) | 1,617 (43.6%) |
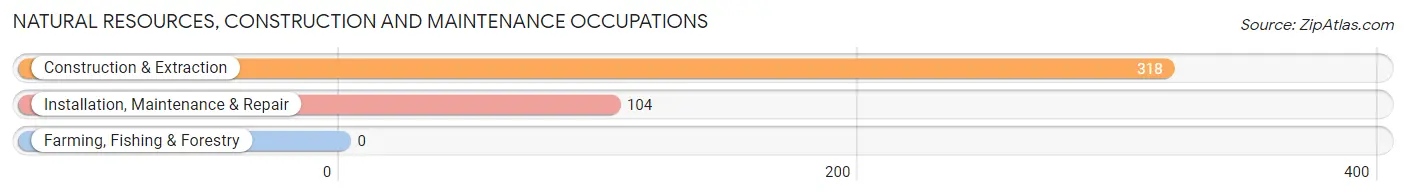
Natural Resources, Construction and Maintenance Occupations
The most common Natural Resources, Construction and Maintenance occupations in Bracken County are Construction & Extraction (318 | 8.6%), and Installation, Maintenance & Repair (104 | 2.8%).
Natural Resources, Construction and Maintenance Occupations by Sex
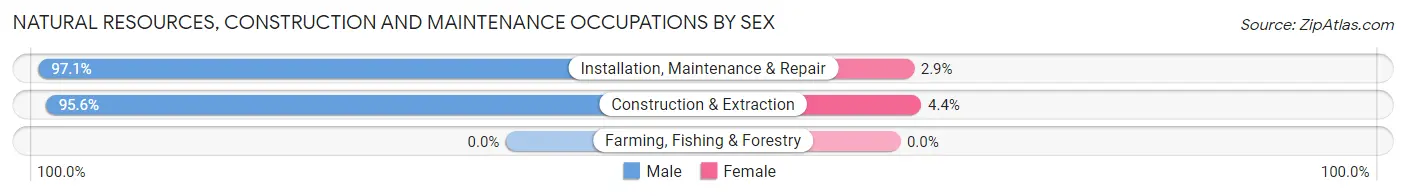
| Occupation | Male | Female |
| Farming, Fishing & Forestry | 0 (0.0%) | 0 (0.0%) |
| Construction & Extraction | 304 (95.6%) | 14 (4.4%) |
| Installation, Maintenance & Repair | 101 (97.1%) | 3 (2.9%) |
| Total (Category) | 405 (96.0%) | 17 (4.0%) |
| Total (Overall) | 2,089 (56.4%) | 1,617 (43.6%) |
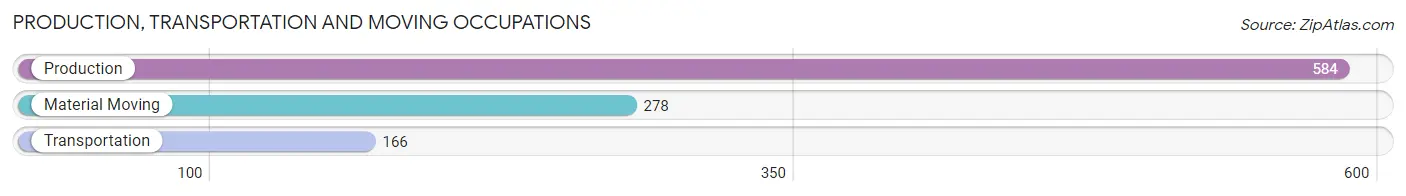
Production, Transportation and Moving Occupations
The most common Production, Transportation and Moving occupations in Bracken County are Production (584 | 15.8%), Material Moving (278 | 7.5%), and Transportation (166 | 4.5%).
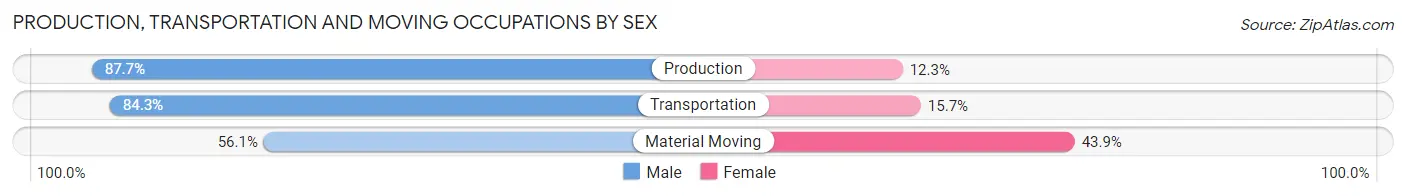
Production, Transportation and Moving Occupations by Sex
| Occupation | Male | Female |
| Production | 512 (87.7%) | 72 (12.3%) |
| Transportation | 140 (84.3%) | 26 (15.7%) |
| Material Moving | 156 (56.1%) | 122 (43.9%) |
| Total (Category) | 808 (78.6%) | 220 (21.4%) |
| Total (Overall) | 2,089 (56.4%) | 1,617 (43.6%) |
Employment Industries by Sex in Bracken County
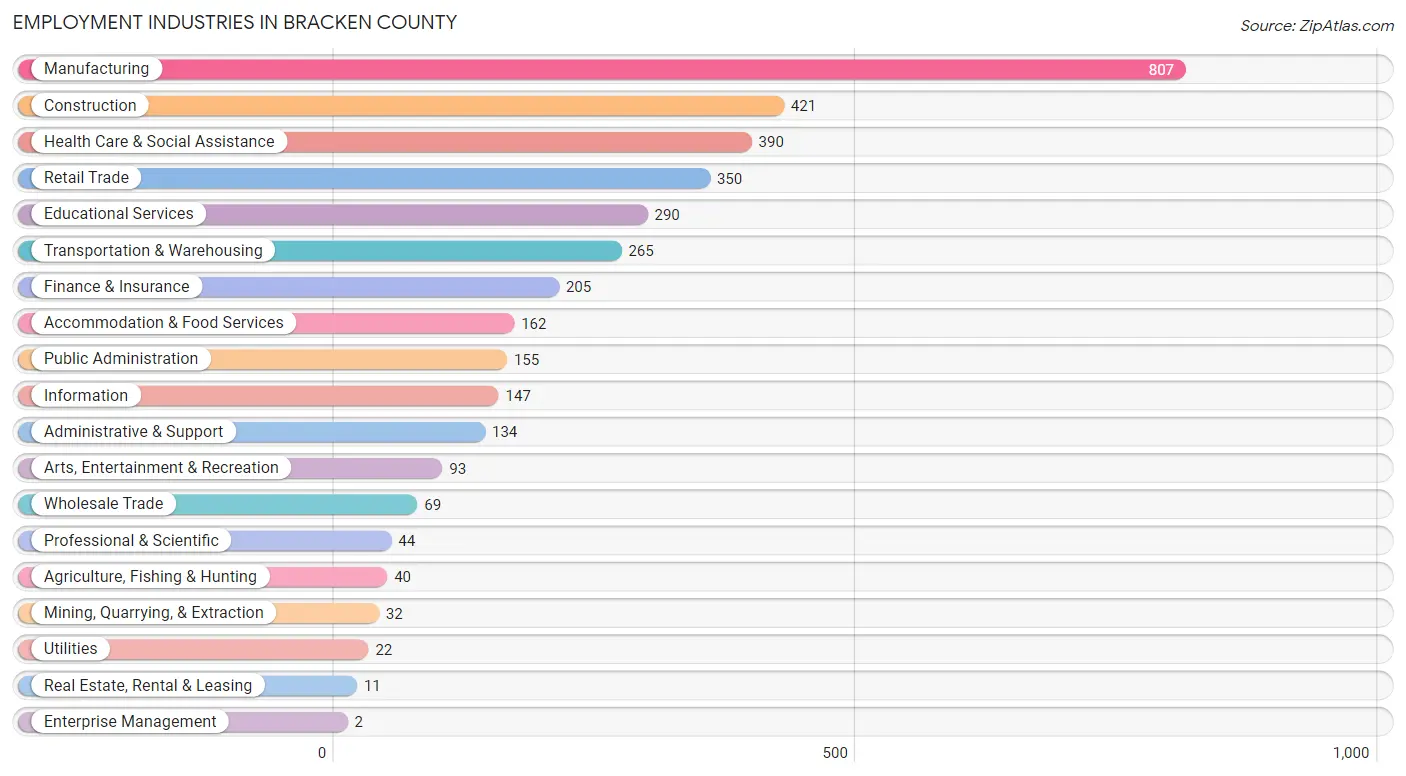
Employment Industries in Bracken County
The major employment industries in Bracken County include Manufacturing (807 | 21.8%), Construction (421 | 11.4%), Health Care & Social Assistance (390 | 10.5%), Retail Trade (350 | 9.4%), and Educational Services (290 | 7.8%).
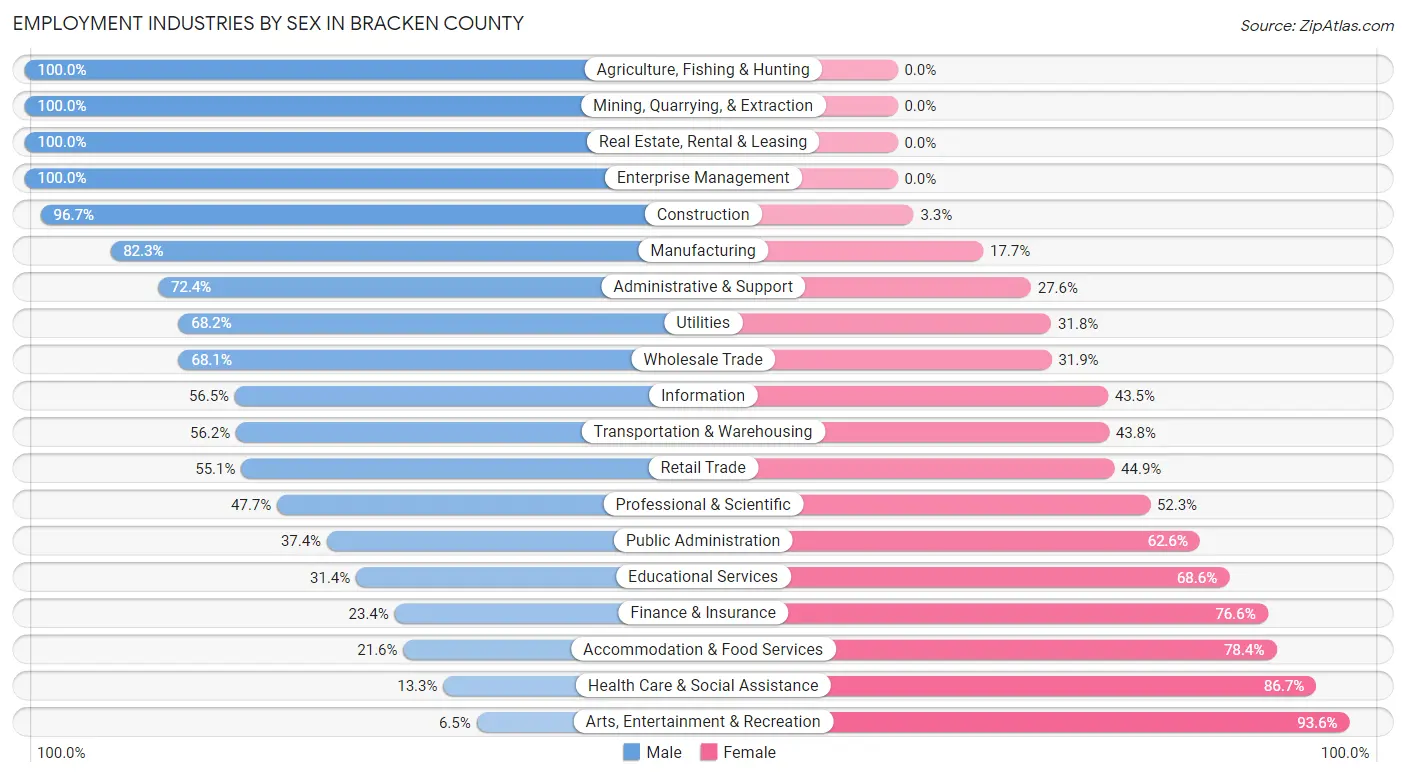
Employment Industries by Sex in Bracken County
The Bracken County industries that see more men than women are Agriculture, Fishing & Hunting (100.0%), Mining, Quarrying, & Extraction (100.0%), and Real Estate, Rental & Leasing (100.0%), whereas the industries that tend to have a higher number of women are Arts, Entertainment & Recreation (93.5%), Health Care & Social Assistance (86.7%), and Accommodation & Food Services (78.4%).
| Industry | Male | Female |
| Agriculture, Fishing & Hunting | 40 (100.0%) | 0 (0.0%) |
| Mining, Quarrying, & Extraction | 32 (100.0%) | 0 (0.0%) |
| Construction | 407 (96.7%) | 14 (3.3%) |
| Manufacturing | 664 (82.3%) | 143 (17.7%) |
| Wholesale Trade | 47 (68.1%) | 22 (31.9%) |
| Retail Trade | 193 (55.1%) | 157 (44.9%) |
| Transportation & Warehousing | 149 (56.2%) | 116 (43.8%) |
| Utilities | 15 (68.2%) | 7 (31.8%) |
| Information | 83 (56.5%) | 64 (43.5%) |
| Finance & Insurance | 48 (23.4%) | 157 (76.6%) |
| Real Estate, Rental & Leasing | 11 (100.0%) | 0 (0.0%) |
| Professional & Scientific | 21 (47.7%) | 23 (52.3%) |
| Enterprise Management | 2 (100.0%) | 0 (0.0%) |
| Administrative & Support | 97 (72.4%) | 37 (27.6%) |
| Educational Services | 91 (31.4%) | 199 (68.6%) |
| Health Care & Social Assistance | 52 (13.3%) | 338 (86.7%) |
| Arts, Entertainment & Recreation | 6 (6.5%) | 87 (93.5%) |
| Accommodation & Food Services | 35 (21.6%) | 127 (78.4%) |
| Public Administration | 58 (37.4%) | 97 (62.6%) |
| Total | 2,089 (56.4%) | 1,617 (43.6%) |
Education in Bracken County
School Enrollment in Bracken County
The most common levels of schooling among the 1,819 students in Bracken County are high school (529 | 29.1%), elementary school (401 | 22.1%), and middle school (353 | 19.4%).
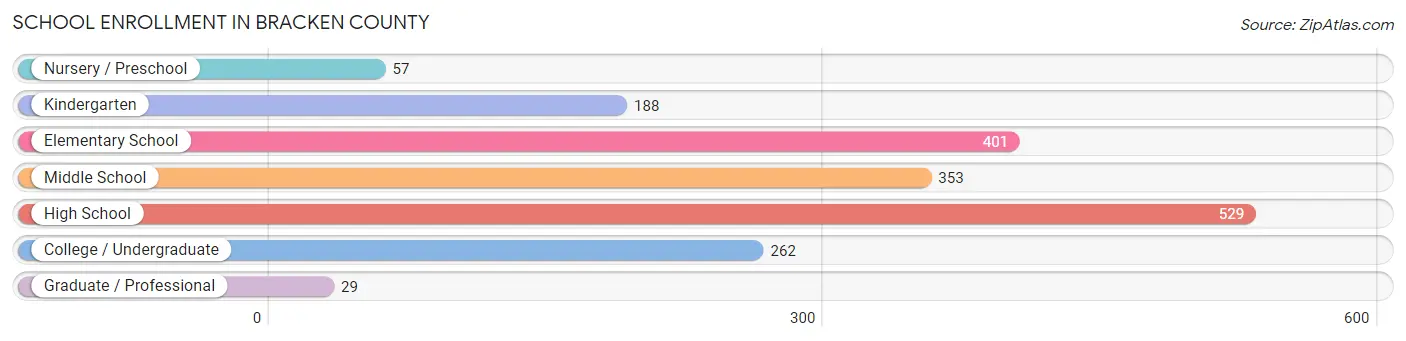
| School Level | # Students | % Students |
| Nursery / Preschool | 57 | 3.1% |
| Kindergarten | 188 | 10.3% |
| Elementary School | 401 | 22.1% |
| Middle School | 353 | 19.4% |
| High School | 529 | 29.1% |
| College / Undergraduate | 262 | 14.4% |
| Graduate / Professional | 29 | 1.6% |
| Total | 1,819 | 100.0% |
School Enrollment by Age by Funding Source in Bracken County
Out of a total of 1,819 students who are enrolled in schools in Bracken County, 264 (14.5%) attend a private institution, while the remaining 1,555 (85.5%) are enrolled in public schools. The age group of 5 to 9 year old has the highest likelihood of being enrolled in private schools, with 145 (24.8% in the age bracket) enrolled. Conversely, the age group of 18 to 19 year olds has the lowest likelihood of being enrolled in a private school, with 182 (100.0% in the age bracket) attending a public institution.
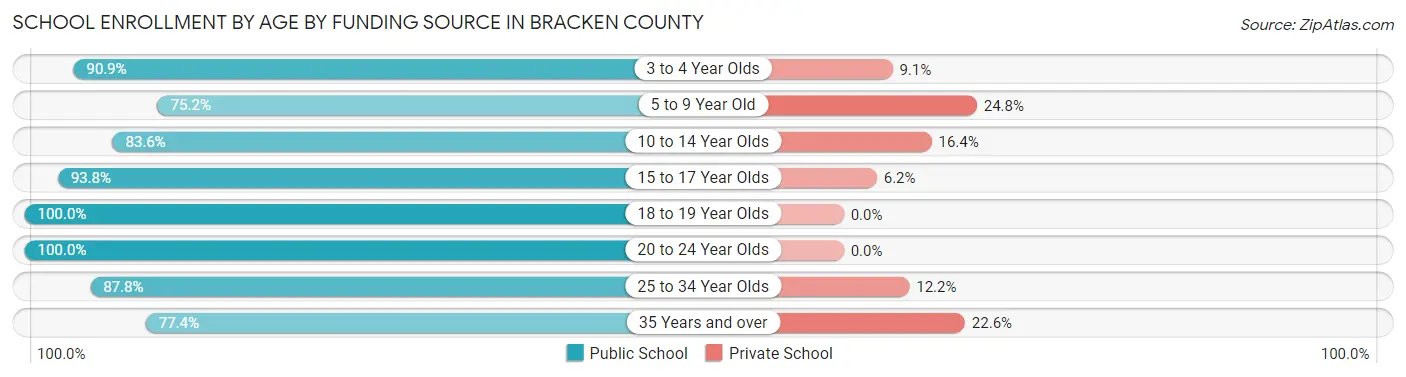
| Age Bracket | Public School | Private School |
| 3 to 4 Year Olds | 40 (90.9%) | 4 (9.1%) |
| 5 to 9 Year Old | 440 (75.2%) | 145 (24.8%) |
| 10 to 14 Year Olds | 378 (83.6%) | 74 (16.4%) |
| 15 to 17 Year Olds | 350 (93.8%) | 23 (6.2%) |
| 18 to 19 Year Olds | 182 (100.0%) | 0 (0.0%) |
| 20 to 24 Year Olds | 62 (100.0%) | 0 (0.0%) |
| 25 to 34 Year Olds | 79 (87.8%) | 11 (12.2%) |
| 35 Years and over | 24 (77.4%) | 7 (22.6%) |
| Total | 1,555 (85.5%) | 264 (14.5%) |
Educational Attainment by Field of Study in Bracken County
Social sciences (218 | 18.6%), business (140 | 12.0%), education (136 | 11.6%), liberal arts & history (129 | 11.0%), and physical & health sciences (124 | 10.6%) are the most common fields of study among 1,169 individuals in Bracken County who have obtained a bachelor's degree or higher.
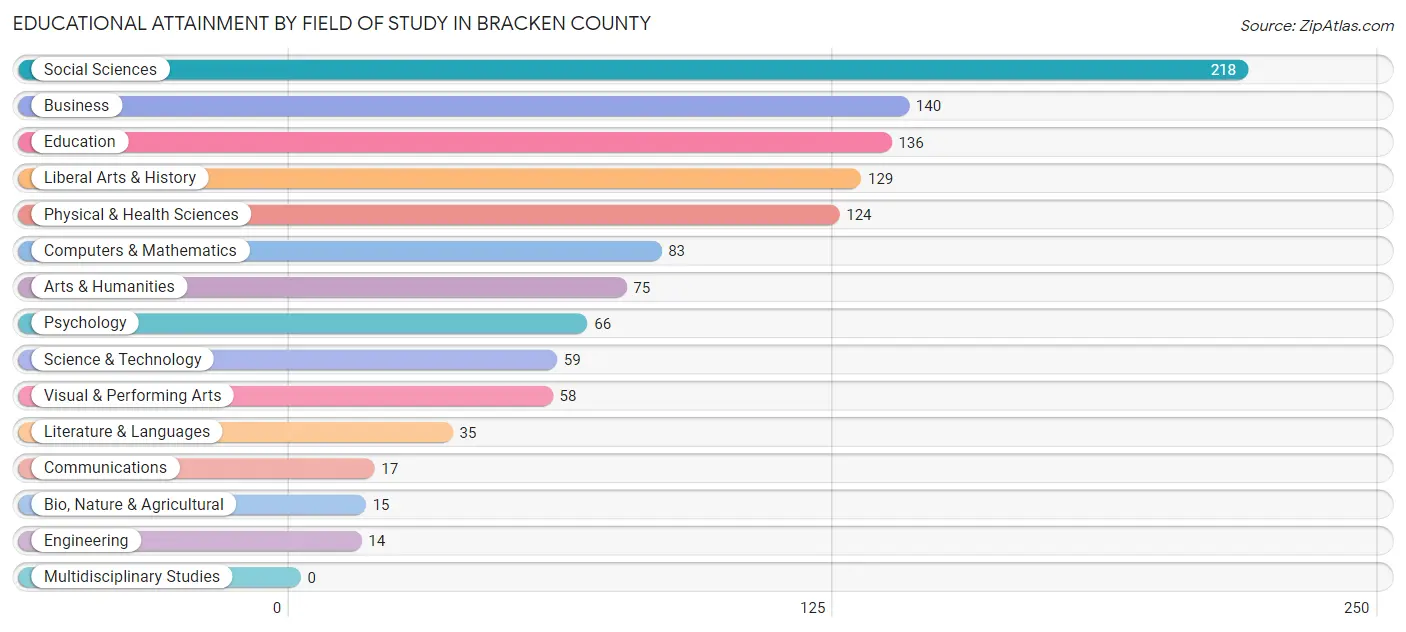
| Field of Study | # Graduates | % Graduates |
| Computers & Mathematics | 83 | 7.1% |
| Bio, Nature & Agricultural | 15 | 1.3% |
| Physical & Health Sciences | 124 | 10.6% |
| Psychology | 66 | 5.7% |
| Social Sciences | 218 | 18.6% |
| Engineering | 14 | 1.2% |
| Multidisciplinary Studies | 0 | 0.0% |
| Science & Technology | 59 | 5.1% |
| Business | 140 | 12.0% |
| Education | 136 | 11.6% |
| Literature & Languages | 35 | 3.0% |
| Liberal Arts & History | 129 | 11.0% |
| Visual & Performing Arts | 58 | 5.0% |
| Communications | 17 | 1.5% |
| Arts & Humanities | 75 | 6.4% |
| Total | 1,169 | 100.0% |
Transportation & Commute in Bracken County
Vehicle Availability by Sex in Bracken County
The most prevalent vehicle ownership categories in Bracken County are males with 2 vehicles (713, accounting for 36.1%) and females with 2 vehicles (583, making up 45.1%).
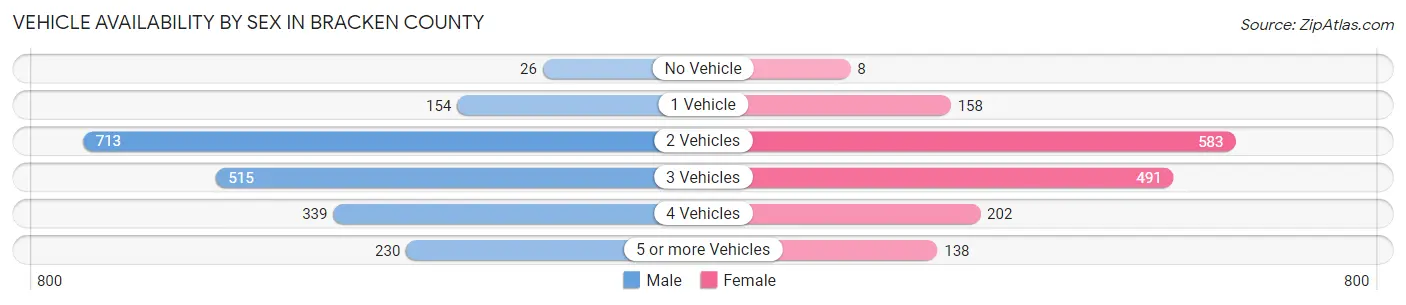
| Vehicles Available | Male | Female |
| No Vehicle | 26 (1.3%) | 8 (0.5%) |
| 1 Vehicle | 154 (7.8%) | 158 (10.0%) |
| 2 Vehicles | 713 (36.1%) | 583 (36.9%) |
| 3 Vehicles | 515 (26.1%) | 491 (31.1%) |
| 4 Vehicles | 339 (17.2%) | 202 (12.8%) |
| 5 or more Vehicles | 230 (11.6%) | 138 (8.7%) |
| Total | 1,977 (100.0%) | 1,580 (100.0%) |
Commute Time in Bracken County
The most frequently occuring commute durations in Bracken County are 45 to 59 minutes (609 commuters, 18.1%), 60 to 89 minutes (578 commuters, 17.2%), and 15 to 19 minutes (385 commuters, 11.5%).
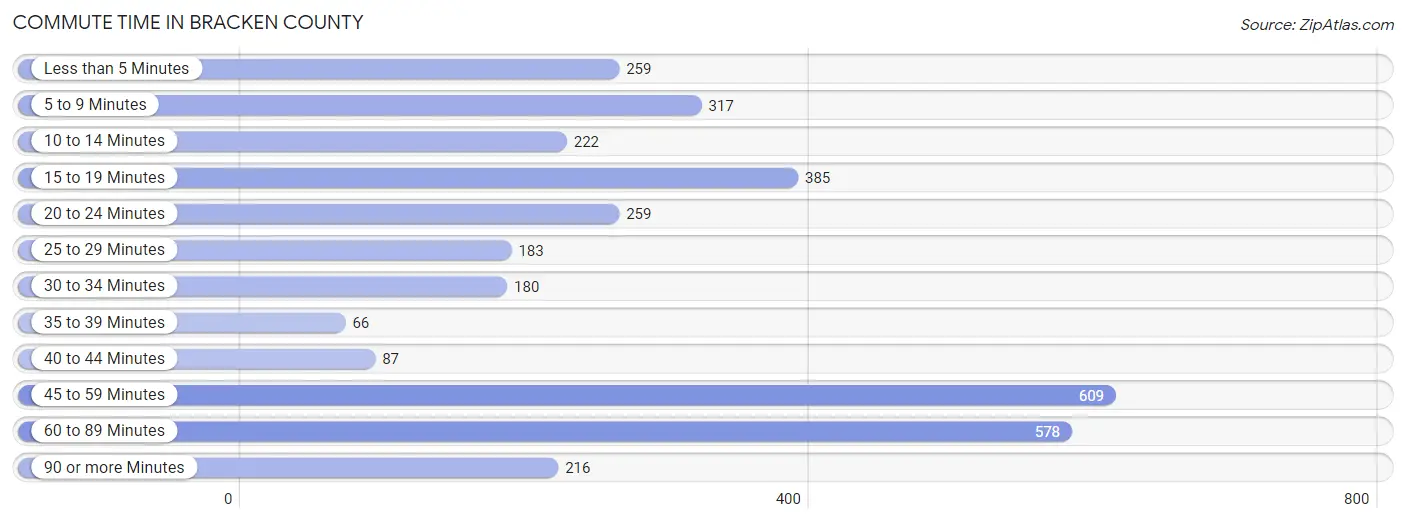
| Commute Time | # Commuters | % Commuters |
| Less than 5 Minutes | 259 | 7.7% |
| 5 to 9 Minutes | 317 | 9.4% |
| 10 to 14 Minutes | 222 | 6.6% |
| 15 to 19 Minutes | 385 | 11.5% |
| 20 to 24 Minutes | 259 | 7.7% |
| 25 to 29 Minutes | 183 | 5.4% |
| 30 to 34 Minutes | 180 | 5.4% |
| 35 to 39 Minutes | 66 | 2.0% |
| 40 to 44 Minutes | 87 | 2.6% |
| 45 to 59 Minutes | 609 | 18.1% |
| 60 to 89 Minutes | 578 | 17.2% |
| 90 or more Minutes | 216 | 6.4% |
Commute Time by Sex in Bracken County
The most common commute times in Bracken County are 60 to 89 minutes (424 commuters, 22.2%) for males and 45 to 59 minutes (325 commuters, 22.4%) for females.
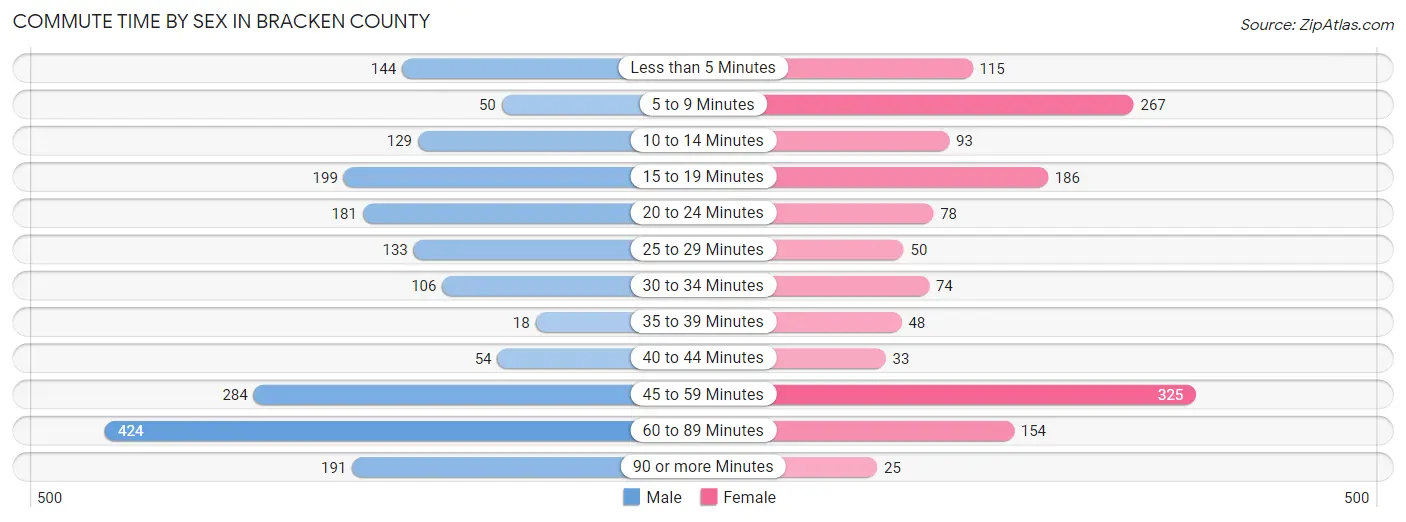
| Commute Time | Male | Female |
| Less than 5 Minutes | 144 (7.5%) | 115 (7.9%) |
| 5 to 9 Minutes | 50 (2.6%) | 267 (18.4%) |
| 10 to 14 Minutes | 129 (6.7%) | 93 (6.4%) |
| 15 to 19 Minutes | 199 (10.4%) | 186 (12.9%) |
| 20 to 24 Minutes | 181 (9.5%) | 78 (5.4%) |
| 25 to 29 Minutes | 133 (7.0%) | 50 (3.5%) |
| 30 to 34 Minutes | 106 (5.5%) | 74 (5.1%) |
| 35 to 39 Minutes | 18 (0.9%) | 48 (3.3%) |
| 40 to 44 Minutes | 54 (2.8%) | 33 (2.3%) |
| 45 to 59 Minutes | 284 (14.8%) | 325 (22.4%) |
| 60 to 89 Minutes | 424 (22.2%) | 154 (10.6%) |
| 90 or more Minutes | 191 (10.0%) | 25 (1.7%) |
Time of Departure to Work by Sex in Bracken County
The most frequent times of departure to work in Bracken County are 6:00 AM to 6:29 AM (353, 18.4%) for males and 7:30 AM to 7:59 AM (268, 18.5%) for females.
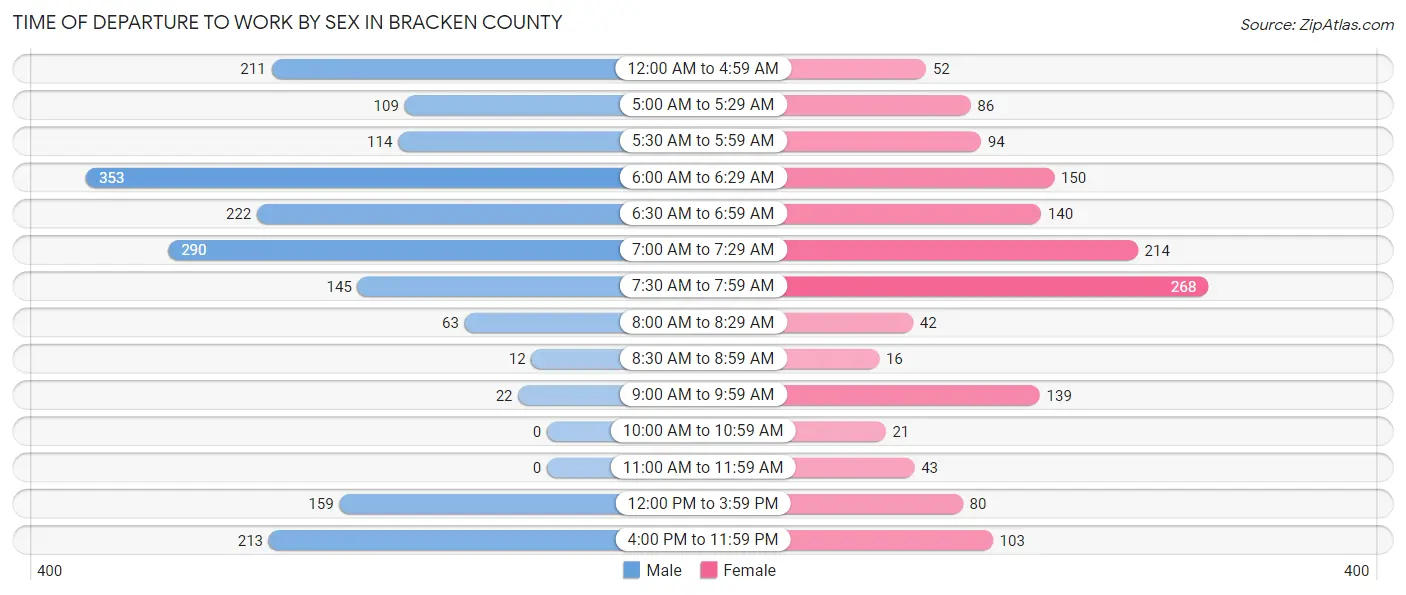
| Time of Departure | Male | Female |
| 12:00 AM to 4:59 AM | 211 (11.0%) | 52 (3.6%) |
| 5:00 AM to 5:29 AM | 109 (5.7%) | 86 (5.9%) |
| 5:30 AM to 5:59 AM | 114 (6.0%) | 94 (6.5%) |
| 6:00 AM to 6:29 AM | 353 (18.4%) | 150 (10.4%) |
| 6:30 AM to 6:59 AM | 222 (11.6%) | 140 (9.7%) |
| 7:00 AM to 7:29 AM | 290 (15.2%) | 214 (14.8%) |
| 7:30 AM to 7:59 AM | 145 (7.6%) | 268 (18.5%) |
| 8:00 AM to 8:29 AM | 63 (3.3%) | 42 (2.9%) |
| 8:30 AM to 8:59 AM | 12 (0.6%) | 16 (1.1%) |
| 9:00 AM to 9:59 AM | 22 (1.1%) | 139 (9.6%) |
| 10:00 AM to 10:59 AM | 0 (0.0%) | 21 (1.5%) |
| 11:00 AM to 11:59 AM | 0 (0.0%) | 43 (3.0%) |
| 12:00 PM to 3:59 PM | 159 (8.3%) | 80 (5.5%) |
| 4:00 PM to 11:59 PM | 213 (11.1%) | 103 (7.1%) |
| Total | 1,913 (100.0%) | 1,448 (100.0%) |
Housing Occupancy in Bracken County
Occupancy by Ownership in Bracken County
Of the total 3,138 dwellings in Bracken County, owner-occupied units account for 2,526 (80.5%), while renter-occupied units make up 612 (19.5%).
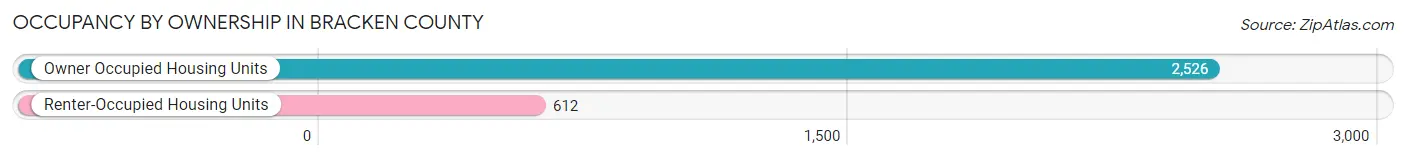
| Occupancy | # Housing Units | % Housing Units |
| Owner Occupied Housing Units | 2,526 | 80.5% |
| Renter-Occupied Housing Units | 612 | 19.5% |
| Total Occupied Housing Units | 3,138 | 100.0% |
Occupancy by Household Size in Bracken County
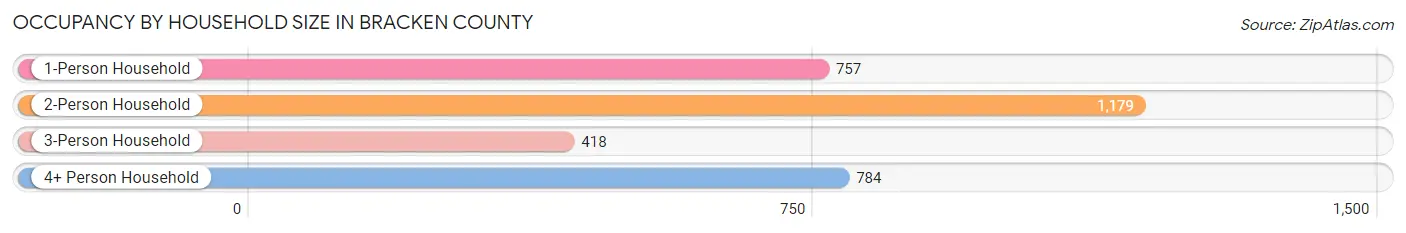
| Household Size | # Housing Units | % Housing Units |
| 1-Person Household | 757 | 24.1% |
| 2-Person Household | 1,179 | 37.6% |
| 3-Person Household | 418 | 13.3% |
| 4+ Person Household | 784 | 25.0% |
| Total Housing Units | 3,138 | 100.0% |
Occupancy by Ownership by Household Size in Bracken County
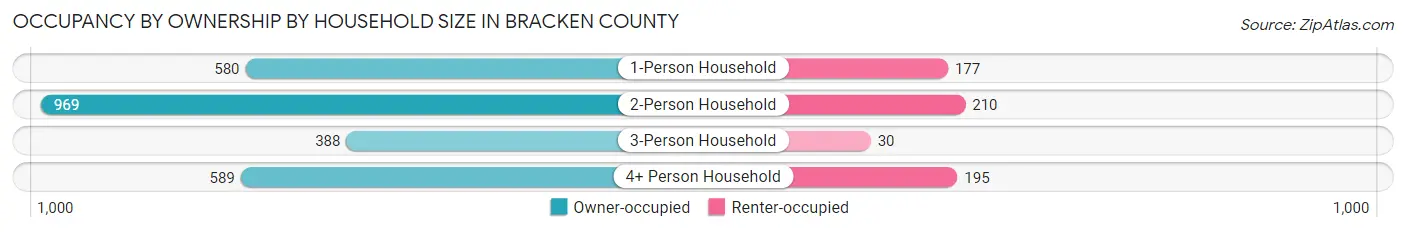
| Household Size | Owner-occupied | Renter-occupied |
| 1-Person Household | 580 (76.6%) | 177 (23.4%) |
| 2-Person Household | 969 (82.2%) | 210 (17.8%) |
| 3-Person Household | 388 (92.8%) | 30 (7.2%) |
| 4+ Person Household | 589 (75.1%) | 195 (24.9%) |
| Total Housing Units | 2,526 (80.5%) | 612 (19.5%) |
Occupancy by Educational Attainment in Bracken County
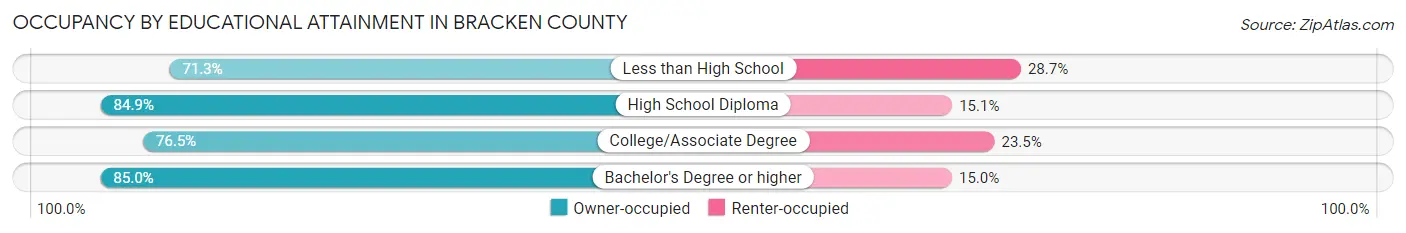
| Household Size | Owner-occupied | Renter-occupied |
| Less than High School | 355 (71.3%) | 143 (28.7%) |
| High School Diploma | 1,042 (84.9%) | 185 (15.1%) |
| College/Associate Degree | 649 (76.5%) | 199 (23.5%) |
| Bachelor's Degree or higher | 480 (85.0%) | 85 (15.0%) |
Occupancy by Age of Householder in Bracken County
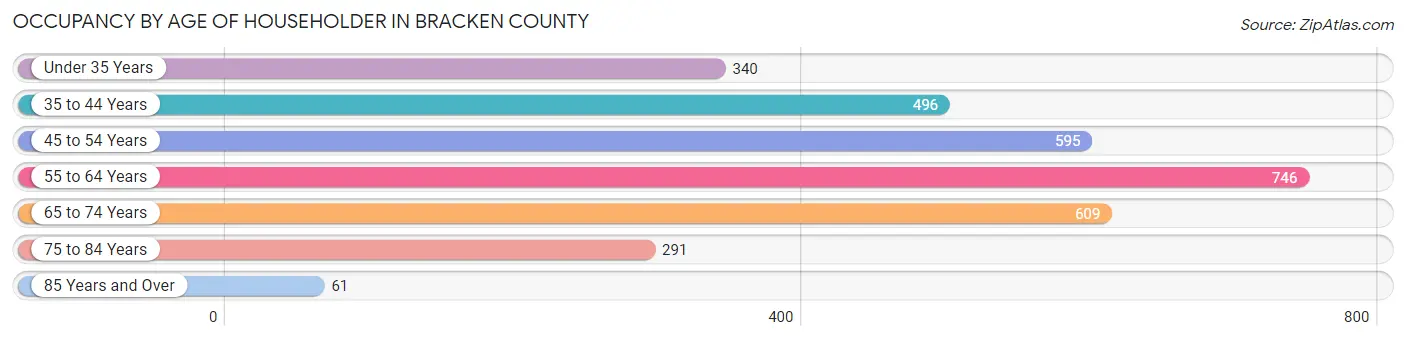
| Age Bracket | # Households | % Households |
| Under 35 Years | 340 | 10.8% |
| 35 to 44 Years | 496 | 15.8% |
| 45 to 54 Years | 595 | 19.0% |
| 55 to 64 Years | 746 | 23.8% |
| 65 to 74 Years | 609 | 19.4% |
| 75 to 84 Years | 291 | 9.3% |
| 85 Years and Over | 61 | 1.9% |
| Total | 3,138 | 100.0% |
Housing Finances in Bracken County
Median Income by Occupancy in Bracken County
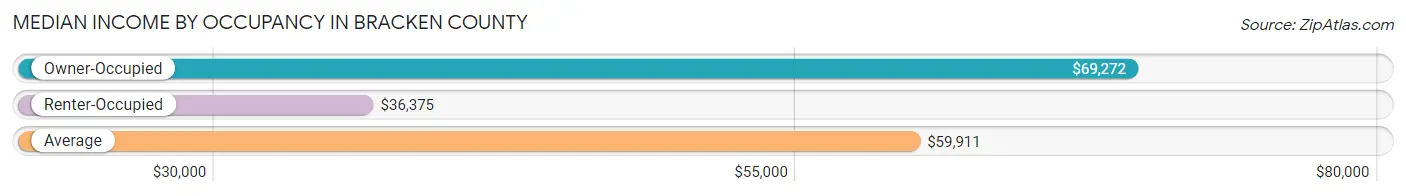
| Occupancy Type | # Households | Median Income |
| Owner-Occupied | 2,526 (80.5%) | $69,272 |
| Renter-Occupied | 612 (19.5%) | $36,375 |
| Average | 3,138 (100.0%) | $59,911 |
Occupancy by Householder Income Bracket in Bracken County
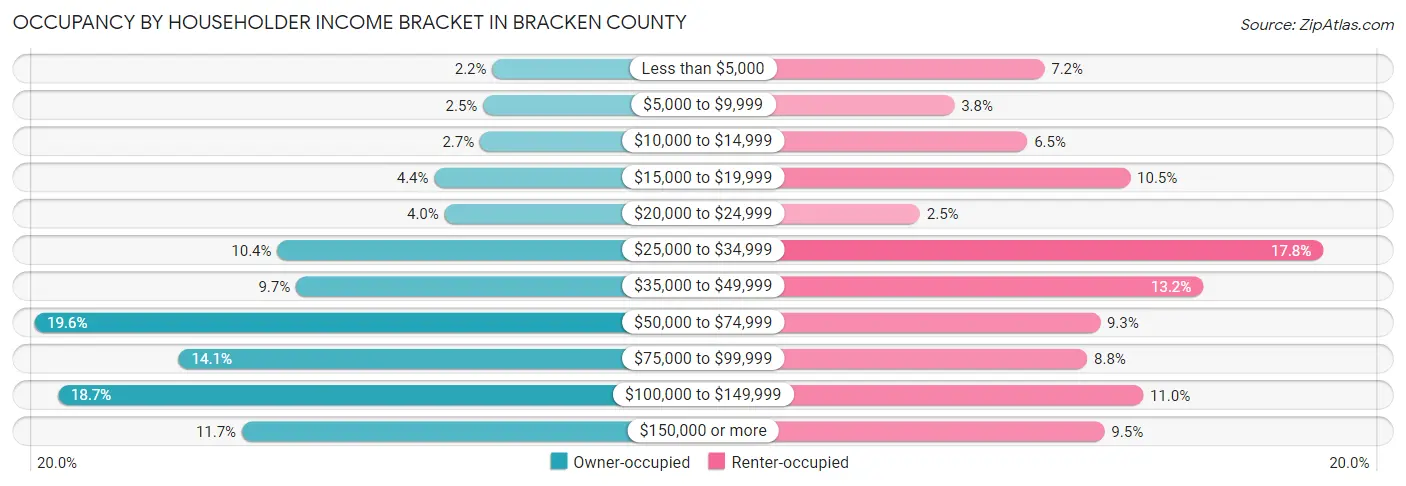
| Income Bracket | Owner-occupied | Renter-occupied |
| Less than $5,000 | 55 (2.2%) | 44 (7.2%) |
| $5,000 to $9,999 | 64 (2.5%) | 23 (3.8%) |
| $10,000 to $14,999 | 67 (2.6%) | 40 (6.5%) |
| $15,000 to $19,999 | 111 (4.4%) | 64 (10.5%) |
| $20,000 to $24,999 | 101 (4.0%) | 15 (2.5%) |
| $25,000 to $34,999 | 262 (10.4%) | 109 (17.8%) |
| $35,000 to $49,999 | 244 (9.7%) | 81 (13.2%) |
| $50,000 to $74,999 | 496 (19.6%) | 57 (9.3%) |
| $75,000 to $99,999 | 357 (14.1%) | 54 (8.8%) |
| $100,000 to $149,999 | 473 (18.7%) | 67 (11.0%) |
| $150,000 or more | 296 (11.7%) | 58 (9.5%) |
| Total | 2,526 (100.0%) | 612 (100.0%) |
Monthly Housing Cost Tiers in Bracken County
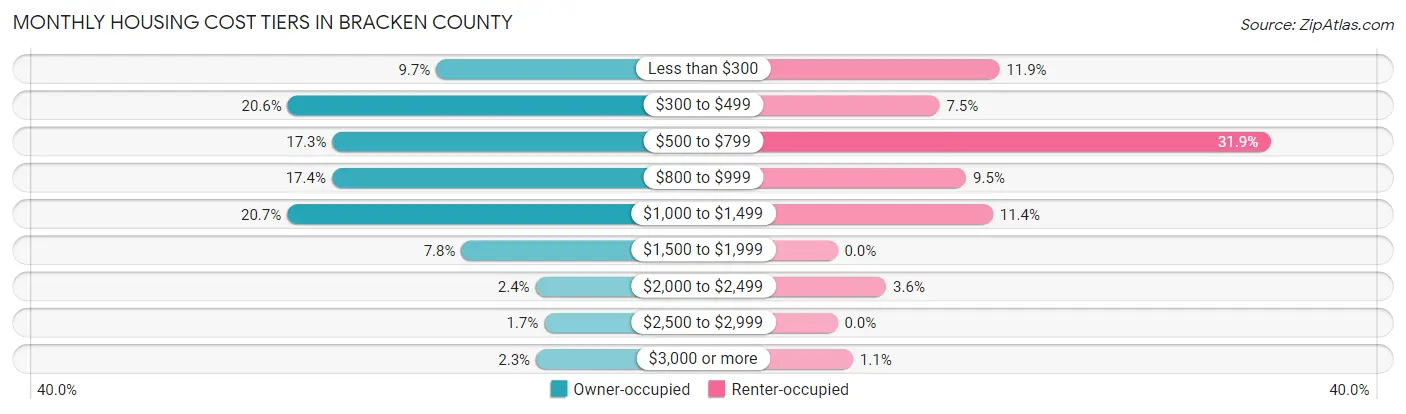
| Monthly Cost | Owner-occupied | Renter-occupied |
| Less than $300 | 245 (9.7%) | 73 (11.9%) |
| $300 to $499 | 521 (20.6%) | 46 (7.5%) |
| $500 to $799 | 438 (17.3%) | 195 (31.9%) |
| $800 to $999 | 439 (17.4%) | 58 (9.5%) |
| $1,000 to $1,499 | 522 (20.7%) | 70 (11.4%) |
| $1,500 to $1,999 | 198 (7.8%) | 0 (0.0%) |
| $2,000 to $2,499 | 60 (2.4%) | 22 (3.6%) |
| $2,500 to $2,999 | 44 (1.7%) | 0 (0.0%) |
| $3,000 or more | 59 (2.3%) | 7 (1.1%) |
| Total | 2,526 (100.0%) | 612 (100.0%) |
Physical Housing Characteristics in Bracken County
Housing Structures in Bracken County
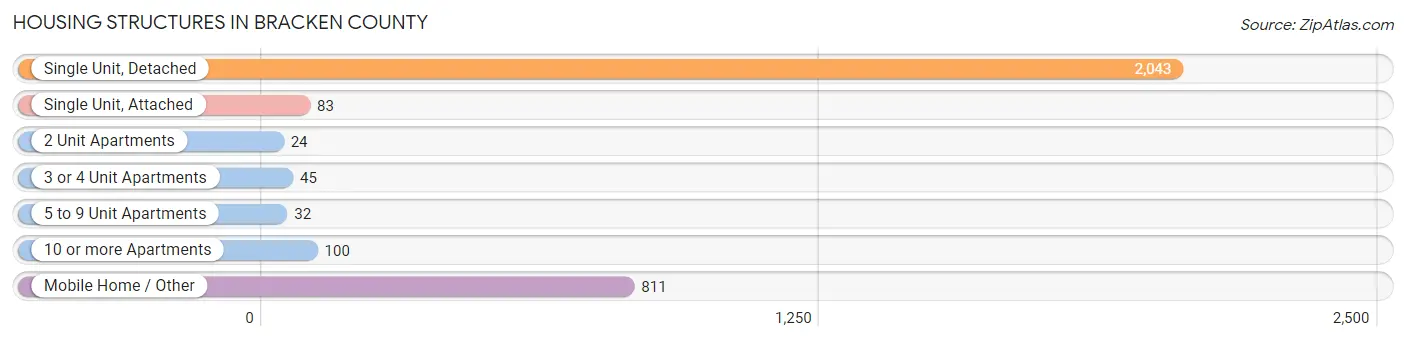
| Structure Type | # Housing Units | % Housing Units |
| Single Unit, Detached | 2,043 | 65.1% |
| Single Unit, Attached | 83 | 2.6% |
| 2 Unit Apartments | 24 | 0.8% |
| 3 or 4 Unit Apartments | 45 | 1.4% |
| 5 to 9 Unit Apartments | 32 | 1.0% |
| 10 or more Apartments | 100 | 3.2% |
| Mobile Home / Other | 811 | 25.8% |
| Total | 3,138 | 100.0% |
Housing Structures by Occupancy in Bracken County
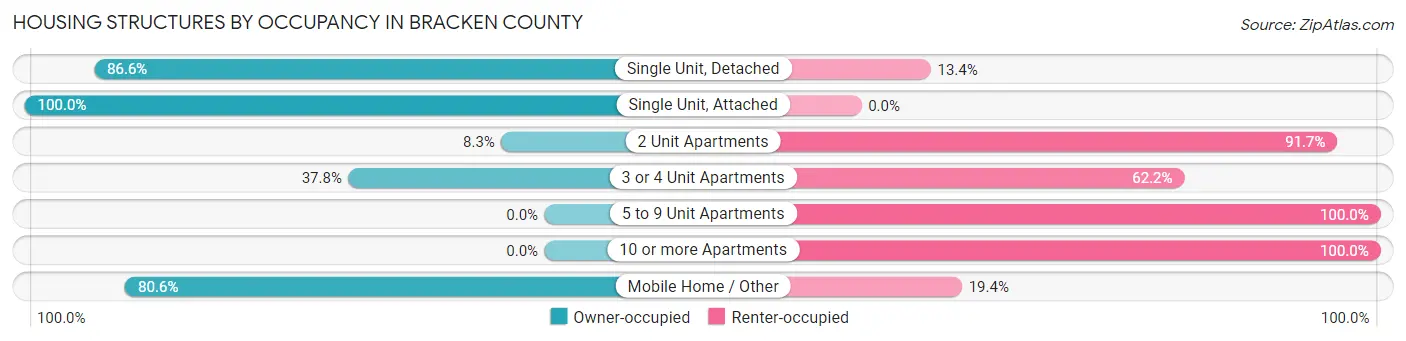
| Structure Type | Owner-occupied | Renter-occupied |
| Single Unit, Detached | 1,770 (86.6%) | 273 (13.4%) |
| Single Unit, Attached | 83 (100.0%) | 0 (0.0%) |
| 2 Unit Apartments | 2 (8.3%) | 22 (91.7%) |
| 3 or 4 Unit Apartments | 17 (37.8%) | 28 (62.2%) |
| 5 to 9 Unit Apartments | 0 (0.0%) | 32 (100.0%) |
| 10 or more Apartments | 0 (0.0%) | 100 (100.0%) |
| Mobile Home / Other | 654 (80.6%) | 157 (19.4%) |
| Total | 2,526 (80.5%) | 612 (19.5%) |
Housing Structures by Number of Rooms in Bracken County
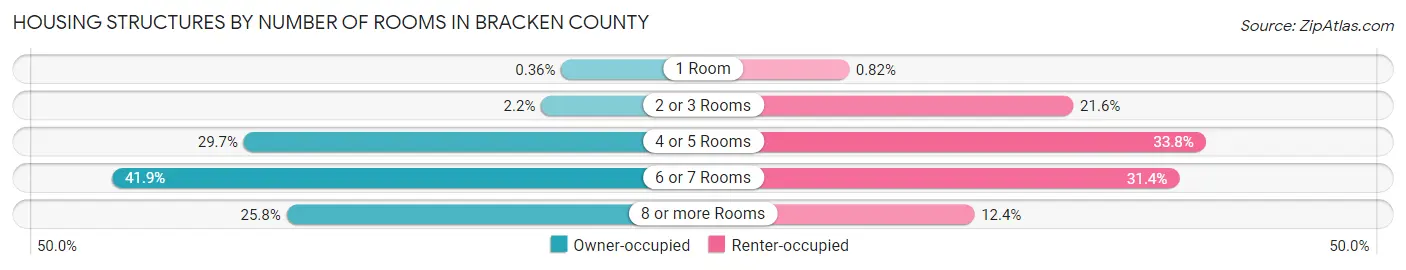
| Number of Rooms | Owner-occupied | Renter-occupied |
| 1 Room | 9 (0.4%) | 5 (0.8%) |
| 2 or 3 Rooms | 56 (2.2%) | 132 (21.6%) |
| 4 or 5 Rooms | 751 (29.7%) | 207 (33.8%) |
| 6 or 7 Rooms | 1,059 (41.9%) | 192 (31.4%) |
| 8 or more Rooms | 651 (25.8%) | 76 (12.4%) |
| Total | 2,526 (100.0%) | 612 (100.0%) |
Housing Structure by Heating Type in Bracken County
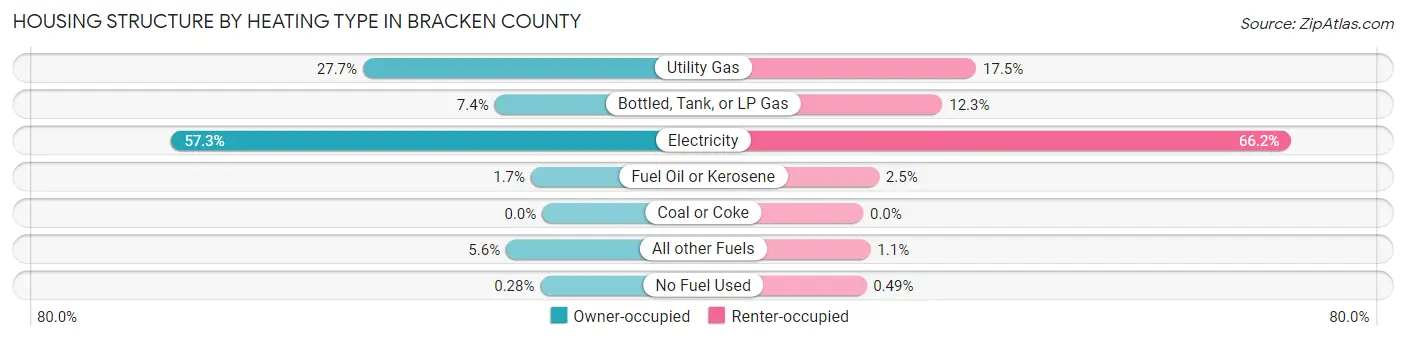
| Heating Type | Owner-occupied | Renter-occupied |
| Utility Gas | 700 (27.7%) | 107 (17.5%) |
| Bottled, Tank, or LP Gas | 186 (7.4%) | 75 (12.2%) |
| Electricity | 1,448 (57.3%) | 405 (66.2%) |
| Fuel Oil or Kerosene | 44 (1.7%) | 15 (2.5%) |
| Coal or Coke | 0 (0.0%) | 0 (0.0%) |
| All other Fuels | 141 (5.6%) | 7 (1.1%) |
| No Fuel Used | 7 (0.3%) | 3 (0.5%) |
| Total | 2,526 (100.0%) | 612 (100.0%) |
Household Vehicle Usage in Bracken County
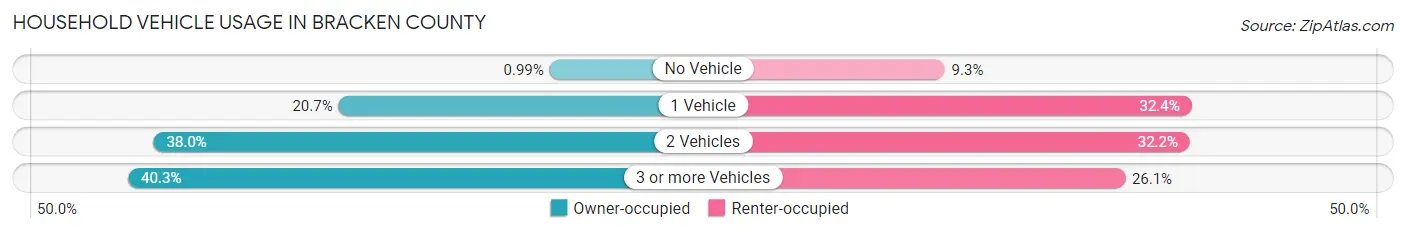
| Vehicles per Household | Owner-occupied | Renter-occupied |
| No Vehicle | 25 (1.0%) | 57 (9.3%) |
| 1 Vehicle | 523 (20.7%) | 198 (32.4%) |
| 2 Vehicles | 959 (38.0%) | 197 (32.2%) |
| 3 or more Vehicles | 1,019 (40.3%) | 160 (26.1%) |
| Total | 2,526 (100.0%) | 612 (100.0%) |
Real Estate & Mortgages in Bracken County
Real Estate and Mortgage Overview in Bracken County
| Characteristic | Without Mortgage | With Mortgage |
| Housing Units | 1,099 | 1,427 |
| Median Property Value | $90,900 | $139,800 |
| Median Household Income | $40,474 | $213 |
| Monthly Housing Costs | $427 | $59 |
| Real Estate Taxes | $569 | $55 |
Property Value by Mortgage Status in Bracken County
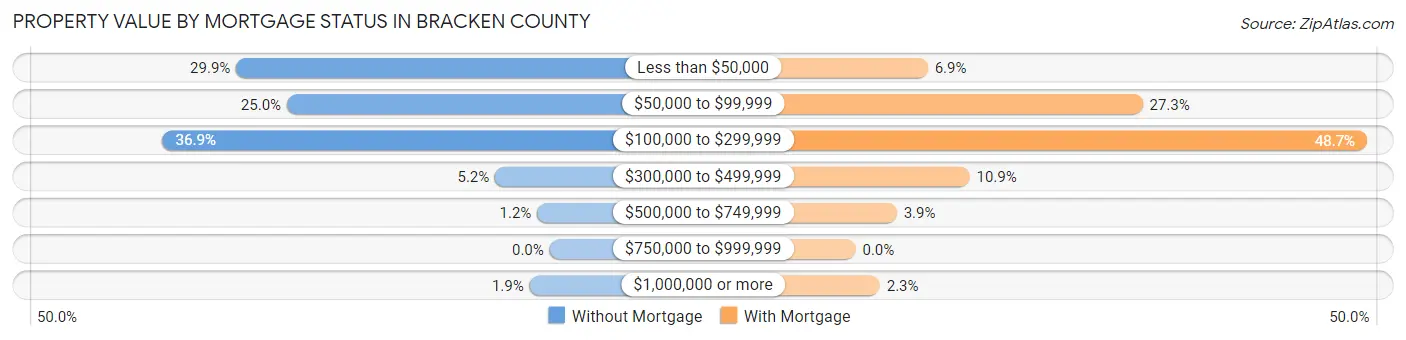
| Property Value | Without Mortgage | With Mortgage |
| Less than $50,000 | 328 (29.8%) | 98 (6.9%) |
| $50,000 to $99,999 | 275 (25.0%) | 390 (27.3%) |
| $100,000 to $299,999 | 405 (36.8%) | 695 (48.7%) |
| $300,000 to $499,999 | 57 (5.2%) | 155 (10.9%) |
| $500,000 to $749,999 | 13 (1.2%) | 56 (3.9%) |
| $750,000 to $999,999 | 0 (0.0%) | 0 (0.0%) |
| $1,000,000 or more | 21 (1.9%) | 33 (2.3%) |
| Total | 1,099 (100.0%) | 1,427 (100.0%) |
Household Income by Mortgage Status in Bracken County
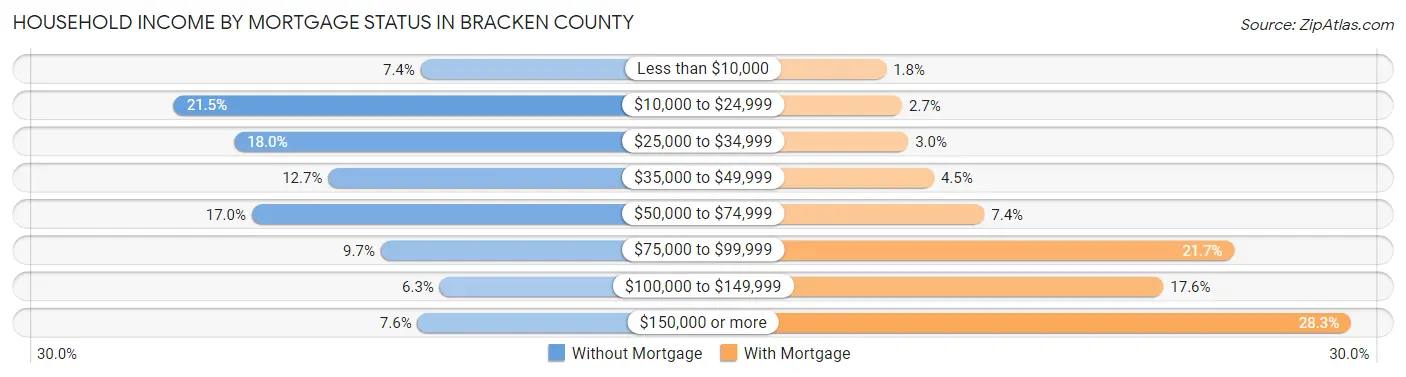
| Household Income | Without Mortgage | With Mortgage |
| Less than $10,000 | 81 (7.4%) | 25 (1.8%) |
| $10,000 to $24,999 | 236 (21.5%) | 38 (2.7%) |
| $25,000 to $34,999 | 198 (18.0%) | 43 (3.0%) |
| $35,000 to $49,999 | 139 (12.7%) | 64 (4.5%) |
| $50,000 to $74,999 | 187 (17.0%) | 105 (7.4%) |
| $75,000 to $99,999 | 106 (9.7%) | 309 (21.6%) |
| $100,000 to $149,999 | 69 (6.3%) | 251 (17.6%) |
| $150,000 or more | 83 (7.5%) | 404 (28.3%) |
| Total | 1,099 (100.0%) | 1,427 (100.0%) |
Property Value to Household Income Ratio in Bracken County
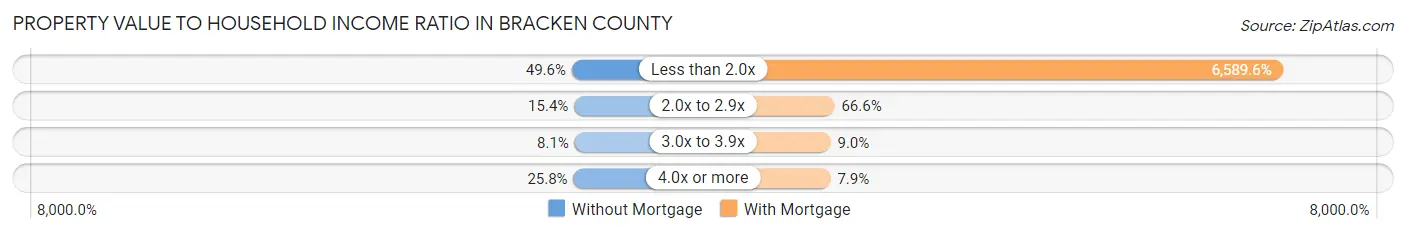
| Value-to-Income Ratio | Without Mortgage | With Mortgage |
| Less than 2.0x | 545 (49.6%) | 94,034 (6,589.6%) |
| 2.0x to 2.9x | 169 (15.4%) | 951 (66.6%) |
| 3.0x to 3.9x | 89 (8.1%) | 129 (9.0%) |
| 4.0x or more | 283 (25.8%) | 113 (7.9%) |
| Total | 1,099 (100.0%) | 1,427 (100.0%) |
Real Estate Taxes by Mortgage Status in Bracken County
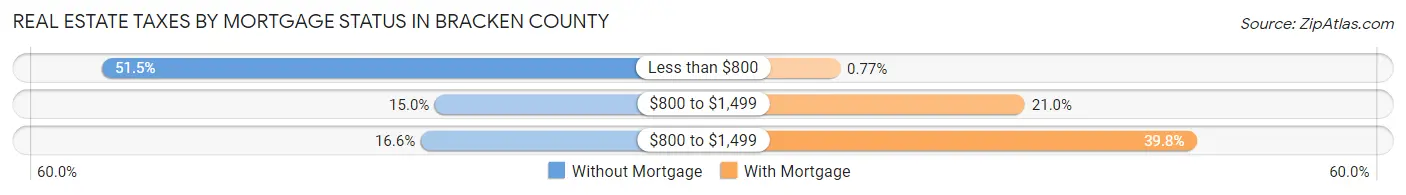
| Property Taxes | Without Mortgage | With Mortgage |
| Less than $800 | 566 (51.5%) | 11 (0.8%) |
| $800 to $1,499 | 165 (15.0%) | 300 (21.0%) |
| $800 to $1,499 | 182 (16.6%) | 568 (39.8%) |
| Total | 1,099 (100.0%) | 1,427 (100.0%) |
Health & Disability in Bracken County
Health Insurance Coverage by Age in Bracken County
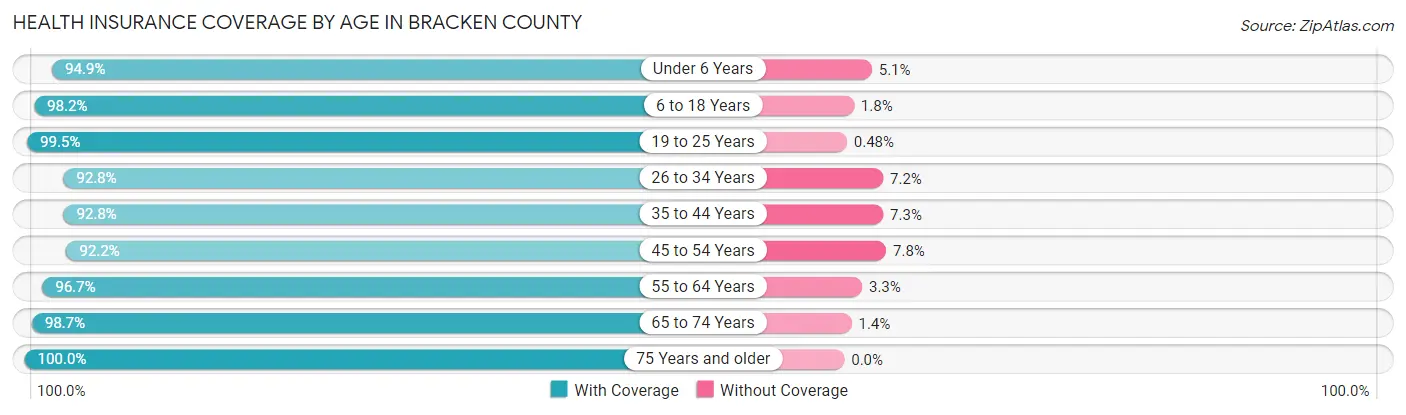
| Age Bracket | With Coverage | Without Coverage |
| Under 6 Years | 610 (94.9%) | 33 (5.1%) |
| 6 to 18 Years | 1,429 (98.2%) | 26 (1.8%) |
| 19 to 25 Years | 619 (99.5%) | 3 (0.5%) |
| 26 to 34 Years | 796 (92.8%) | 62 (7.2%) |
| 35 to 44 Years | 985 (92.7%) | 77 (7.2%) |
| 45 to 54 Years | 1,016 (92.2%) | 86 (7.8%) |
| 55 to 64 Years | 1,198 (96.7%) | 41 (3.3%) |
| 65 to 74 Years | 875 (98.7%) | 12 (1.3%) |
| 75 Years and older | 523 (100.0%) | 0 (0.0%) |
| Total | 8,051 (96.0%) | 340 (4.1%) |
Health Insurance Coverage by Citizenship Status in Bracken County
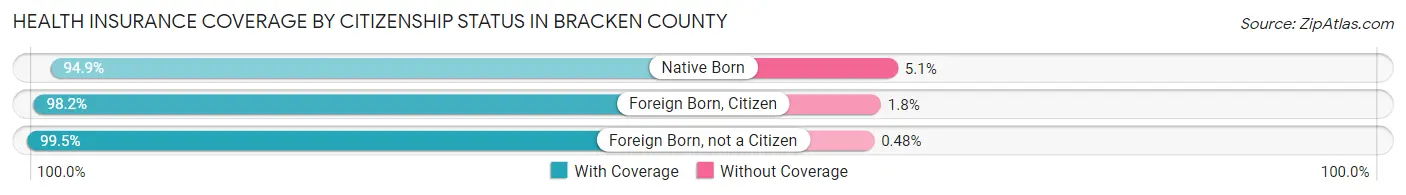
| Citizenship Status | With Coverage | Without Coverage |
| Native Born | 610 (94.9%) | 33 (5.1%) |
| Foreign Born, Citizen | 1,429 (98.2%) | 26 (1.8%) |
| Foreign Born, not a Citizen | 619 (99.5%) | 3 (0.5%) |
Health Insurance Coverage by Household Income in Bracken County
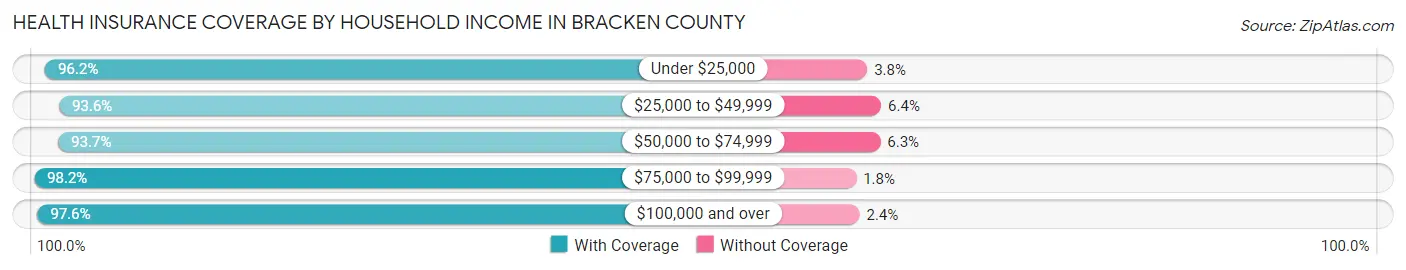
| Household Income | With Coverage | Without Coverage |
| Under $25,000 | 979 (96.2%) | 39 (3.8%) |
| $25,000 to $49,999 | 1,788 (93.6%) | 123 (6.4%) |
| $50,000 to $74,999 | 1,313 (93.7%) | 88 (6.3%) |
| $75,000 to $99,999 | 1,116 (98.2%) | 20 (1.8%) |
| $100,000 and over | 2,855 (97.6%) | 70 (2.4%) |
Public vs Private Health Insurance Coverage by Age in Bracken County
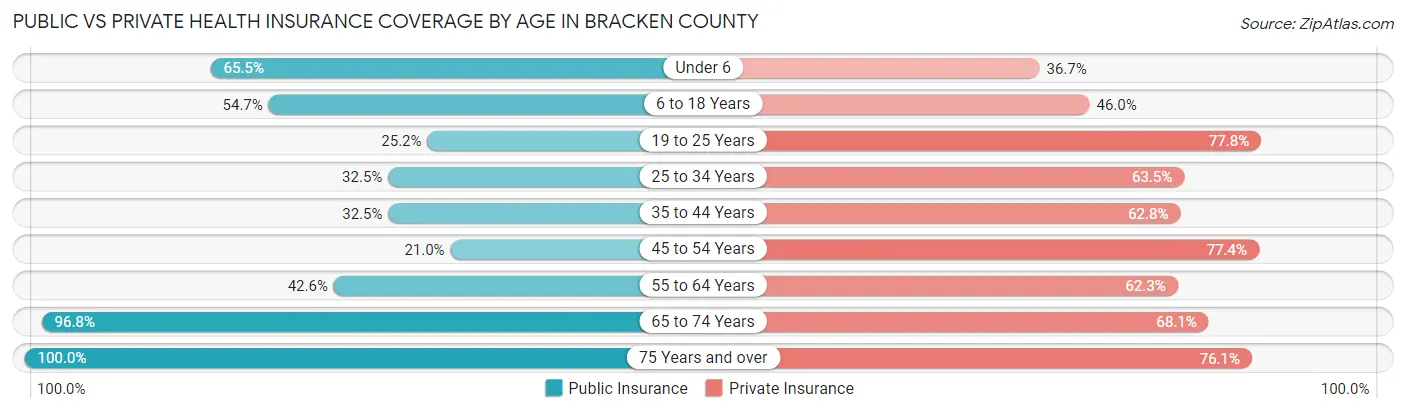
| Age Bracket | Public Insurance | Private Insurance |
| Under 6 | 421 (65.5%) | 236 (36.7%) |
| 6 to 18 Years | 796 (54.7%) | 669 (46.0%) |
| 19 to 25 Years | 157 (25.2%) | 484 (77.8%) |
| 25 to 34 Years | 279 (32.5%) | 545 (63.5%) |
| 35 to 44 Years | 345 (32.5%) | 667 (62.8%) |
| 45 to 54 Years | 231 (21.0%) | 853 (77.4%) |
| 55 to 64 Years | 528 (42.6%) | 772 (62.3%) |
| 65 to 74 Years | 859 (96.8%) | 604 (68.1%) |
| 75 Years and over | 523 (100.0%) | 398 (76.1%) |
| Total | 4,139 (49.3%) | 5,228 (62.3%) |
Disability Status by Sex by Age in Bracken County
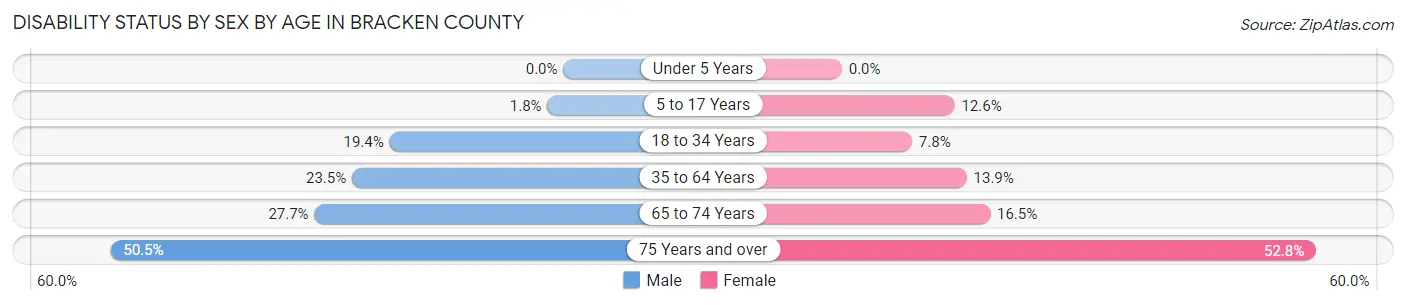
| Age Bracket | Male | Female |
| Under 5 Years | 0 (0.0%) | 0 (0.0%) |
| 5 to 17 Years | 14 (1.8%) | 87 (12.6%) |
| 18 to 34 Years | 151 (19.4%) | 64 (7.8%) |
| 35 to 64 Years | 413 (23.5%) | 229 (13.9%) |
| 65 to 74 Years | 125 (27.7%) | 72 (16.5%) |
| 75 Years and over | 111 (50.4%) | 160 (52.8%) |
Disability Class by Sex by Age in Bracken County
Disability Class: Hearing Difficulty
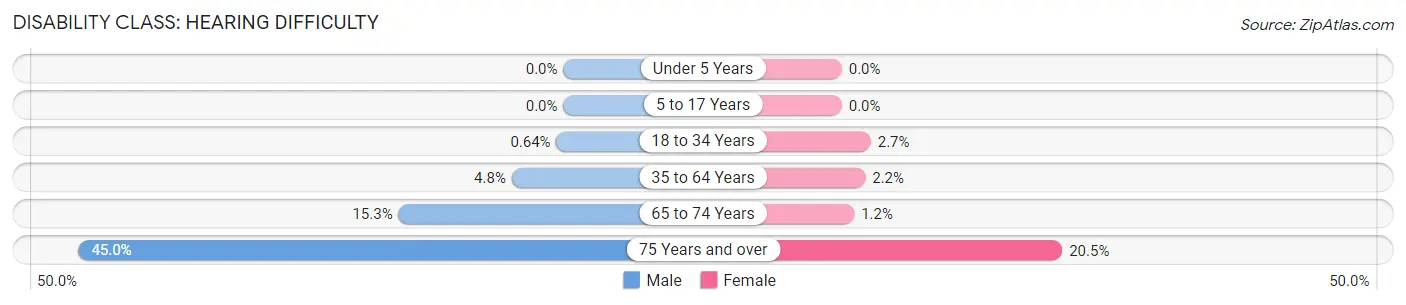
| Age Bracket | Male | Female |
| Under 5 Years | 0 (0.0%) | 0 (0.0%) |
| 5 to 17 Years | 0 (0.0%) | 0 (0.0%) |
| 18 to 34 Years | 5 (0.6%) | 22 (2.7%) |
| 35 to 64 Years | 84 (4.8%) | 36 (2.2%) |
| 65 to 74 Years | 69 (15.3%) | 5 (1.1%) |
| 75 Years and over | 99 (45.0%) | 62 (20.5%) |
Disability Class: Vision Difficulty
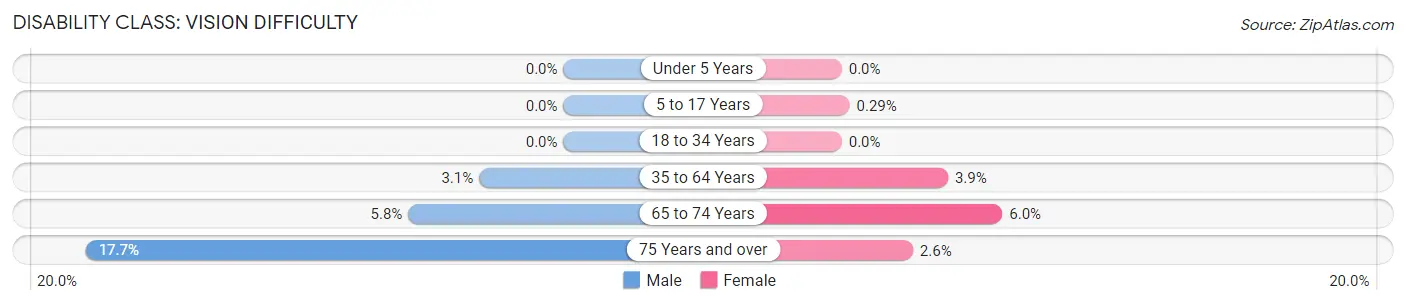
| Age Bracket | Male | Female |
| Under 5 Years | 0 (0.0%) | 0 (0.0%) |
| 5 to 17 Years | 0 (0.0%) | 2 (0.3%) |
| 18 to 34 Years | 0 (0.0%) | 0 (0.0%) |
| 35 to 64 Years | 55 (3.1%) | 65 (3.9%) |
| 65 to 74 Years | 26 (5.8%) | 26 (6.0%) |
| 75 Years and over | 39 (17.7%) | 8 (2.6%) |
Disability Class: Cognitive Difficulty
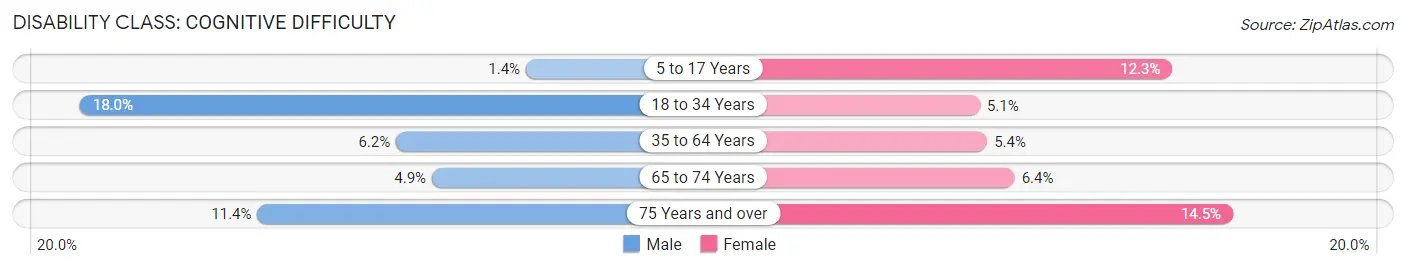
| Age Bracket | Male | Female |
| 5 to 17 Years | 11 (1.4%) | 85 (12.3%) |
| 18 to 34 Years | 140 (17.9%) | 42 (5.1%) |
| 35 to 64 Years | 109 (6.2%) | 89 (5.4%) |
| 65 to 74 Years | 22 (4.9%) | 28 (6.4%) |
| 75 Years and over | 25 (11.4%) | 44 (14.5%) |
Disability Class: Ambulatory Difficulty
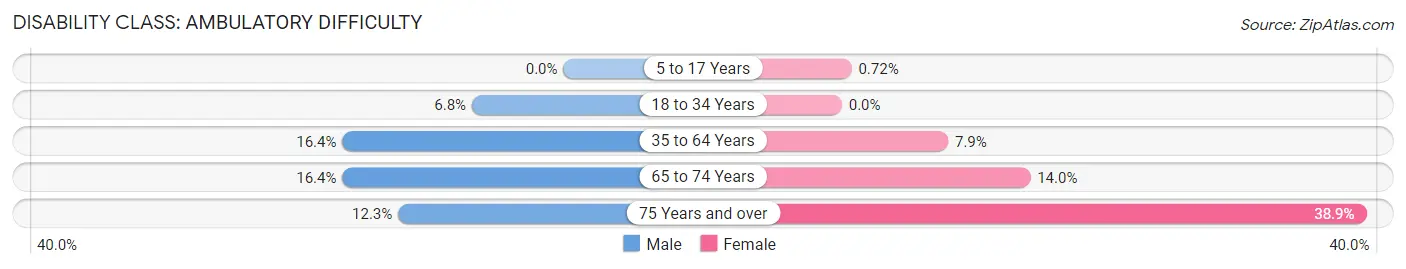
| Age Bracket | Male | Female |
| 5 to 17 Years | 0 (0.0%) | 5 (0.7%) |
| 18 to 34 Years | 53 (6.8%) | 0 (0.0%) |
| 35 to 64 Years | 288 (16.4%) | 130 (7.9%) |
| 65 to 74 Years | 74 (16.4%) | 61 (14.0%) |
| 75 Years and over | 27 (12.3%) | 118 (38.9%) |
Disability Class: Self-Care Difficulty
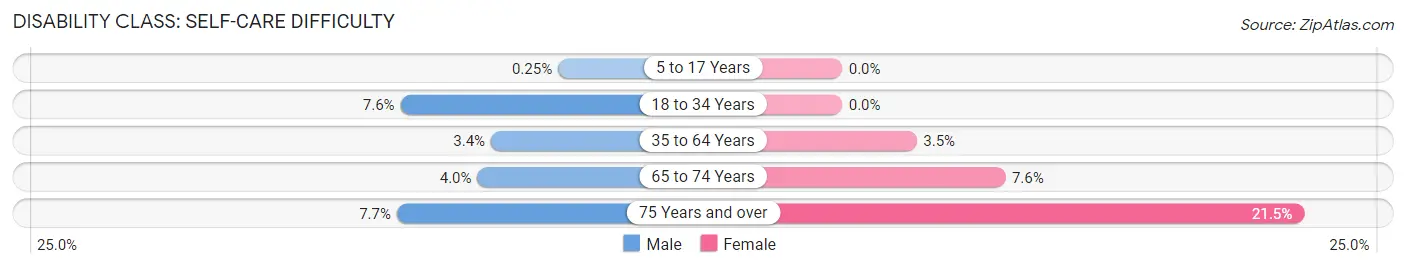
| Age Bracket | Male | Female |
| 5 to 17 Years | 2 (0.3%) | 0 (0.0%) |
| 18 to 34 Years | 59 (7.6%) | 0 (0.0%) |
| 35 to 64 Years | 59 (3.4%) | 57 (3.5%) |
| 65 to 74 Years | 18 (4.0%) | 33 (7.6%) |
| 75 Years and over | 17 (7.7%) | 65 (21.4%) |
Technology Access in Bracken County
Computing Device Access in Bracken County
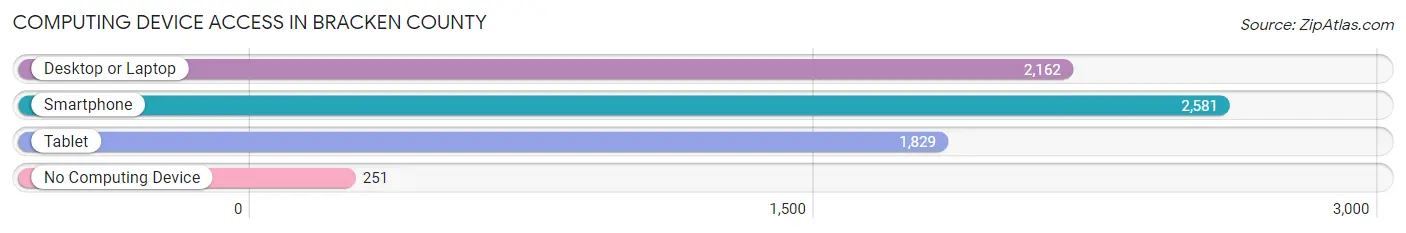
| Device Type | # Households | % Households |
| Desktop or Laptop | 2,162 | 68.9% |
| Smartphone | 2,581 | 82.3% |
| Tablet | 1,829 | 58.3% |
| No Computing Device | 251 | 8.0% |
| Total | 3,138 | 100.0% |
Internet Access in Bracken County
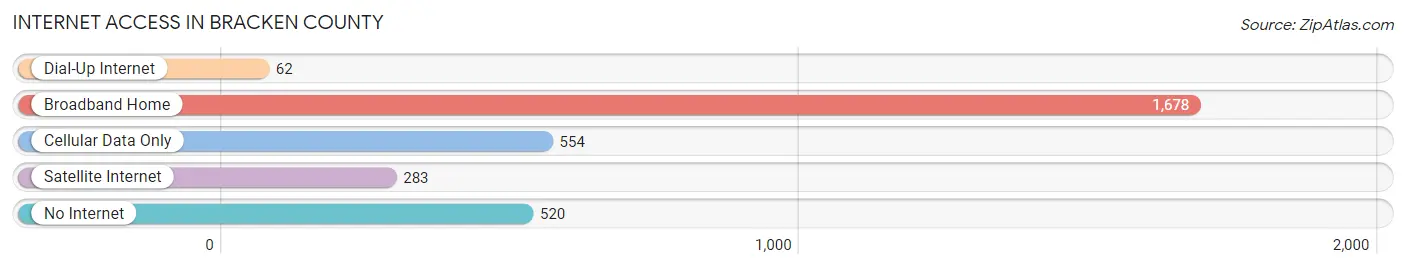
| Internet Type | # Households | % Households |
| Dial-Up Internet | 62 | 2.0% |
| Broadband Home | 1,678 | 53.5% |
| Cellular Data Only | 554 | 17.6% |
| Satellite Internet | 283 | 9.0% |
| No Internet | 520 | 16.6% |
| Total | 3,138 | 100.0% |
Bracken County Summary
Bracken County is located in the northeastern part of Kentucky, in the foothills of the Appalachian Mountains. It is bordered by Mason County to the north, Robertson County to the east, Lewis County to the south, and Pendleton County to the west. The county seat is Brooksville, and the county has a total area of 246 square miles.
History
Bracken County was formed in 1796 from parts of Mason and Campbell counties. It was named for two nearby creeks, the Bracken and the Licking. The county was originally part of the Virginia Military District, and was surveyed by Revolutionary War veterans in 1787. The first settlers arrived in the area in 1790, and the county was officially established in 1796.
The county was home to several Native American tribes, including the Shawnee, Miami, and Wyandot. The first European settlers were mostly of German and Scots-Irish descent. The county was an important stop on the Underground Railroad, and several abolitionists lived in the area.
Geography
Bracken County is located in the northeastern part of Kentucky, in the foothills of the Appalachian Mountains. It is bordered by Mason County to the north, Robertson County to the east, Lewis County to the south, and Pendleton County to the west. The county seat is Brooksville, and the county has a total area of 246 square miles.
The terrain of the county is mostly rolling hills, with some flat areas in the valleys. The highest point in the county is located in the northwest corner, at an elevation of 1,068 feet. The county is drained by the Licking River, which flows through the center of the county.
Economy
The economy of Bracken County is largely based on agriculture. The county is home to several large farms, and the main crops grown in the area are corn, soybeans, and wheat. The county also has a thriving livestock industry, with cattle, hogs, and sheep being raised in the area.
The county also has a strong manufacturing sector, with several factories producing furniture, automotive parts, and other products. The county is also home to several small businesses, including restaurants, retail stores, and service providers.
Demographics
As of the 2010 census, the population of Bracken County was 8,488. The population is mostly white (97.2%), with a small African American population (1.2%) and a small Hispanic population (0.7%). The median household income in the county is $41,945, and the median age is 41.7 years.
Bracken County is a rural county, with most of the population living in small towns and villages. The largest city in the county is Brooksville, with a population of 1,845. Other towns in the county include Augusta, Germantown, and Augusta.
Common Questions
What is Per Capita Income in Bracken County?
Per Capita income in Bracken County is $29,164.
What is the Median Family Income in Bracken County?
Median Family Income in Bracken County is $77,524.
What is the Median Household income in Bracken County?
Median Household Income in Bracken County is $59,911.
What is Income or Wage Gap in Bracken County?
Income or Wage Gap in Bracken County is 39.5%.
Women in Bracken County earn 60.5 cents for every dollar earned by a man.
What is Family Income Deficit in Bracken County?
Family Income Deficit in Bracken County is $13,395.
Families that are below poverty line in Bracken County earn $13,395 less on average than the poverty threshold level.
What is Inequality or Gini Index in Bracken County?
Inequality or Gini Index in Bracken County is 0.43.
What is the Total Population of Bracken County?
Total Population of Bracken County is 8,420.
What is the Total Male Population of Bracken County?
Total Male Population of Bracken County is 4,238.
What is the Total Female Population of Bracken County?
Total Female Population of Bracken County is 4,182.
What is the Ratio of Males per 100 Females in Bracken County?
There are 101.34 Males per 100 Females in Bracken County.
What is the Ratio of Females per 100 Males in Bracken County?
There are 98.68 Females per 100 Males in Bracken County.
What is the Median Population Age in Bracken County?
Median Population Age in Bracken County is 41.7 Years.
What is the Average Family Size in Bracken County
Average Family Size in Bracken County is 3.2 People.
What is the Average Household Size in Bracken County
Average Household Size in Bracken County is 2.7 People.
How Large is the Labor Force in Bracken County?
There are 3,952 People in the Labor Forcein in Bracken County.
What is the Percentage of People in the Labor Force in Bracken County?
59.2% of People are in the Labor Force in Bracken County.
What is the Unemployment Rate in Bracken County?
Unemployment Rate in Bracken County is 6.2%.