Bourbon County, KY Map & Demographics
Bourbon County Map
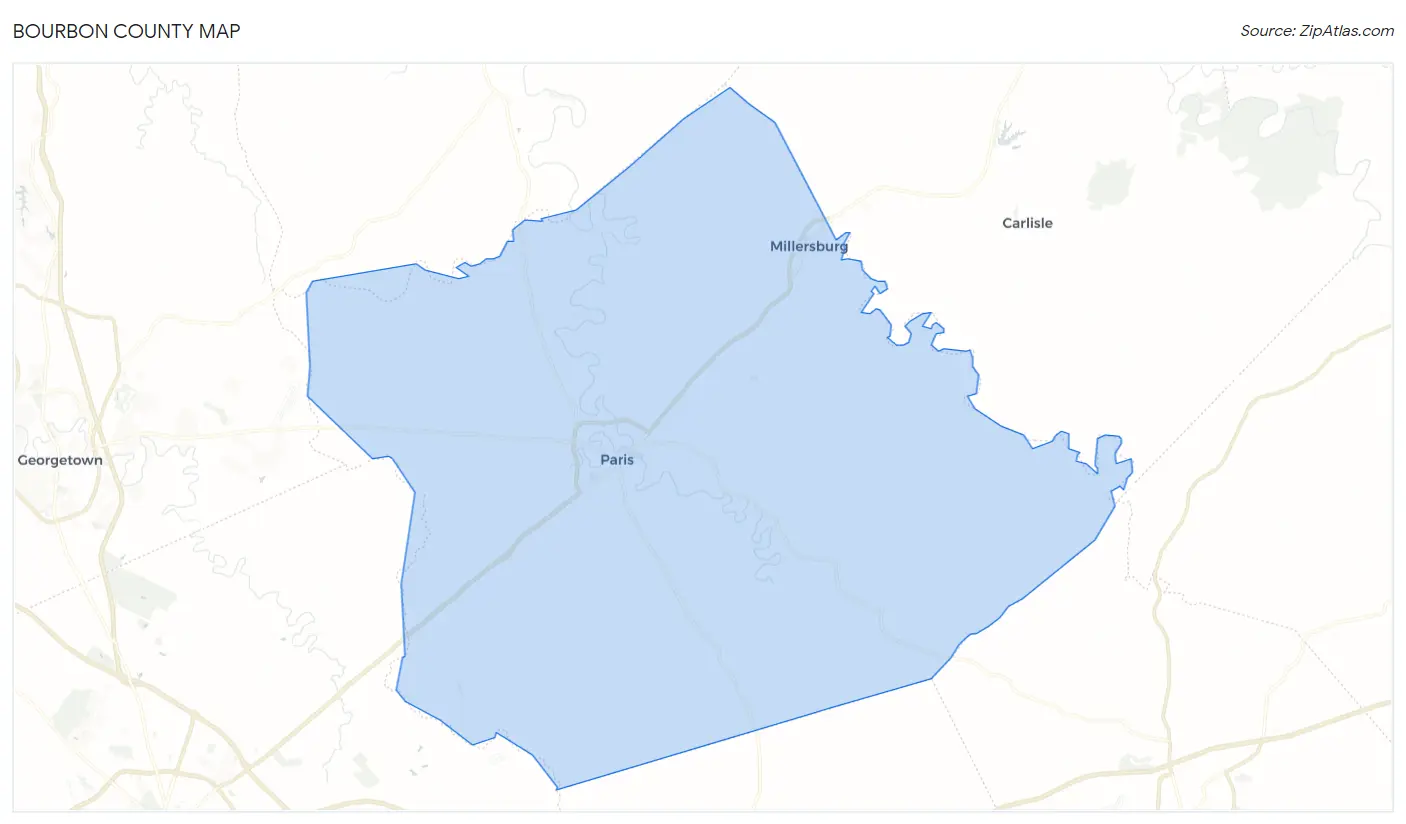
Bourbon County Overview
$30,123
PER CAPITA INCOME
$71,530
AVG FAMILY INCOME
$54,580
AVG HOUSEHOLD INCOME
16.2%
WAGE / INCOME GAP [ % ]
83.8¢/ $1
WAGE / INCOME GAP [ $ ]
$8,304
FAMILY INCOME DEFICIT
0.45
INEQUALITY / GINI INDEX
20,228
TOTAL POPULATION
9,944
MALE POPULATION
10,284
FEMALE POPULATION
96.69
MALES / 100 FEMALES
103.42
FEMALES / 100 MALES
41.8
MEDIAN AGE
3.0
AVG FAMILY SIZE
2.5
AVG HOUSEHOLD SIZE
9,629
LABOR FORCE [ PEOPLE ]
59.6%
PERCENT IN LABOR FORCE
5.5%
UNEMPLOYMENT RATE
Bourbon County Area Codes
Income in Bourbon County
Income Overview in Bourbon County
Per Capita Income in Bourbon County is $30,123, while median incomes of families and households are $71,530 and $54,580 respectively.
| Characteristic | Number | Measure |
| Per Capita Income | 20,228 | $30,123 |
| Median Family Income | 5,099 | $71,530 |
| Mean Family Income | 5,099 | $88,349 |
| Median Household Income | 8,067 | $54,580 |
| Mean Household Income | 8,067 | $74,117 |
| Income Deficit | 5,099 | $8,304 |
| Wage / Income Gap (%) | 20,228 | 16.19% |
| Wage / Income Gap ($) | 20,228 | 83.81¢ per $1 |
| Gini / Inequality Index | 20,228 | 0.45 |
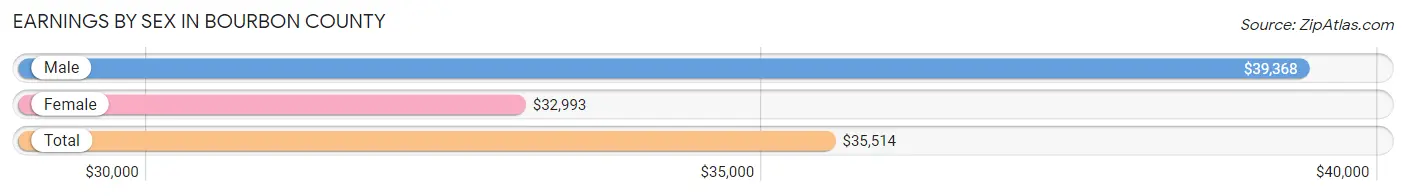
Earnings by Sex in Bourbon County
Average Earnings in Bourbon County are $35,514, $39,368 for men and $32,993 for women, a difference of 16.2%.
| Sex | Number | Average Earnings |
| Male | 5,177 (51.5%) | $39,368 |
| Female | 4,877 (48.5%) | $32,993 |
| Total | 10,054 (100.0%) | $35,514 |
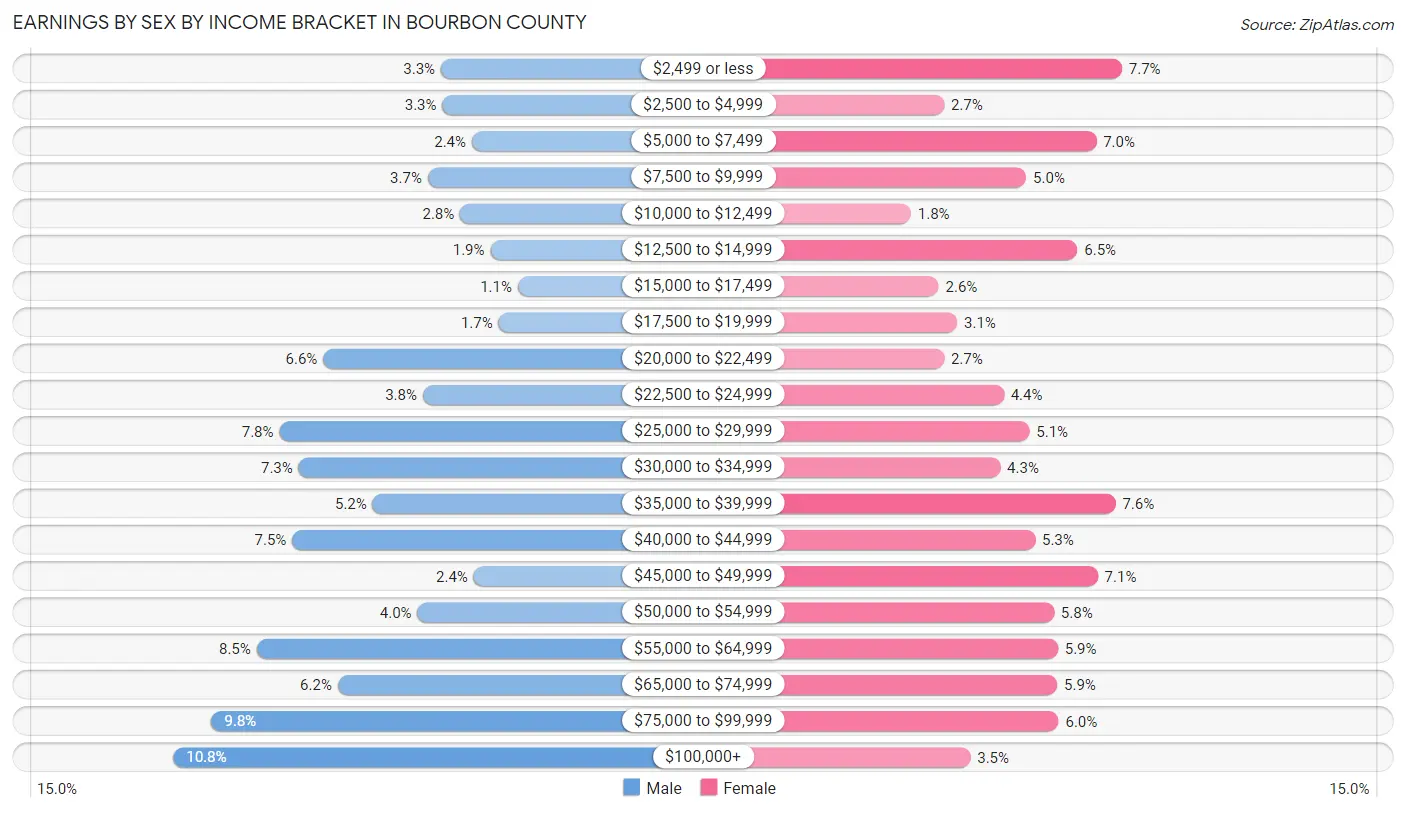
Earnings by Sex by Income Bracket in Bourbon County
The most common earnings brackets in Bourbon County are $100,000+ for men (560 | 10.8%) and $2,499 or less for women (377 | 7.7%).
| Income | Male | Female |
| $2,499 or less | 171 (3.3%) | 377 (7.7%) |
| $2,500 to $4,999 | 169 (3.3%) | 133 (2.7%) |
| $5,000 to $7,499 | 126 (2.4%) | 342 (7.0%) |
| $7,500 to $9,999 | 190 (3.7%) | 246 (5.0%) |
| $10,000 to $12,499 | 143 (2.8%) | 88 (1.8%) |
| $12,500 to $14,999 | 99 (1.9%) | 316 (6.5%) |
| $15,000 to $17,499 | 59 (1.1%) | 126 (2.6%) |
| $17,500 to $19,999 | 87 (1.7%) | 151 (3.1%) |
| $20,000 to $22,499 | 342 (6.6%) | 133 (2.7%) |
| $22,500 to $24,999 | 197 (3.8%) | 215 (4.4%) |
| $25,000 to $29,999 | 406 (7.8%) | 250 (5.1%) |
| $30,000 to $34,999 | 378 (7.3%) | 210 (4.3%) |
| $35,000 to $39,999 | 270 (5.2%) | 368 (7.5%) |
| $40,000 to $44,999 | 387 (7.5%) | 258 (5.3%) |
| $45,000 to $49,999 | 123 (2.4%) | 344 (7.0%) |
| $50,000 to $54,999 | 205 (4.0%) | 284 (5.8%) |
| $55,000 to $64,999 | 439 (8.5%) | 289 (5.9%) |
| $65,000 to $74,999 | 321 (6.2%) | 288 (5.9%) |
| $75,000 to $99,999 | 505 (9.8%) | 290 (5.9%) |
| $100,000+ | 560 (10.8%) | 169 (3.5%) |
| Total | 5,177 (100.0%) | 4,877 (100.0%) |
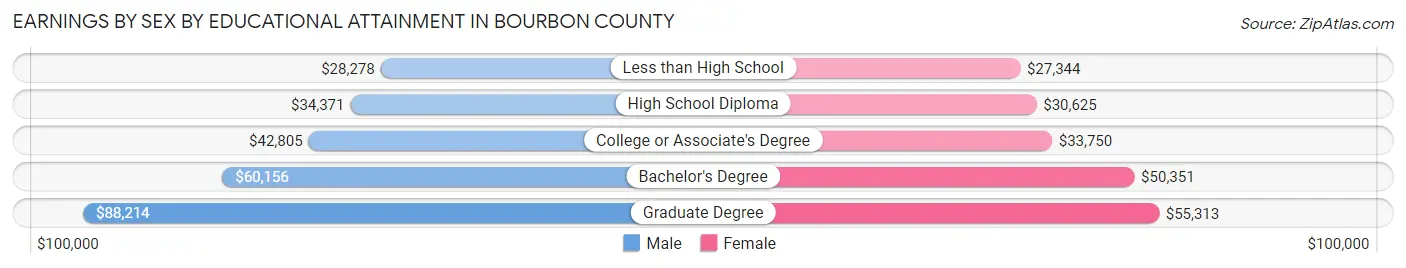
Earnings by Sex by Educational Attainment in Bourbon County
Average earnings in Bourbon County are $41,469 for men and $36,891 for women, a difference of 11.0%. Men with an educational attainment of graduate degree enjoy the highest average annual earnings of $88,214, while those with less than high school education earn the least with $28,278. Women with an educational attainment of graduate degree earn the most with the average annual earnings of $55,313, while those with less than high school education have the smallest earnings of $27,344.
| Educational Attainment | Male Income | Female Income |
| Less than High School | $28,278 | $27,344 |
| High School Diploma | $34,371 | $30,625 |
| College or Associate's Degree | $42,805 | $33,750 |
| Bachelor's Degree | $60,156 | $50,351 |
| Graduate Degree | $88,214 | $55,313 |
| Total | $41,469 | $36,891 |
Family Income in Bourbon County
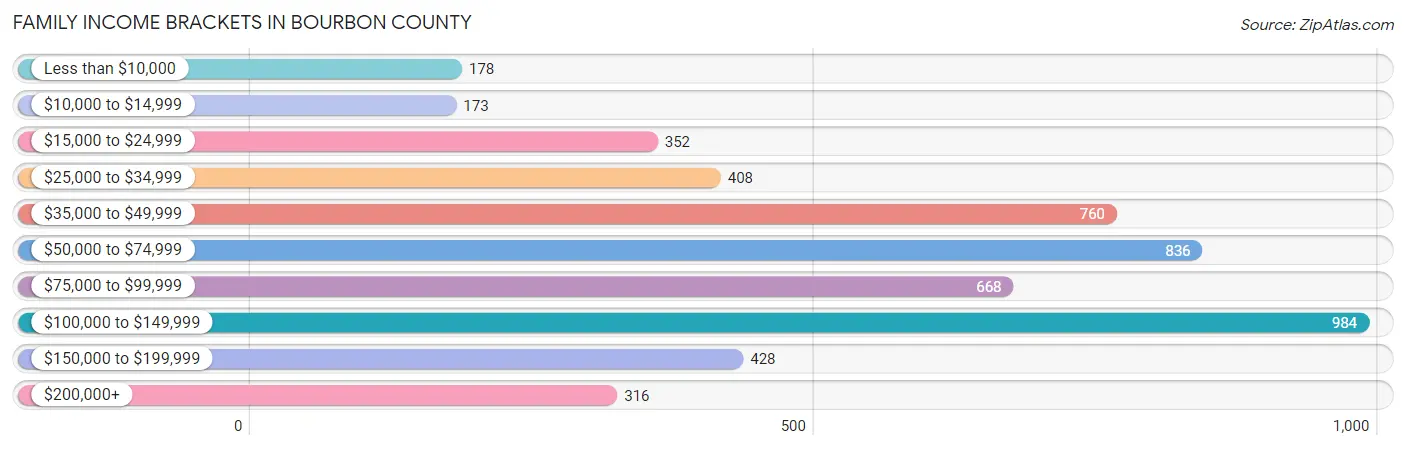
Family Income Brackets in Bourbon County
According to the Bourbon County family income data, there are 984 families falling into the $100,000 to $149,999 income range, which is the most common income bracket and makes up 19.3% of all families. Conversely, the $10,000 to $14,999 income bracket is the least frequent group with only 173 families (3.4%) belonging to this category.
| Income Bracket | # Families | % Families |
| Less than $10,000 | 178 | 3.5% |
| $10,000 to $14,999 | 173 | 3.4% |
| $15,000 to $24,999 | 352 | 6.9% |
| $25,000 to $34,999 | 408 | 8.0% |
| $35,000 to $49,999 | 760 | 14.9% |
| $50,000 to $74,999 | 836 | 16.4% |
| $75,000 to $99,999 | 668 | 13.1% |
| $100,000 to $149,999 | 984 | 19.3% |
| $150,000 to $199,999 | 428 | 8.4% |
| $200,000+ | 316 | 6.2% |
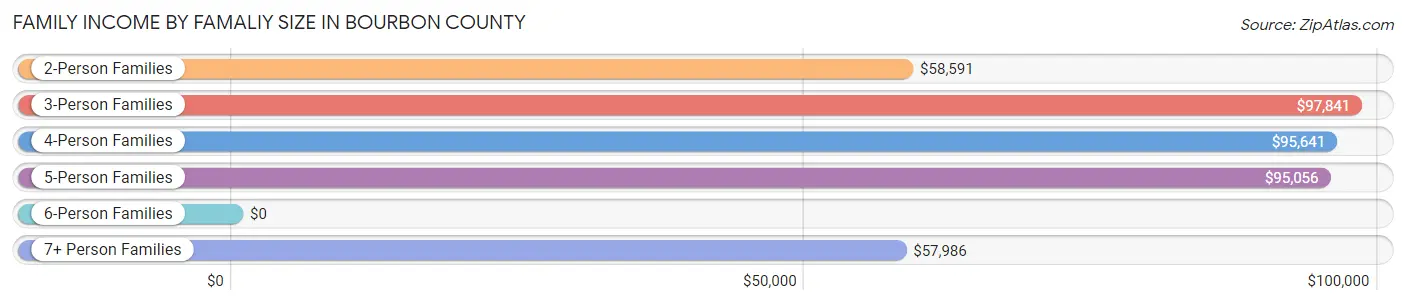
Family Income by Famaliy Size in Bourbon County
3-person families (911 | 17.9%) account for the highest median family income in Bourbon County with $97,841 per family, while 3-person families (911 | 17.9%) have the highest median income of $32,614 per family member.
| Income Bracket | # Families | Median Income |
| 2-Person Families | 2,904 (57.0%) | $58,591 |
| 3-Person Families | 911 (17.9%) | $97,841 |
| 4-Person Families | 824 (16.2%) | $95,641 |
| 5-Person Families | 316 (6.2%) | $95,056 |
| 6-Person Families | 37 (0.7%) | $0 |
| 7+ Person Families | 107 (2.1%) | $57,986 |
| Total | 5,099 (100.0%) | $71,530 |
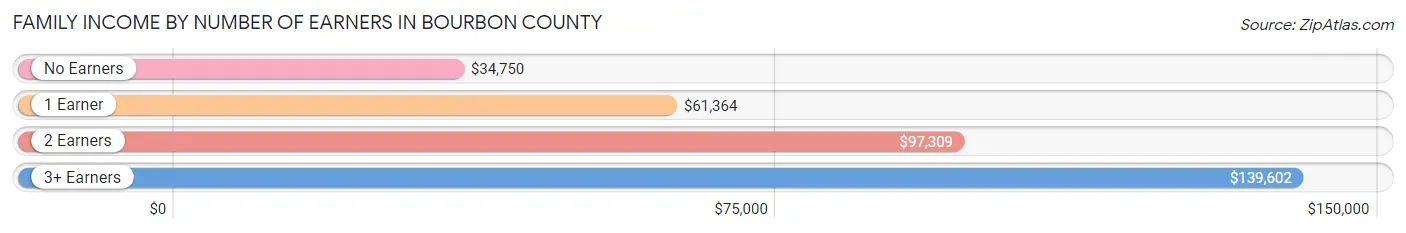
Family Income by Number of Earners in Bourbon County
The median family income in Bourbon County is $71,530, with families comprising 3+ earners (365) having the highest median family income of $139,602, while families with no earners (813) have the lowest median family income of $34,750, accounting for 7.2% and 15.9% of families, respectively.
| Number of Earners | # Families | Median Income |
| No Earners | 813 (15.9%) | $34,750 |
| 1 Earner | 2,058 (40.4%) | $61,364 |
| 2 Earners | 1,863 (36.5%) | $97,309 |
| 3+ Earners | 365 (7.2%) | $139,602 |
| Total | 5,099 (100.0%) | $71,530 |
Household Income in Bourbon County
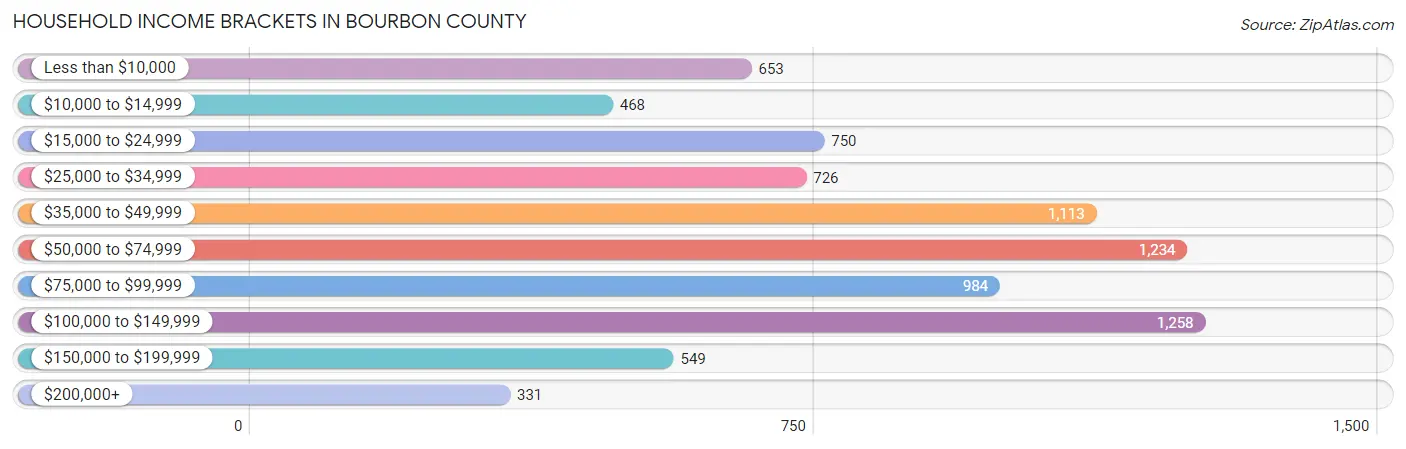
Household Income Brackets in Bourbon County
With 1,258 households falling in the category, the $100,000 to $149,999 income range is the most frequent in Bourbon County, accounting for 15.6% of all households. In contrast, only 331 households (4.1%) fall into the $200,000+ income bracket, making it the least populous group.
| Income Bracket | # Households | % Households |
| Less than $10,000 | 653 | 8.1% |
| $10,000 to $14,999 | 468 | 5.8% |
| $15,000 to $24,999 | 750 | 9.3% |
| $25,000 to $34,999 | 726 | 9.0% |
| $35,000 to $49,999 | 1,113 | 13.8% |
| $50,000 to $74,999 | 1,234 | 15.3% |
| $75,000 to $99,999 | 984 | 12.2% |
| $100,000 to $149,999 | 1,258 | 15.6% |
| $150,000 to $199,999 | 549 | 6.8% |
| $200,000+ | 331 | 4.1% |
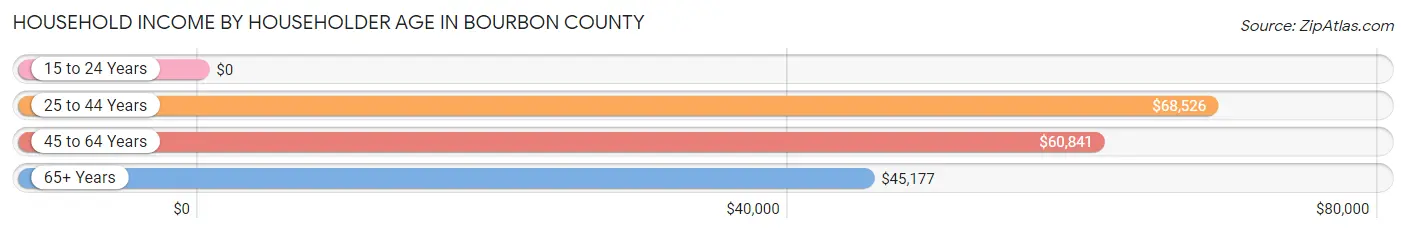
Household Income by Householder Age in Bourbon County
The median household income in Bourbon County is $54,580, with the highest median household income of $68,526 found in the 25 to 44 years age bracket for the primary householder. A total of 2,141 households (26.5%) fall into this category. Meanwhile, the 15 to 24 years age bracket for the primary householder has the lowest median household income of $0, with 208 households (2.6%) in this group.
| Income Bracket | # Households | Median Income |
| 15 to 24 Years | 208 (2.6%) | $0 |
| 25 to 44 Years | 2,141 (26.5%) | $68,526 |
| 45 to 64 Years | 3,333 (41.3%) | $60,841 |
| 65+ Years | 2,385 (29.6%) | $45,177 |
| Total | 8,067 (100.0%) | $54,580 |
Poverty in Bourbon County
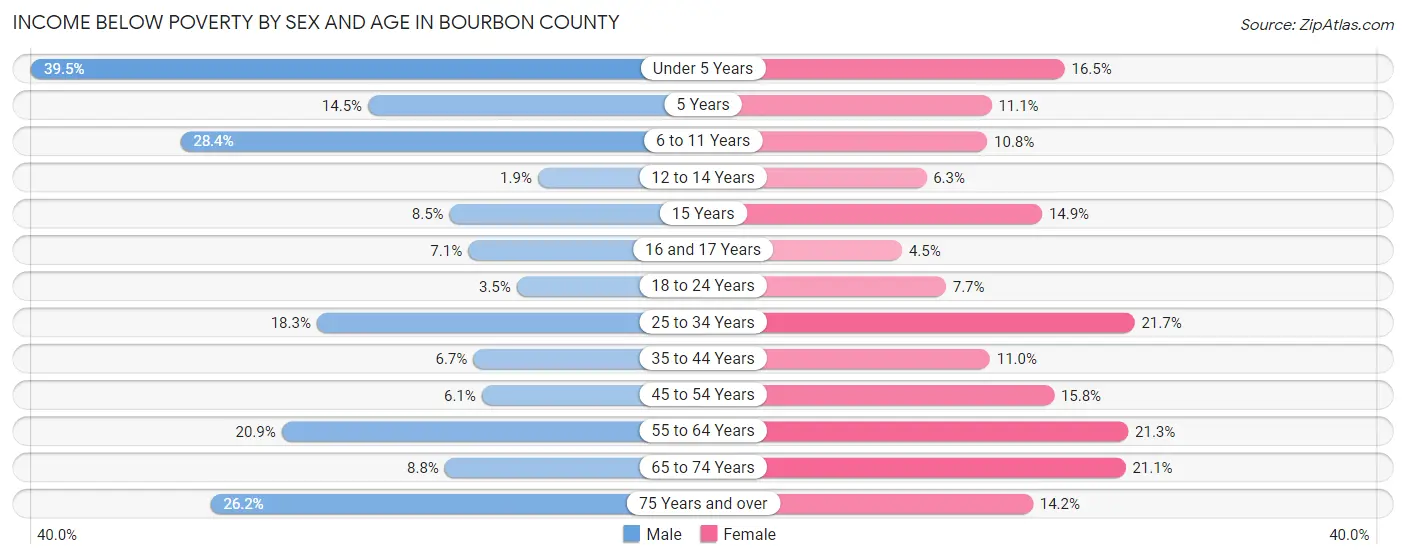
Income Below Poverty by Sex and Age in Bourbon County
With 14.8% poverty level for males and 15.4% for females among the residents of Bourbon County, under 5 year old males and 25 to 34 year old females are the most vulnerable to poverty, with 256 males (39.5%) and 264 females (21.7%) in their respective age groups living below the poverty level.
| Age Bracket | Male | Female |
| Under 5 Years | 256 (39.5%) | 84 (16.5%) |
| 5 Years | 28 (14.5%) | 12 (11.1%) |
| 6 to 11 Years | 186 (28.4%) | 68 (10.8%) |
| 12 to 14 Years | 10 (1.9%) | 32 (6.3%) |
| 15 Years | 11 (8.5%) | 11 (14.9%) |
| 16 and 17 Years | 15 (7.1%) | 13 (4.5%) |
| 18 to 24 Years | 30 (3.5%) | 66 (7.7%) |
| 25 to 34 Years | 202 (18.3%) | 264 (21.7%) |
| 35 to 44 Years | 76 (6.7%) | 117 (11.0%) |
| 45 to 54 Years | 73 (6.1%) | 217 (15.8%) |
| 55 to 64 Years | 301 (20.9%) | 310 (21.3%) |
| 65 to 74 Years | 89 (8.8%) | 250 (21.1%) |
| 75 Years and over | 164 (26.2%) | 130 (14.2%) |
| Total | 1,441 (14.8%) | 1,574 (15.4%) |
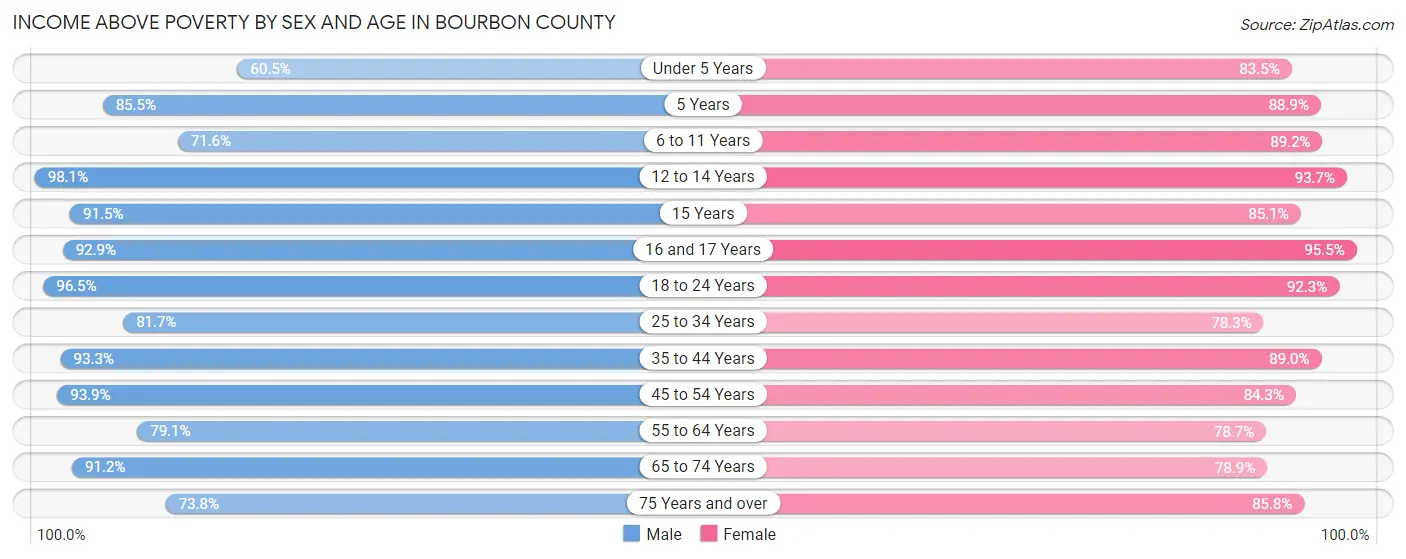
Income Above Poverty by Sex and Age in Bourbon County
According to the poverty statistics in Bourbon County, males aged 12 to 14 years and females aged 16 and 17 years are the age groups that are most secure financially, with 98.1% of males and 95.5% of females in these age groups living above the poverty line.
| Age Bracket | Male | Female |
| Under 5 Years | 392 (60.5%) | 424 (83.5%) |
| 5 Years | 165 (85.5%) | 96 (88.9%) |
| 6 to 11 Years | 468 (71.6%) | 562 (89.2%) |
| 12 to 14 Years | 517 (98.1%) | 478 (93.7%) |
| 15 Years | 119 (91.5%) | 63 (85.1%) |
| 16 and 17 Years | 197 (92.9%) | 278 (95.5%) |
| 18 to 24 Years | 835 (96.5%) | 789 (92.3%) |
| 25 to 34 Years | 901 (81.7%) | 951 (78.3%) |
| 35 to 44 Years | 1,059 (93.3%) | 948 (89.0%) |
| 45 to 54 Years | 1,130 (93.9%) | 1,161 (84.3%) |
| 55 to 64 Years | 1,138 (79.1%) | 1,148 (78.7%) |
| 65 to 74 Years | 921 (91.2%) | 937 (78.9%) |
| 75 Years and over | 462 (73.8%) | 787 (85.8%) |
| Total | 8,304 (85.2%) | 8,622 (84.6%) |
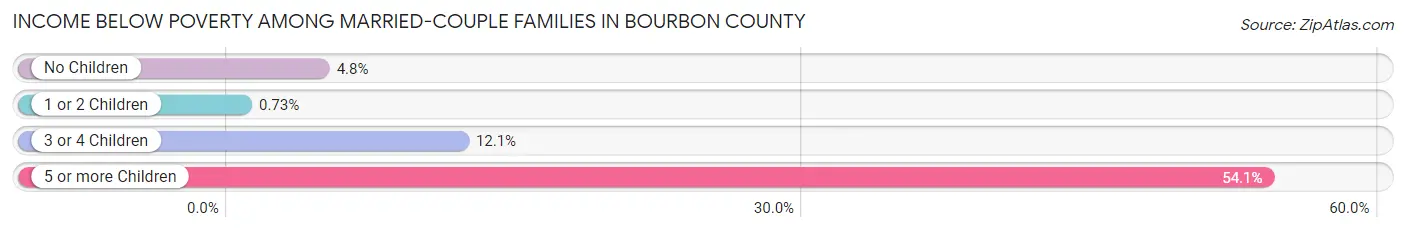
Income Below Poverty Among Married-Couple Families in Bourbon County
The poverty statistics for married-couple families in Bourbon County show that 5.4% or 192 of the total 3,555 families live below the poverty line. Families with 5 or more children have the highest poverty rate of 54.1%, comprising of 46 families. On the other hand, families with 1 or 2 children have the lowest poverty rate of 0.7%, which includes 7 families.
| Children | Above Poverty | Below Poverty |
| No Children | 2,149 (95.2%) | 108 (4.8%) |
| 1 or 2 Children | 949 (99.3%) | 7 (0.7%) |
| 3 or 4 Children | 226 (87.9%) | 31 (12.1%) |
| 5 or more Children | 39 (45.9%) | 46 (54.1%) |
| Total | 3,363 (94.6%) | 192 (5.4%) |
Income Below Poverty Among Single-Parent Households in Bourbon County
According to the poverty data in Bourbon County, 33.5% or 191 single-father households and 19.1% or 186 single-mother households are living below the poverty line. Among single-father households, those with 5 or more children have the highest poverty rate, with 4 households (100.0%) experiencing poverty. Likewise, among single-mother households, those with 3 or 4 children have the highest poverty rate, with 32 households (33.7%) falling below the poverty line.
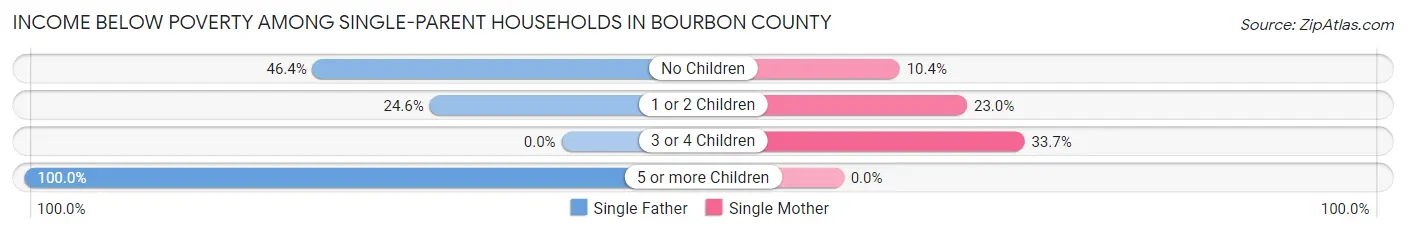
| Children | Single Father | Single Mother |
| No Children | 102 (46.4%) | 40 (10.4%) |
| 1 or 2 Children | 85 (24.6%) | 114 (23.0%) |
| 3 or 4 Children | 0 (0.0%) | 32 (33.7%) |
| 5 or more Children | 4 (100.0%) | 0 (0.0%) |
| Total | 191 (33.5%) | 186 (19.1%) |
Income Below Poverty Among Married-Couple vs Single-Parent Households in Bourbon County
The poverty data for Bourbon County shows that 192 of the married-couple family households (5.4%) and 377 of the single-parent households (24.4%) are living below the poverty level. Within the married-couple family households, those with 5 or more children have the highest poverty rate, with 46 households (54.1%) falling below the poverty line. Among the single-parent households, those with 5 or more children have the highest poverty rate, with 4 household (100.0%) living below poverty.
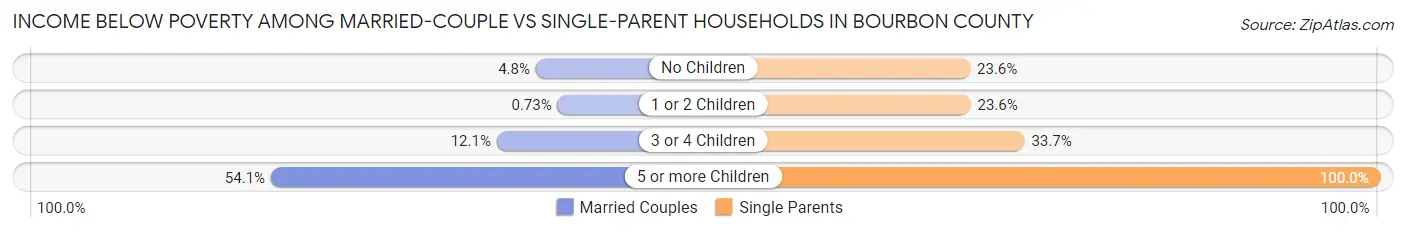
| Children | Married-Couple Families | Single-Parent Households |
| No Children | 108 (4.8%) | 142 (23.5%) |
| 1 or 2 Children | 7 (0.7%) | 199 (23.6%) |
| 3 or 4 Children | 31 (12.1%) | 32 (33.7%) |
| 5 or more Children | 46 (54.1%) | 4 (100.0%) |
| Total | 192 (5.4%) | 377 (24.4%) |
Race in Bourbon County
The most populous races in Bourbon County are White / Caucasian (17,459 | 86.3%), Hispanic or Latino (1,451 | 7.2%), and Two or more Races (1,239 | 6.1%).
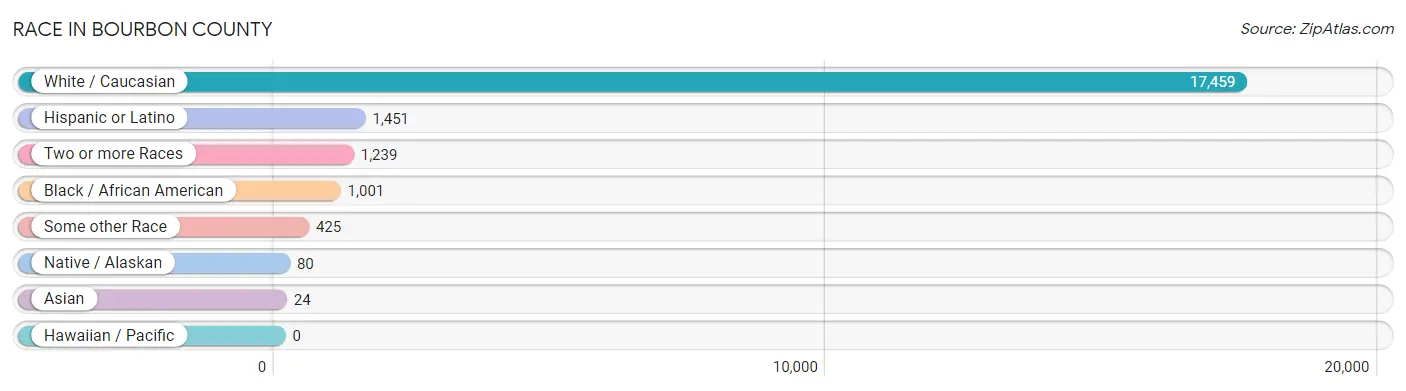
| Race | # Population | % Population |
| Asian | 24 | 0.1% |
| Black / African American | 1,001 | 5.0% |
| Hawaiian / Pacific | 0 | 0.0% |
| Hispanic or Latino | 1,451 | 7.2% |
| Native / Alaskan | 80 | 0.4% |
| White / Caucasian | 17,459 | 86.3% |
| Two or more Races | 1,239 | 6.1% |
| Some other Race | 425 | 2.1% |
| Total | 20,228 | 100.0% |
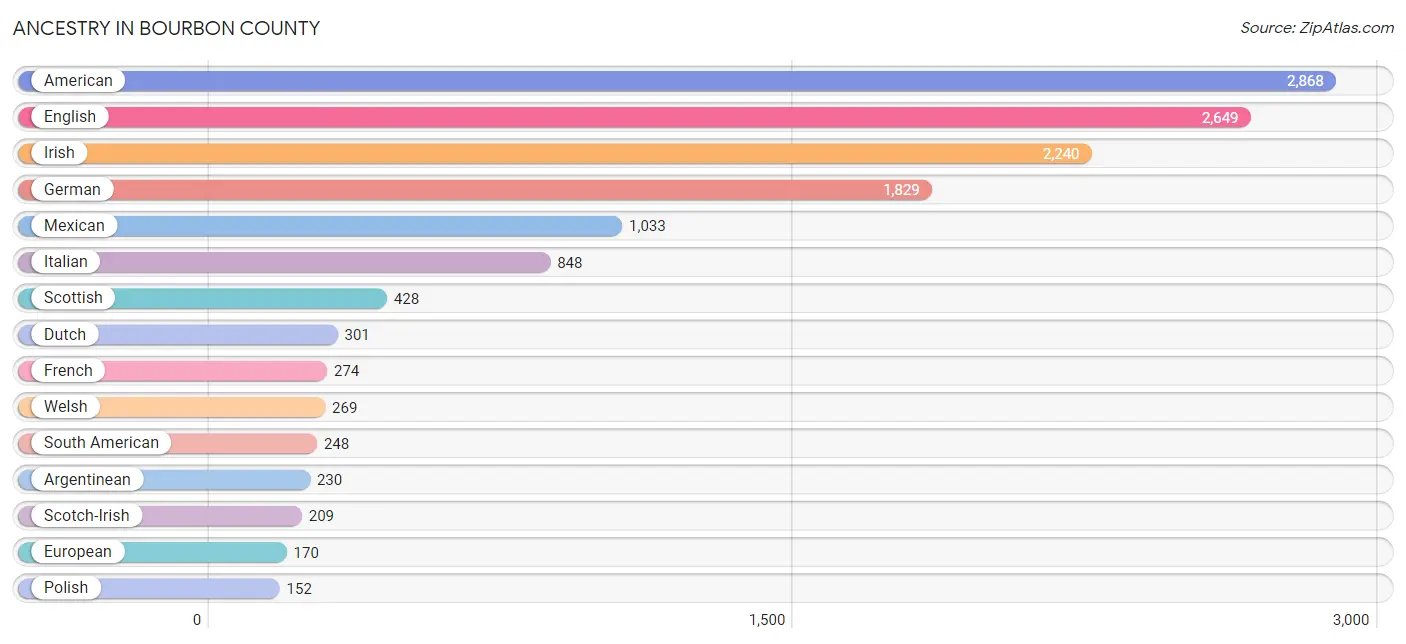
Ancestry in Bourbon County
The most populous ancestries reported in Bourbon County are American (2,868 | 14.2%), English (2,649 | 13.1%), Irish (2,240 | 11.1%), German (1,829 | 9.0%), and Mexican (1,033 | 5.1%), together accounting for 52.5% of all Bourbon County residents.
| Ancestry | # Population | % Population |
| African | 26 | 0.1% |
| American | 2,868 | 14.2% |
| Apache | 1 | 0.0% |
| Arab | 6 | 0.0% |
| Argentinean | 230 | 1.1% |
| Austrian | 18 | 0.1% |
| Bhutanese | 14 | 0.1% |
| British | 58 | 0.3% |
| Bulgarian | 9 | 0.0% |
| Canadian | 18 | 0.1% |
| Central American | 73 | 0.4% |
| Central American Indian | 36 | 0.2% |
| Cherokee | 37 | 0.2% |
| Czech | 14 | 0.1% |
| Czechoslovakian | 10 | 0.1% |
| Danish | 65 | 0.3% |
| Dominican | 16 | 0.1% |
| Dutch | 301 | 1.5% |
| English | 2,649 | 13.1% |
| European | 170 | 0.8% |
| French | 274 | 1.3% |
| French Canadian | 39 | 0.2% |
| German | 1,829 | 9.0% |
| Greek | 5 | 0.0% |
| Guatemalan | 73 | 0.4% |
| Hungarian | 24 | 0.1% |
| Indian (Asian) | 31 | 0.2% |
| Iranian | 10 | 0.1% |
| Irish | 2,240 | 11.1% |
| Italian | 848 | 4.2% |
| Laotian | 52 | 0.3% |
| Mexican | 1,033 | 5.1% |
| Mexican American Indian | 60 | 0.3% |
| Mongolian | 18 | 0.1% |
| Northern European | 83 | 0.4% |
| Norwegian | 30 | 0.2% |
| Polish | 152 | 0.7% |
| Portuguese | 100 | 0.5% |
| Potawatomi | 4 | 0.0% |
| Puerto Rican | 65 | 0.3% |
| Russian | 11 | 0.1% |
| Scandinavian | 36 | 0.2% |
| Scotch-Irish | 209 | 1.0% |
| Scottish | 428 | 2.1% |
| Sioux | 7 | 0.0% |
| Slovak | 5 | 0.0% |
| South American | 248 | 1.2% |
| Subsaharan African | 63 | 0.3% |
| Swedish | 103 | 0.5% |
| Swiss | 7 | 0.0% |
| Syrian | 6 | 0.0% |
| Ukrainian | 18 | 0.1% |
| Welsh | 269 | 1.3% | View All 53 Rows |
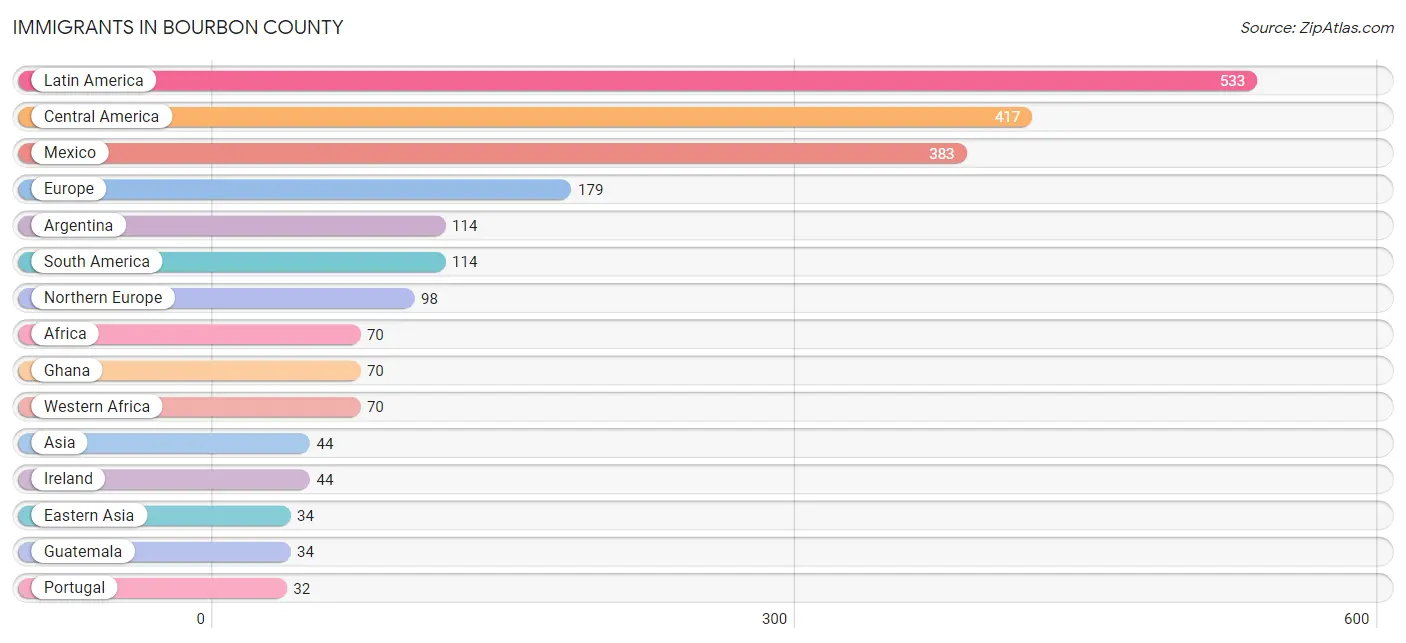
Immigrants in Bourbon County
The most numerous immigrant groups reported in Bourbon County came from Latin America (533 | 2.6%), Central America (417 | 2.1%), Mexico (383 | 1.9%), Europe (179 | 0.9%), and Argentina (114 | 0.6%), together accounting for 8.0% of all Bourbon County residents.
| Immigration Origin | # Population | % Population |
| Africa | 70 | 0.4% |
| Argentina | 114 | 0.6% |
| Asia | 44 | 0.2% |
| Canada | 29 | 0.1% |
| Caribbean | 2 | 0.0% |
| Central America | 417 | 2.1% |
| China | 17 | 0.1% |
| Eastern Asia | 34 | 0.2% |
| Eastern Europe | 24 | 0.1% |
| England | 27 | 0.1% |
| Europe | 179 | 0.9% |
| France | 25 | 0.1% |
| Ghana | 70 | 0.4% |
| Guatemala | 34 | 0.2% |
| Iran | 10 | 0.1% |
| Ireland | 44 | 0.2% |
| Jamaica | 2 | 0.0% |
| Japan | 7 | 0.0% |
| Korea | 10 | 0.1% |
| Latin America | 533 | 2.6% |
| Mexico | 383 | 1.9% |
| Northern Europe | 98 | 0.5% |
| Poland | 24 | 0.1% |
| Portugal | 32 | 0.2% |
| South America | 114 | 0.6% |
| South Central Asia | 10 | 0.1% |
| Southern Europe | 32 | 0.2% |
| Western Africa | 70 | 0.4% |
| Western Europe | 25 | 0.1% | View All 29 Rows |
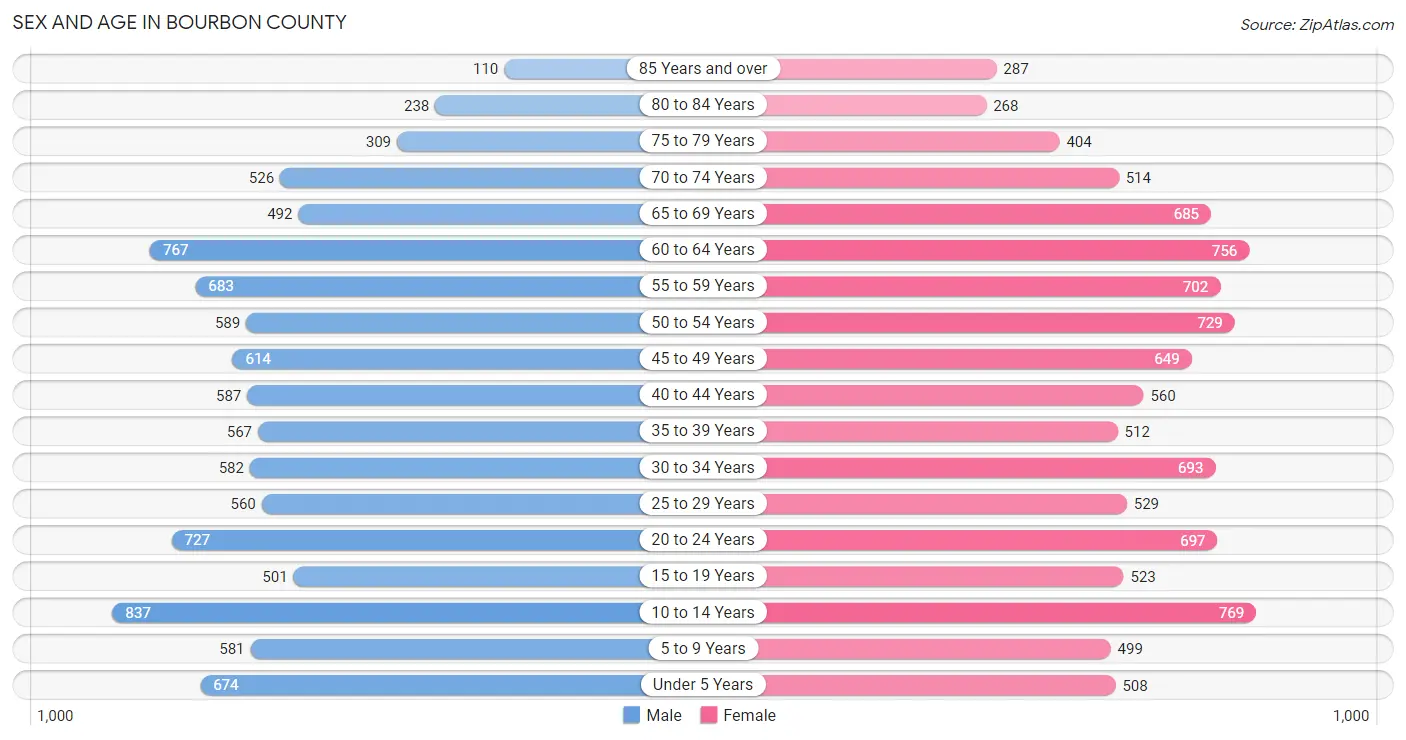
Sex and Age in Bourbon County
Sex and Age in Bourbon County
The most populous age groups in Bourbon County are 10 to 14 Years (837 | 8.4%) for men and 10 to 14 Years (769 | 7.5%) for women.
| Age Bracket | Male | Female |
| Under 5 Years | 674 (6.8%) | 508 (4.9%) |
| 5 to 9 Years | 581 (5.8%) | 499 (4.9%) |
| 10 to 14 Years | 837 (8.4%) | 769 (7.5%) |
| 15 to 19 Years | 501 (5.0%) | 523 (5.1%) |
| 20 to 24 Years | 727 (7.3%) | 697 (6.8%) |
| 25 to 29 Years | 560 (5.6%) | 529 (5.1%) |
| 30 to 34 Years | 582 (5.9%) | 693 (6.7%) |
| 35 to 39 Years | 567 (5.7%) | 512 (5.0%) |
| 40 to 44 Years | 587 (5.9%) | 560 (5.4%) |
| 45 to 49 Years | 614 (6.2%) | 649 (6.3%) |
| 50 to 54 Years | 589 (5.9%) | 729 (7.1%) |
| 55 to 59 Years | 683 (6.9%) | 702 (6.8%) |
| 60 to 64 Years | 767 (7.7%) | 756 (7.3%) |
| 65 to 69 Years | 492 (5.0%) | 685 (6.7%) |
| 70 to 74 Years | 526 (5.3%) | 514 (5.0%) |
| 75 to 79 Years | 309 (3.1%) | 404 (3.9%) |
| 80 to 84 Years | 238 (2.4%) | 268 (2.6%) |
| 85 Years and over | 110 (1.1%) | 287 (2.8%) |
| Total | 9,944 (100.0%) | 10,284 (100.0%) |
Families and Households in Bourbon County
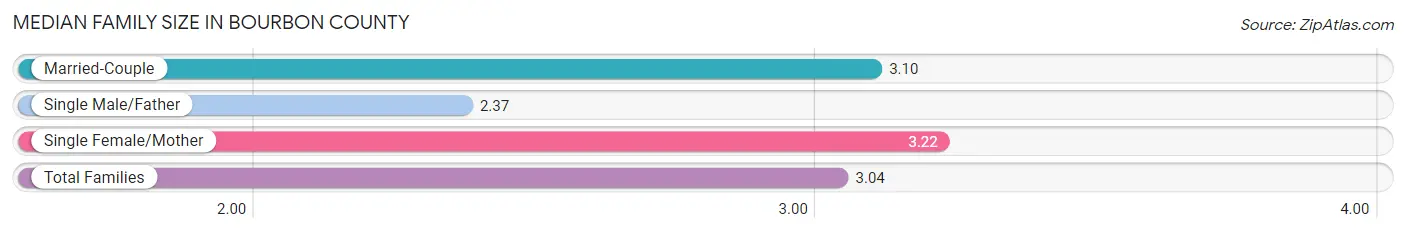
Median Family Size in Bourbon County
The median family size in Bourbon County is 3.04 persons per family, with single female/mother families (974 | 19.1%) accounting for the largest median family size of 3.22 persons per family. On the other hand, single male/father families (570 | 11.2%) represent the smallest median family size with 2.37 persons per family.
| Family Type | # Families | Family Size |
| Married-Couple | 3,555 (69.7%) | 3.10 |
| Single Male/Father | 570 (11.2%) | 2.37 |
| Single Female/Mother | 974 (19.1%) | 3.22 |
| Total Families | 5,099 (100.0%) | 3.04 |
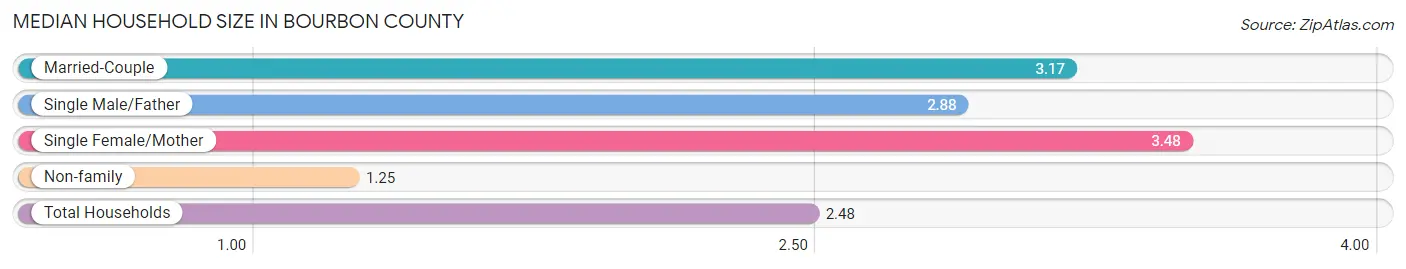
Median Household Size in Bourbon County
The median household size in Bourbon County is 2.48 persons per household, with single female/mother households (974 | 12.1%) accounting for the largest median household size of 3.48 persons per household. non-family households (2,968 | 36.8%) represent the smallest median household size with 1.25 persons per household.
| Household Type | # Households | Household Size |
| Married-Couple | 3,555 (44.1%) | 3.17 |
| Single Male/Father | 570 (7.1%) | 2.88 |
| Single Female/Mother | 974 (12.1%) | 3.48 |
| Non-family | 2,968 (36.8%) | 1.25 |
| Total Households | 8,067 (100.0%) | 2.48 |
Household Size by Marriage Status in Bourbon County
Out of a total of 8,067 households in Bourbon County, 5,099 (63.2%) are family households, while 2,968 (36.8%) are nonfamily households. The most numerous type of family households are 2-person households, comprising 2,542, and the most common type of nonfamily households are 1-person households, comprising 2,449.
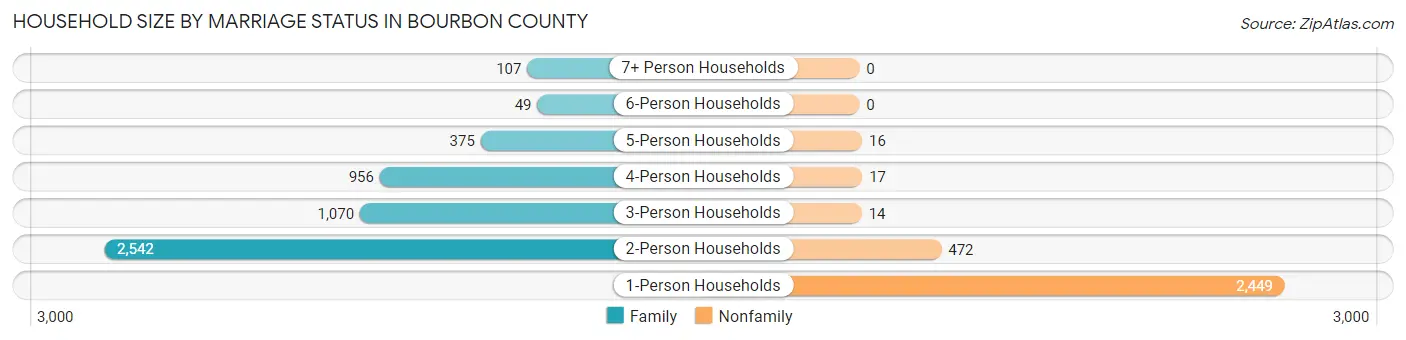
| Household Size | Family Households | Nonfamily Households |
| 1-Person Households | - | 2,449 (30.4%) |
| 2-Person Households | 2,542 (31.5%) | 472 (5.9%) |
| 3-Person Households | 1,070 (13.3%) | 14 (0.2%) |
| 4-Person Households | 956 (11.8%) | 17 (0.2%) |
| 5-Person Households | 375 (4.6%) | 16 (0.2%) |
| 6-Person Households | 49 (0.6%) | 0 (0.0%) |
| 7+ Person Households | 107 (1.3%) | 0 (0.0%) |
| Total | 5,099 (63.2%) | 2,968 (36.8%) |
Female Fertility in Bourbon County
Fertility by Age in Bourbon County
Average fertility rate in Bourbon County is 42.0 births per 1,000 women. Women in the age bracket of 20 to 34 years have the highest fertility rate with 93.0 births per 1,000 women. Women in the age bracket of 20 to 34 years acount for 97.3% of all women with births.
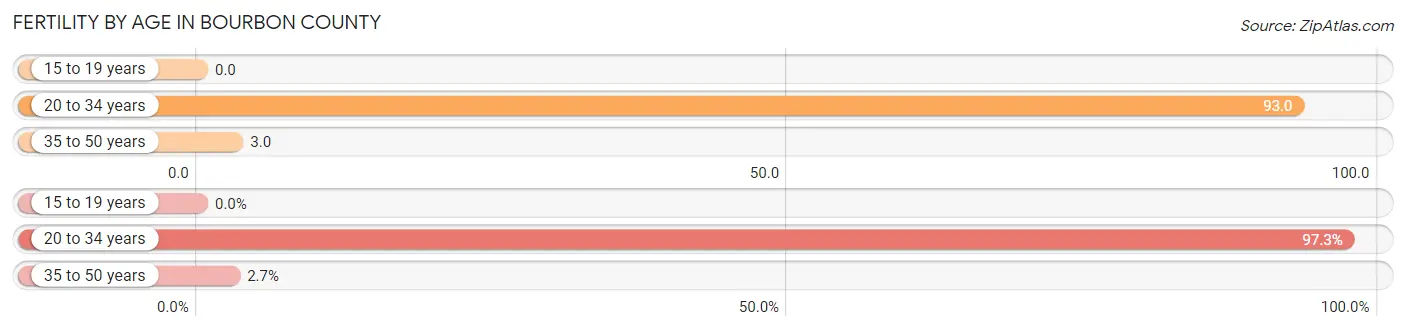
| Age Bracket | Women with Births | Births / 1,000 Women |
| 15 to 19 years | 0 (0.0%) | 0.0 |
| 20 to 34 years | 178 (97.3%) | 93.0 |
| 35 to 50 years | 5 (2.7%) | 3.0 |
| Total | 183 (100.0%) | 42.0 |
Fertility by Age by Marriage Status in Bourbon County
63.9% of women with births (183) in Bourbon County are married. The highest percentage of unmarried women with births falls into 20 to 34 years age bracket with 37.1% of them unmarried at the time of birth, while the lowest percentage of unmarried women with births belong to 35 to 50 years age bracket with 0.0% of them unmarried.
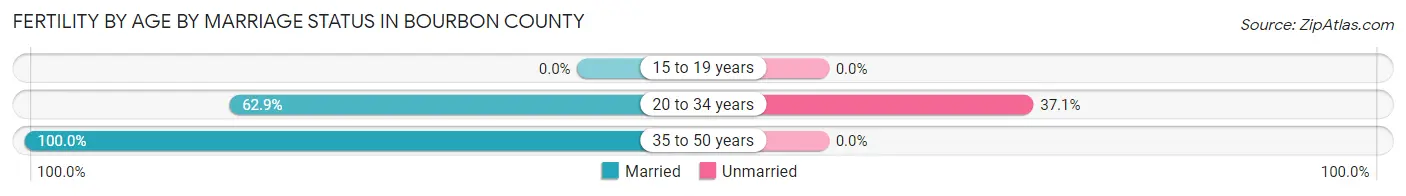
| Age Bracket | Married | Unmarried |
| 15 to 19 years | 0 (0.0%) | 0 (0.0%) |
| 20 to 34 years | 112 (62.9%) | 66 (37.1%) |
| 35 to 50 years | 5 (100.0%) | 0 (0.0%) |
| Total | 117 (63.9%) | 66 (36.1%) |
Fertility by Education in Bourbon County
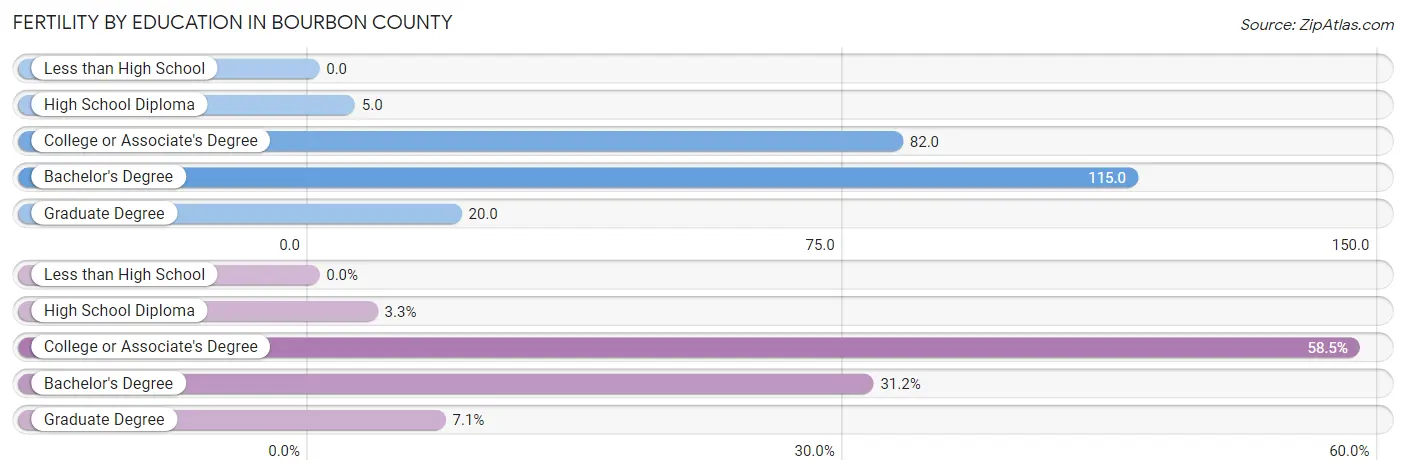
| Educational Attainment | Women with Births | Births / 1,000 Women |
| Less than High School | 0 (0.0%) | 0.0 |
| High School Diploma | 6 (3.3%) | 5.0 |
| College or Associate's Degree | 107 (58.5%) | 82.0 |
| Bachelor's Degree | 57 (31.1%) | 115.0 |
| Graduate Degree | 13 (7.1%) | 20.0 |
| Total | 183 (100.0%) | 42.0 |
Fertility by Education by Marriage Status in Bourbon County
36.1% of women with births in Bourbon County are unmarried. Women with the educational attainment of bachelor's degree are most likely to be married with 100.0% of them married at childbirth, while women with the educational attainment of college or associate's degree are least likely to be married with 60.8% of them unmarried at childbirth.
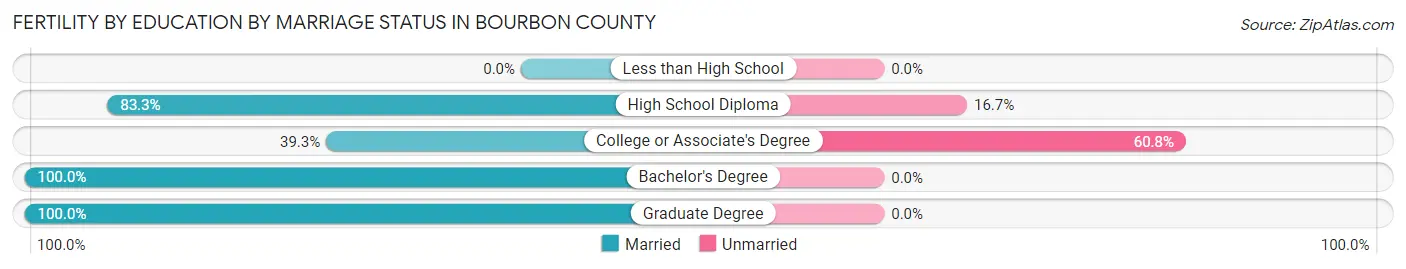
| Educational Attainment | Married | Unmarried |
| Less than High School | 0 (0.0%) | 0 (0.0%) |
| High School Diploma | 5 (83.3%) | 1 (16.7%) |
| College or Associate's Degree | 42 (39.3%) | 65 (60.8%) |
| Bachelor's Degree | 57 (100.0%) | 0 (0.0%) |
| Graduate Degree | 13 (100.0%) | 0 (0.0%) |
| Total | 117 (63.9%) | 66 (36.1%) |
Employment Characteristics in Bourbon County
Employment by Class of Employer in Bourbon County
Among the 8,999 employed individuals in Bourbon County, private company employees (6,325 | 70.3%), self-employed (not incorporated) (801 | 8.9%), and not-for-profit organizations (725 | 8.1%) make up the most common classes of employment.
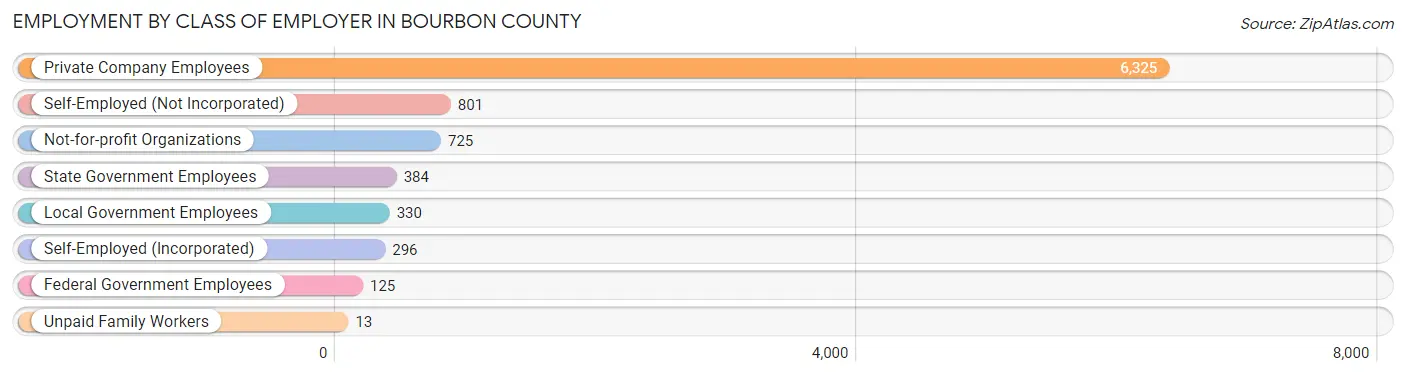
| Employer Class | # Employees | % Employees |
| Private Company Employees | 6,325 | 70.3% |
| Self-Employed (Incorporated) | 296 | 3.3% |
| Self-Employed (Not Incorporated) | 801 | 8.9% |
| Not-for-profit Organizations | 725 | 8.1% |
| Local Government Employees | 330 | 3.7% |
| State Government Employees | 384 | 4.3% |
| Federal Government Employees | 125 | 1.4% |
| Unpaid Family Workers | 13 | 0.1% |
| Total | 8,999 | 100.0% |
Employment Status by Age in Bourbon County
According to the labor force statistics for Bourbon County, out of the total population over 16 years of age (16,156), 59.6% or 9,629 individuals are in the labor force, with 5.5% or 530 of them unemployed. The age group with the highest labor force participation rate is 25 to 29 years, with 87.7% or 955 individuals in the labor force. Within the labor force, the 16 to 19 years age range has the highest percentage of unemployed individuals, with 20.4% or 74 of them being unemployed.
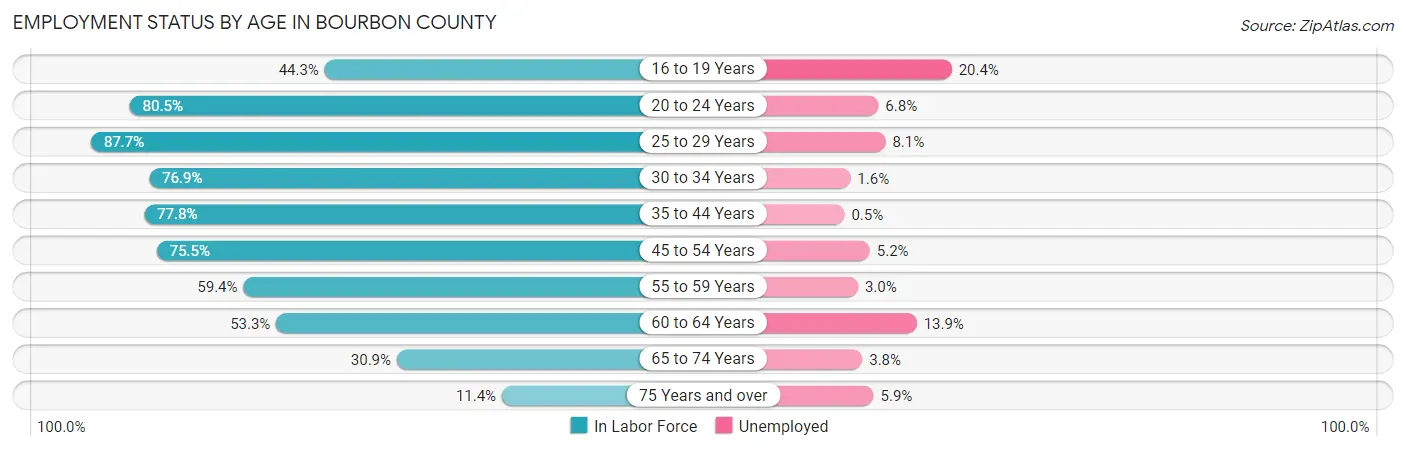
| Age Bracket | In Labor Force | Unemployed |
| 16 to 19 Years | 363 (44.3%) | 74 (20.4%) |
| 20 to 24 Years | 1,146 (80.5%) | 78 (6.8%) |
| 25 to 29 Years | 955 (87.7%) | 77 (8.1%) |
| 30 to 34 Years | 980 (76.9%) | 16 (1.6%) |
| 35 to 44 Years | 1,732 (77.8%) | 9 (0.5%) |
| 45 to 54 Years | 1,949 (75.5%) | 101 (5.2%) |
| 55 to 59 Years | 823 (59.4%) | 25 (3.0%) |
| 60 to 64 Years | 812 (53.3%) | 113 (13.9%) |
| 65 to 74 Years | 685 (30.9%) | 26 (3.8%) |
| 75 Years and over | 184 (11.4%) | 11 (5.9%) |
| Total | 9,629 (59.6%) | 530 (5.5%) |
Employment Status by Educational Attainment in Bourbon County
According to labor force statistics for Bourbon County, 71.9% of individuals (7,247) out of the total population between 25 and 64 years of age (10,079) are in the labor force, with 4.7% or 341 of them being unemployed. The group with the highest labor force participation rate are those with the educational attainment of bachelor's degree or higher, with 79.4% or 1,978 individuals in the labor force. Within the labor force, individuals with less than high school education have the highest percentage of unemployment, with 14.4% or 97 of them being unemployed.
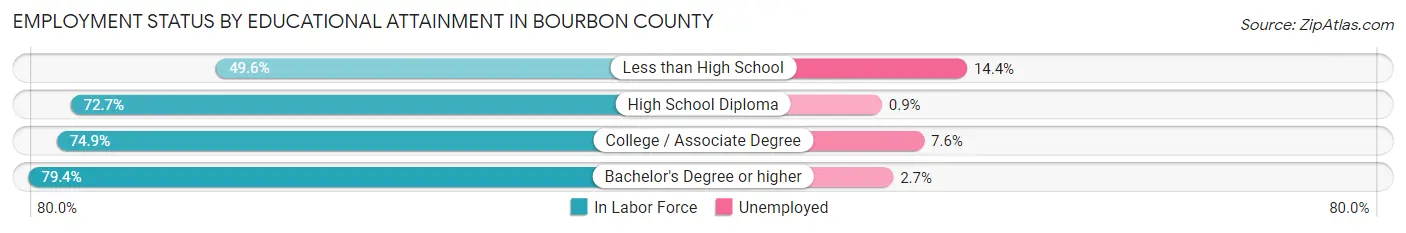
| Educational Attainment | In Labor Force | Unemployed |
| Less than High School | 676 (49.6%) | 196 (14.4%) |
| High School Diploma | 2,374 (72.7%) | 29 (0.9%) |
| College / Associate Degree | 2,218 (74.9%) | 225 (7.6%) |
| Bachelor's Degree or higher | 1,978 (79.4%) | 67 (2.7%) |
| Total | 7,247 (71.9%) | 474 (4.7%) |
Employment Occupations by Sex in Bourbon County
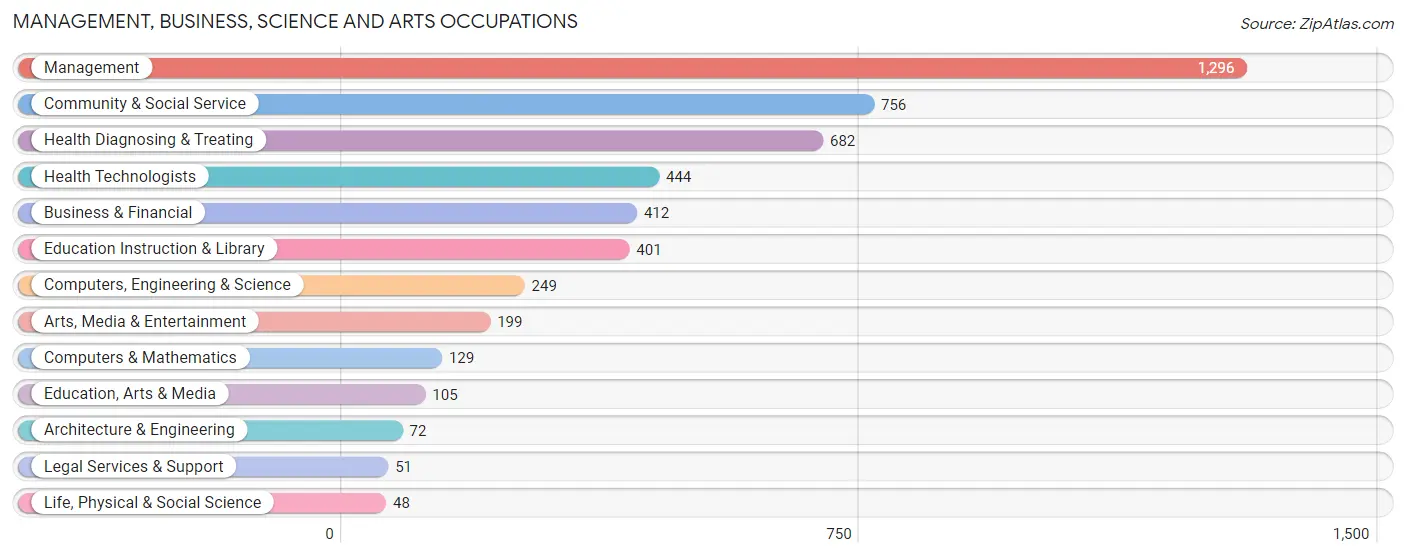
Management, Business, Science and Arts Occupations
The most common Management, Business, Science and Arts occupations in Bourbon County are Management (1,296 | 14.2%), Community & Social Service (756 | 8.3%), Health Diagnosing & Treating (682 | 7.5%), Health Technologists (444 | 4.9%), and Business & Financial (412 | 4.5%).
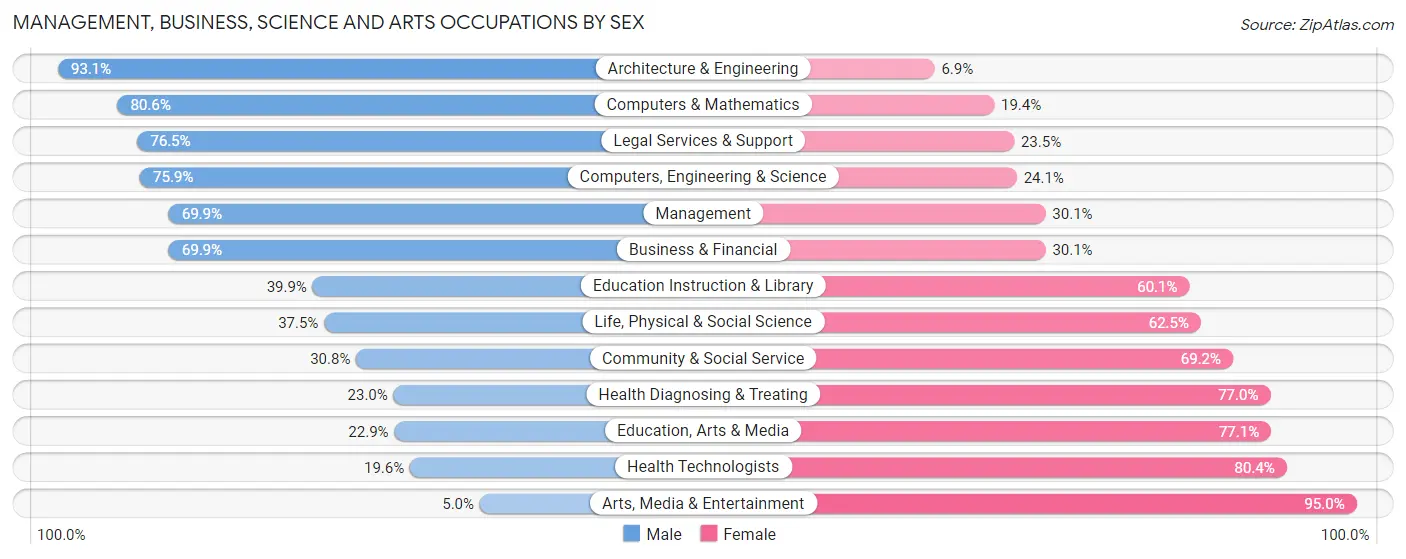
Management, Business, Science and Arts Occupations by Sex
Within the Management, Business, Science and Arts occupations in Bourbon County, the most male-oriented occupations are Architecture & Engineering (93.1%), Computers & Mathematics (80.6%), and Legal Services & Support (76.5%), while the most female-oriented occupations are Arts, Media & Entertainment (95.0%), Health Technologists (80.4%), and Education, Arts & Media (77.1%).
| Occupation | Male | Female |
| Management | 906 (69.9%) | 390 (30.1%) |
| Business & Financial | 288 (69.9%) | 124 (30.1%) |
| Computers, Engineering & Science | 189 (75.9%) | 60 (24.1%) |
| Computers & Mathematics | 104 (80.6%) | 25 (19.4%) |
| Architecture & Engineering | 67 (93.1%) | 5 (6.9%) |
| Life, Physical & Social Science | 18 (37.5%) | 30 (62.5%) |
| Community & Social Service | 233 (30.8%) | 523 (69.2%) |
| Education, Arts & Media | 24 (22.9%) | 81 (77.1%) |
| Legal Services & Support | 39 (76.5%) | 12 (23.5%) |
| Education Instruction & Library | 160 (39.9%) | 241 (60.1%) |
| Arts, Media & Entertainment | 10 (5.0%) | 189 (95.0%) |
| Health Diagnosing & Treating | 157 (23.0%) | 525 (77.0%) |
| Health Technologists | 87 (19.6%) | 357 (80.4%) |
| Total (Category) | 1,773 (52.2%) | 1,622 (47.8%) |
| Total (Overall) | 4,845 (53.2%) | 4,253 (46.8%) |
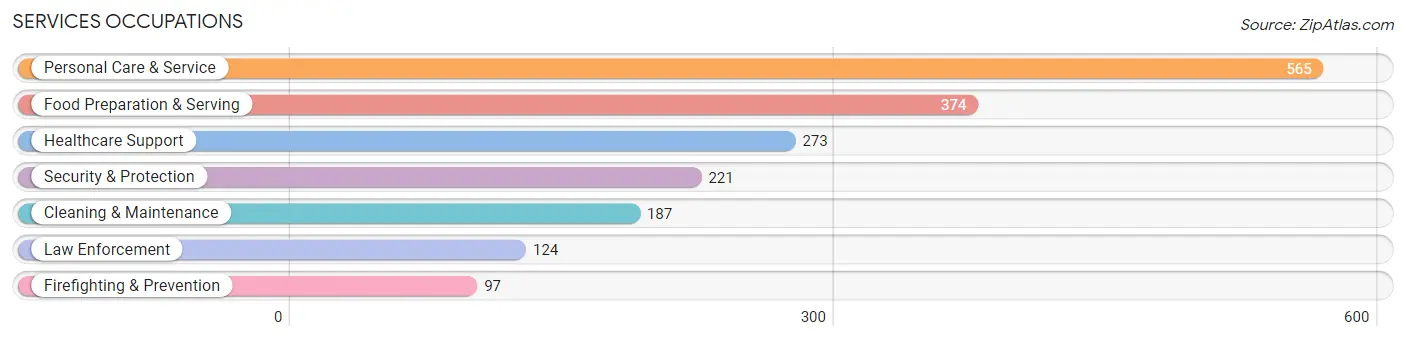
Services Occupations
The most common Services occupations in Bourbon County are Personal Care & Service (565 | 6.2%), Food Preparation & Serving (374 | 4.1%), Healthcare Support (273 | 3.0%), Security & Protection (221 | 2.4%), and Cleaning & Maintenance (187 | 2.1%).
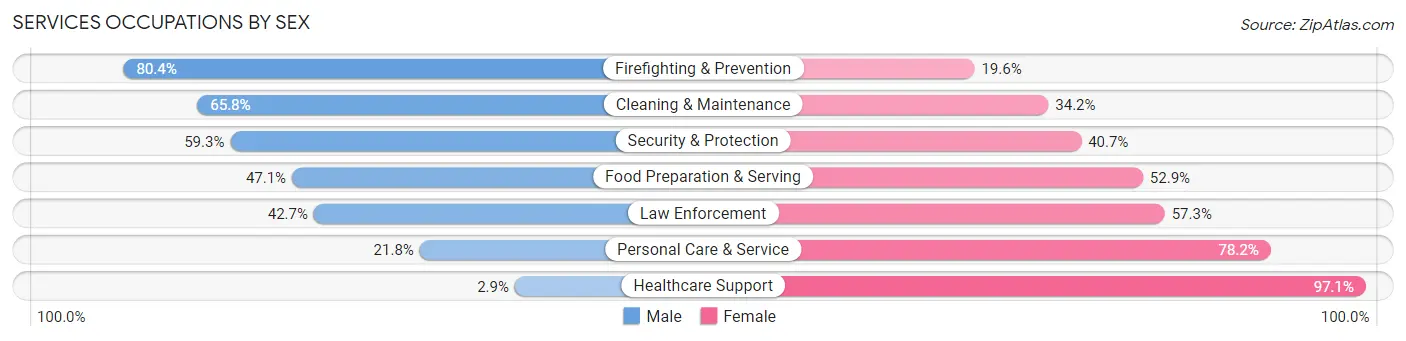
Services Occupations by Sex
Within the Services occupations in Bourbon County, the most male-oriented occupations are Firefighting & Prevention (80.4%), Cleaning & Maintenance (65.8%), and Security & Protection (59.3%), while the most female-oriented occupations are Healthcare Support (97.1%), Personal Care & Service (78.2%), and Law Enforcement (57.3%).
| Occupation | Male | Female |
| Healthcare Support | 8 (2.9%) | 265 (97.1%) |
| Security & Protection | 131 (59.3%) | 90 (40.7%) |
| Firefighting & Prevention | 78 (80.4%) | 19 (19.6%) |
| Law Enforcement | 53 (42.7%) | 71 (57.3%) |
| Food Preparation & Serving | 176 (47.1%) | 198 (52.9%) |
| Cleaning & Maintenance | 123 (65.8%) | 64 (34.2%) |
| Personal Care & Service | 123 (21.8%) | 442 (78.2%) |
| Total (Category) | 561 (34.6%) | 1,059 (65.4%) |
| Total (Overall) | 4,845 (53.2%) | 4,253 (46.8%) |
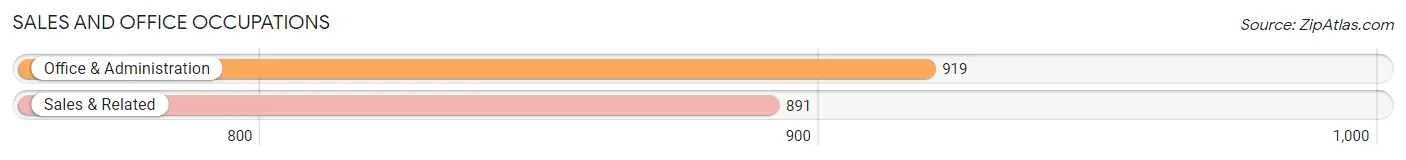
Sales and Office Occupations
The most common Sales and Office occupations in Bourbon County are Office & Administration (919 | 10.1%), and Sales & Related (891 | 9.8%).
Sales and Office Occupations by Sex
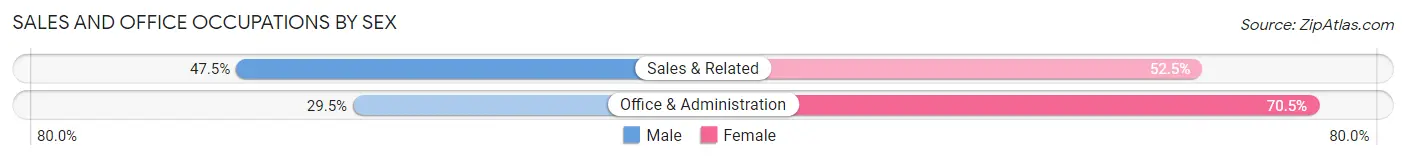
| Occupation | Male | Female |
| Sales & Related | 423 (47.5%) | 468 (52.5%) |
| Office & Administration | 271 (29.5%) | 648 (70.5%) |
| Total (Category) | 694 (38.3%) | 1,116 (61.7%) |
| Total (Overall) | 4,845 (53.2%) | 4,253 (46.8%) |
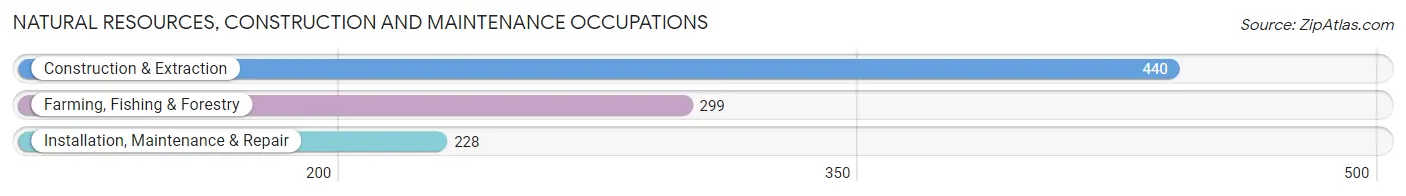
Natural Resources, Construction and Maintenance Occupations
The most common Natural Resources, Construction and Maintenance occupations in Bourbon County are Construction & Extraction (440 | 4.8%), Farming, Fishing & Forestry (299 | 3.3%), and Installation, Maintenance & Repair (228 | 2.5%).
Natural Resources, Construction and Maintenance Occupations by Sex
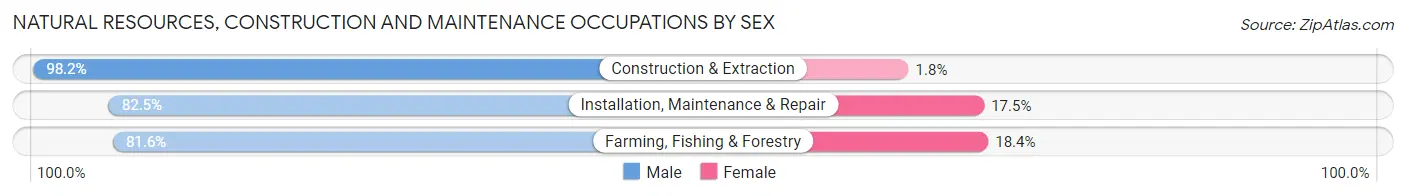
| Occupation | Male | Female |
| Farming, Fishing & Forestry | 244 (81.6%) | 55 (18.4%) |
| Construction & Extraction | 432 (98.2%) | 8 (1.8%) |
| Installation, Maintenance & Repair | 188 (82.5%) | 40 (17.5%) |
| Total (Category) | 864 (89.3%) | 103 (10.6%) |
| Total (Overall) | 4,845 (53.2%) | 4,253 (46.8%) |
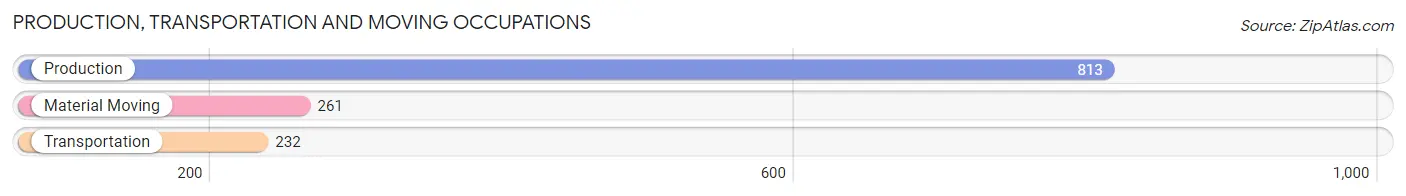
Production, Transportation and Moving Occupations
The most common Production, Transportation and Moving occupations in Bourbon County are Production (813 | 8.9%), Material Moving (261 | 2.9%), and Transportation (232 | 2.5%).
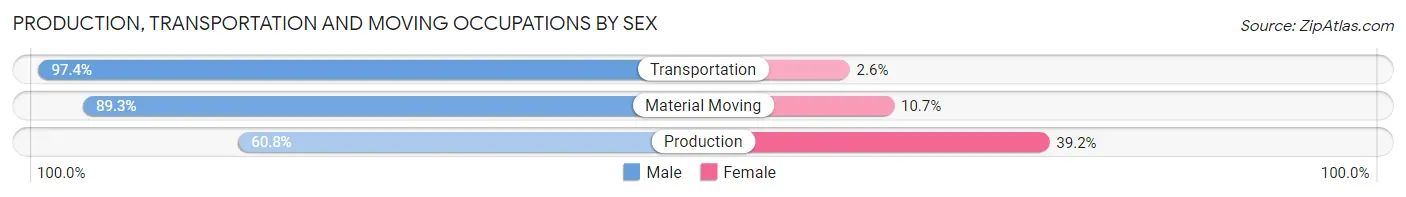
Production, Transportation and Moving Occupations by Sex
| Occupation | Male | Female |
| Production | 494 (60.8%) | 319 (39.2%) |
| Transportation | 226 (97.4%) | 6 (2.6%) |
| Material Moving | 233 (89.3%) | 28 (10.7%) |
| Total (Category) | 953 (73.0%) | 353 (27.0%) |
| Total (Overall) | 4,845 (53.2%) | 4,253 (46.8%) |
Employment Industries by Sex in Bourbon County
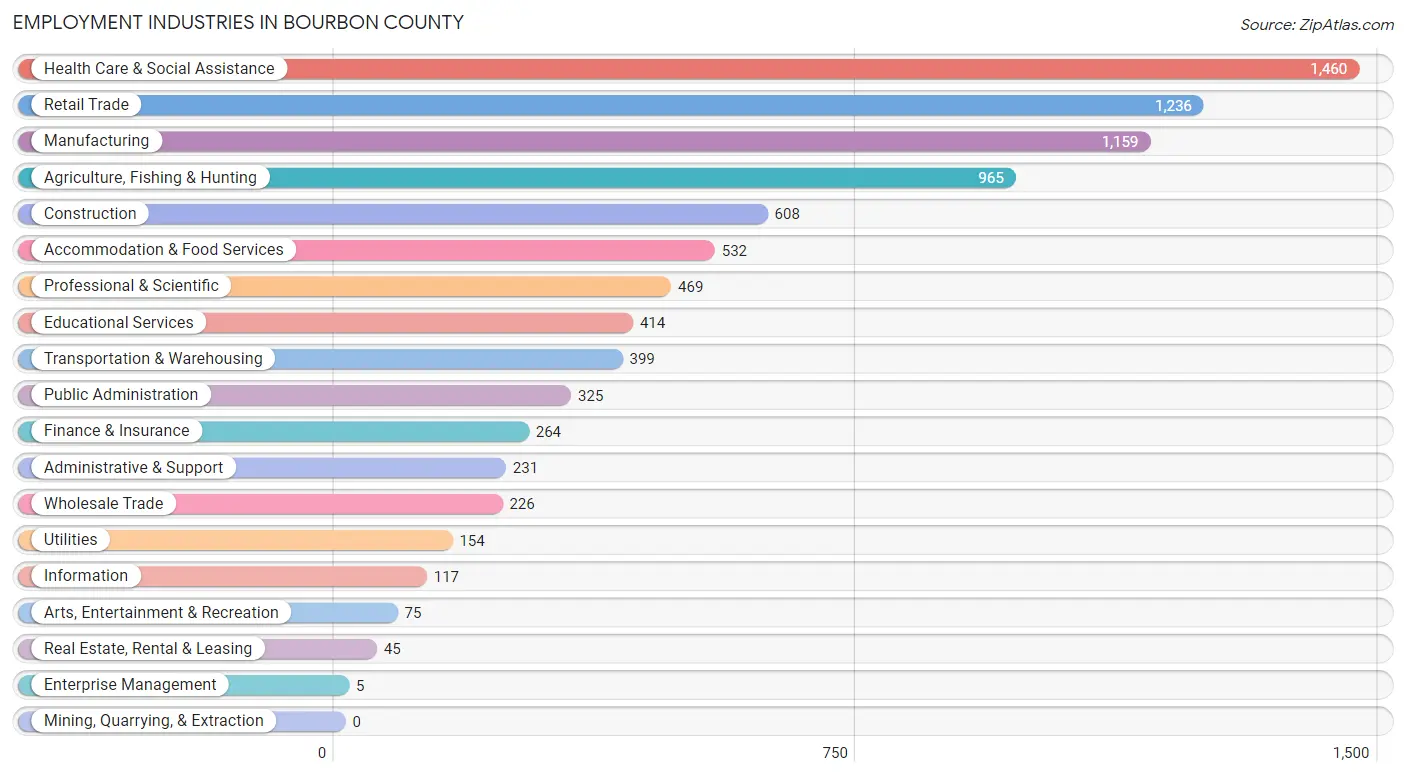
Employment Industries in Bourbon County
The major employment industries in Bourbon County include Health Care & Social Assistance (1,460 | 16.1%), Retail Trade (1,236 | 13.6%), Manufacturing (1,159 | 12.7%), Agriculture, Fishing & Hunting (965 | 10.6%), and Construction (608 | 6.7%).
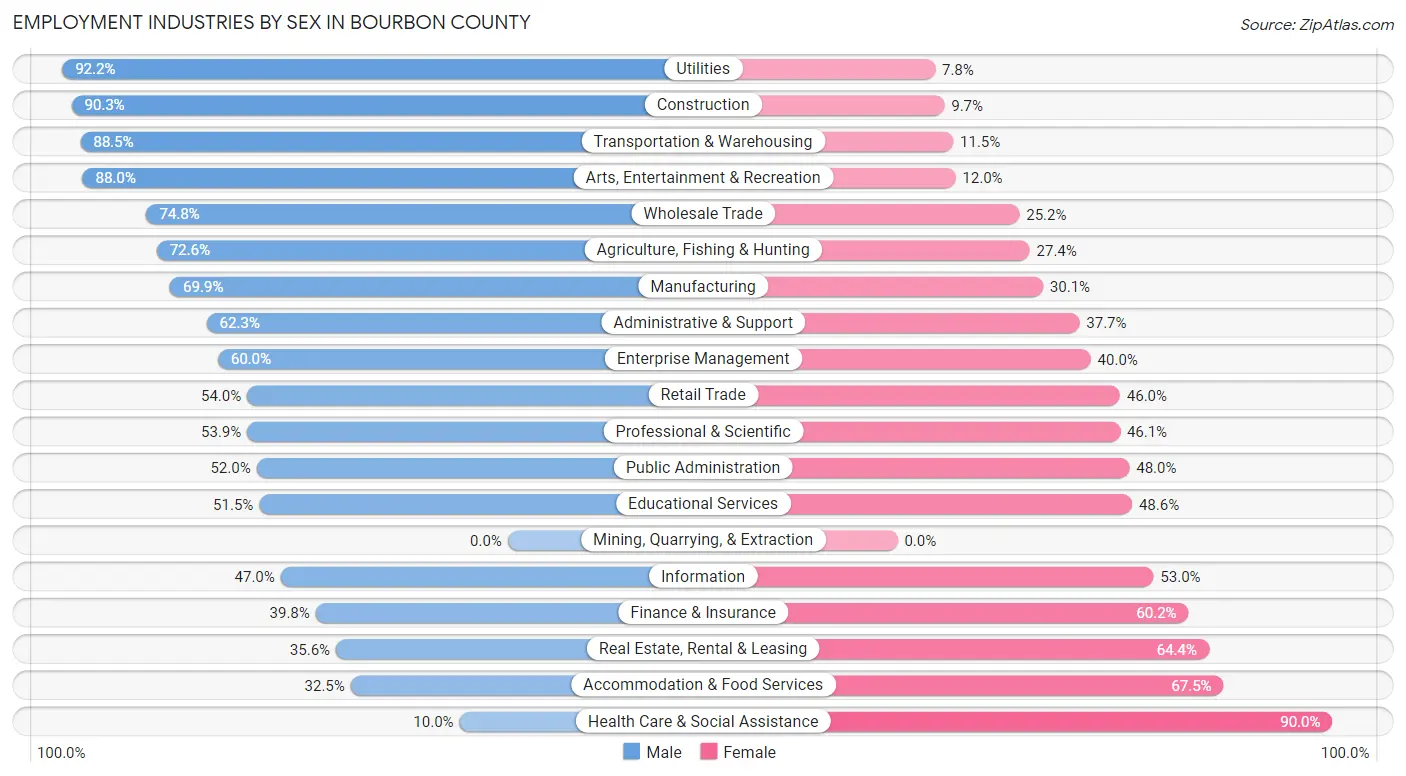
Employment Industries by Sex in Bourbon County
The Bourbon County industries that see more men than women are Utilities (92.2%), Construction (90.3%), and Transportation & Warehousing (88.5%), whereas the industries that tend to have a higher number of women are Health Care & Social Assistance (90.0%), Accommodation & Food Services (67.5%), and Real Estate, Rental & Leasing (64.4%).
| Industry | Male | Female |
| Agriculture, Fishing & Hunting | 701 (72.6%) | 264 (27.4%) |
| Mining, Quarrying, & Extraction | 0 (0.0%) | 0 (0.0%) |
| Construction | 549 (90.3%) | 59 (9.7%) |
| Manufacturing | 810 (69.9%) | 349 (30.1%) |
| Wholesale Trade | 169 (74.8%) | 57 (25.2%) |
| Retail Trade | 667 (54.0%) | 569 (46.0%) |
| Transportation & Warehousing | 353 (88.5%) | 46 (11.5%) |
| Utilities | 142 (92.2%) | 12 (7.8%) |
| Information | 55 (47.0%) | 62 (53.0%) |
| Finance & Insurance | 105 (39.8%) | 159 (60.2%) |
| Real Estate, Rental & Leasing | 16 (35.6%) | 29 (64.4%) |
| Professional & Scientific | 253 (53.9%) | 216 (46.1%) |
| Enterprise Management | 3 (60.0%) | 2 (40.0%) |
| Administrative & Support | 144 (62.3%) | 87 (37.7%) |
| Educational Services | 213 (51.4%) | 201 (48.5%) |
| Health Care & Social Assistance | 146 (10.0%) | 1,314 (90.0%) |
| Arts, Entertainment & Recreation | 66 (88.0%) | 9 (12.0%) |
| Accommodation & Food Services | 173 (32.5%) | 359 (67.5%) |
| Public Administration | 169 (52.0%) | 156 (48.0%) |
| Total | 4,845 (53.2%) | 4,253 (46.8%) |
Education in Bourbon County
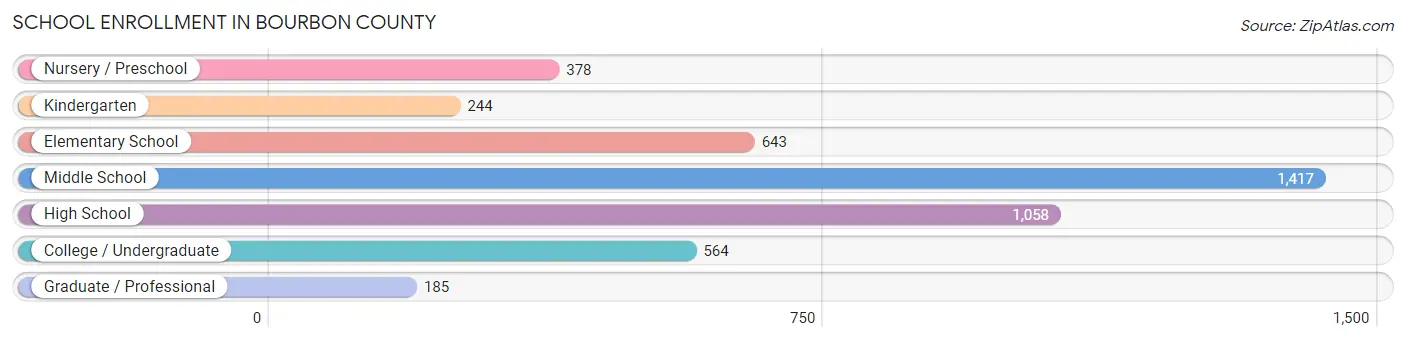
School Enrollment in Bourbon County
The most common levels of schooling among the 4,489 students in Bourbon County are middle school (1,417 | 31.6%), high school (1,058 | 23.6%), and elementary school (643 | 14.3%).
| School Level | # Students | % Students |
| Nursery / Preschool | 378 | 8.4% |
| Kindergarten | 244 | 5.4% |
| Elementary School | 643 | 14.3% |
| Middle School | 1,417 | 31.6% |
| High School | 1,058 | 23.6% |
| College / Undergraduate | 564 | 12.6% |
| Graduate / Professional | 185 | 4.1% |
| Total | 4,489 | 100.0% |
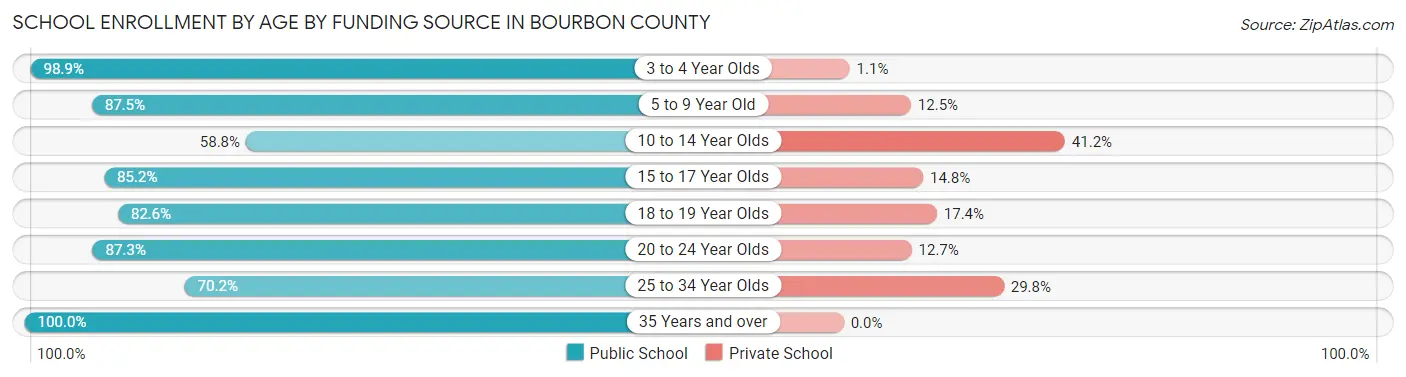
School Enrollment by Age by Funding Source in Bourbon County
Out of a total of 4,489 students who are enrolled in schools in Bourbon County, 1,055 (23.5%) attend a private institution, while the remaining 3,434 (76.5%) are enrolled in public schools. The age group of 10 to 14 year olds has the highest likelihood of being enrolled in private schools, with 661 (41.2% in the age bracket) enrolled. Conversely, the age group of 35 years and over has the lowest likelihood of being enrolled in a private school, with 85 (100.0% in the age bracket) attending a public institution.
| Age Bracket | Public School | Private School |
| 3 to 4 Year Olds | 178 (98.9%) | 2 (1.1%) |
| 5 to 9 Year Old | 943 (87.5%) | 135 (12.5%) |
| 10 to 14 Year Olds | 943 (58.8%) | 661 (41.2%) |
| 15 to 17 Year Olds | 599 (85.2%) | 104 (14.8%) |
| 18 to 19 Year Olds | 200 (82.6%) | 42 (17.4%) |
| 20 to 24 Year Olds | 331 (87.3%) | 48 (12.7%) |
| 25 to 34 Year Olds | 153 (70.2%) | 65 (29.8%) |
| 35 Years and over | 85 (100.0%) | 0 (0.0%) |
| Total | 3,434 (76.5%) | 1,055 (23.5%) |
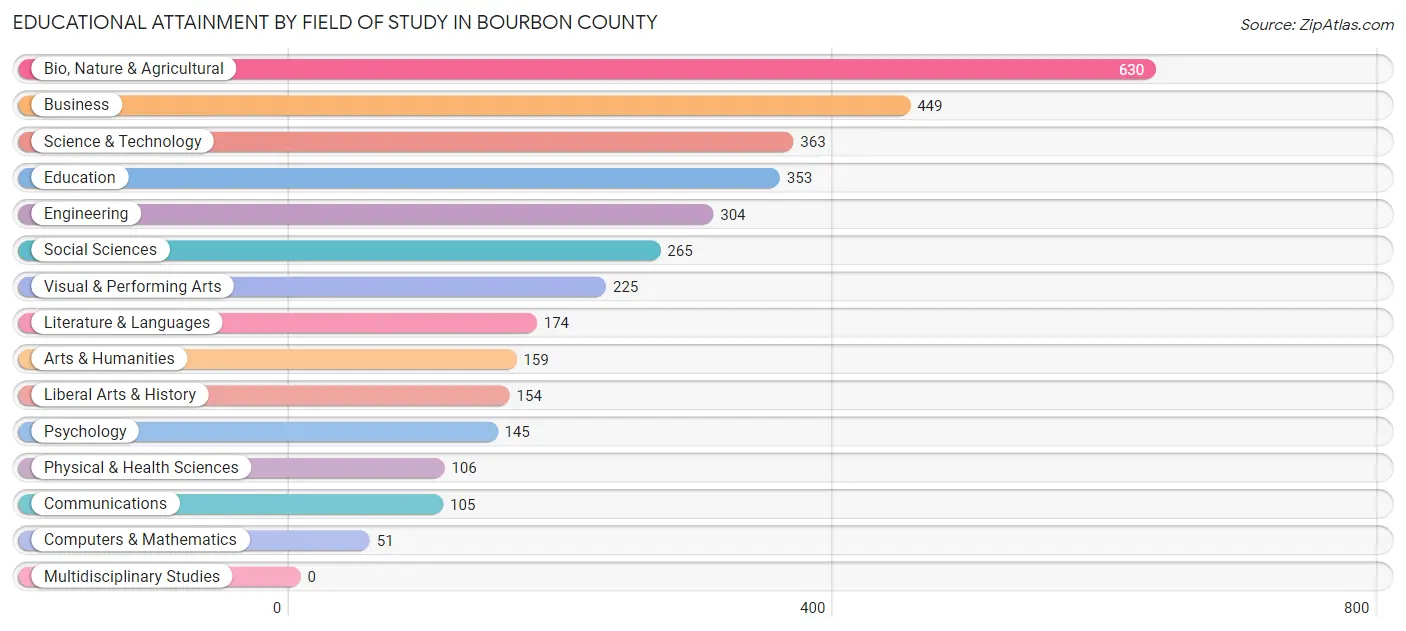
Educational Attainment by Field of Study in Bourbon County
Bio, nature & agricultural (630 | 18.1%), business (449 | 12.9%), science & technology (363 | 10.4%), education (353 | 10.1%), and engineering (304 | 8.7%) are the most common fields of study among 3,483 individuals in Bourbon County who have obtained a bachelor's degree or higher.
| Field of Study | # Graduates | % Graduates |
| Computers & Mathematics | 51 | 1.5% |
| Bio, Nature & Agricultural | 630 | 18.1% |
| Physical & Health Sciences | 106 | 3.0% |
| Psychology | 145 | 4.2% |
| Social Sciences | 265 | 7.6% |
| Engineering | 304 | 8.7% |
| Multidisciplinary Studies | 0 | 0.0% |
| Science & Technology | 363 | 10.4% |
| Business | 449 | 12.9% |
| Education | 353 | 10.1% |
| Literature & Languages | 174 | 5.0% |
| Liberal Arts & History | 154 | 4.4% |
| Visual & Performing Arts | 225 | 6.5% |
| Communications | 105 | 3.0% |
| Arts & Humanities | 159 | 4.6% |
| Total | 3,483 | 100.0% |
Transportation & Commute in Bourbon County
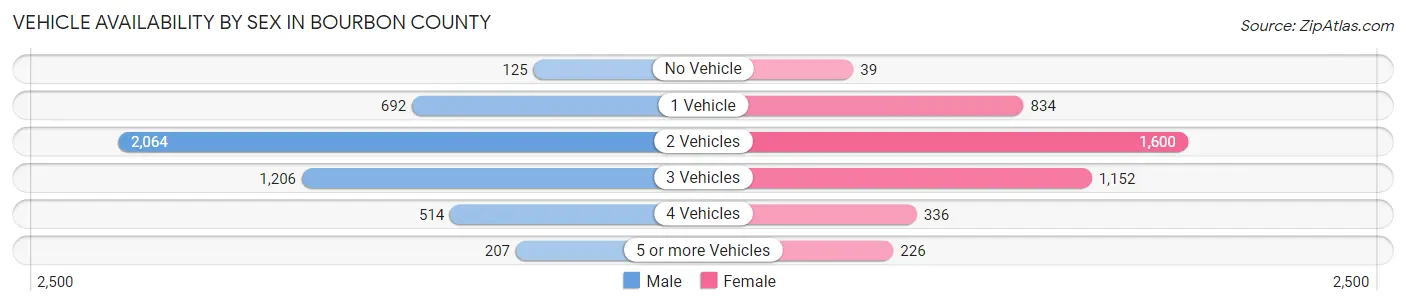
Vehicle Availability by Sex in Bourbon County
The most prevalent vehicle ownership categories in Bourbon County are males with 2 vehicles (2,064, accounting for 42.9%) and females with 2 vehicles (1,600, making up 49.3%).
| Vehicles Available | Male | Female |
| No Vehicle | 125 (2.6%) | 39 (0.9%) |
| 1 Vehicle | 692 (14.4%) | 834 (19.9%) |
| 2 Vehicles | 2,064 (42.9%) | 1,600 (38.2%) |
| 3 Vehicles | 1,206 (25.1%) | 1,152 (27.5%) |
| 4 Vehicles | 514 (10.7%) | 336 (8.0%) |
| 5 or more Vehicles | 207 (4.3%) | 226 (5.4%) |
| Total | 4,808 (100.0%) | 4,187 (100.0%) |
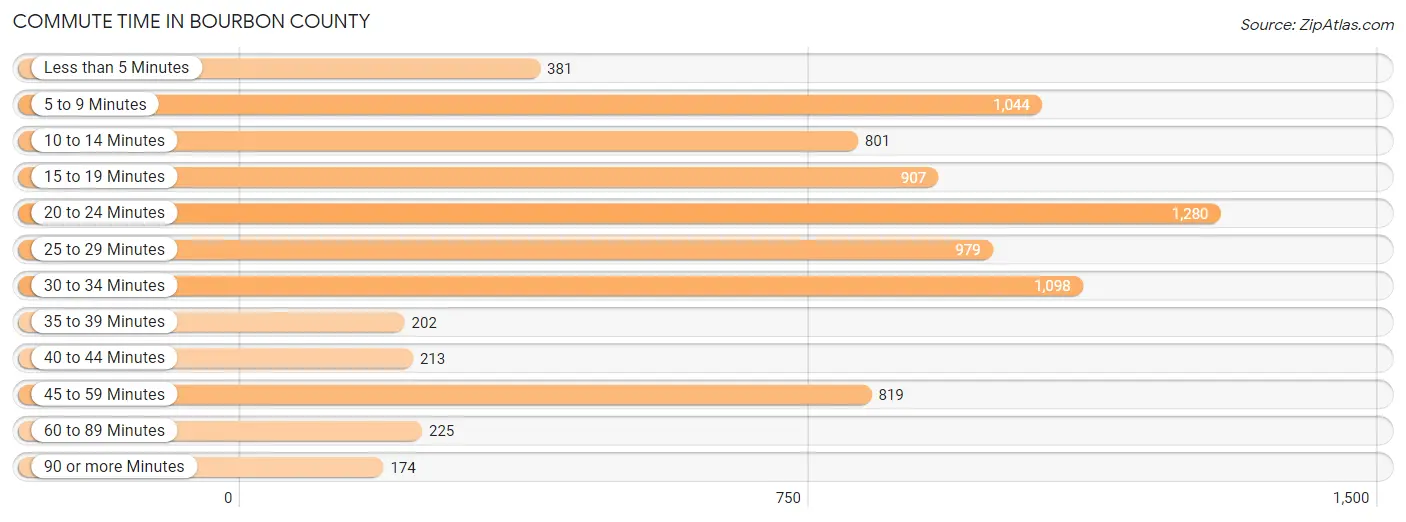
Commute Time in Bourbon County
The most frequently occuring commute durations in Bourbon County are 20 to 24 minutes (1,280 commuters, 15.8%), 30 to 34 minutes (1,098 commuters, 13.5%), and 5 to 9 minutes (1,044 commuters, 12.9%).
| Commute Time | # Commuters | % Commuters |
| Less than 5 Minutes | 381 | 4.7% |
| 5 to 9 Minutes | 1,044 | 12.9% |
| 10 to 14 Minutes | 801 | 9.9% |
| 15 to 19 Minutes | 907 | 11.2% |
| 20 to 24 Minutes | 1,280 | 15.8% |
| 25 to 29 Minutes | 979 | 12.0% |
| 30 to 34 Minutes | 1,098 | 13.5% |
| 35 to 39 Minutes | 202 | 2.5% |
| 40 to 44 Minutes | 213 | 2.6% |
| 45 to 59 Minutes | 819 | 10.1% |
| 60 to 89 Minutes | 225 | 2.8% |
| 90 or more Minutes | 174 | 2.1% |
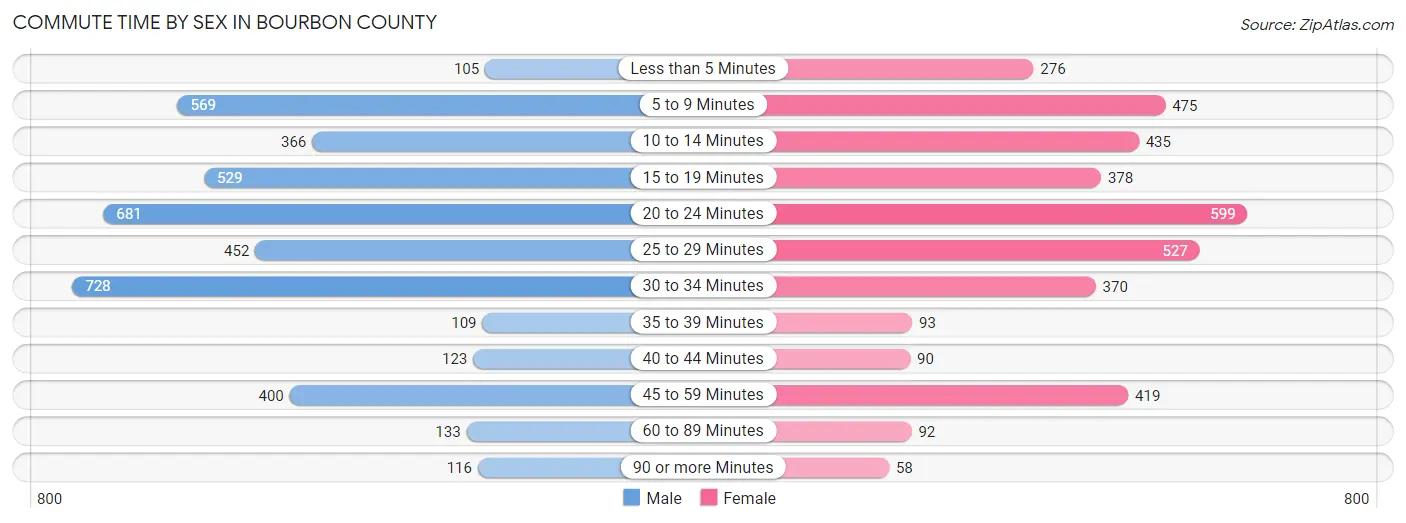
Commute Time by Sex in Bourbon County
The most common commute times in Bourbon County are 30 to 34 minutes (728 commuters, 16.9%) for males and 20 to 24 minutes (599 commuters, 15.7%) for females.
| Commute Time | Male | Female |
| Less than 5 Minutes | 105 (2.4%) | 276 (7.2%) |
| 5 to 9 Minutes | 569 (13.2%) | 475 (12.5%) |
| 10 to 14 Minutes | 366 (8.5%) | 435 (11.4%) |
| 15 to 19 Minutes | 529 (12.3%) | 378 (9.9%) |
| 20 to 24 Minutes | 681 (15.8%) | 599 (15.7%) |
| 25 to 29 Minutes | 452 (10.5%) | 527 (13.8%) |
| 30 to 34 Minutes | 728 (16.9%) | 370 (9.7%) |
| 35 to 39 Minutes | 109 (2.5%) | 93 (2.4%) |
| 40 to 44 Minutes | 123 (2.9%) | 90 (2.4%) |
| 45 to 59 Minutes | 400 (9.3%) | 419 (11.0%) |
| 60 to 89 Minutes | 133 (3.1%) | 92 (2.4%) |
| 90 or more Minutes | 116 (2.7%) | 58 (1.5%) |
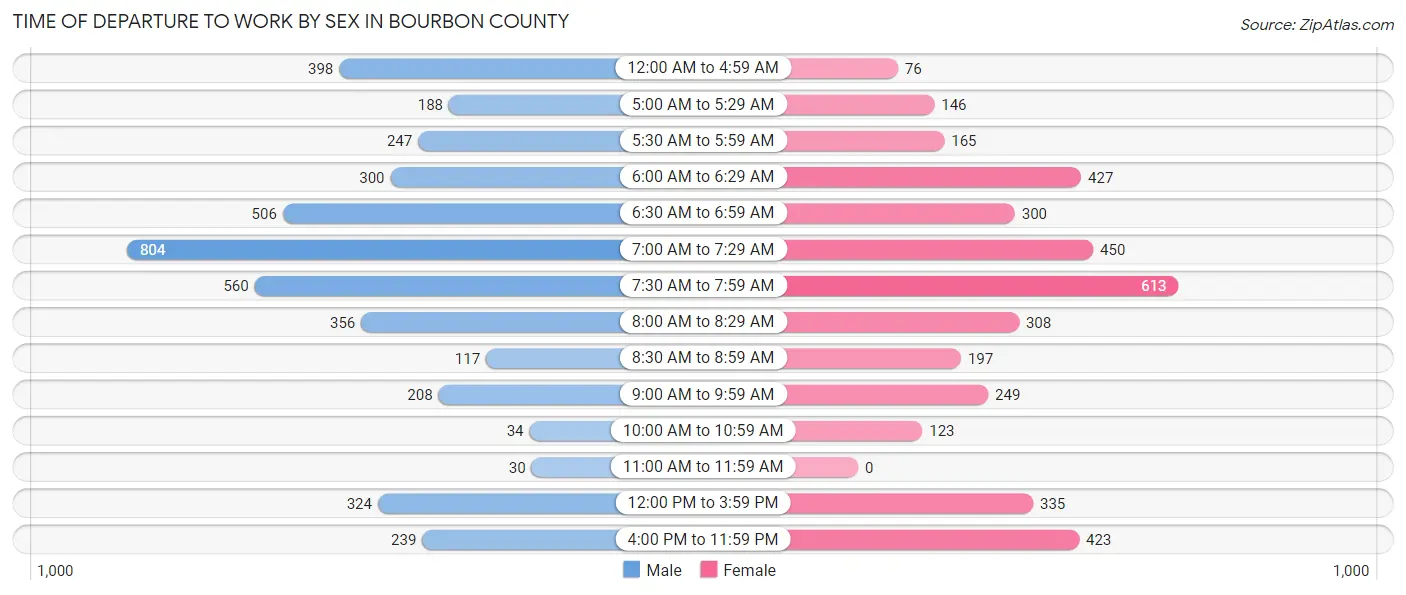
Time of Departure to Work by Sex in Bourbon County
The most frequent times of departure to work in Bourbon County are 7:00 AM to 7:29 AM (804, 18.6%) for males and 7:30 AM to 7:59 AM (613, 16.1%) for females.
| Time of Departure | Male | Female |
| 12:00 AM to 4:59 AM | 398 (9.2%) | 76 (2.0%) |
| 5:00 AM to 5:29 AM | 188 (4.4%) | 146 (3.8%) |
| 5:30 AM to 5:59 AM | 247 (5.7%) | 165 (4.3%) |
| 6:00 AM to 6:29 AM | 300 (7.0%) | 427 (11.2%) |
| 6:30 AM to 6:59 AM | 506 (11.7%) | 300 (7.9%) |
| 7:00 AM to 7:29 AM | 804 (18.6%) | 450 (11.8%) |
| 7:30 AM to 7:59 AM | 560 (13.0%) | 613 (16.1%) |
| 8:00 AM to 8:29 AM | 356 (8.3%) | 308 (8.1%) |
| 8:30 AM to 8:59 AM | 117 (2.7%) | 197 (5.2%) |
| 9:00 AM to 9:59 AM | 208 (4.8%) | 249 (6.5%) |
| 10:00 AM to 10:59 AM | 34 (0.8%) | 123 (3.2%) |
| 11:00 AM to 11:59 AM | 30 (0.7%) | 0 (0.0%) |
| 12:00 PM to 3:59 PM | 324 (7.5%) | 335 (8.8%) |
| 4:00 PM to 11:59 PM | 239 (5.5%) | 423 (11.1%) |
| Total | 4,311 (100.0%) | 3,812 (100.0%) |
Housing Occupancy in Bourbon County
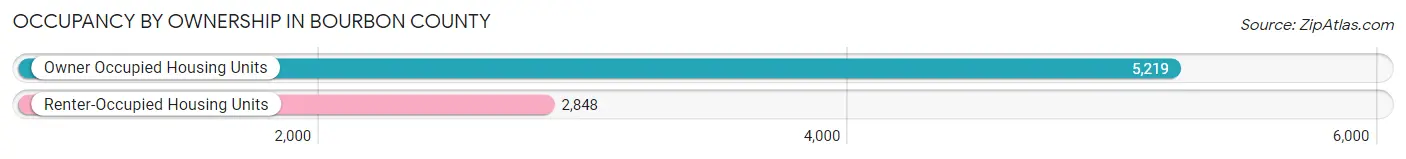
Occupancy by Ownership in Bourbon County
Of the total 8,067 dwellings in Bourbon County, owner-occupied units account for 5,219 (64.7%), while renter-occupied units make up 2,848 (35.3%).
| Occupancy | # Housing Units | % Housing Units |
| Owner Occupied Housing Units | 5,219 | 64.7% |
| Renter-Occupied Housing Units | 2,848 | 35.3% |
| Total Occupied Housing Units | 8,067 | 100.0% |
Occupancy by Household Size in Bourbon County
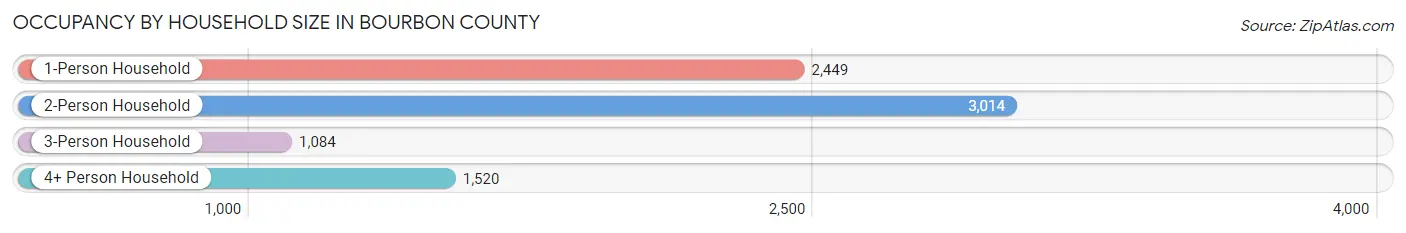
| Household Size | # Housing Units | % Housing Units |
| 1-Person Household | 2,449 | 30.4% |
| 2-Person Household | 3,014 | 37.4% |
| 3-Person Household | 1,084 | 13.4% |
| 4+ Person Household | 1,520 | 18.8% |
| Total Housing Units | 8,067 | 100.0% |
Occupancy by Ownership by Household Size in Bourbon County
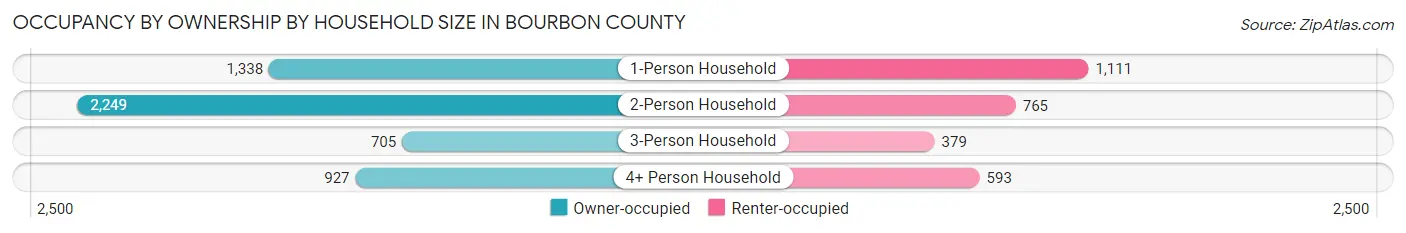
| Household Size | Owner-occupied | Renter-occupied |
| 1-Person Household | 1,338 (54.6%) | 1,111 (45.4%) |
| 2-Person Household | 2,249 (74.6%) | 765 (25.4%) |
| 3-Person Household | 705 (65.0%) | 379 (35.0%) |
| 4+ Person Household | 927 (61.0%) | 593 (39.0%) |
| Total Housing Units | 5,219 (64.7%) | 2,848 (35.3%) |
Occupancy by Educational Attainment in Bourbon County
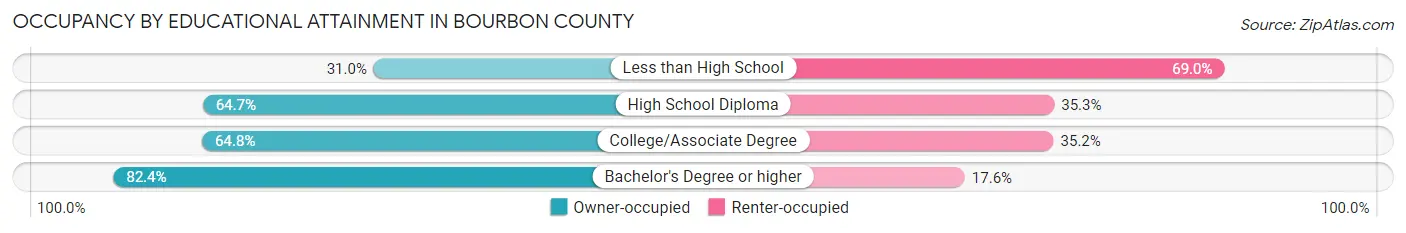
| Household Size | Owner-occupied | Renter-occupied |
| Less than High School | 329 (31.0%) | 733 (69.0%) |
| High School Diploma | 1,703 (64.7%) | 930 (35.3%) |
| College/Associate Degree | 1,533 (64.8%) | 832 (35.2%) |
| Bachelor's Degree or higher | 1,654 (82.4%) | 353 (17.6%) |
Occupancy by Age of Householder in Bourbon County
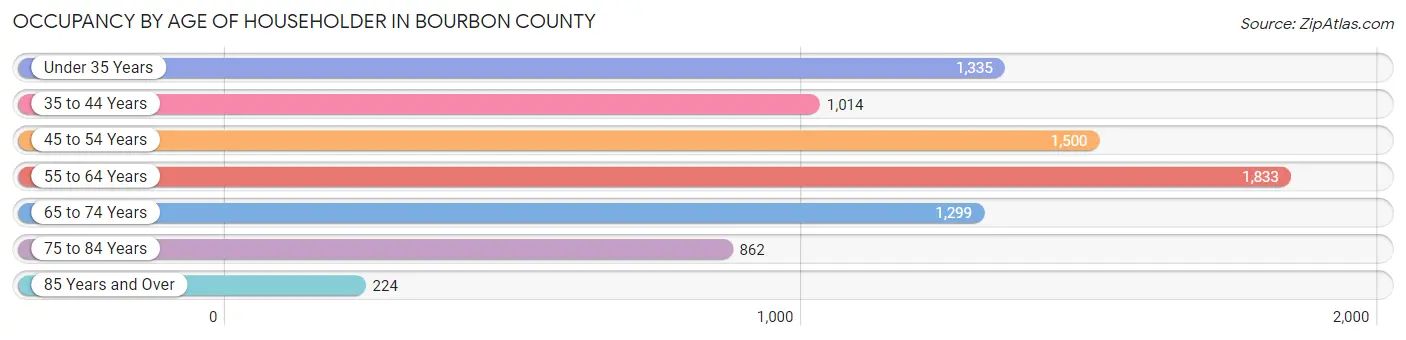
| Age Bracket | # Households | % Households |
| Under 35 Years | 1,335 | 16.6% |
| 35 to 44 Years | 1,014 | 12.6% |
| 45 to 54 Years | 1,500 | 18.6% |
| 55 to 64 Years | 1,833 | 22.7% |
| 65 to 74 Years | 1,299 | 16.1% |
| 75 to 84 Years | 862 | 10.7% |
| 85 Years and Over | 224 | 2.8% |
| Total | 8,067 | 100.0% |
Housing Finances in Bourbon County
Median Income by Occupancy in Bourbon County
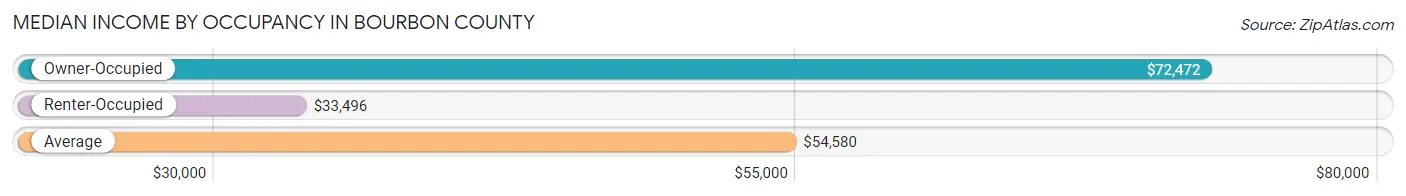
| Occupancy Type | # Households | Median Income |
| Owner-Occupied | 5,219 (64.7%) | $72,472 |
| Renter-Occupied | 2,848 (35.3%) | $33,496 |
| Average | 8,067 (100.0%) | $54,580 |
Occupancy by Householder Income Bracket in Bourbon County
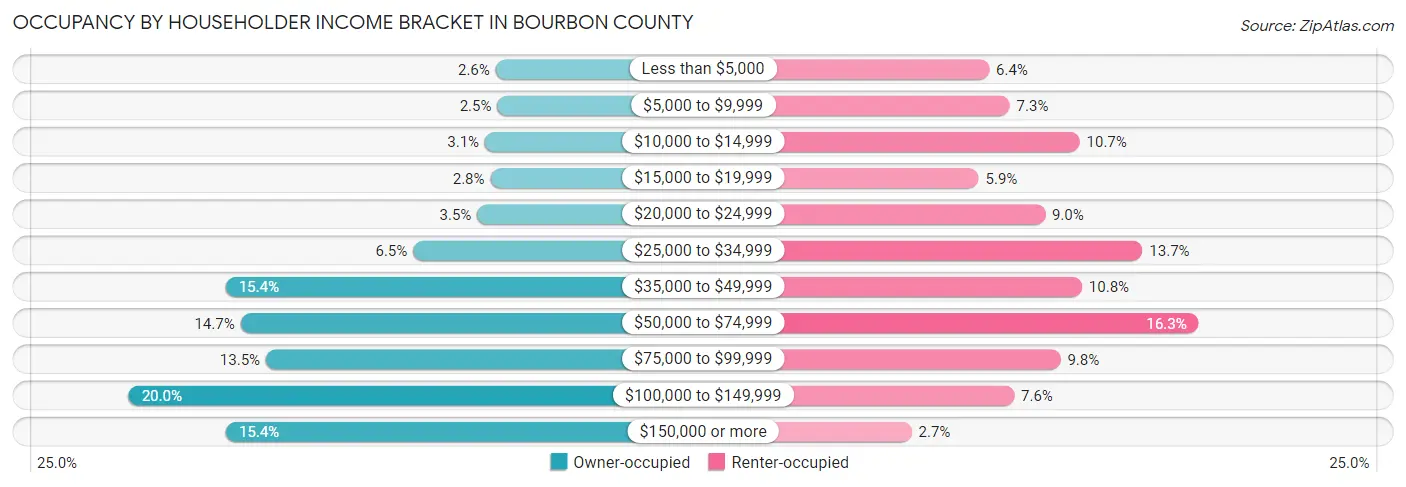
| Income Bracket | Owner-occupied | Renter-occupied |
| Less than $5,000 | 134 (2.6%) | 181 (6.4%) |
| $5,000 to $9,999 | 130 (2.5%) | 209 (7.3%) |
| $10,000 to $14,999 | 161 (3.1%) | 304 (10.7%) |
| $15,000 to $19,999 | 147 (2.8%) | 167 (5.9%) |
| $20,000 to $24,999 | 180 (3.5%) | 257 (9.0%) |
| $25,000 to $34,999 | 339 (6.5%) | 389 (13.7%) |
| $35,000 to $49,999 | 805 (15.4%) | 307 (10.8%) |
| $50,000 to $74,999 | 768 (14.7%) | 465 (16.3%) |
| $75,000 to $99,999 | 705 (13.5%) | 278 (9.8%) |
| $100,000 to $149,999 | 1,046 (20.0%) | 215 (7.5%) |
| $150,000 or more | 804 (15.4%) | 76 (2.7%) |
| Total | 5,219 (100.0%) | 2,848 (100.0%) |
Monthly Housing Cost Tiers in Bourbon County
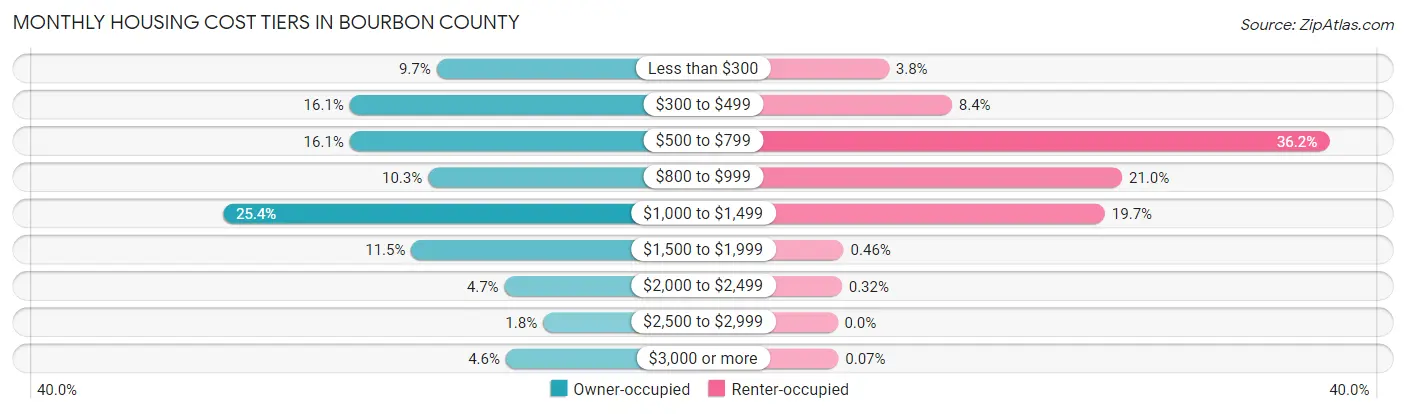
| Monthly Cost | Owner-occupied | Renter-occupied |
| Less than $300 | 504 (9.7%) | 108 (3.8%) |
| $300 to $499 | 838 (16.1%) | 240 (8.4%) |
| $500 to $799 | 838 (16.1%) | 1,031 (36.2%) |
| $800 to $999 | 537 (10.3%) | 597 (21.0%) |
| $1,000 to $1,499 | 1,325 (25.4%) | 561 (19.7%) |
| $1,500 to $1,999 | 601 (11.5%) | 13 (0.5%) |
| $2,000 to $2,499 | 243 (4.7%) | 9 (0.3%) |
| $2,500 to $2,999 | 95 (1.8%) | 0 (0.0%) |
| $3,000 or more | 238 (4.6%) | 2 (0.1%) |
| Total | 5,219 (100.0%) | 2,848 (100.0%) |
Physical Housing Characteristics in Bourbon County
Housing Structures in Bourbon County
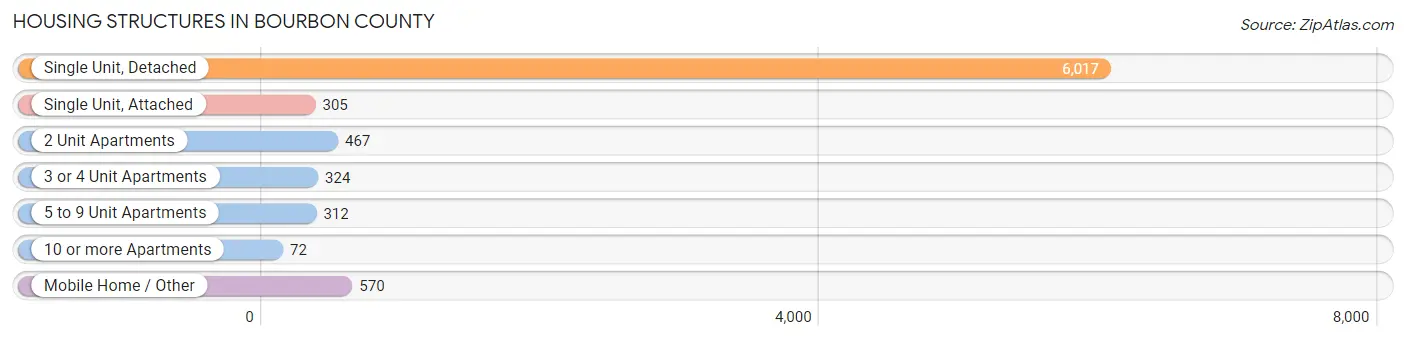
| Structure Type | # Housing Units | % Housing Units |
| Single Unit, Detached | 6,017 | 74.6% |
| Single Unit, Attached | 305 | 3.8% |
| 2 Unit Apartments | 467 | 5.8% |
| 3 or 4 Unit Apartments | 324 | 4.0% |
| 5 to 9 Unit Apartments | 312 | 3.9% |
| 10 or more Apartments | 72 | 0.9% |
| Mobile Home / Other | 570 | 7.1% |
| Total | 8,067 | 100.0% |
Housing Structures by Occupancy in Bourbon County
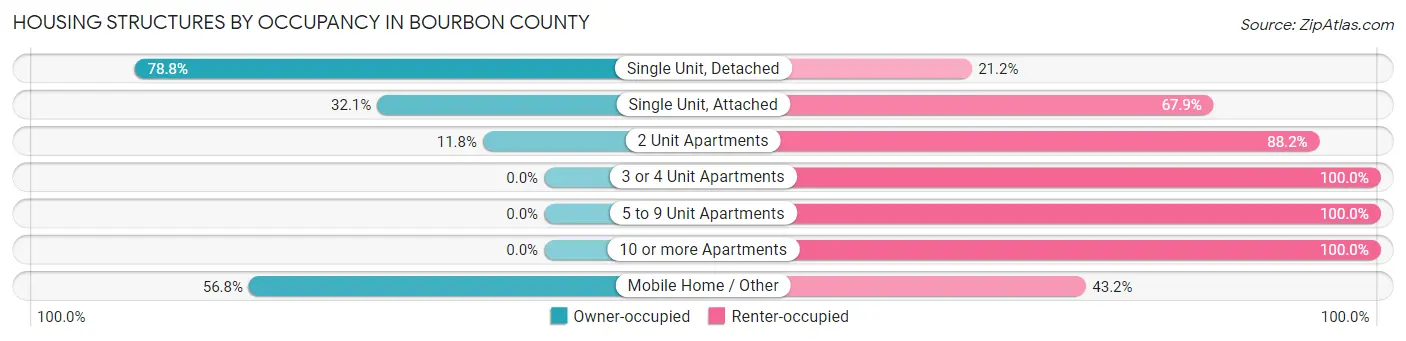
| Structure Type | Owner-occupied | Renter-occupied |
| Single Unit, Detached | 4,742 (78.8%) | 1,275 (21.2%) |
| Single Unit, Attached | 98 (32.1%) | 207 (67.9%) |
| 2 Unit Apartments | 55 (11.8%) | 412 (88.2%) |
| 3 or 4 Unit Apartments | 0 (0.0%) | 324 (100.0%) |
| 5 to 9 Unit Apartments | 0 (0.0%) | 312 (100.0%) |
| 10 or more Apartments | 0 (0.0%) | 72 (100.0%) |
| Mobile Home / Other | 324 (56.8%) | 246 (43.2%) |
| Total | 5,219 (64.7%) | 2,848 (35.3%) |
Housing Structures by Number of Rooms in Bourbon County
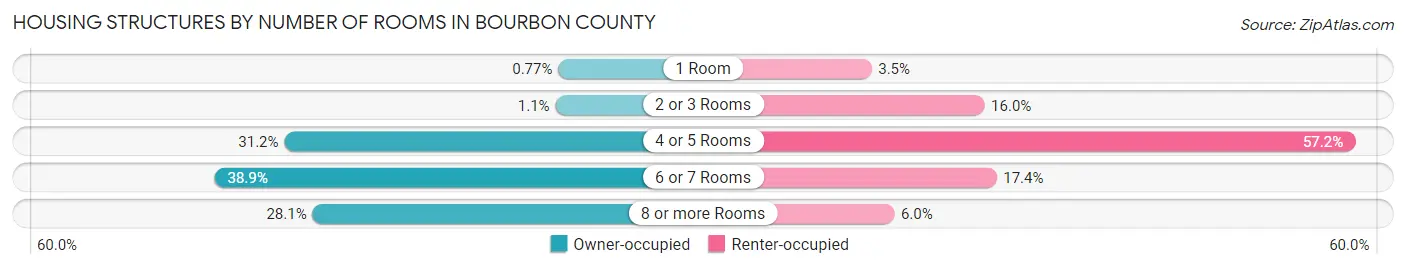
| Number of Rooms | Owner-occupied | Renter-occupied |
| 1 Room | 40 (0.8%) | 99 (3.5%) |
| 2 or 3 Rooms | 57 (1.1%) | 456 (16.0%) |
| 4 or 5 Rooms | 1,627 (31.2%) | 1,628 (57.2%) |
| 6 or 7 Rooms | 2,031 (38.9%) | 494 (17.3%) |
| 8 or more Rooms | 1,464 (28.1%) | 171 (6.0%) |
| Total | 5,219 (100.0%) | 2,848 (100.0%) |
Housing Structure by Heating Type in Bourbon County
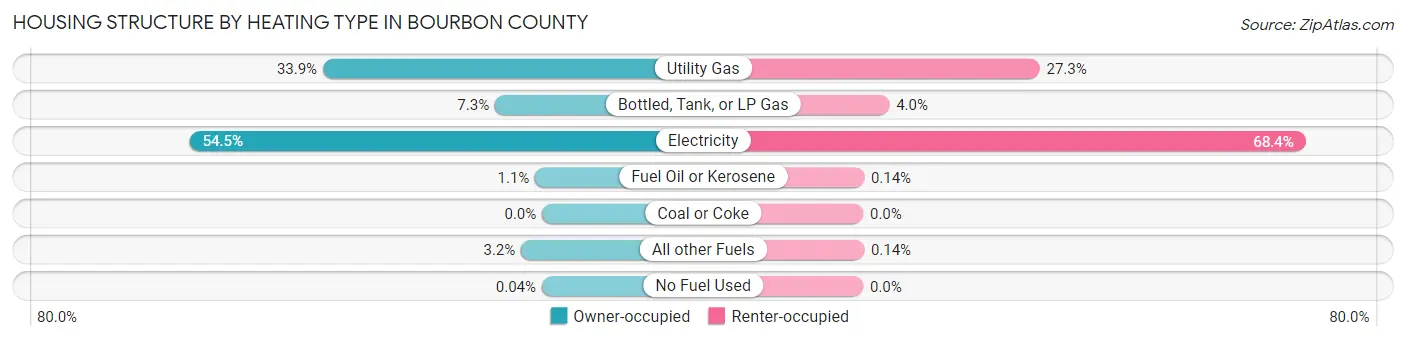
| Heating Type | Owner-occupied | Renter-occupied |
| Utility Gas | 1,768 (33.9%) | 777 (27.3%) |
| Bottled, Tank, or LP Gas | 380 (7.3%) | 115 (4.0%) |
| Electricity | 2,844 (54.5%) | 1,948 (68.4%) |
| Fuel Oil or Kerosene | 56 (1.1%) | 4 (0.1%) |
| Coal or Coke | 0 (0.0%) | 0 (0.0%) |
| All other Fuels | 169 (3.2%) | 4 (0.1%) |
| No Fuel Used | 2 (0.0%) | 0 (0.0%) |
| Total | 5,219 (100.0%) | 2,848 (100.0%) |
Household Vehicle Usage in Bourbon County
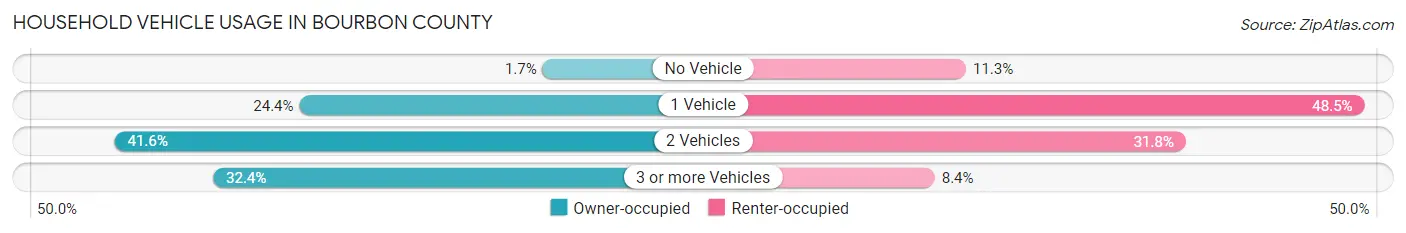
| Vehicles per Household | Owner-occupied | Renter-occupied |
| No Vehicle | 86 (1.7%) | 322 (11.3%) |
| 1 Vehicle | 1,271 (24.3%) | 1,381 (48.5%) |
| 2 Vehicles | 2,171 (41.6%) | 906 (31.8%) |
| 3 or more Vehicles | 1,691 (32.4%) | 239 (8.4%) |
| Total | 5,219 (100.0%) | 2,848 (100.0%) |
Real Estate & Mortgages in Bourbon County
Real Estate and Mortgage Overview in Bourbon County
| Characteristic | Without Mortgage | With Mortgage |
| Housing Units | 2,004 | 3,215 |
| Median Property Value | $159,000 | $202,300 |
| Median Household Income | $48,906 | $632 |
| Monthly Housing Costs | $422 | $238 |
| Real Estate Taxes | $1,221 | $50 |
Property Value by Mortgage Status in Bourbon County
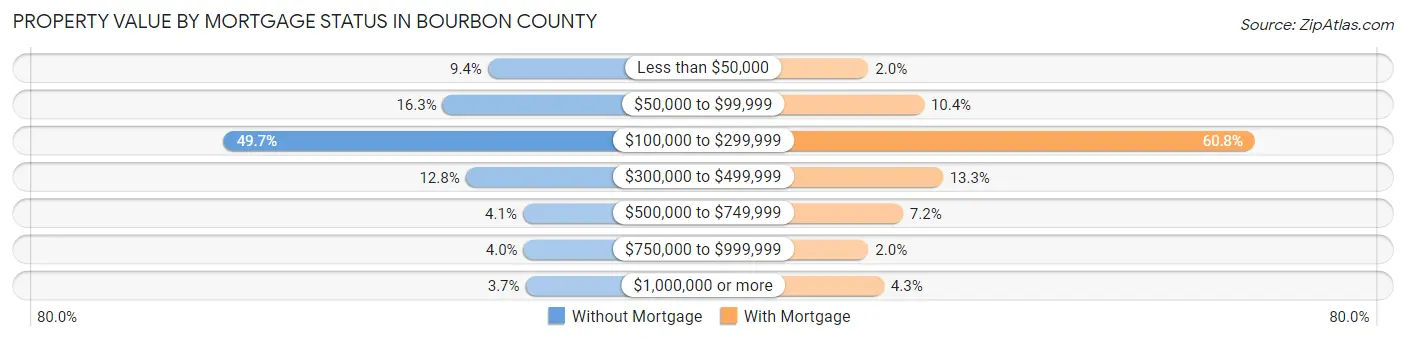
| Property Value | Without Mortgage | With Mortgage |
| Less than $50,000 | 189 (9.4%) | 63 (2.0%) |
| $50,000 to $99,999 | 327 (16.3%) | 335 (10.4%) |
| $100,000 to $299,999 | 995 (49.6%) | 1,956 (60.8%) |
| $300,000 to $499,999 | 257 (12.8%) | 427 (13.3%) |
| $500,000 to $749,999 | 82 (4.1%) | 232 (7.2%) |
| $750,000 to $999,999 | 80 (4.0%) | 63 (2.0%) |
| $1,000,000 or more | 74 (3.7%) | 139 (4.3%) |
| Total | 2,004 (100.0%) | 3,215 (100.0%) |
Household Income by Mortgage Status in Bourbon County
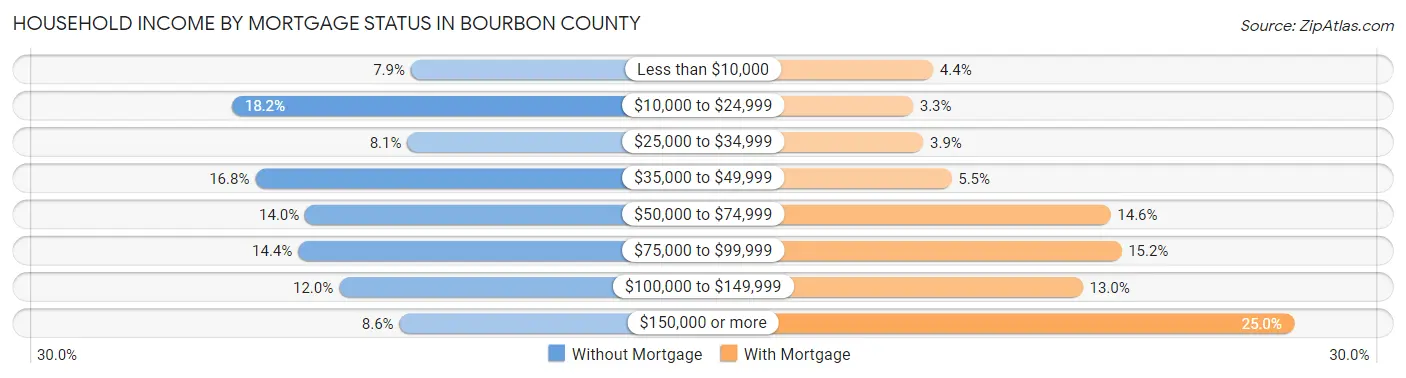
| Household Income | Without Mortgage | With Mortgage |
| Less than $10,000 | 159 (7.9%) | 142 (4.4%) |
| $10,000 to $24,999 | 364 (18.2%) | 105 (3.3%) |
| $25,000 to $34,999 | 163 (8.1%) | 124 (3.9%) |
| $35,000 to $49,999 | 337 (16.8%) | 176 (5.5%) |
| $50,000 to $74,999 | 280 (14.0%) | 468 (14.6%) |
| $75,000 to $99,999 | 288 (14.4%) | 488 (15.2%) |
| $100,000 to $149,999 | 241 (12.0%) | 417 (13.0%) |
| $150,000 or more | 172 (8.6%) | 805 (25.0%) |
| Total | 2,004 (100.0%) | 3,215 (100.0%) |
Property Value to Household Income Ratio in Bourbon County
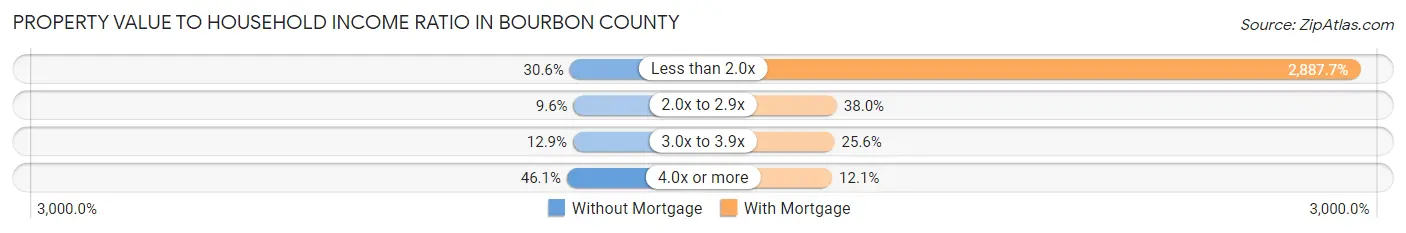
| Value-to-Income Ratio | Without Mortgage | With Mortgage |
| Less than 2.0x | 614 (30.6%) | 92,841 (2,887.7%) |
| 2.0x to 2.9x | 193 (9.6%) | 1,223 (38.0%) |
| 3.0x to 3.9x | 258 (12.9%) | 822 (25.6%) |
| 4.0x or more | 923 (46.1%) | 388 (12.1%) |
| Total | 2,004 (100.0%) | 3,215 (100.0%) |
Real Estate Taxes by Mortgage Status in Bourbon County
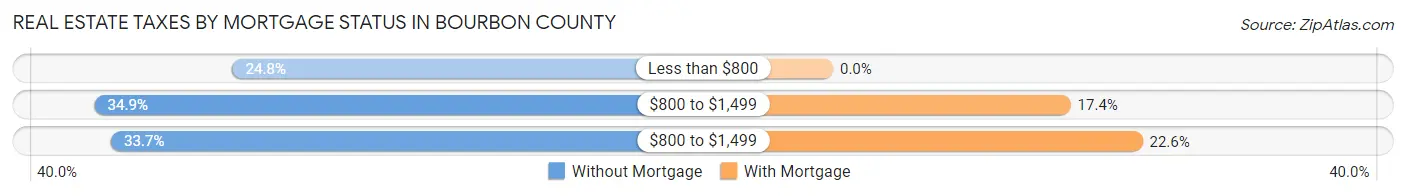
| Property Taxes | Without Mortgage | With Mortgage |
| Less than $800 | 497 (24.8%) | 0 (0.0%) |
| $800 to $1,499 | 699 (34.9%) | 558 (17.4%) |
| $800 to $1,499 | 675 (33.7%) | 727 (22.6%) |
| Total | 2,004 (100.0%) | 3,215 (100.0%) |
Health & Disability in Bourbon County
Health Insurance Coverage by Age in Bourbon County
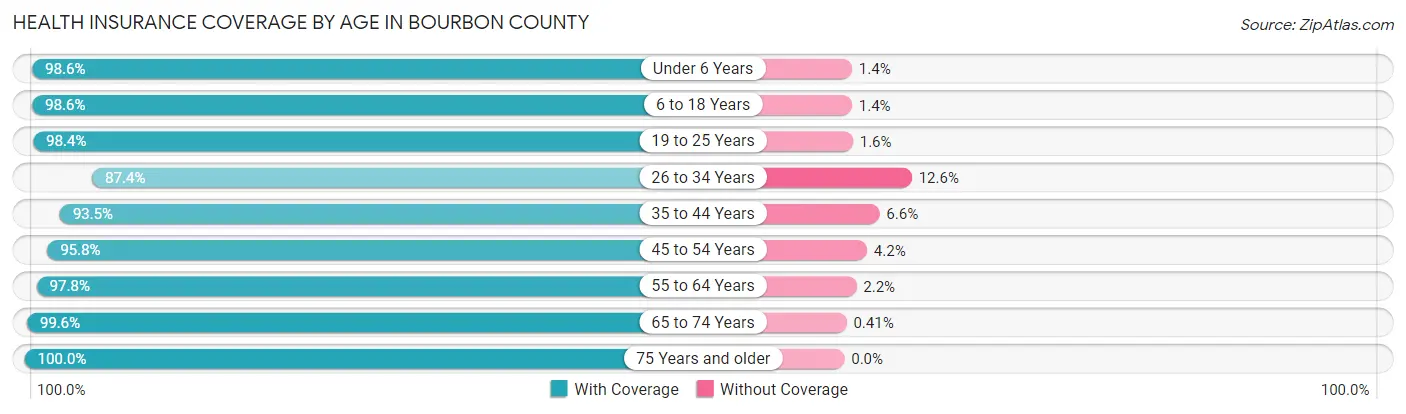
| Age Bracket | With Coverage | Without Coverage |
| Under 6 Years | 1,462 (98.6%) | 21 (1.4%) |
| 6 to 18 Years | 3,213 (98.6%) | 46 (1.4%) |
| 19 to 25 Years | 1,872 (98.4%) | 30 (1.6%) |
| 26 to 34 Years | 1,730 (87.4%) | 249 (12.6%) |
| 35 to 44 Years | 2,056 (93.4%) | 144 (6.6%) |
| 45 to 54 Years | 2,472 (95.8%) | 109 (4.2%) |
| 55 to 64 Years | 2,832 (97.8%) | 65 (2.2%) |
| 65 to 74 Years | 2,188 (99.6%) | 9 (0.4%) |
| 75 Years and older | 1,543 (100.0%) | 0 (0.0%) |
| Total | 19,368 (96.6%) | 673 (3.4%) |
Health Insurance Coverage by Citizenship Status in Bourbon County
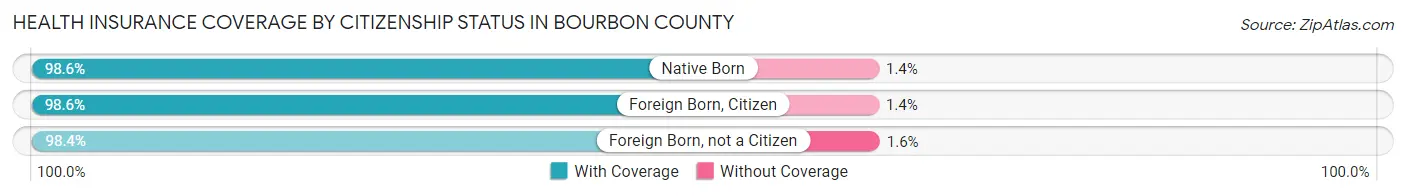
| Citizenship Status | With Coverage | Without Coverage |
| Native Born | 1,462 (98.6%) | 21 (1.4%) |
| Foreign Born, Citizen | 3,213 (98.6%) | 46 (1.4%) |
| Foreign Born, not a Citizen | 1,872 (98.4%) | 30 (1.6%) |
Health Insurance Coverage by Household Income in Bourbon County
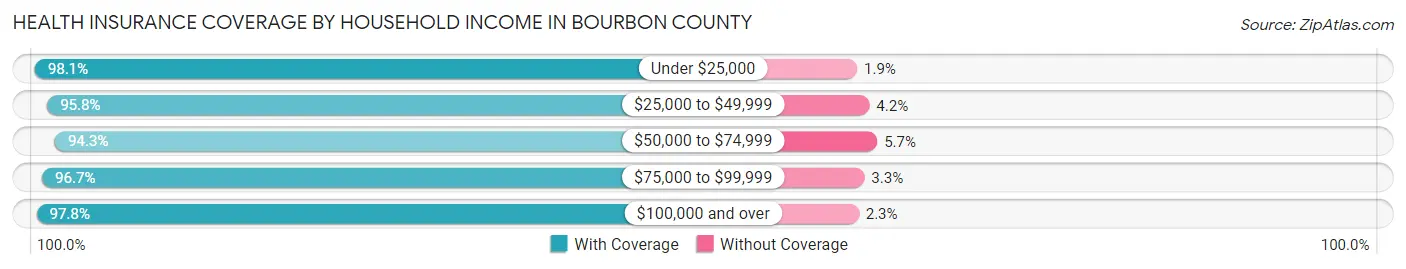
| Household Income | With Coverage | Without Coverage |
| Under $25,000 | 2,895 (98.1%) | 57 (1.9%) |
| $25,000 to $49,999 | 4,038 (95.8%) | 179 (4.2%) |
| $50,000 to $74,999 | 3,292 (94.3%) | 199 (5.7%) |
| $75,000 to $99,999 | 2,493 (96.7%) | 85 (3.3%) |
| $100,000 and over | 6,640 (97.8%) | 153 (2.2%) |
Public vs Private Health Insurance Coverage by Age in Bourbon County
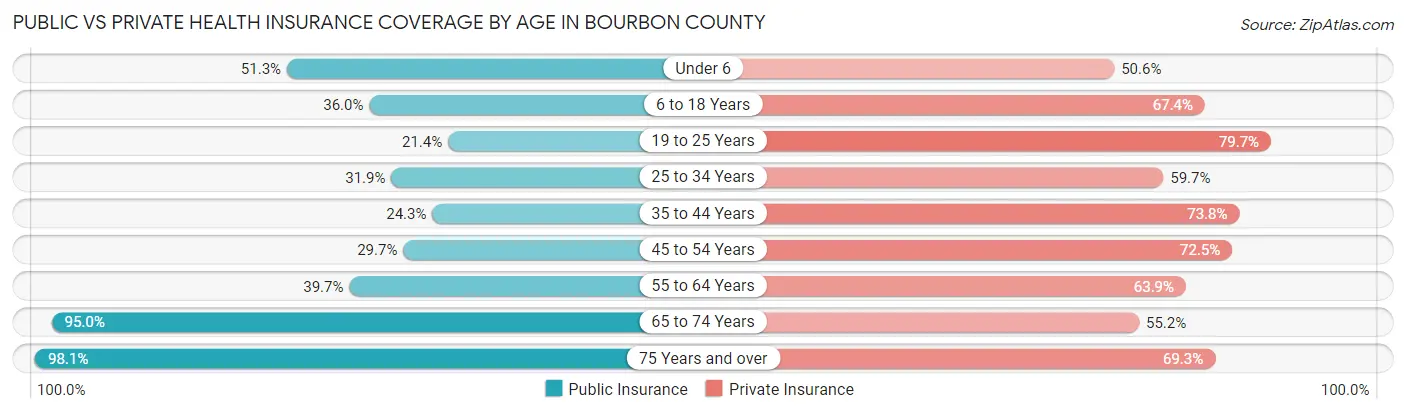
| Age Bracket | Public Insurance | Private Insurance |
| Under 6 | 761 (51.3%) | 750 (50.6%) |
| 6 to 18 Years | 1,174 (36.0%) | 2,196 (67.4%) |
| 19 to 25 Years | 407 (21.4%) | 1,515 (79.6%) |
| 25 to 34 Years | 632 (31.9%) | 1,181 (59.7%) |
| 35 to 44 Years | 535 (24.3%) | 1,623 (73.8%) |
| 45 to 54 Years | 767 (29.7%) | 1,870 (72.5%) |
| 55 to 64 Years | 1,151 (39.7%) | 1,850 (63.9%) |
| 65 to 74 Years | 2,087 (95.0%) | 1,212 (55.2%) |
| 75 Years and over | 1,513 (98.1%) | 1,069 (69.3%) |
| Total | 9,027 (45.0%) | 13,266 (66.2%) |
Disability Status by Sex by Age in Bourbon County
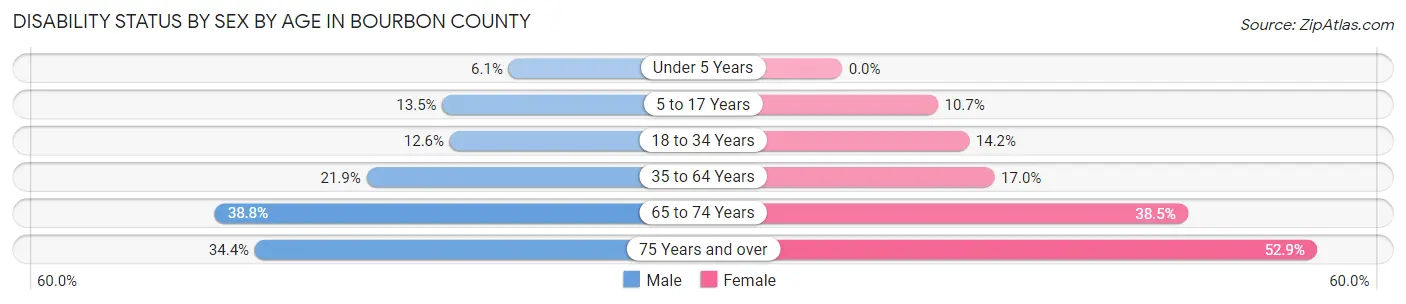
| Age Bracket | Male | Female |
| Under 5 Years | 41 (6.1%) | 0 (0.0%) |
| 5 to 17 Years | 237 (13.5%) | 174 (10.7%) |
| 18 to 34 Years | 250 (12.6%) | 293 (14.1%) |
| 35 to 64 Years | 828 (21.9%) | 662 (17.0%) |
| 65 to 74 Years | 392 (38.8%) | 457 (38.5%) |
| 75 Years and over | 215 (34.4%) | 485 (52.9%) |
Disability Class by Sex by Age in Bourbon County
Disability Class: Hearing Difficulty
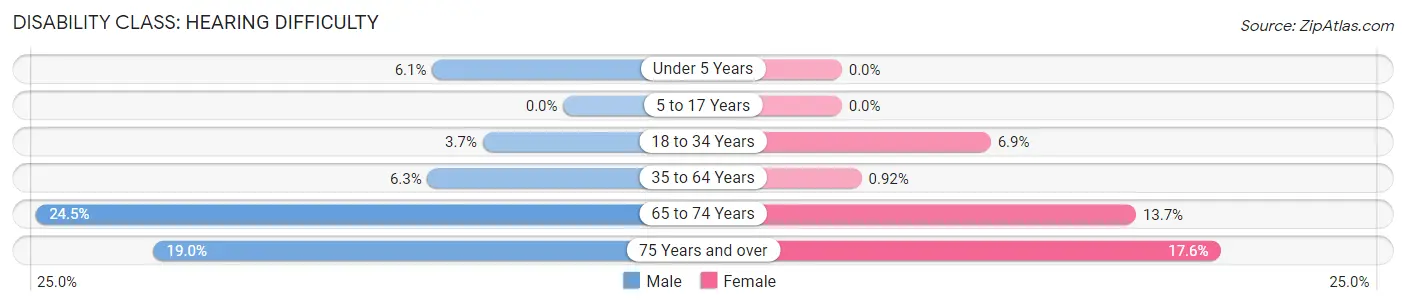
| Age Bracket | Male | Female |
| Under 5 Years | 41 (6.1%) | 0 (0.0%) |
| 5 to 17 Years | 0 (0.0%) | 0 (0.0%) |
| 18 to 34 Years | 74 (3.7%) | 143 (6.9%) |
| 35 to 64 Years | 238 (6.3%) | 36 (0.9%) |
| 65 to 74 Years | 247 (24.5%) | 162 (13.7%) |
| 75 Years and over | 119 (19.0%) | 161 (17.6%) |
Disability Class: Vision Difficulty
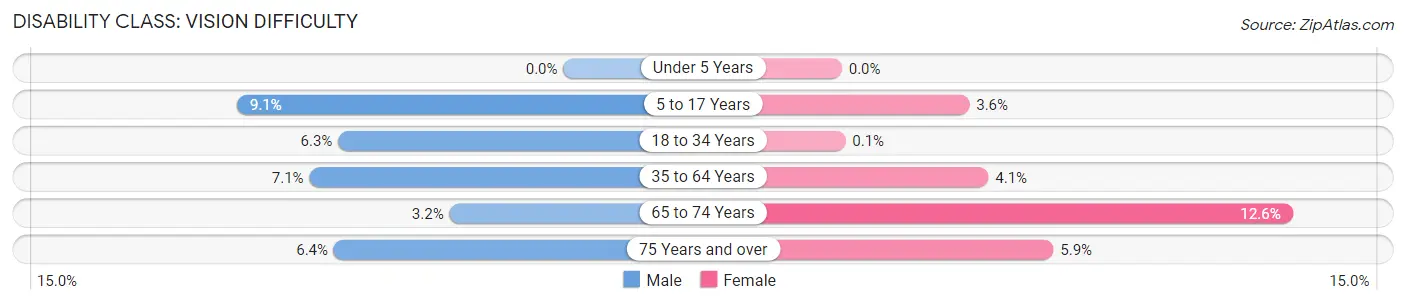
| Age Bracket | Male | Female |
| Under 5 Years | 0 (0.0%) | 0 (0.0%) |
| 5 to 17 Years | 160 (9.1%) | 58 (3.5%) |
| 18 to 34 Years | 124 (6.3%) | 2 (0.1%) |
| 35 to 64 Years | 267 (7.1%) | 159 (4.1%) |
| 65 to 74 Years | 32 (3.2%) | 149 (12.6%) |
| 75 Years and over | 40 (6.4%) | 54 (5.9%) |
Disability Class: Cognitive Difficulty
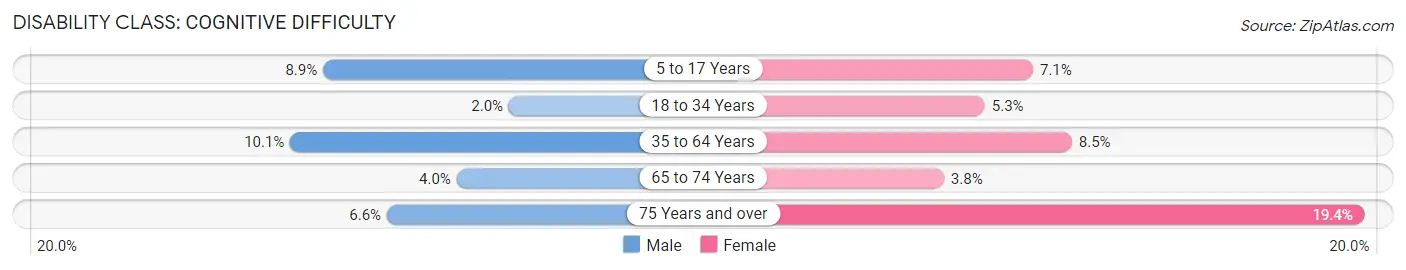
| Age Bracket | Male | Female |
| 5 to 17 Years | 157 (8.9%) | 116 (7.1%) |
| 18 to 34 Years | 40 (2.0%) | 110 (5.3%) |
| 35 to 64 Years | 383 (10.1%) | 333 (8.5%) |
| 65 to 74 Years | 40 (4.0%) | 45 (3.8%) |
| 75 Years and over | 41 (6.6%) | 178 (19.4%) |
Disability Class: Ambulatory Difficulty
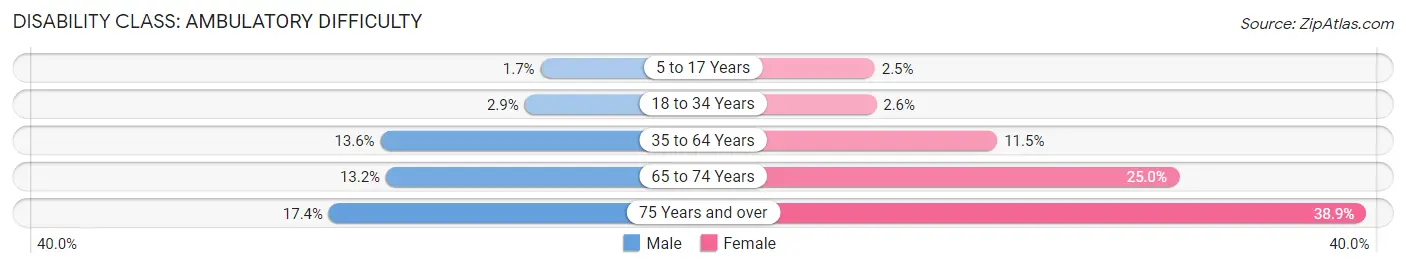
| Age Bracket | Male | Female |
| 5 to 17 Years | 30 (1.7%) | 40 (2.5%) |
| 18 to 34 Years | 57 (2.9%) | 53 (2.6%) |
| 35 to 64 Years | 513 (13.6%) | 450 (11.5%) |
| 65 to 74 Years | 133 (13.2%) | 297 (25.0%) |
| 75 Years and over | 109 (17.4%) | 357 (38.9%) |
Disability Class: Self-Care Difficulty
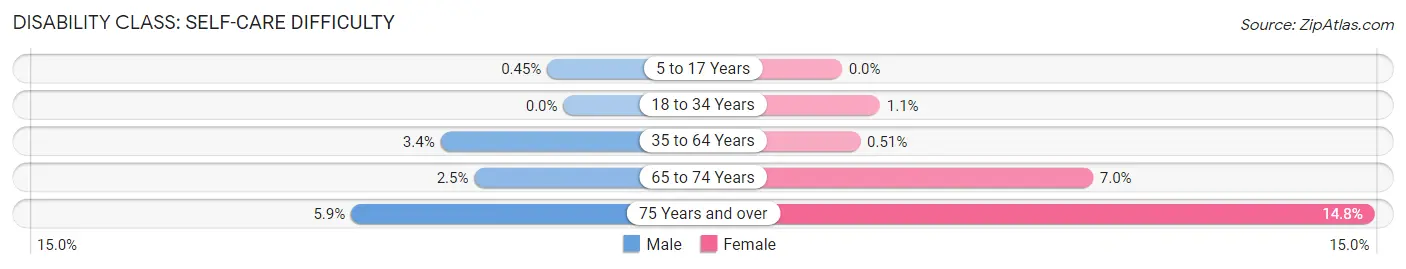
| Age Bracket | Male | Female |
| 5 to 17 Years | 8 (0.4%) | 0 (0.0%) |
| 18 to 34 Years | 0 (0.0%) | 22 (1.1%) |
| 35 to 64 Years | 129 (3.4%) | 20 (0.5%) |
| 65 to 74 Years | 25 (2.5%) | 83 (7.0%) |
| 75 Years and over | 37 (5.9%) | 136 (14.8%) |
Technology Access in Bourbon County
Computing Device Access in Bourbon County
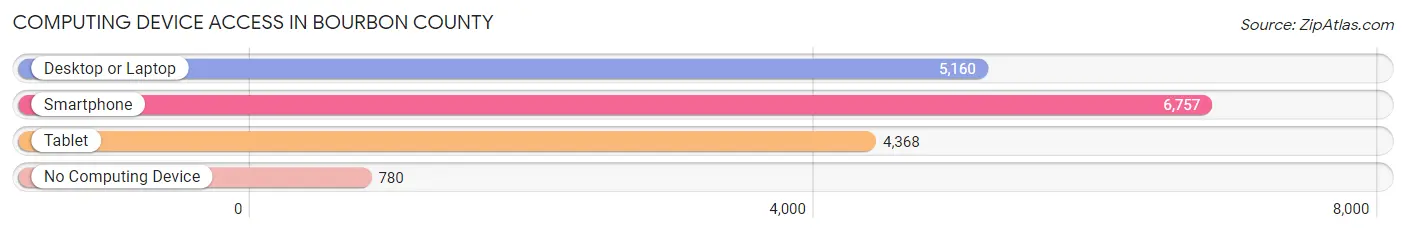
| Device Type | # Households | % Households |
| Desktop or Laptop | 5,160 | 64.0% |
| Smartphone | 6,757 | 83.8% |
| Tablet | 4,368 | 54.1% |
| No Computing Device | 780 | 9.7% |
| Total | 8,067 | 100.0% |
Internet Access in Bourbon County
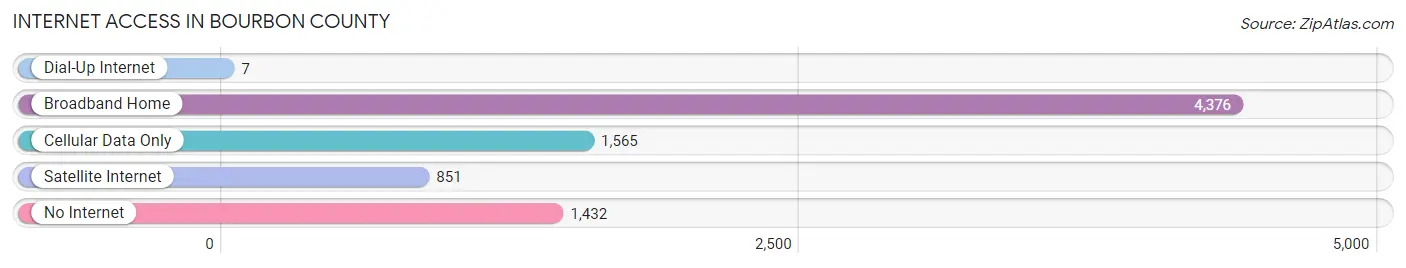
| Internet Type | # Households | % Households |
| Dial-Up Internet | 7 | 0.1% |
| Broadband Home | 4,376 | 54.2% |
| Cellular Data Only | 1,565 | 19.4% |
| Satellite Internet | 851 | 10.5% |
| No Internet | 1,432 | 17.7% |
| Total | 8,067 | 100.0% |
Bourbon County Summary
Bourbon County is located in the Bluegrass region of Kentucky, and is part of the Lexington-Fayette Metropolitan Statistical Area. The county was established in 1786 and is named after the French royal family, the House of Bourbon. The county seat is Paris, Kentucky. As of the 2010 census, the population of Bourbon County was 19,985.
Geography
Bourbon County is located in the Bluegrass region of Kentucky, and is part of the Lexington-Fayette Metropolitan Statistical Area. The county is bordered by Clark County to the north, Fayette County to the east, Nicholas County to the south, and Harrison County to the west. The county has a total area of 286 square miles, of which 285 square miles is land and 1 square mile is water. The county is drained by the Stoner and Licking Rivers. The highest point in the county is located in the northwest corner, at an elevation of 890 feet.
History
Bourbon County was established in 1786 and is named after the French royal family, the House of Bourbon. The county was formed from a portion of Fayette County and was the 15th county established in the state of Kentucky. The county seat is Paris, Kentucky, which was established in 1789.
The county was a major center of the bourbon whiskey industry in the 19th century, and the county was home to many of the most famous distilleries in the country. The county was also home to many prominent horse farms, and was the birthplace of the famous racehorse Man o' War.
Economy
The economy of Bourbon County is largely based on agriculture and tourism. The county is home to many horse farms, and is a major center of the thoroughbred horse industry. The county is also home to many distilleries, and is a major center of the bourbon whiskey industry.
The county is also home to many tourist attractions, including the Kentucky Horse Park, the Bourbon County Historical Society, and the Kentucky Bourbon Trail.
Demographics
As of the 2010 census, the population of Bourbon County was 19,985. The racial makeup of the county was 95.3% White, 2.3% Black or African American, 0.3% Native American, 0.3% Asian, 0.2% from other races, and 1.5% from two or more races. 1.7% of the population were Hispanic or Latino of any race.
The median income for a household in the county was $41,945, and the median income for a family was $50,945. The per capita income for the county was $21,845. About 11.2% of families and 14.2% of the population were below the poverty line, including 19.2% of those under age 18 and 11.2% of those age 65 or over.
Common Questions
What is Per Capita Income in Bourbon County?
Per Capita income in Bourbon County is $30,123.
What is the Median Family Income in Bourbon County?
Median Family Income in Bourbon County is $71,530.
What is the Median Household income in Bourbon County?
Median Household Income in Bourbon County is $54,580.
What is Income or Wage Gap in Bourbon County?
Income or Wage Gap in Bourbon County is 16.2%.
Women in Bourbon County earn 83.8 cents for every dollar earned by a man.
What is Family Income Deficit in Bourbon County?
Family Income Deficit in Bourbon County is $8,304.
Families that are below poverty line in Bourbon County earn $8,304 less on average than the poverty threshold level.
What is Inequality or Gini Index in Bourbon County?
Inequality or Gini Index in Bourbon County is 0.45.
What is the Total Population of Bourbon County?
Total Population of Bourbon County is 20,228.
What is the Total Male Population of Bourbon County?
Total Male Population of Bourbon County is 9,944.
What is the Total Female Population of Bourbon County?
Total Female Population of Bourbon County is 10,284.
What is the Ratio of Males per 100 Females in Bourbon County?
There are 96.69 Males per 100 Females in Bourbon County.
What is the Ratio of Females per 100 Males in Bourbon County?
There are 103.42 Females per 100 Males in Bourbon County.
What is the Median Population Age in Bourbon County?
Median Population Age in Bourbon County is 41.8 Years.
What is the Average Family Size in Bourbon County
Average Family Size in Bourbon County is 3.0 People.
What is the Average Household Size in Bourbon County
Average Household Size in Bourbon County is 2.5 People.
How Large is the Labor Force in Bourbon County?
There are 9,629 People in the Labor Forcein in Bourbon County.
What is the Percentage of People in the Labor Force in Bourbon County?
59.6% of People are in the Labor Force in Bourbon County.
What is the Unemployment Rate in Bourbon County?
Unemployment Rate in Bourbon County is 5.5%.