Bell County, KY Map & Demographics
Bell County Map
Bell County Overview
$19,262
PER CAPITA INCOME
$44,936
AVG FAMILY INCOME
$33,658
AVG HOUSEHOLD INCOME
18.5%
WAGE / INCOME GAP [ % ]
81.5¢/ $1
WAGE / INCOME GAP [ $ ]
$8,371
FAMILY INCOME DEFICIT
0.48
INEQUALITY / GINI INDEX
24,248
TOTAL POPULATION
12,167
MALE POPULATION
12,081
FEMALE POPULATION
100.71
MALES / 100 FEMALES
99.29
FEMALES / 100 MALES
41.5
MEDIAN AGE
3.1
AVG FAMILY SIZE
2.5
AVG HOUSEHOLD SIZE
8,042
LABOR FORCE [ PEOPLE ]
40.9%
PERCENT IN LABOR FORCE
10.0%
UNEMPLOYMENT RATE
Bell County Area Codes
Income in Bell County
Income Overview in Bell County
Per Capita Income in Bell County is $19,262, while median incomes of families and households are $44,936 and $33,658 respectively.
| Characteristic | Number | Measure |
| Per Capita Income | 24,248 | $19,262 |
| Median Family Income | 6,268 | $44,936 |
| Mean Family Income | 6,268 | $57,299 |
| Median Household Income | 9,456 | $33,658 |
| Mean Household Income | 9,456 | $46,786 |
| Income Deficit | 6,268 | $8,371 |
| Wage / Income Gap (%) | 24,248 | 18.55% |
| Wage / Income Gap ($) | 24,248 | 81.45¢ per $1 |
| Gini / Inequality Index | 24,248 | 0.48 |
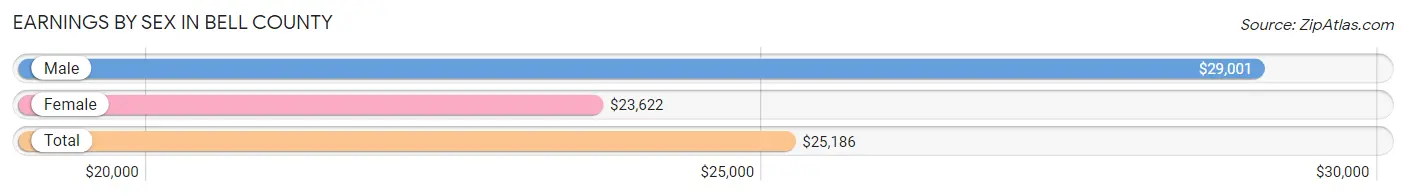
Earnings by Sex in Bell County
Average Earnings in Bell County are $25,186, $29,001 for men and $23,622 for women, a difference of 18.5%.
| Sex | Number | Average Earnings |
| Male | 4,579 (52.8%) | $29,001 |
| Female | 4,092 (47.2%) | $23,622 |
| Total | 8,671 (100.0%) | $25,186 |
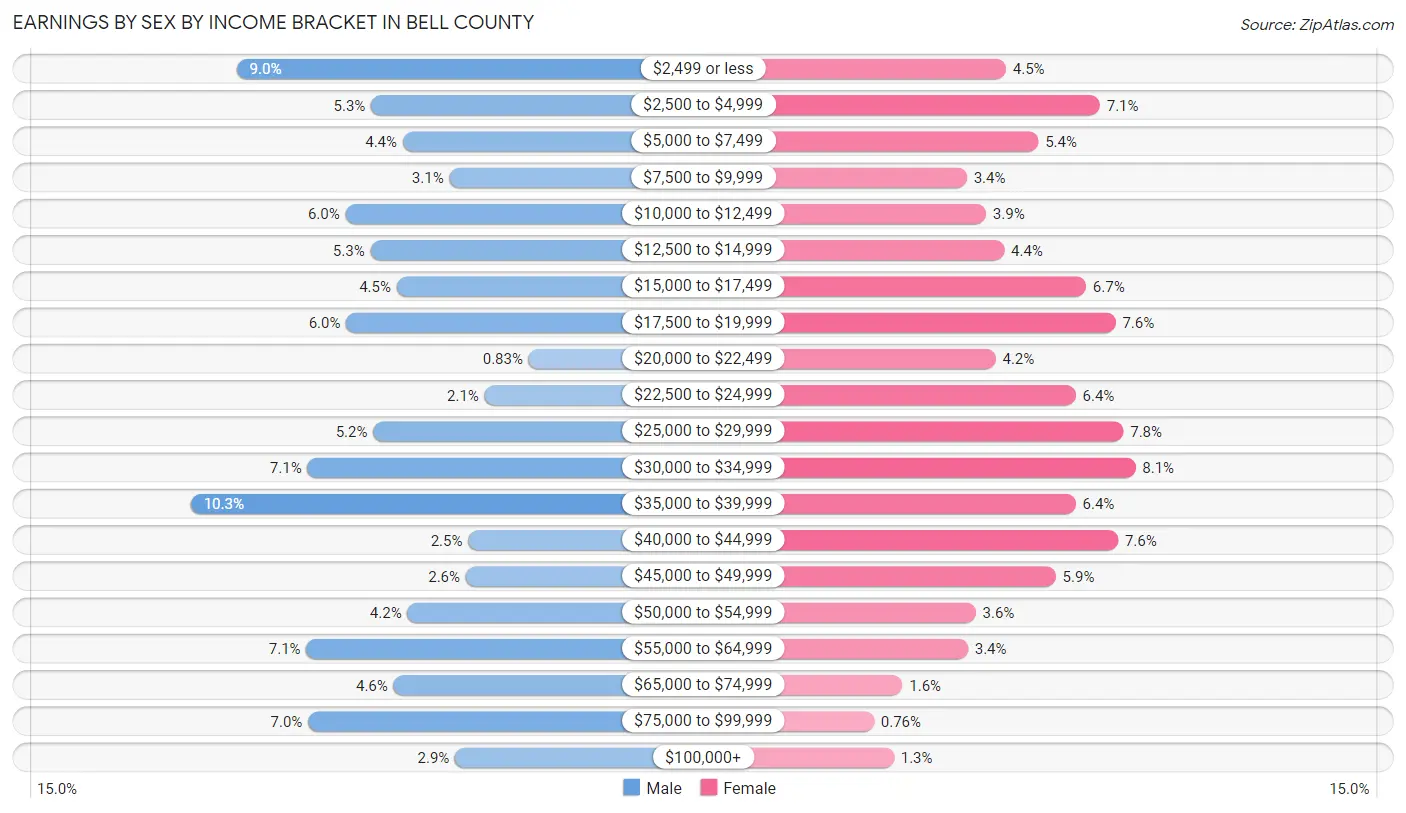
Earnings by Sex by Income Bracket in Bell County
The most common earnings brackets in Bell County are $35,000 to $39,999 for men (473 | 10.3%) and $30,000 to $34,999 for women (332 | 8.1%).
| Income | Male | Female |
| $2,499 or less | 414 (9.0%) | 183 (4.5%) |
| $2,500 to $4,999 | 241 (5.3%) | 291 (7.1%) |
| $5,000 to $7,499 | 200 (4.4%) | 220 (5.4%) |
| $7,500 to $9,999 | 140 (3.1%) | 138 (3.4%) |
| $10,000 to $12,499 | 274 (6.0%) | 160 (3.9%) |
| $12,500 to $14,999 | 242 (5.3%) | 181 (4.4%) |
| $15,000 to $17,499 | 208 (4.5%) | 275 (6.7%) |
| $17,500 to $19,999 | 273 (6.0%) | 309 (7.5%) |
| $20,000 to $22,499 | 38 (0.8%) | 171 (4.2%) |
| $22,500 to $24,999 | 95 (2.1%) | 263 (6.4%) |
| $25,000 to $29,999 | 238 (5.2%) | 318 (7.8%) |
| $30,000 to $34,999 | 323 (7.0%) | 332 (8.1%) |
| $35,000 to $39,999 | 473 (10.3%) | 263 (6.4%) |
| $40,000 to $44,999 | 116 (2.5%) | 312 (7.6%) |
| $45,000 to $49,999 | 119 (2.6%) | 240 (5.9%) |
| $50,000 to $54,999 | 194 (4.2%) | 148 (3.6%) |
| $55,000 to $64,999 | 324 (7.1%) | 139 (3.4%) |
| $65,000 to $74,999 | 212 (4.6%) | 64 (1.6%) |
| $75,000 to $99,999 | 322 (7.0%) | 31 (0.8%) |
| $100,000+ | 133 (2.9%) | 54 (1.3%) |
| Total | 4,579 (100.0%) | 4,092 (100.0%) |
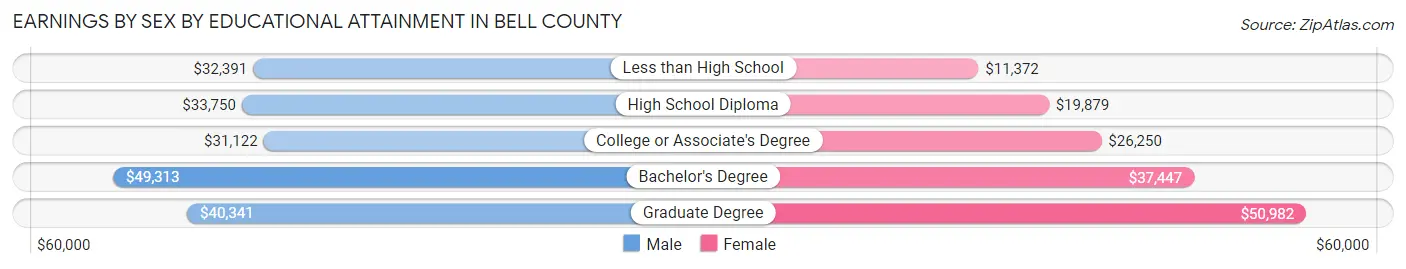
Earnings by Sex by Educational Attainment in Bell County
Average earnings in Bell County are $33,885 for men and $24,625 for women, a difference of 27.3%. Men with an educational attainment of bachelor's degree enjoy the highest average annual earnings of $49,313, while those with college or associate's degree education earn the least with $31,122. Women with an educational attainment of graduate degree earn the most with the average annual earnings of $50,982, while those with less than high school education have the smallest earnings of $11,372.
| Educational Attainment | Male Income | Female Income |
| Less than High School | $32,391 | $11,372 |
| High School Diploma | $33,750 | $19,879 |
| College or Associate's Degree | $31,122 | $26,250 |
| Bachelor's Degree | $49,313 | $37,447 |
| Graduate Degree | $40,341 | $50,982 |
| Total | $33,885 | $24,625 |
Family Income in Bell County
Family Income Brackets in Bell County
According to the Bell County family income data, there are 1,366 families falling into the $50,000 to $74,999 income range, which is the most common income bracket and makes up 21.8% of all families. Conversely, the $200,000+ income bracket is the least frequent group with only 94 families (1.5%) belonging to this category.
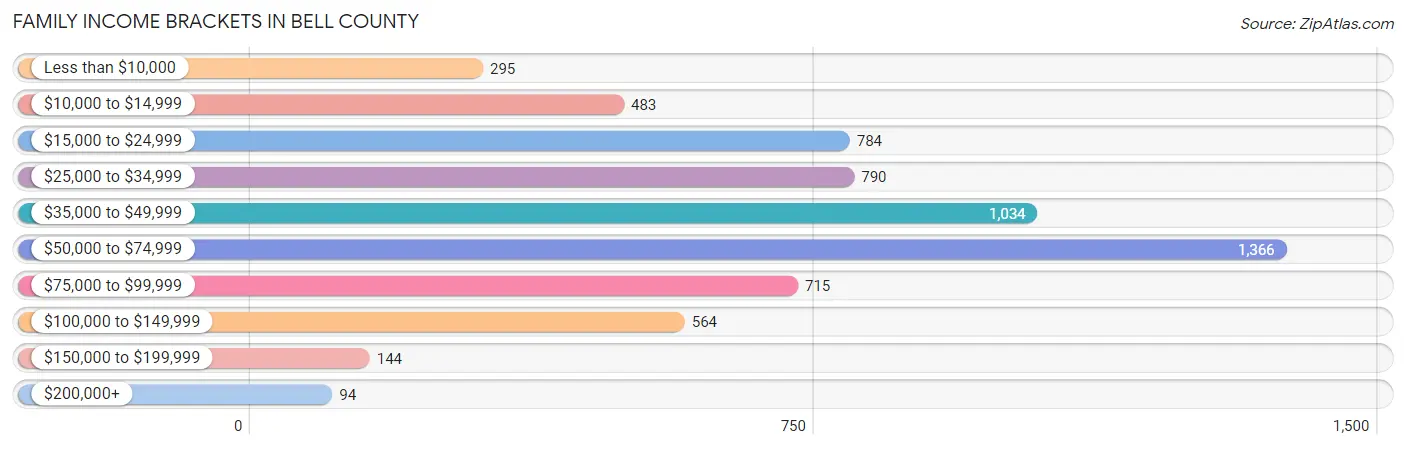
| Income Bracket | # Families | % Families |
| Less than $10,000 | 295 | 4.7% |
| $10,000 to $14,999 | 483 | 7.7% |
| $15,000 to $24,999 | 784 | 12.5% |
| $25,000 to $34,999 | 790 | 12.6% |
| $35,000 to $49,999 | 1,034 | 16.5% |
| $50,000 to $74,999 | 1,366 | 21.8% |
| $75,000 to $99,999 | 715 | 11.4% |
| $100,000 to $149,999 | 564 | 9.0% |
| $150,000 to $199,999 | 144 | 2.3% |
| $200,000+ | 94 | 1.5% |
Family Income by Famaliy Size in Bell County
7+ person families (73 | 1.2%) account for the highest median family income in Bell County with $107,446 per family, while 2-person families (3,436 | 54.8%) have the highest median income of $19,052 per family member.
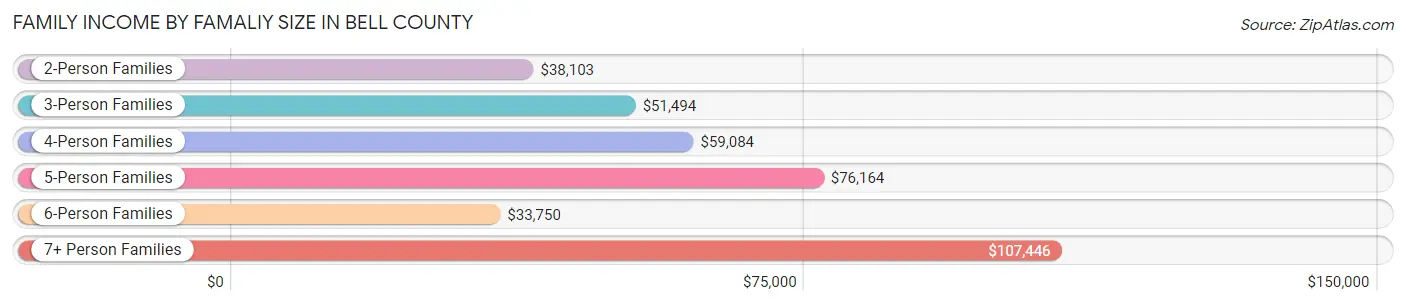
| Income Bracket | # Families | Median Income |
| 2-Person Families | 3,436 (54.8%) | $38,103 |
| 3-Person Families | 1,311 (20.9%) | $51,494 |
| 4-Person Families | 991 (15.8%) | $59,084 |
| 5-Person Families | 345 (5.5%) | $76,164 |
| 6-Person Families | 112 (1.8%) | $33,750 |
| 7+ Person Families | 73 (1.2%) | $107,446 |
| Total | 6,268 (100.0%) | $44,936 |
Family Income by Number of Earners in Bell County
The median family income in Bell County is $44,936, with families comprising 3+ earners (381) having the highest median family income of $89,313, while families with no earners (2,091) have the lowest median family income of $25,140, accounting for 6.1% and 33.4% of families, respectively.
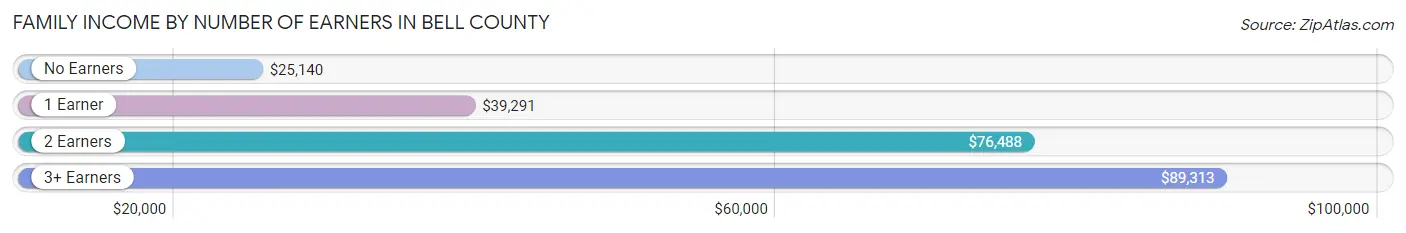
| Number of Earners | # Families | Median Income |
| No Earners | 2,091 (33.4%) | $25,140 |
| 1 Earner | 2,366 (37.8%) | $39,291 |
| 2 Earners | 1,430 (22.8%) | $76,488 |
| 3+ Earners | 381 (6.1%) | $89,313 |
| Total | 6,268 (100.0%) | $44,936 |
Household Income in Bell County
Household Income Brackets in Bell County
With 1,570 households falling in the category, the $15,000 to $24,999 income range is the most frequent in Bell County, accounting for 16.6% of all households. In contrast, only 95 households (1.0%) fall into the $200,000+ income bracket, making it the least populous group.
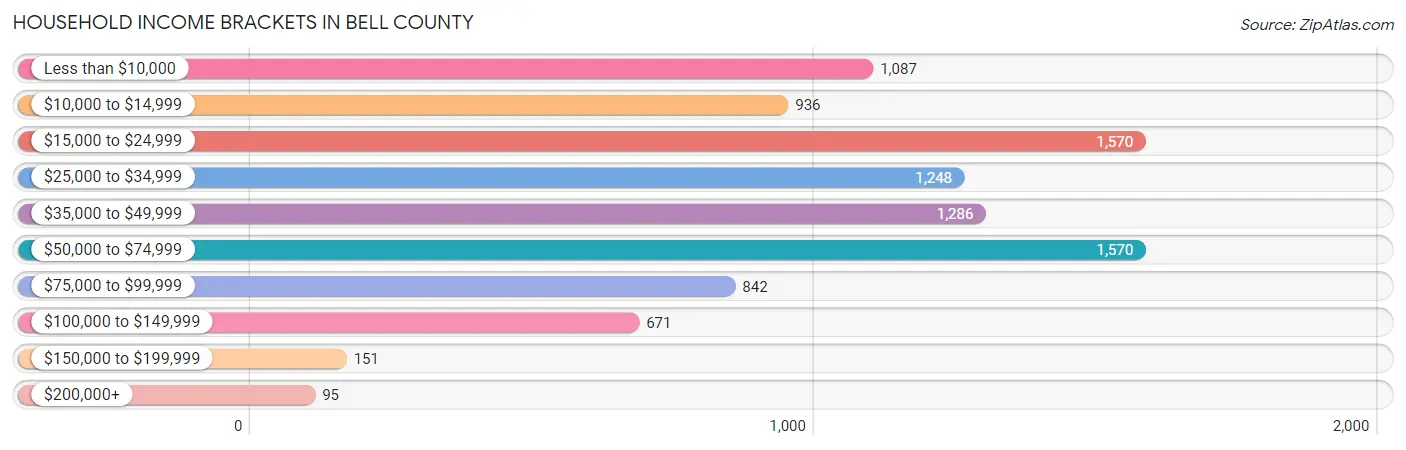
| Income Bracket | # Households | % Households |
| Less than $10,000 | 1,087 | 11.5% |
| $10,000 to $14,999 | 936 | 9.9% |
| $15,000 to $24,999 | 1,570 | 16.6% |
| $25,000 to $34,999 | 1,248 | 13.2% |
| $35,000 to $49,999 | 1,286 | 13.6% |
| $50,000 to $74,999 | 1,570 | 16.6% |
| $75,000 to $99,999 | 842 | 8.9% |
| $100,000 to $149,999 | 671 | 7.1% |
| $150,000 to $199,999 | 151 | 1.6% |
| $200,000+ | 95 | 1.0% |
Household Income by Householder Age in Bell County
The median household income in Bell County is $33,658, with the highest median household income of $50,368 found in the 15 to 24 years age bracket for the primary householder. A total of 259 households (2.7%) fall into this category. Meanwhile, the 65+ years age bracket for the primary householder has the lowest median household income of $29,229, with 3,071 households (32.5%) in this group.
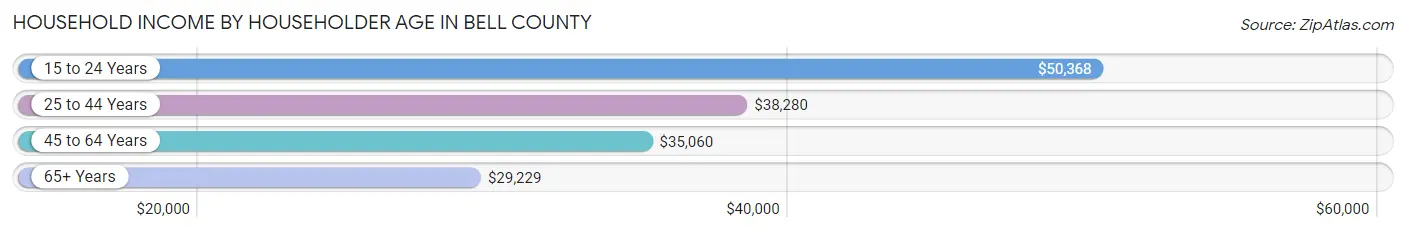
| Income Bracket | # Households | Median Income |
| 15 to 24 Years | 259 (2.7%) | $50,368 |
| 25 to 44 Years | 2,433 (25.7%) | $38,280 |
| 45 to 64 Years | 3,693 (39.1%) | $35,060 |
| 65+ Years | 3,071 (32.5%) | $29,229 |
| Total | 9,456 (100.0%) | $33,658 |
Poverty in Bell County
Income Below Poverty by Sex and Age in Bell County
With 26.4% poverty level for males and 26.2% for females among the residents of Bell County, 6 to 11 year old males and 12 to 14 year old females are the most vulnerable to poverty, with 362 males (45.8%) and 177 females (43.5%) in their respective age groups living below the poverty level.
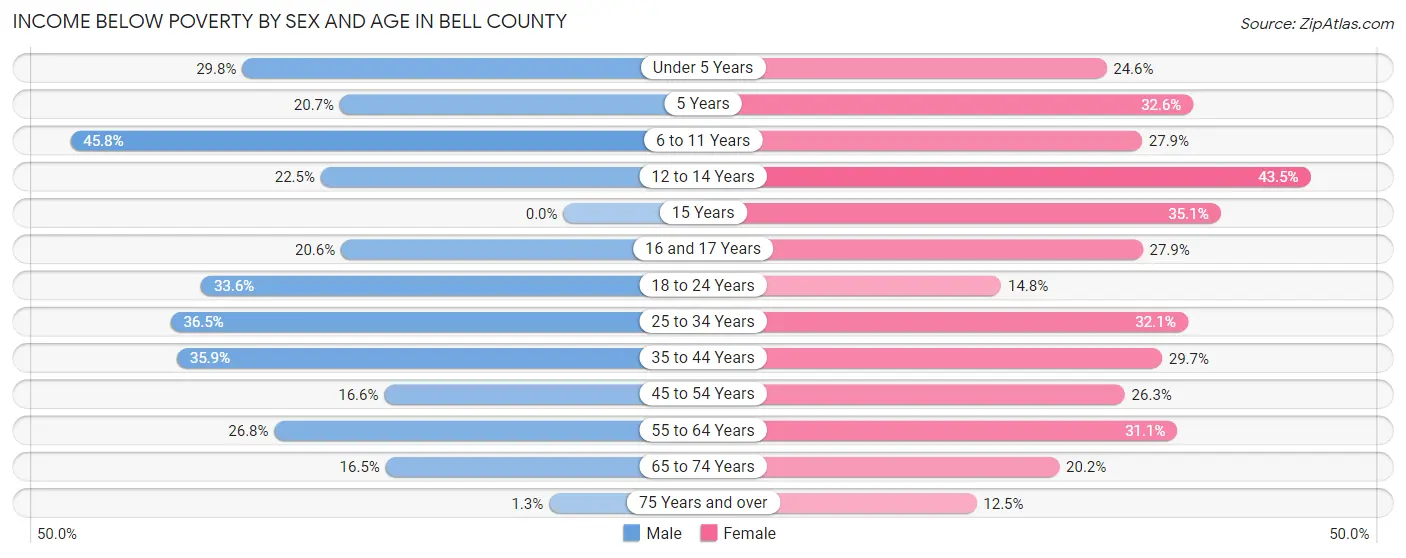
| Age Bracket | Male | Female |
| Under 5 Years | 219 (29.8%) | 135 (24.5%) |
| 5 Years | 56 (20.7%) | 45 (32.6%) |
| 6 to 11 Years | 362 (45.8%) | 205 (27.9%) |
| 12 to 14 Years | 106 (22.5%) | 177 (43.5%) |
| 15 Years | 0 (0.0%) | 52 (35.1%) |
| 16 and 17 Years | 85 (20.6%) | 72 (27.9%) |
| 18 to 24 Years | 376 (33.6%) | 125 (14.8%) |
| 25 to 34 Years | 513 (36.5%) | 452 (32.1%) |
| 35 to 44 Years | 439 (35.9%) | 403 (29.7%) |
| 45 to 54 Years | 250 (16.6%) | 426 (26.3%) |
| 55 to 64 Years | 471 (26.8%) | 552 (31.1%) |
| 65 to 74 Years | 206 (16.5%) | 293 (20.2%) |
| 75 Years and over | 9 (1.3%) | 124 (12.5%) |
| Total | 3,092 (26.4%) | 3,061 (26.2%) |
Income Above Poverty by Sex and Age in Bell County
According to the poverty statistics in Bell County, males aged 15 years and females aged 75 years and over are the age groups that are most secure financially, with 100.0% of males and 87.5% of females in these age groups living above the poverty line.
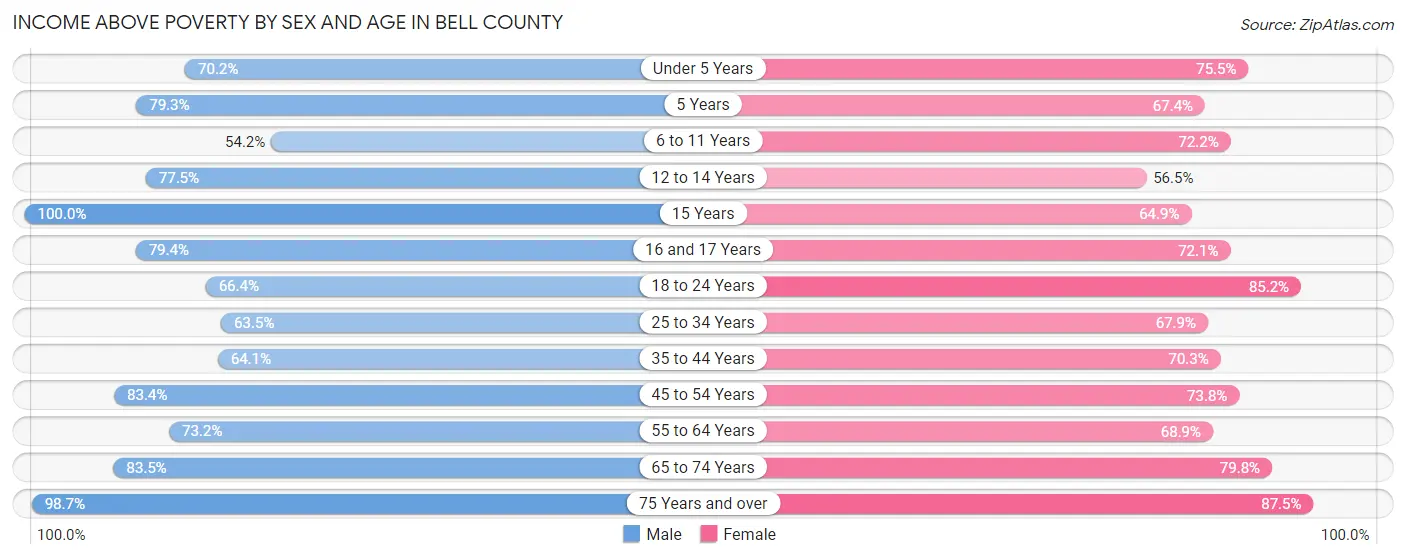
| Age Bracket | Male | Female |
| Under 5 Years | 516 (70.2%) | 415 (75.4%) |
| 5 Years | 214 (79.3%) | 93 (67.4%) |
| 6 to 11 Years | 429 (54.2%) | 531 (72.2%) |
| 12 to 14 Years | 365 (77.5%) | 230 (56.5%) |
| 15 Years | 98 (100.0%) | 96 (64.9%) |
| 16 and 17 Years | 327 (79.4%) | 186 (72.1%) |
| 18 to 24 Years | 742 (66.4%) | 721 (85.2%) |
| 25 to 34 Years | 894 (63.5%) | 957 (67.9%) |
| 35 to 44 Years | 785 (64.1%) | 954 (70.3%) |
| 45 to 54 Years | 1,254 (83.4%) | 1,197 (73.8%) |
| 55 to 64 Years | 1,285 (73.2%) | 1,221 (68.9%) |
| 65 to 74 Years | 1,043 (83.5%) | 1,160 (79.8%) |
| 75 Years and over | 666 (98.7%) | 869 (87.5%) |
| Total | 8,618 (73.6%) | 8,630 (73.8%) |
Income Below Poverty Among Married-Couple Families in Bell County
The poverty statistics for married-couple families in Bell County show that 12.0% or 476 of the total 3,957 families live below the poverty line. Families with 3 or 4 children have the highest poverty rate of 27.9%, comprising of 74 families. On the other hand, families with no children have the lowest poverty rate of 10.7%, which includes 255 families.
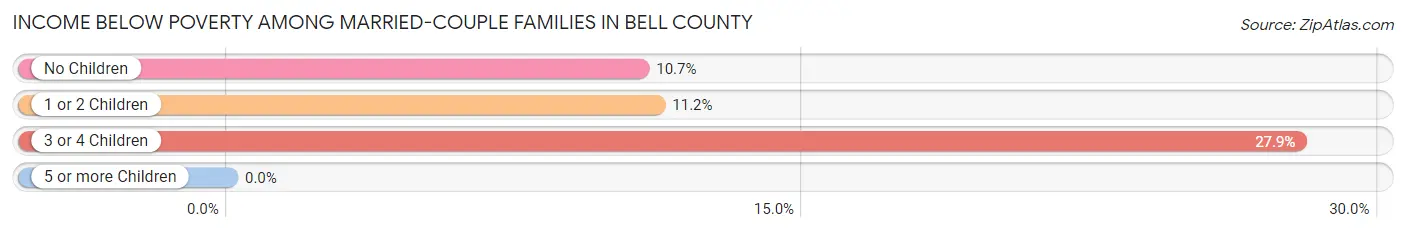
| Children | Above Poverty | Below Poverty |
| No Children | 2,120 (89.3%) | 255 (10.7%) |
| 1 or 2 Children | 1,170 (88.8%) | 147 (11.2%) |
| 3 or 4 Children | 191 (72.1%) | 74 (27.9%) |
| 5 or more Children | 0 (0.0%) | 0 (0.0%) |
| Total | 3,481 (88.0%) | 476 (12.0%) |
Income Below Poverty Among Single-Parent Households in Bell County
According to the poverty data in Bell County, 36.7% or 241 single-father households and 38.1% or 631 single-mother households are living below the poverty line. Among single-father households, those with 3 or 4 children have the highest poverty rate, with 16 households (76.2%) experiencing poverty. Likewise, among single-mother households, those with 3 or 4 children have the highest poverty rate, with 71 households (61.7%) falling below the poverty line.
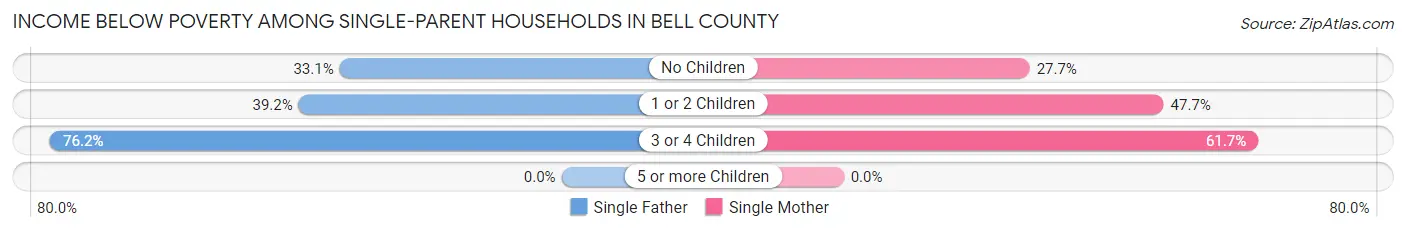
| Children | Single Father | Single Mother |
| No Children | 129 (33.1%) | 242 (27.7%) |
| 1 or 2 Children | 96 (39.2%) | 318 (47.7%) |
| 3 or 4 Children | 16 (76.2%) | 71 (61.7%) |
| 5 or more Children | 0 (0.0%) | 0 (0.0%) |
| Total | 241 (36.7%) | 631 (38.1%) |
Income Below Poverty Among Married-Couple vs Single-Parent Households in Bell County
The poverty data for Bell County shows that 476 of the married-couple family households (12.0%) and 872 of the single-parent households (37.7%) are living below the poverty level. Within the married-couple family households, those with 3 or 4 children have the highest poverty rate, with 74 households (27.9%) falling below the poverty line. Among the single-parent households, those with 3 or 4 children have the highest poverty rate, with 87 household (64.0%) living below poverty.
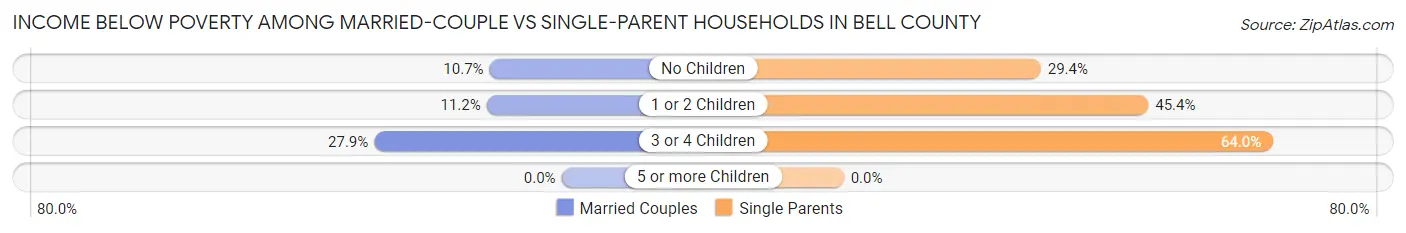
| Children | Married-Couple Families | Single-Parent Households |
| No Children | 255 (10.7%) | 371 (29.4%) |
| 1 or 2 Children | 147 (11.2%) | 414 (45.4%) |
| 3 or 4 Children | 74 (27.9%) | 87 (64.0%) |
| 5 or more Children | 0 (0.0%) | 0 (0.0%) |
| Total | 476 (12.0%) | 872 (37.7%) |
Race in Bell County
The most populous races in Bell County are White / Caucasian (22,897 | 94.4%), Two or more Races (757 | 3.1%), and Black / African American (469 | 1.9%).
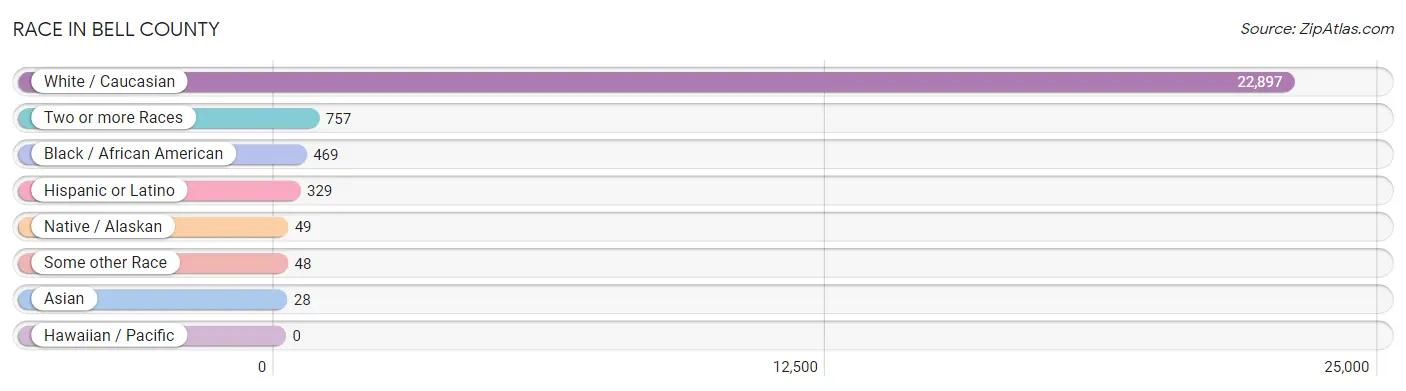
| Race | # Population | % Population |
| Asian | 28 | 0.1% |
| Black / African American | 469 | 1.9% |
| Hawaiian / Pacific | 0 | 0.0% |
| Hispanic or Latino | 329 | 1.4% |
| Native / Alaskan | 49 | 0.2% |
| White / Caucasian | 22,897 | 94.4% |
| Two or more Races | 757 | 3.1% |
| Some other Race | 48 | 0.2% |
| Total | 24,248 | 100.0% |
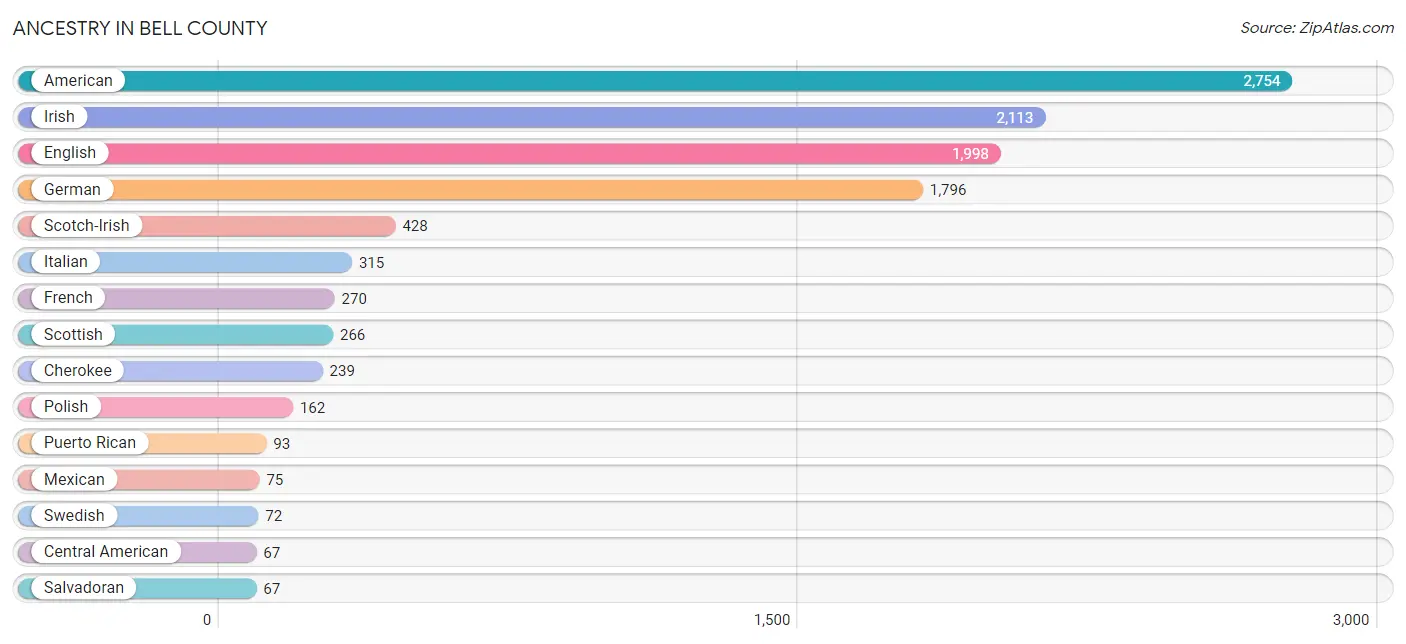
Ancestry in Bell County
The most populous ancestries reported in Bell County are American (2,754 | 11.4%), Irish (2,113 | 8.7%), English (1,998 | 8.2%), German (1,796 | 7.4%), and Scotch-Irish (428 | 1.8%), together accounting for 37.5% of all Bell County residents.
| Ancestry | # Population | % Population |
| African | 6 | 0.0% |
| American | 2,754 | 11.4% |
| Blackfeet | 9 | 0.0% |
| British | 37 | 0.2% |
| Burmese | 5 | 0.0% |
| Canadian | 1 | 0.0% |
| Central American | 67 | 0.3% |
| Cherokee | 239 | 1.0% |
| Cuban | 13 | 0.1% |
| Danish | 15 | 0.1% |
| Dutch | 60 | 0.3% |
| Eastern European | 1 | 0.0% |
| English | 1,998 | 8.2% |
| European | 49 | 0.2% |
| French | 270 | 1.1% |
| German | 1,796 | 7.4% |
| Greek | 3 | 0.0% |
| Irish | 2,113 | 8.7% |
| Italian | 315 | 1.3% |
| Korean | 23 | 0.1% |
| Mexican | 75 | 0.3% |
| Northern European | 2 | 0.0% |
| Norwegian | 29 | 0.1% |
| Polish | 162 | 0.7% |
| Portuguese | 1 | 0.0% |
| Puerto Rican | 93 | 0.4% |
| Russian | 8 | 0.0% |
| Salvadoran | 67 | 0.3% |
| Scandinavian | 16 | 0.1% |
| Scotch-Irish | 428 | 1.8% |
| Scottish | 266 | 1.1% |
| Subsaharan African | 16 | 0.1% |
| Swedish | 72 | 0.3% |
| Swiss | 15 | 0.1% |
| Ukrainian | 12 | 0.1% |
| Welsh | 55 | 0.2% | View All 36 Rows |
Immigrants in Bell County
The most numerous immigrant groups reported in Bell County came from Asia (23 | 0.1%), Philippines (23 | 0.1%), South Eastern Asia (23 | 0.1%), Caribbean (13 | 0.1%), and Cuba (13 | 0.1%), together accounting for 0.4% of all Bell County residents.
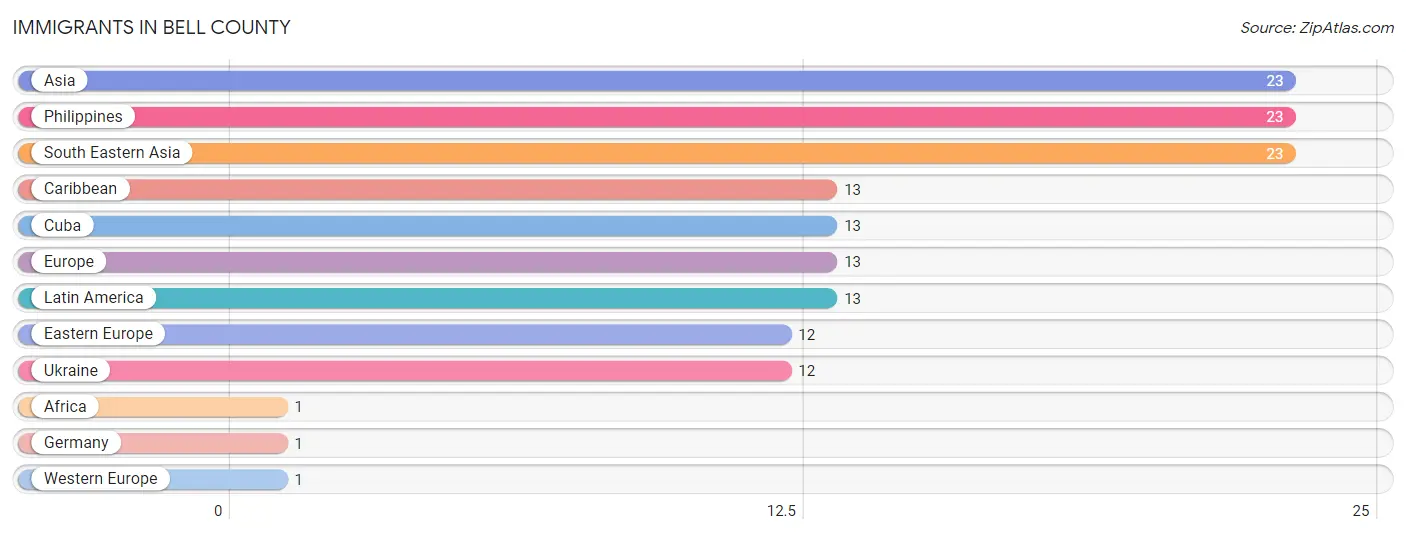
| Immigration Origin | # Population | % Population |
| Africa | 1 | 0.0% |
| Asia | 23 | 0.1% |
| Caribbean | 13 | 0.1% |
| Cuba | 13 | 0.1% |
| Eastern Europe | 12 | 0.1% |
| Europe | 13 | 0.1% |
| Germany | 1 | 0.0% |
| Latin America | 13 | 0.1% |
| Philippines | 23 | 0.1% |
| South Eastern Asia | 23 | 0.1% |
| Ukraine | 12 | 0.1% |
| Western Europe | 1 | 0.0% | View All 12 Rows |
Sex and Age in Bell County
Sex and Age in Bell County
The most populous age groups in Bell County are 55 to 59 Years (913 | 7.5%) for men and 55 to 59 Years (1,042 | 8.6%) for women.
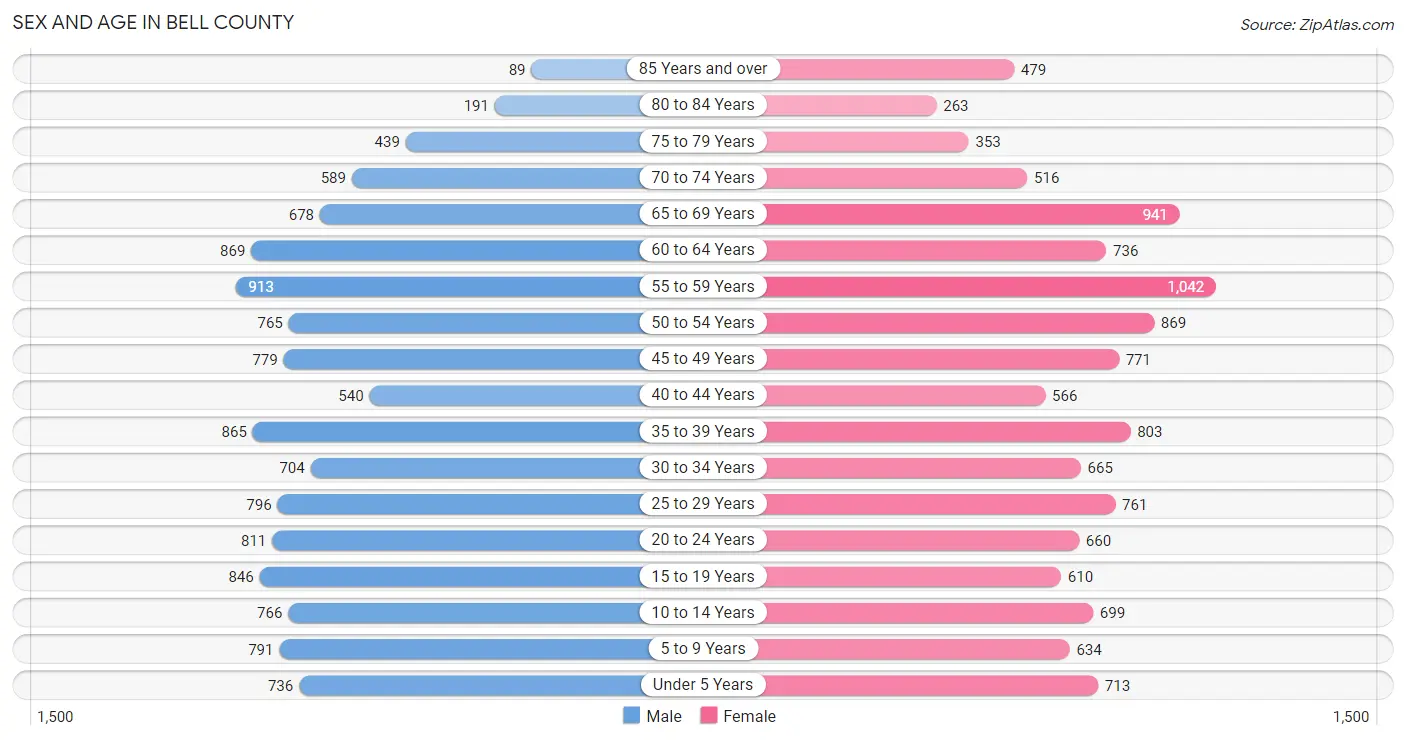
| Age Bracket | Male | Female |
| Under 5 Years | 736 (6.0%) | 713 (5.9%) |
| 5 to 9 Years | 791 (6.5%) | 634 (5.2%) |
| 10 to 14 Years | 766 (6.3%) | 699 (5.8%) |
| 15 to 19 Years | 846 (7.0%) | 610 (5.1%) |
| 20 to 24 Years | 811 (6.7%) | 660 (5.5%) |
| 25 to 29 Years | 796 (6.5%) | 761 (6.3%) |
| 30 to 34 Years | 704 (5.8%) | 665 (5.5%) |
| 35 to 39 Years | 865 (7.1%) | 803 (6.7%) |
| 40 to 44 Years | 540 (4.4%) | 566 (4.7%) |
| 45 to 49 Years | 779 (6.4%) | 771 (6.4%) |
| 50 to 54 Years | 765 (6.3%) | 869 (7.2%) |
| 55 to 59 Years | 913 (7.5%) | 1,042 (8.6%) |
| 60 to 64 Years | 869 (7.1%) | 736 (6.1%) |
| 65 to 69 Years | 678 (5.6%) | 941 (7.8%) |
| 70 to 74 Years | 589 (4.8%) | 516 (4.3%) |
| 75 to 79 Years | 439 (3.6%) | 353 (2.9%) |
| 80 to 84 Years | 191 (1.6%) | 263 (2.2%) |
| 85 Years and over | 89 (0.7%) | 479 (4.0%) |
| Total | 12,167 (100.0%) | 12,081 (100.0%) |
Families and Households in Bell County
Median Family Size in Bell County
The median family size in Bell County is 3.09 persons per family, with married-couple families (3,957 | 63.1%) accounting for the largest median family size of 3.16 persons per family. On the other hand, single female/mother families (1,655 | 26.4%) represent the smallest median family size with 2.92 persons per family.
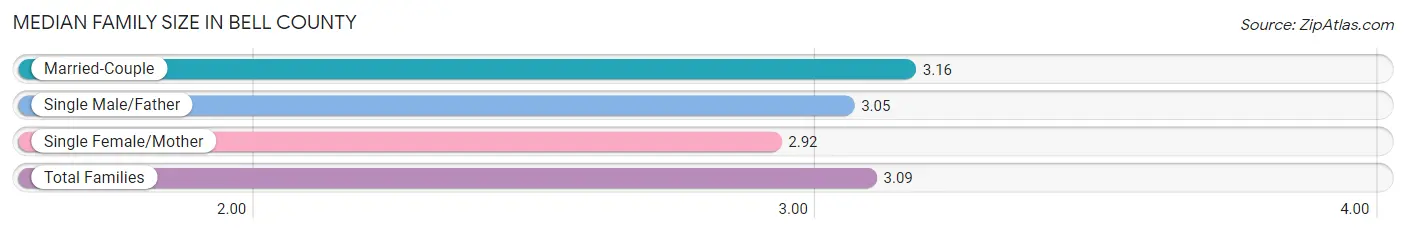
| Family Type | # Families | Family Size |
| Married-Couple | 3,957 (63.1%) | 3.16 |
| Single Male/Father | 656 (10.5%) | 3.05 |
| Single Female/Mother | 1,655 (26.4%) | 2.92 |
| Total Families | 6,268 (100.0%) | 3.09 |
Median Household Size in Bell County
The median household size in Bell County is 2.49 persons per household, with single male/father households (656 | 6.9%) accounting for the largest median household size of 3.21 persons per household. non-family households (3,188 | 33.7%) represent the smallest median household size with 1.20 persons per household.
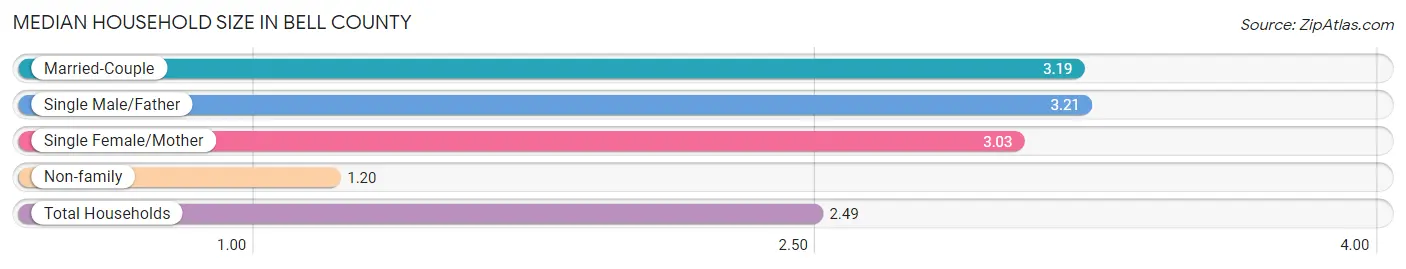
| Household Type | # Households | Household Size |
| Married-Couple | 3,957 (41.8%) | 3.19 |
| Single Male/Father | 656 (6.9%) | 3.21 |
| Single Female/Mother | 1,655 (17.5%) | 3.03 |
| Non-family | 3,188 (33.7%) | 1.20 |
| Total Households | 9,456 (100.0%) | 2.49 |
Household Size by Marriage Status in Bell County
Out of a total of 9,456 households in Bell County, 6,268 (66.3%) are family households, while 3,188 (33.7%) are nonfamily households. The most numerous type of family households are 2-person households, comprising 3,317, and the most common type of nonfamily households are 1-person households, comprising 2,842.
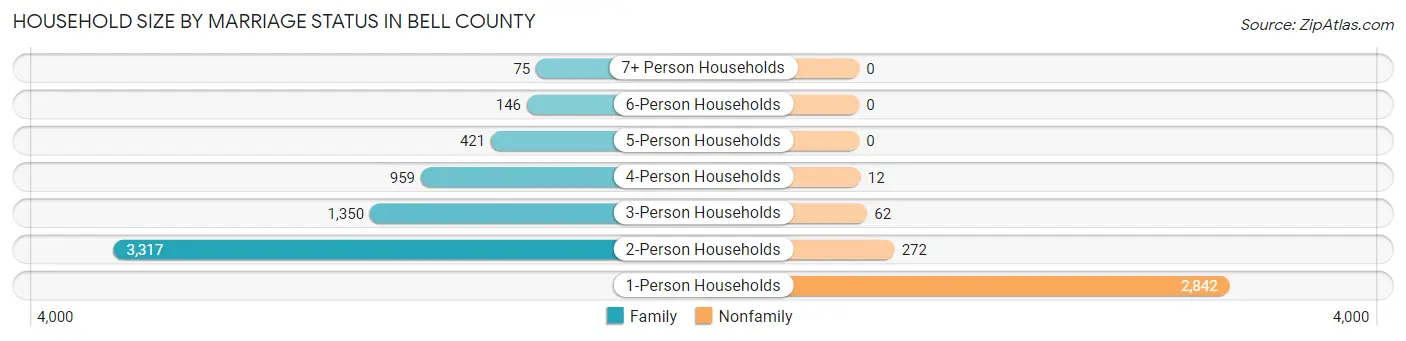
| Household Size | Family Households | Nonfamily Households |
| 1-Person Households | - | 2,842 (30.0%) |
| 2-Person Households | 3,317 (35.1%) | 272 (2.9%) |
| 3-Person Households | 1,350 (14.3%) | 62 (0.7%) |
| 4-Person Households | 959 (10.1%) | 12 (0.1%) |
| 5-Person Households | 421 (4.4%) | 0 (0.0%) |
| 6-Person Households | 146 (1.5%) | 0 (0.0%) |
| 7+ Person Households | 75 (0.8%) | 0 (0.0%) |
| Total | 6,268 (66.3%) | 3,188 (33.7%) |
Female Fertility in Bell County
Fertility by Age in Bell County
Average fertility rate in Bell County is 42.0 births per 1,000 women. Women in the age bracket of 20 to 34 years have the highest fertility rate with 90.0 births per 1,000 women. Women in the age bracket of 20 to 34 years acount for 90.4% of all women with births.
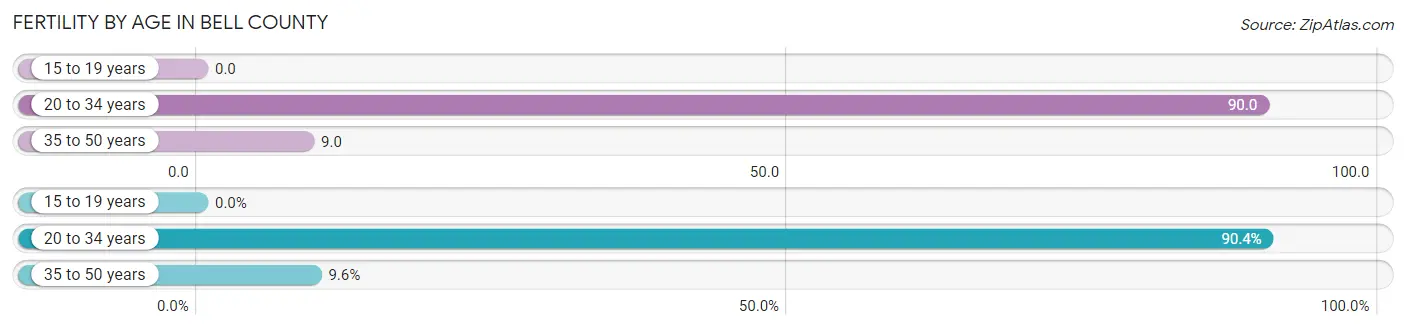
| Age Bracket | Women with Births | Births / 1,000 Women |
| 15 to 19 years | 0 (0.0%) | 0.0 |
| 20 to 34 years | 188 (90.4%) | 90.0 |
| 35 to 50 years | 20 (9.6%) | 9.0 |
| Total | 208 (100.0%) | 42.0 |
Fertility by Age by Marriage Status in Bell County
71.6% of women with births (208) in Bell County are married. The highest percentage of unmarried women with births falls into 35 to 50 years age bracket with 85.0% of them unmarried at the time of birth, while the lowest percentage of unmarried women with births belong to 20 to 34 years age bracket with 22.3% of them unmarried.
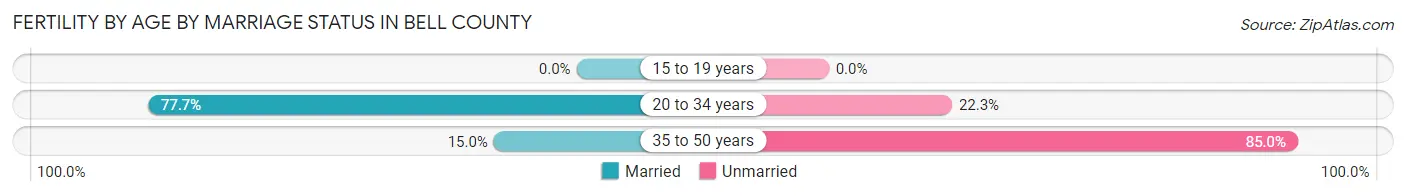
| Age Bracket | Married | Unmarried |
| 15 to 19 years | 0 (0.0%) | 0 (0.0%) |
| 20 to 34 years | 146 (77.7%) | 42 (22.3%) |
| 35 to 50 years | 3 (15.0%) | 17 (85.0%) |
| Total | 149 (71.6%) | 59 (28.4%) |
Fertility by Education in Bell County
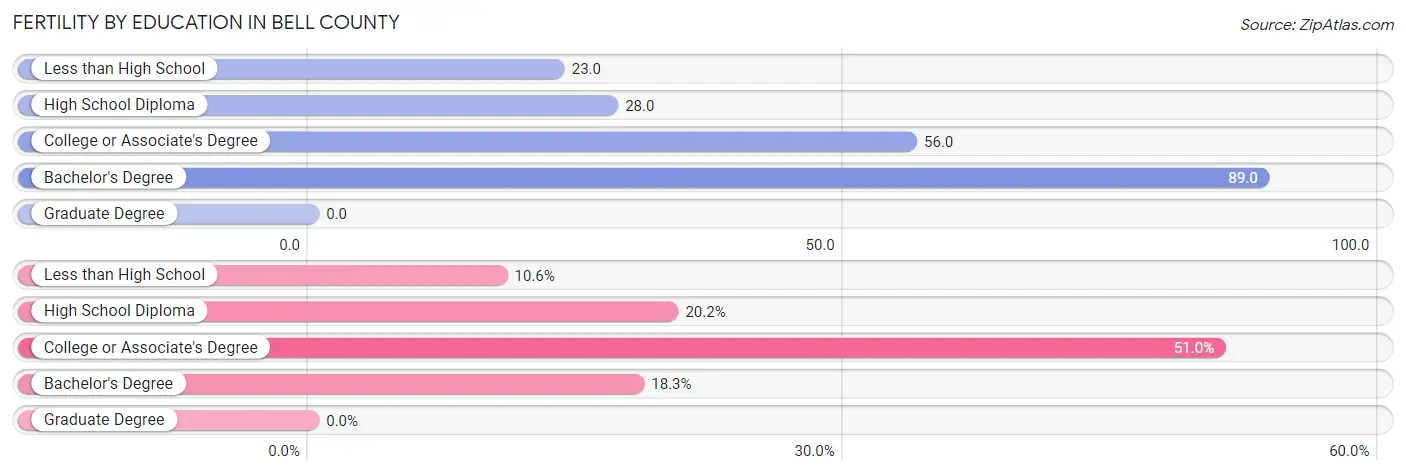
| Educational Attainment | Women with Births | Births / 1,000 Women |
| Less than High School | 22 (10.6%) | 23.0 |
| High School Diploma | 42 (20.2%) | 28.0 |
| College or Associate's Degree | 106 (51.0%) | 56.0 |
| Bachelor's Degree | 38 (18.3%) | 89.0 |
| Graduate Degree | 0 (0.0%) | 0.0 |
| Total | 208 (100.0%) | 42.0 |
Fertility by Education by Marriage Status in Bell County
28.4% of women with births in Bell County are unmarried. Women with the educational attainment of bachelor's degree are most likely to be married with 100.0% of them married at childbirth, while women with the educational attainment of high school diploma are least likely to be married with 92.9% of them unmarried at childbirth.
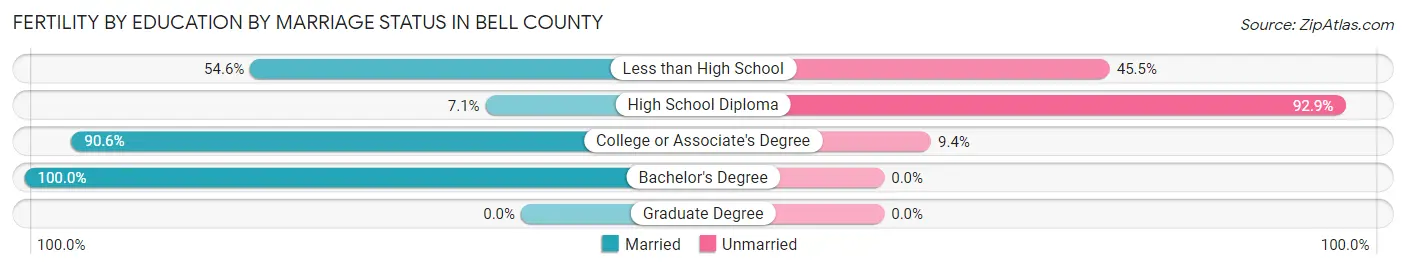
| Educational Attainment | Married | Unmarried |
| Less than High School | 12 (54.5%) | 10 (45.5%) |
| High School Diploma | 3 (7.1%) | 39 (92.9%) |
| College or Associate's Degree | 96 (90.6%) | 10 (9.4%) |
| Bachelor's Degree | 38 (100.0%) | 0 (0.0%) |
| Graduate Degree | 0 (0.0%) | 0 (0.0%) |
| Total | 149 (71.6%) | 59 (28.4%) |
Employment Characteristics in Bell County
Employment by Class of Employer in Bell County
Among the 6,848 employed individuals in Bell County, private company employees (4,346 | 63.5%), local government employees (738 | 10.8%), and not-for-profit organizations (651 | 9.5%) make up the most common classes of employment.
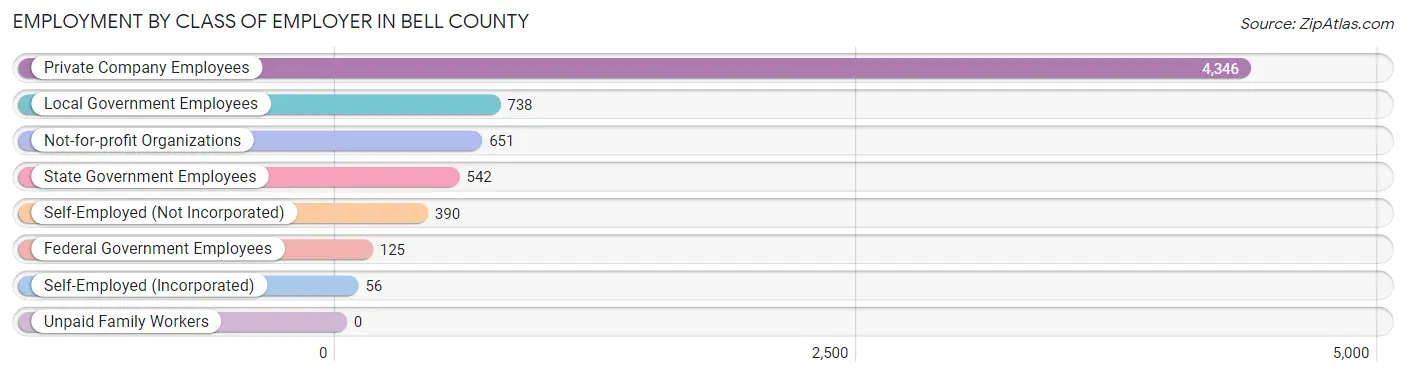
| Employer Class | # Employees | % Employees |
| Private Company Employees | 4,346 | 63.5% |
| Self-Employed (Incorporated) | 56 | 0.8% |
| Self-Employed (Not Incorporated) | 390 | 5.7% |
| Not-for-profit Organizations | 651 | 9.5% |
| Local Government Employees | 738 | 10.8% |
| State Government Employees | 542 | 7.9% |
| Federal Government Employees | 125 | 1.8% |
| Unpaid Family Workers | 0 | 0.0% |
| Total | 6,848 | 100.0% |
Employment Status by Age in Bell County
According to the labor force statistics for Bell County, out of the total population over 16 years of age (19,663), 40.9% or 8,042 individuals are in the labor force, with 10.0% or 804 of them unemployed. The age group with the highest labor force participation rate is 25 to 29 years, with 69.4% or 1,081 individuals in the labor force. Within the labor force, the 16 to 19 years age range has the highest percentage of unemployed individuals, with 22.7% or 68 of them being unemployed.
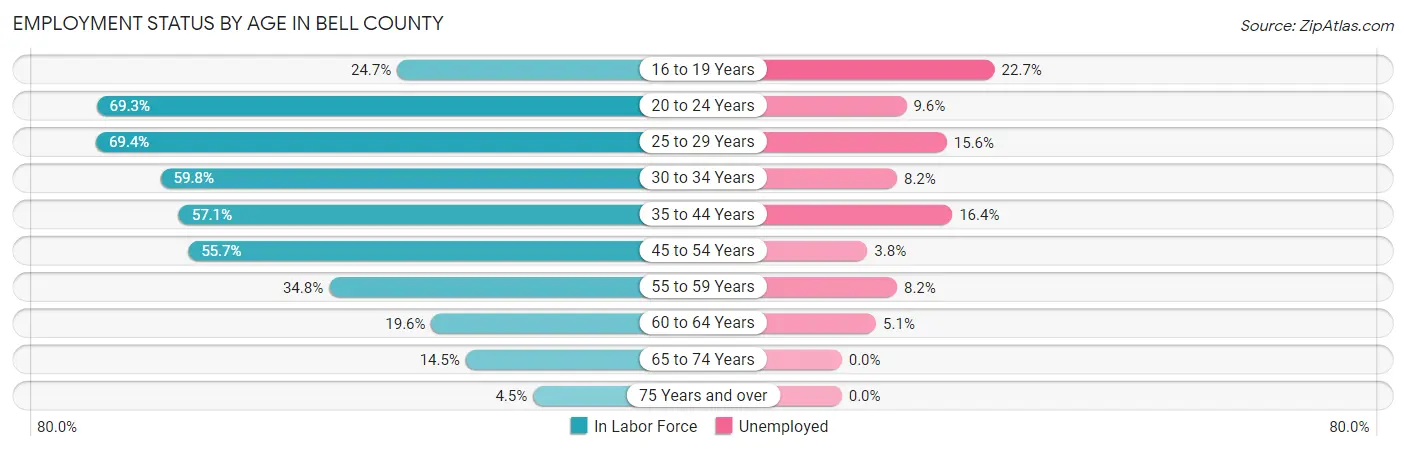
| Age Bracket | In Labor Force | Unemployed |
| 16 to 19 Years | 299 (24.7%) | 68 (22.7%) |
| 20 to 24 Years | 1,019 (69.3%) | 98 (9.6%) |
| 25 to 29 Years | 1,081 (69.4%) | 169 (15.6%) |
| 30 to 34 Years | 819 (59.8%) | 67 (8.2%) |
| 35 to 44 Years | 1,584 (57.1%) | 260 (16.4%) |
| 45 to 54 Years | 1,773 (55.7%) | 67 (3.8%) |
| 55 to 59 Years | 680 (34.8%) | 56 (8.2%) |
| 60 to 64 Years | 315 (19.6%) | 16 (5.1%) |
| 65 to 74 Years | 395 (14.5%) | 0 (0.0%) |
| 75 Years and over | 82 (4.5%) | 0 (0.0%) |
| Total | 8,042 (40.9%) | 804 (10.0%) |
Employment Status by Educational Attainment in Bell County
According to labor force statistics for Bell County, 50.2% of individuals (6,247) out of the total population between 25 and 64 years of age (12,444) are in the labor force, with 10.2% or 637 of them being unemployed. The group with the highest labor force participation rate are those with the educational attainment of bachelor's degree or higher, with 76.4% or 992 individuals in the labor force. Within the labor force, individuals with less than high school education have the highest percentage of unemployment, with 14.8% or 96 of them being unemployed.
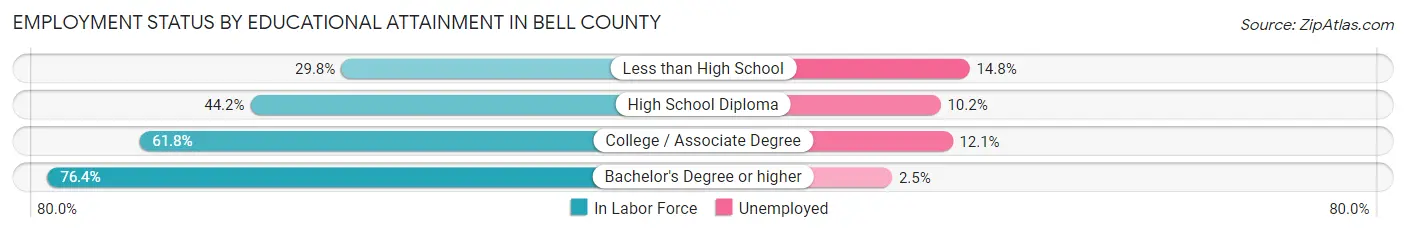
| Educational Attainment | In Labor Force | Unemployed |
| Less than High School | 649 (29.8%) | 322 (14.8%) |
| High School Diploma | 2,343 (44.2%) | 541 (10.2%) |
| College / Associate Degree | 2,266 (61.8%) | 444 (12.1%) |
| Bachelor's Degree or higher | 992 (76.4%) | 32 (2.5%) |
| Total | 6,247 (50.2%) | 1,269 (10.2%) |
Employment Occupations by Sex in Bell County
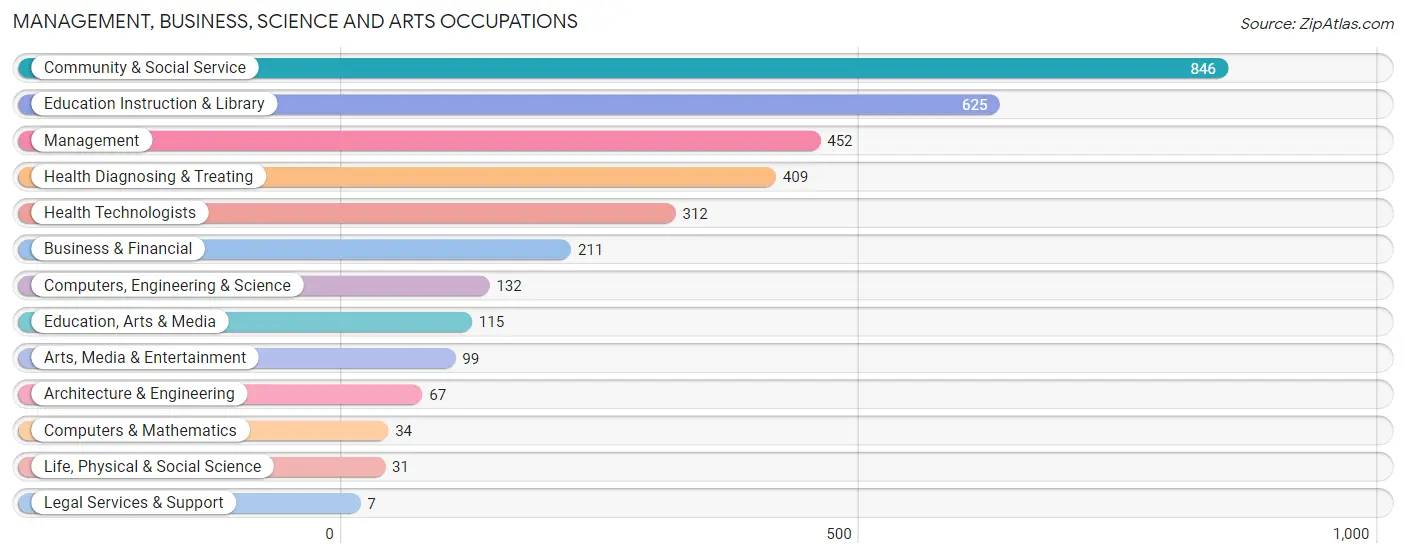
Management, Business, Science and Arts Occupations
The most common Management, Business, Science and Arts occupations in Bell County are Community & Social Service (846 | 11.7%), Education Instruction & Library (625 | 8.6%), Management (452 | 6.2%), Health Diagnosing & Treating (409 | 5.6%), and Health Technologists (312 | 4.3%).
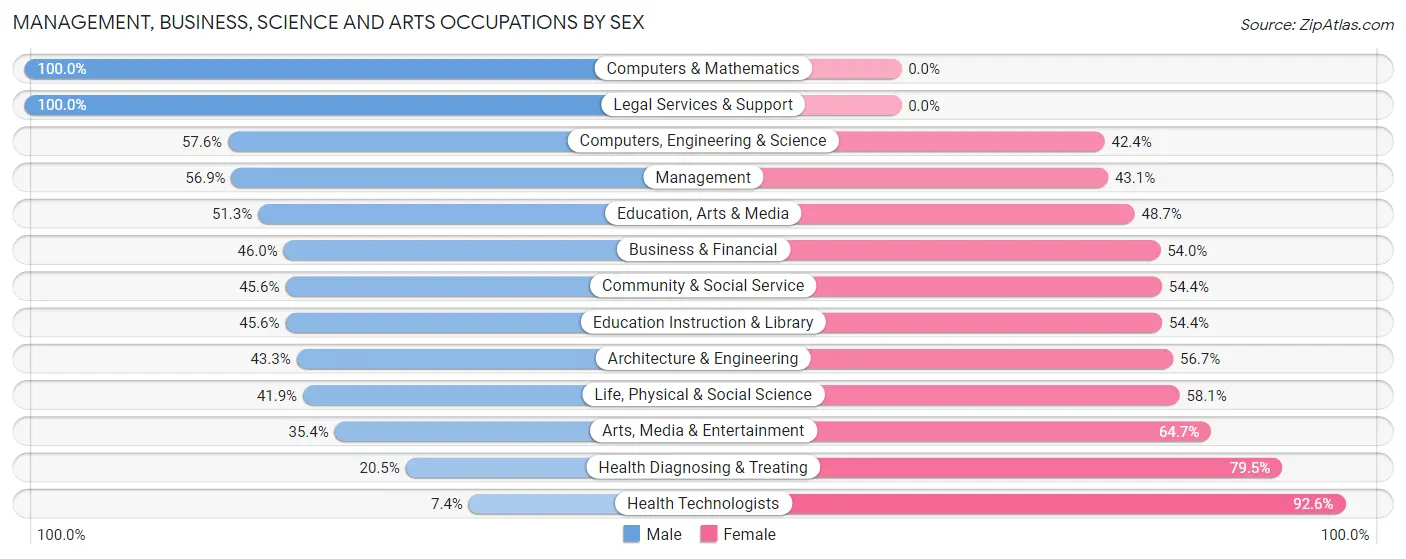
Management, Business, Science and Arts Occupations by Sex
Within the Management, Business, Science and Arts occupations in Bell County, the most male-oriented occupations are Computers & Mathematics (100.0%), Legal Services & Support (100.0%), and Computers, Engineering & Science (57.6%), while the most female-oriented occupations are Health Technologists (92.6%), Health Diagnosing & Treating (79.5%), and Arts, Media & Entertainment (64.6%).
| Occupation | Male | Female |
| Management | 257 (56.9%) | 195 (43.1%) |
| Business & Financial | 97 (46.0%) | 114 (54.0%) |
| Computers, Engineering & Science | 76 (57.6%) | 56 (42.4%) |
| Computers & Mathematics | 34 (100.0%) | 0 (0.0%) |
| Architecture & Engineering | 29 (43.3%) | 38 (56.7%) |
| Life, Physical & Social Science | 13 (41.9%) | 18 (58.1%) |
| Community & Social Service | 386 (45.6%) | 460 (54.4%) |
| Education, Arts & Media | 59 (51.3%) | 56 (48.7%) |
| Legal Services & Support | 7 (100.0%) | 0 (0.0%) |
| Education Instruction & Library | 285 (45.6%) | 340 (54.4%) |
| Arts, Media & Entertainment | 35 (35.3%) | 64 (64.6%) |
| Health Diagnosing & Treating | 84 (20.5%) | 325 (79.5%) |
| Health Technologists | 23 (7.4%) | 289 (92.6%) |
| Total (Category) | 900 (43.9%) | 1,150 (56.1%) |
| Total (Overall) | 3,623 (50.0%) | 3,623 (50.0%) |
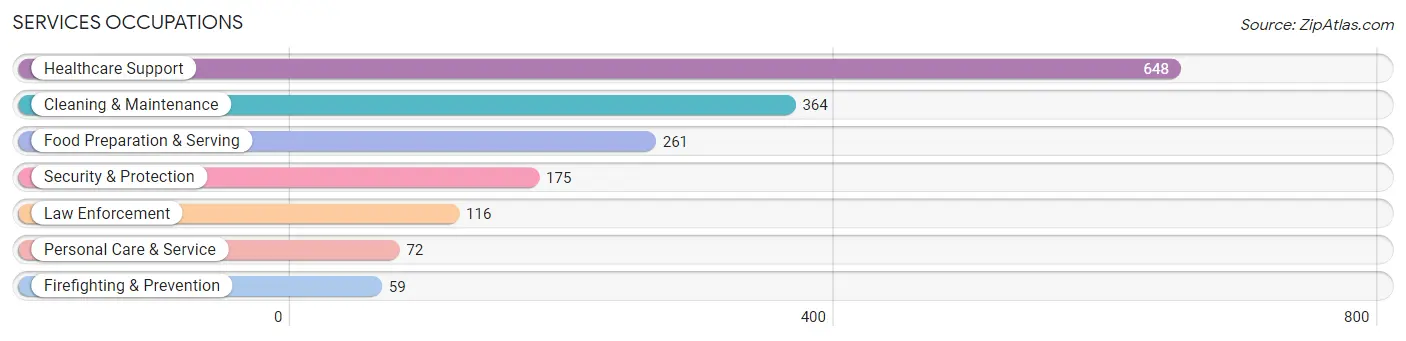
Services Occupations
The most common Services occupations in Bell County are Healthcare Support (648 | 8.9%), Cleaning & Maintenance (364 | 5.0%), Food Preparation & Serving (261 | 3.6%), Security & Protection (175 | 2.4%), and Law Enforcement (116 | 1.6%).
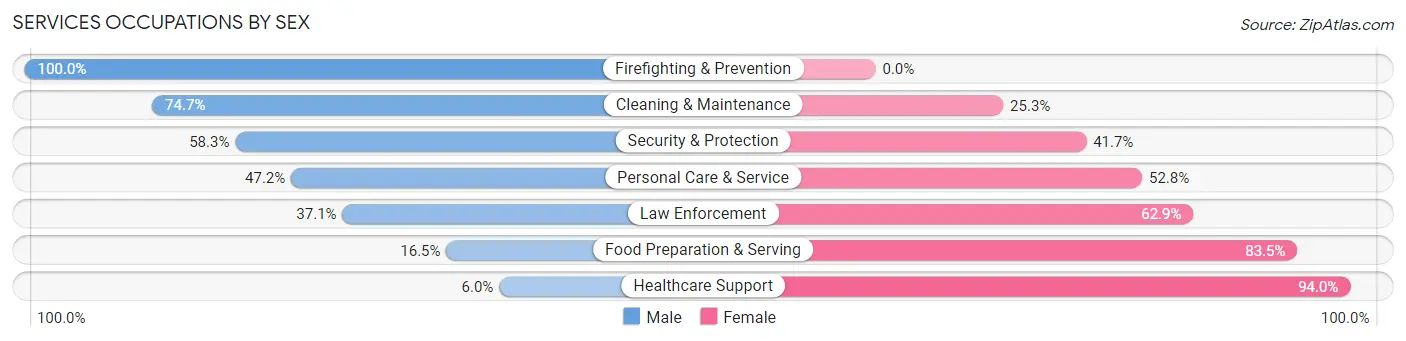
Services Occupations by Sex
Within the Services occupations in Bell County, the most male-oriented occupations are Firefighting & Prevention (100.0%), Cleaning & Maintenance (74.7%), and Security & Protection (58.3%), while the most female-oriented occupations are Healthcare Support (94.0%), Food Preparation & Serving (83.5%), and Law Enforcement (62.9%).
| Occupation | Male | Female |
| Healthcare Support | 39 (6.0%) | 609 (94.0%) |
| Security & Protection | 102 (58.3%) | 73 (41.7%) |
| Firefighting & Prevention | 59 (100.0%) | 0 (0.0%) |
| Law Enforcement | 43 (37.1%) | 73 (62.9%) |
| Food Preparation & Serving | 43 (16.5%) | 218 (83.5%) |
| Cleaning & Maintenance | 272 (74.7%) | 92 (25.3%) |
| Personal Care & Service | 34 (47.2%) | 38 (52.8%) |
| Total (Category) | 490 (32.2%) | 1,030 (67.8%) |
| Total (Overall) | 3,623 (50.0%) | 3,623 (50.0%) |
Sales and Office Occupations
The most common Sales and Office occupations in Bell County are Sales & Related (761 | 10.5%), and Office & Administration (739 | 10.2%).

Sales and Office Occupations by Sex

| Occupation | Male | Female |
| Sales & Related | 320 (42.0%) | 441 (58.0%) |
| Office & Administration | 60 (8.1%) | 679 (91.9%) |
| Total (Category) | 380 (25.3%) | 1,120 (74.7%) |
| Total (Overall) | 3,623 (50.0%) | 3,623 (50.0%) |
Natural Resources, Construction and Maintenance Occupations
The most common Natural Resources, Construction and Maintenance occupations in Bell County are Construction & Extraction (392 | 5.4%), Installation, Maintenance & Repair (139 | 1.9%), and Farming, Fishing & Forestry (34 | 0.5%).
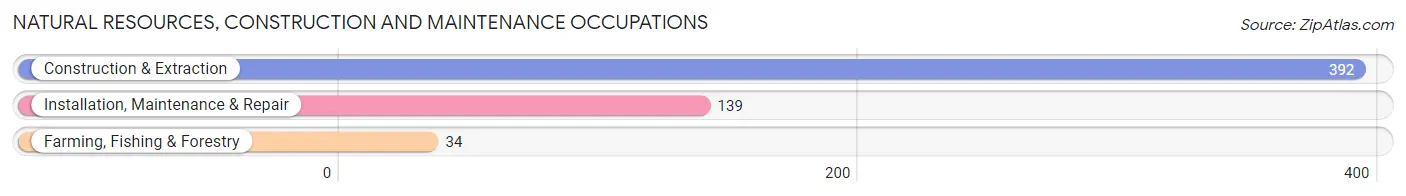
Natural Resources, Construction and Maintenance Occupations by Sex

| Occupation | Male | Female |
| Farming, Fishing & Forestry | 34 (100.0%) | 0 (0.0%) |
| Construction & Extraction | 392 (100.0%) | 0 (0.0%) |
| Installation, Maintenance & Repair | 139 (100.0%) | 0 (0.0%) |
| Total (Category) | 565 (100.0%) | 0 (0.0%) |
| Total (Overall) | 3,623 (50.0%) | 3,623 (50.0%) |
Production, Transportation and Moving Occupations
The most common Production, Transportation and Moving occupations in Bell County are Production (644 | 8.9%), Material Moving (556 | 7.7%), and Transportation (411 | 5.7%).
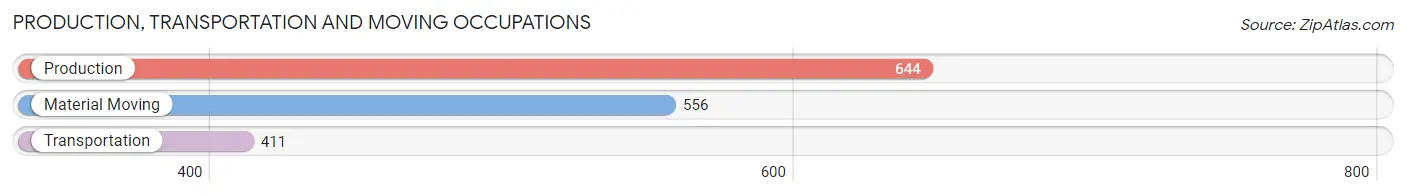
Production, Transportation and Moving Occupations by Sex
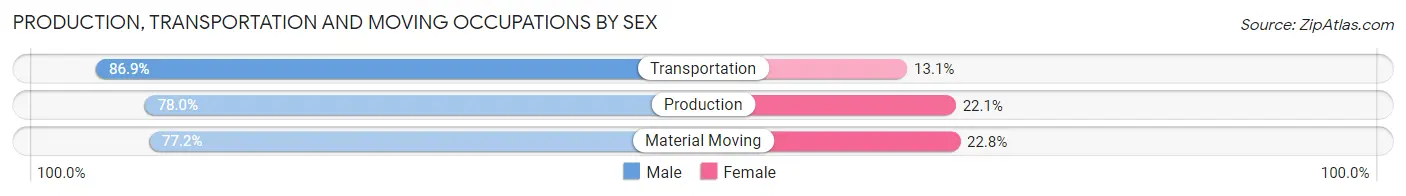
| Occupation | Male | Female |
| Production | 502 (77.9%) | 142 (22.1%) |
| Transportation | 357 (86.9%) | 54 (13.1%) |
| Material Moving | 429 (77.2%) | 127 (22.8%) |
| Total (Category) | 1,288 (79.9%) | 323 (20.1%) |
| Total (Overall) | 3,623 (50.0%) | 3,623 (50.0%) |
Employment Industries by Sex in Bell County
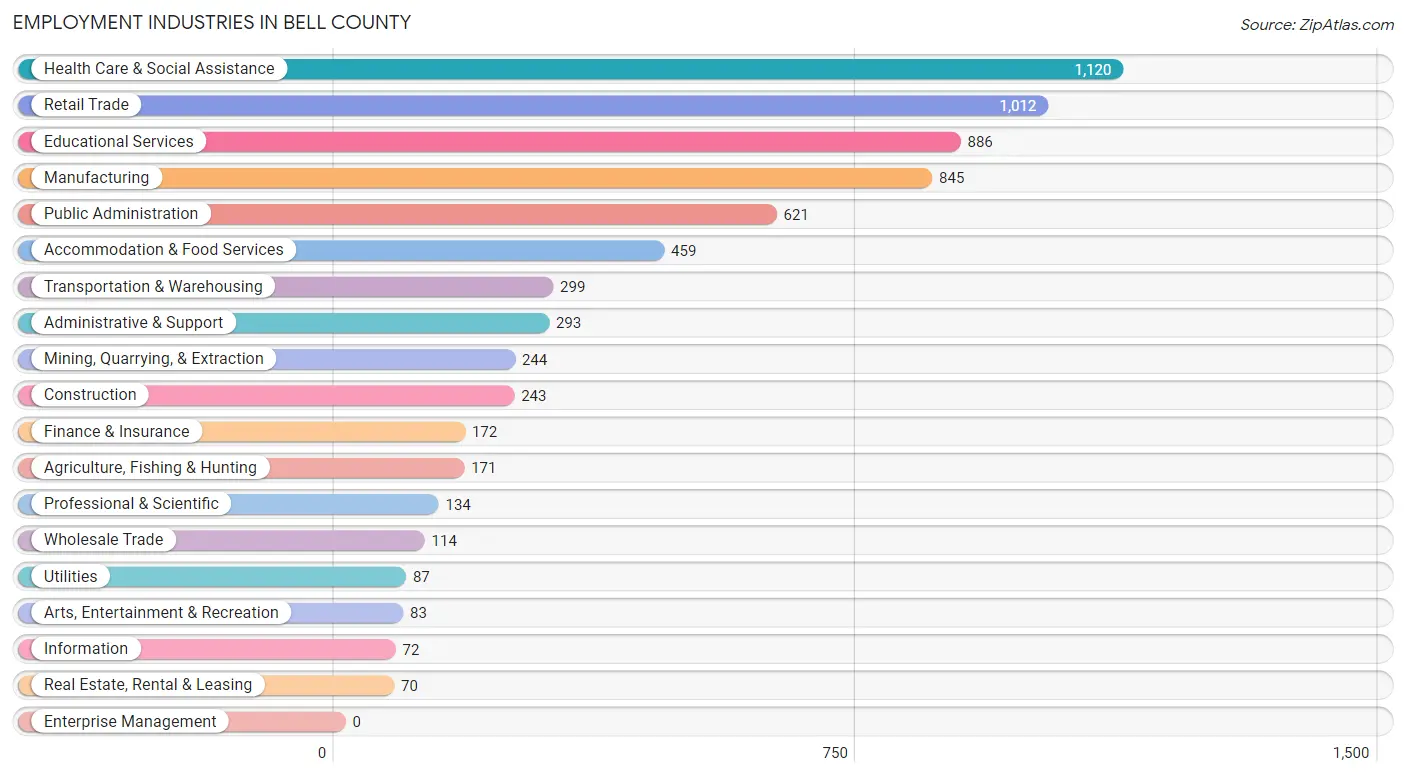
Employment Industries in Bell County
The major employment industries in Bell County include Health Care & Social Assistance (1,120 | 15.5%), Retail Trade (1,012 | 14.0%), Educational Services (886 | 12.2%), Manufacturing (845 | 11.7%), and Public Administration (621 | 8.6%).
Employment Industries by Sex in Bell County
The Bell County industries that see more men than women are Wholesale Trade (100.0%), Construction (90.9%), and Transportation & Warehousing (87.6%), whereas the industries that tend to have a higher number of women are Health Care & Social Assistance (87.7%), Public Administration (75.7%), and Accommodation & Food Services (74.5%).
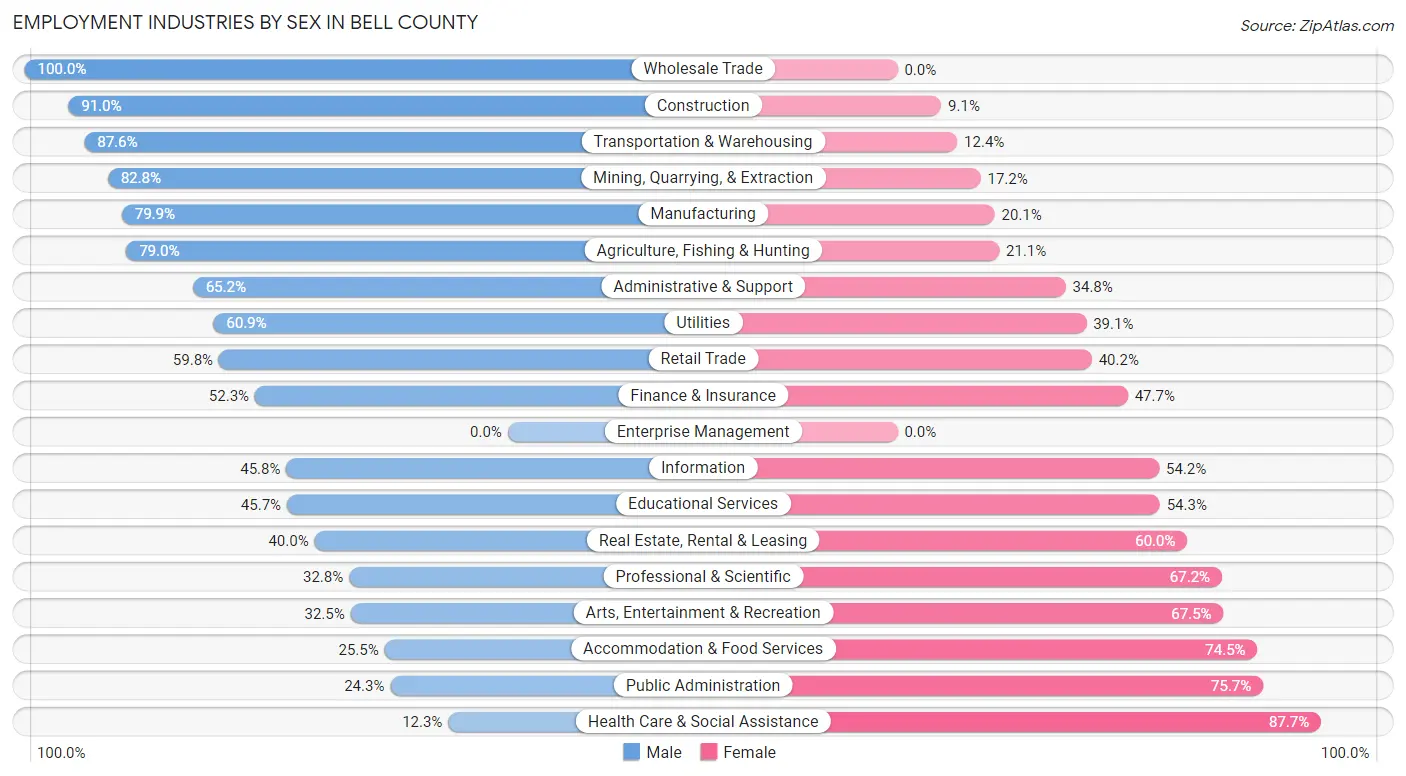
| Industry | Male | Female |
| Agriculture, Fishing & Hunting | 135 (78.9%) | 36 (21.0%) |
| Mining, Quarrying, & Extraction | 202 (82.8%) | 42 (17.2%) |
| Construction | 221 (90.9%) | 22 (9.0%) |
| Manufacturing | 675 (79.9%) | 170 (20.1%) |
| Wholesale Trade | 114 (100.0%) | 0 (0.0%) |
| Retail Trade | 605 (59.8%) | 407 (40.2%) |
| Transportation & Warehousing | 262 (87.6%) | 37 (12.4%) |
| Utilities | 53 (60.9%) | 34 (39.1%) |
| Information | 33 (45.8%) | 39 (54.2%) |
| Finance & Insurance | 90 (52.3%) | 82 (47.7%) |
| Real Estate, Rental & Leasing | 28 (40.0%) | 42 (60.0%) |
| Professional & Scientific | 44 (32.8%) | 90 (67.2%) |
| Enterprise Management | 0 (0.0%) | 0 (0.0%) |
| Administrative & Support | 191 (65.2%) | 102 (34.8%) |
| Educational Services | 405 (45.7%) | 481 (54.3%) |
| Health Care & Social Assistance | 138 (12.3%) | 982 (87.7%) |
| Arts, Entertainment & Recreation | 27 (32.5%) | 56 (67.5%) |
| Accommodation & Food Services | 117 (25.5%) | 342 (74.5%) |
| Public Administration | 151 (24.3%) | 470 (75.7%) |
| Total | 3,623 (50.0%) | 3,623 (50.0%) |
Education in Bell County
School Enrollment in Bell County
The most common levels of schooling among the 4,980 students in Bell County are high school (1,274 | 25.6%), middle school (1,157 | 23.2%), and elementary school (1,084 | 21.8%).
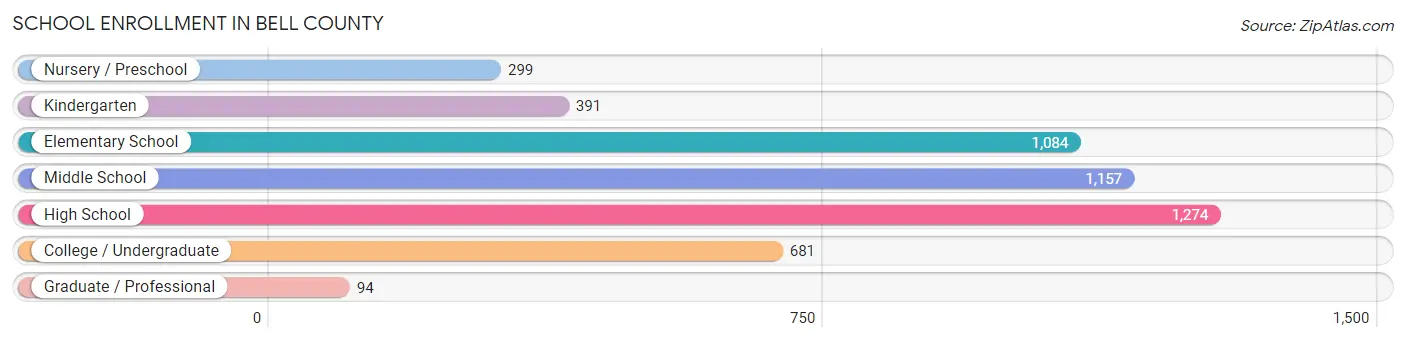
| School Level | # Students | % Students |
| Nursery / Preschool | 299 | 6.0% |
| Kindergarten | 391 | 7.9% |
| Elementary School | 1,084 | 21.8% |
| Middle School | 1,157 | 23.2% |
| High School | 1,274 | 25.6% |
| College / Undergraduate | 681 | 13.7% |
| Graduate / Professional | 94 | 1.9% |
| Total | 4,980 | 100.0% |
School Enrollment by Age by Funding Source in Bell County
Out of a total of 4,980 students who are enrolled in schools in Bell County, 443 (8.9%) attend a private institution, while the remaining 4,537 (91.1%) are enrolled in public schools. The age group of 25 to 34 year olds has the highest likelihood of being enrolled in private schools, with 53 (14.0% in the age bracket) enrolled. Conversely, the age group of 15 to 17 year olds has the lowest likelihood of being enrolled in a private school, with 864 (97.3% in the age bracket) attending a public institution.
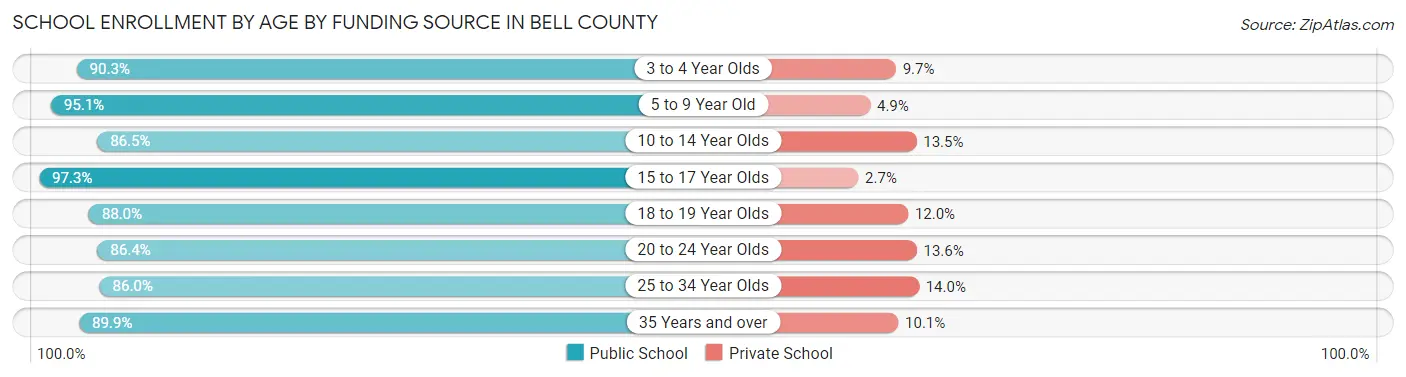
| Age Bracket | Public School | Private School |
| 3 to 4 Year Olds | 149 (90.3%) | 16 (9.7%) |
| 5 to 9 Year Old | 1,278 (95.1%) | 66 (4.9%) |
| 10 to 14 Year Olds | 1,259 (86.5%) | 197 (13.5%) |
| 15 to 17 Year Olds | 864 (97.3%) | 24 (2.7%) |
| 18 to 19 Year Olds | 353 (88.0%) | 48 (12.0%) |
| 20 to 24 Year Olds | 121 (86.4%) | 19 (13.6%) |
| 25 to 34 Year Olds | 326 (86.0%) | 53 (14.0%) |
| 35 Years and over | 186 (89.9%) | 21 (10.1%) |
| Total | 4,537 (91.1%) | 443 (8.9%) |
Educational Attainment by Field of Study in Bell County
Education (568 | 27.7%), business (414 | 20.2%), science & technology (247 | 12.1%), arts & humanities (240 | 11.7%), and bio, nature & agricultural (148 | 7.2%) are the most common fields of study among 2,048 individuals in Bell County who have obtained a bachelor's degree or higher.
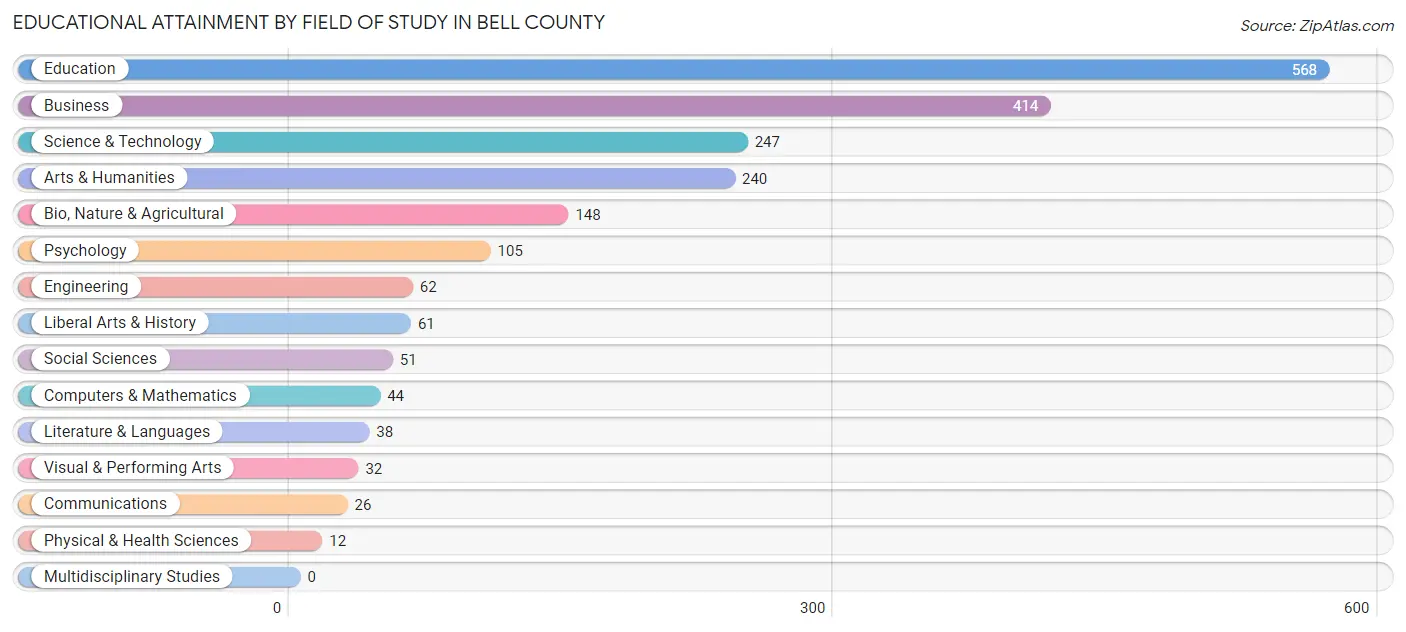
| Field of Study | # Graduates | % Graduates |
| Computers & Mathematics | 44 | 2.1% |
| Bio, Nature & Agricultural | 148 | 7.2% |
| Physical & Health Sciences | 12 | 0.6% |
| Psychology | 105 | 5.1% |
| Social Sciences | 51 | 2.5% |
| Engineering | 62 | 3.0% |
| Multidisciplinary Studies | 0 | 0.0% |
| Science & Technology | 247 | 12.1% |
| Business | 414 | 20.2% |
| Education | 568 | 27.7% |
| Literature & Languages | 38 | 1.9% |
| Liberal Arts & History | 61 | 3.0% |
| Visual & Performing Arts | 32 | 1.6% |
| Communications | 26 | 1.3% |
| Arts & Humanities | 240 | 11.7% |
| Total | 2,048 | 100.0% |
Transportation & Commute in Bell County
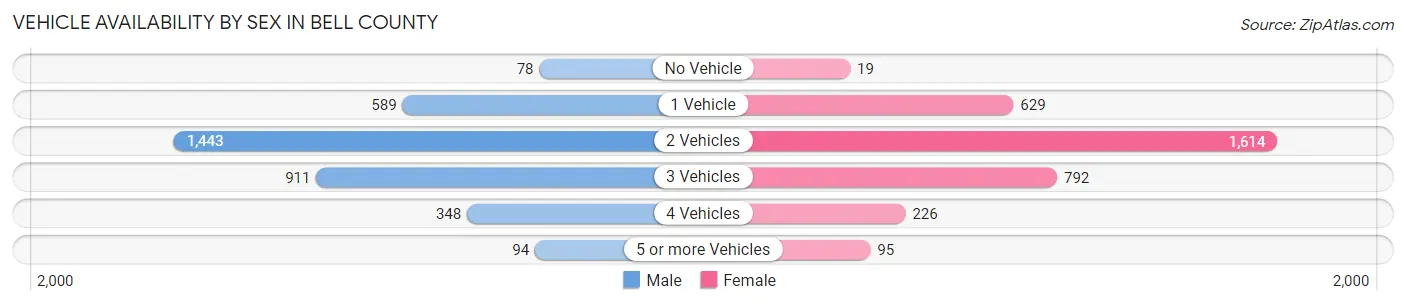
Vehicle Availability by Sex in Bell County
The most prevalent vehicle ownership categories in Bell County are males with 2 vehicles (1,443, accounting for 41.7%) and females with 2 vehicles (1,614, making up 42.8%).
| Vehicles Available | Male | Female |
| No Vehicle | 78 (2.2%) | 19 (0.6%) |
| 1 Vehicle | 589 (17.0%) | 629 (18.6%) |
| 2 Vehicles | 1,443 (41.7%) | 1,614 (47.8%) |
| 3 Vehicles | 911 (26.3%) | 792 (23.5%) |
| 4 Vehicles | 348 (10.1%) | 226 (6.7%) |
| 5 or more Vehicles | 94 (2.7%) | 95 (2.8%) |
| Total | 3,463 (100.0%) | 3,375 (100.0%) |
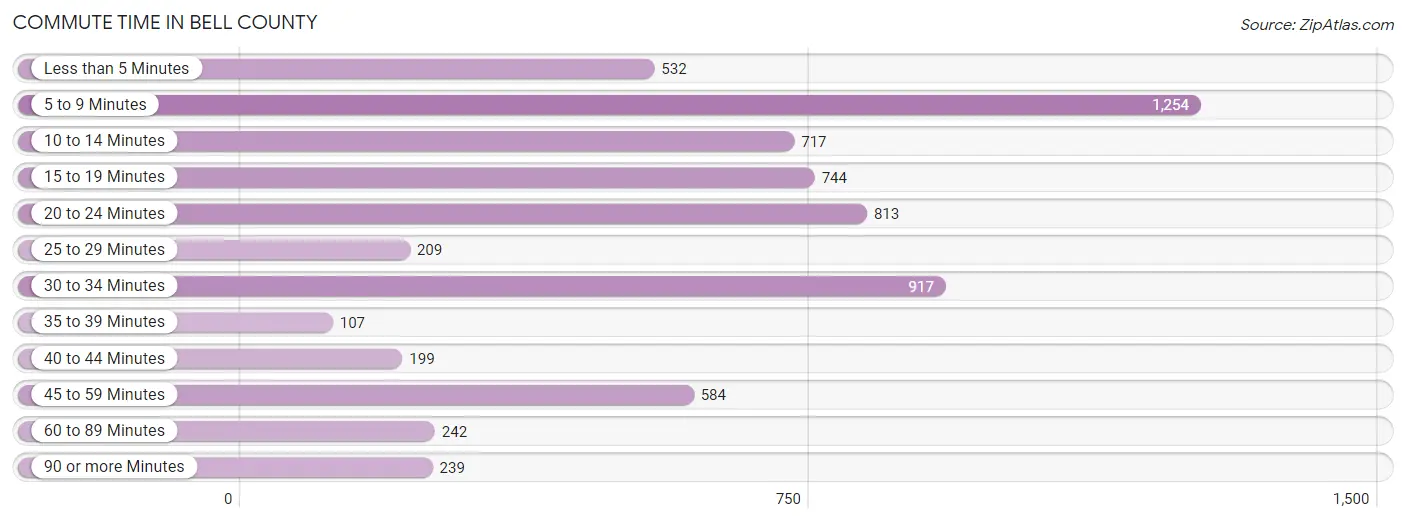
Commute Time in Bell County
The most frequently occuring commute durations in Bell County are 5 to 9 minutes (1,254 commuters, 19.1%), 30 to 34 minutes (917 commuters, 14.0%), and 20 to 24 minutes (813 commuters, 12.4%).
| Commute Time | # Commuters | % Commuters |
| Less than 5 Minutes | 532 | 8.1% |
| 5 to 9 Minutes | 1,254 | 19.1% |
| 10 to 14 Minutes | 717 | 10.9% |
| 15 to 19 Minutes | 744 | 11.4% |
| 20 to 24 Minutes | 813 | 12.4% |
| 25 to 29 Minutes | 209 | 3.2% |
| 30 to 34 Minutes | 917 | 14.0% |
| 35 to 39 Minutes | 107 | 1.6% |
| 40 to 44 Minutes | 199 | 3.0% |
| 45 to 59 Minutes | 584 | 8.9% |
| 60 to 89 Minutes | 242 | 3.7% |
| 90 or more Minutes | 239 | 3.6% |
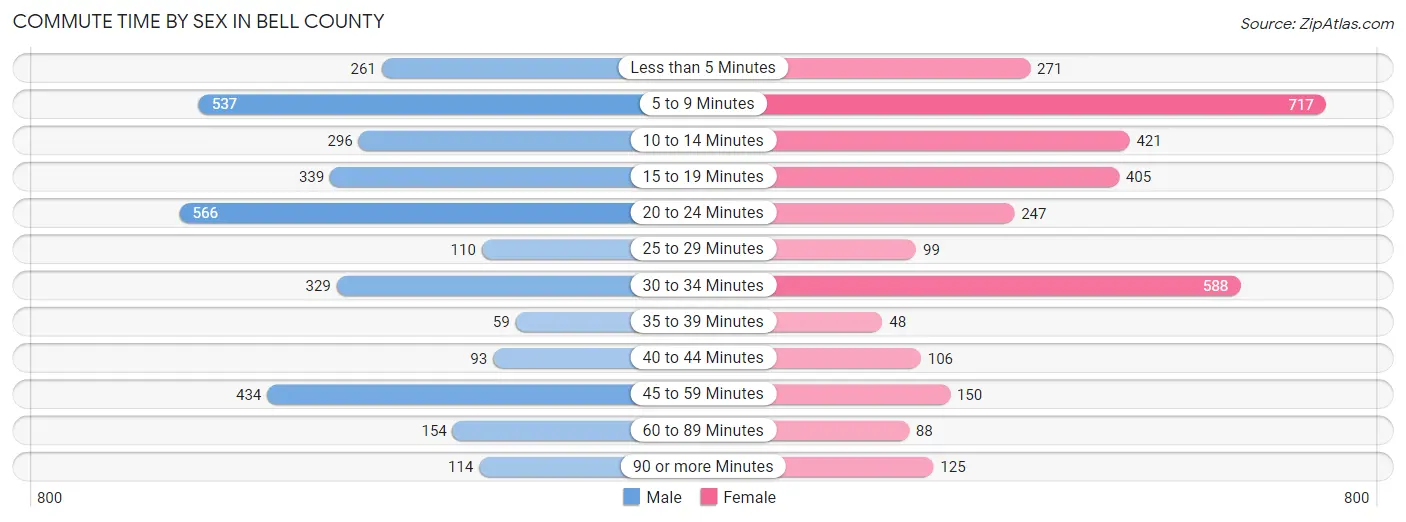
Commute Time by Sex in Bell County
The most common commute times in Bell County are 20 to 24 minutes (566 commuters, 17.2%) for males and 5 to 9 minutes (717 commuters, 22.0%) for females.
| Commute Time | Male | Female |
| Less than 5 Minutes | 261 (7.9%) | 271 (8.3%) |
| 5 to 9 Minutes | 537 (16.3%) | 717 (22.0%) |
| 10 to 14 Minutes | 296 (9.0%) | 421 (12.9%) |
| 15 to 19 Minutes | 339 (10.3%) | 405 (12.4%) |
| 20 to 24 Minutes | 566 (17.2%) | 247 (7.6%) |
| 25 to 29 Minutes | 110 (3.3%) | 99 (3.0%) |
| 30 to 34 Minutes | 329 (10.0%) | 588 (18.0%) |
| 35 to 39 Minutes | 59 (1.8%) | 48 (1.5%) |
| 40 to 44 Minutes | 93 (2.8%) | 106 (3.3%) |
| 45 to 59 Minutes | 434 (13.2%) | 150 (4.6%) |
| 60 to 89 Minutes | 154 (4.7%) | 88 (2.7%) |
| 90 or more Minutes | 114 (3.5%) | 125 (3.8%) |
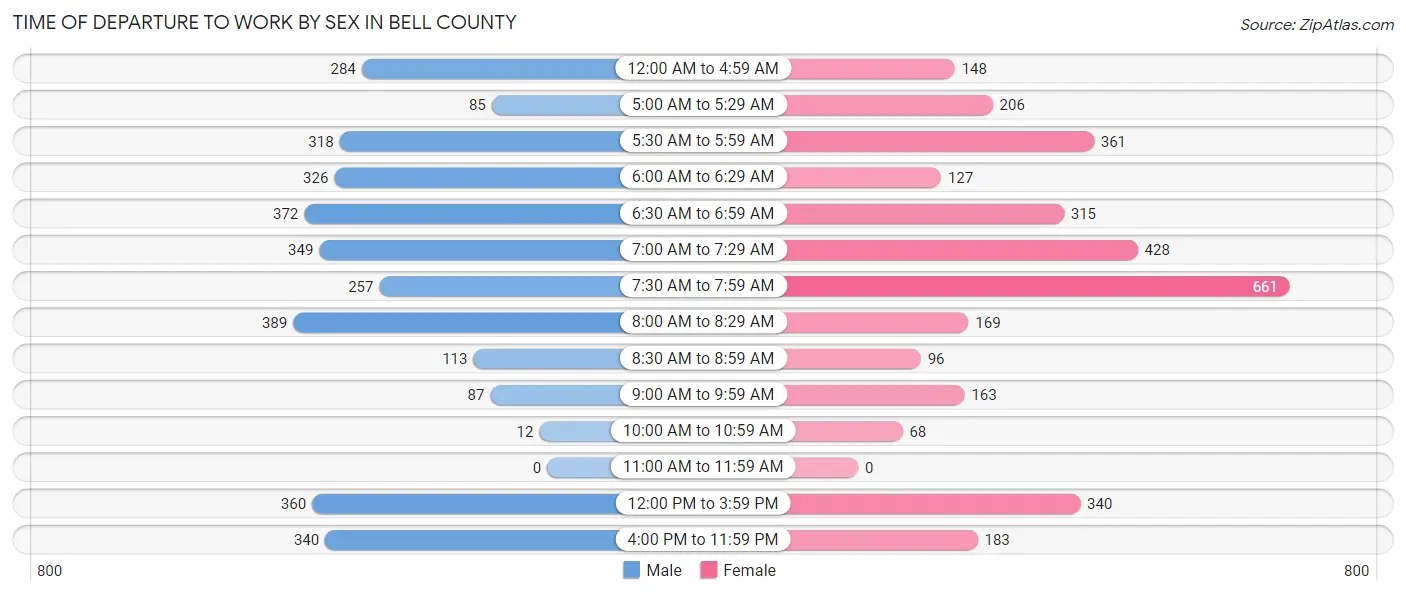
Time of Departure to Work by Sex in Bell County
The most frequent times of departure to work in Bell County are 8:00 AM to 8:29 AM (389, 11.8%) for males and 7:30 AM to 7:59 AM (661, 20.3%) for females.
| Time of Departure | Male | Female |
| 12:00 AM to 4:59 AM | 284 (8.6%) | 148 (4.5%) |
| 5:00 AM to 5:29 AM | 85 (2.6%) | 206 (6.3%) |
| 5:30 AM to 5:59 AM | 318 (9.7%) | 361 (11.1%) |
| 6:00 AM to 6:29 AM | 326 (9.9%) | 127 (3.9%) |
| 6:30 AM to 6:59 AM | 372 (11.3%) | 315 (9.7%) |
| 7:00 AM to 7:29 AM | 349 (10.6%) | 428 (13.1%) |
| 7:30 AM to 7:59 AM | 257 (7.8%) | 661 (20.3%) |
| 8:00 AM to 8:29 AM | 389 (11.8%) | 169 (5.2%) |
| 8:30 AM to 8:59 AM | 113 (3.4%) | 96 (2.9%) |
| 9:00 AM to 9:59 AM | 87 (2.6%) | 163 (5.0%) |
| 10:00 AM to 10:59 AM | 12 (0.4%) | 68 (2.1%) |
| 11:00 AM to 11:59 AM | 0 (0.0%) | 0 (0.0%) |
| 12:00 PM to 3:59 PM | 360 (10.9%) | 340 (10.4%) |
| 4:00 PM to 11:59 PM | 340 (10.3%) | 183 (5.6%) |
| Total | 3,292 (100.0%) | 3,265 (100.0%) |
Housing Occupancy in Bell County
Occupancy by Ownership in Bell County
Of the total 9,456 dwellings in Bell County, owner-occupied units account for 5,966 (63.1%), while renter-occupied units make up 3,490 (36.9%).
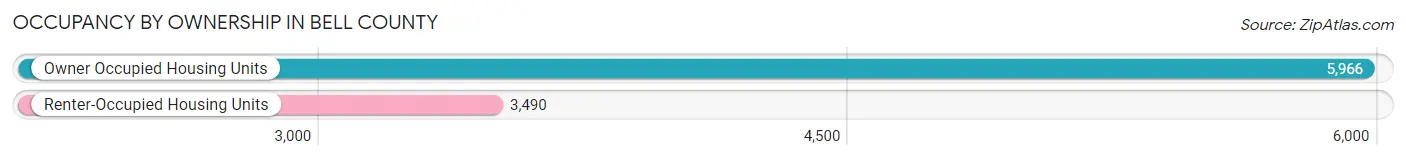
| Occupancy | # Housing Units | % Housing Units |
| Owner Occupied Housing Units | 5,966 | 63.1% |
| Renter-Occupied Housing Units | 3,490 | 36.9% |
| Total Occupied Housing Units | 9,456 | 100.0% |
Occupancy by Household Size in Bell County
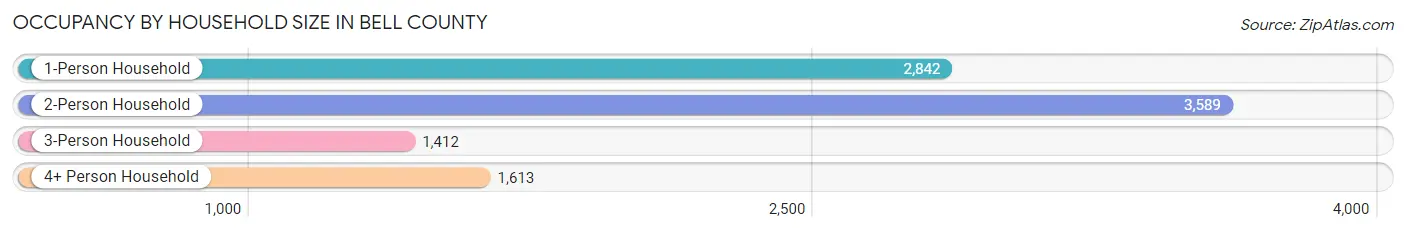
| Household Size | # Housing Units | % Housing Units |
| 1-Person Household | 2,842 | 30.0% |
| 2-Person Household | 3,589 | 38.0% |
| 3-Person Household | 1,412 | 14.9% |
| 4+ Person Household | 1,613 | 17.1% |
| Total Housing Units | 9,456 | 100.0% |
Occupancy by Ownership by Household Size in Bell County
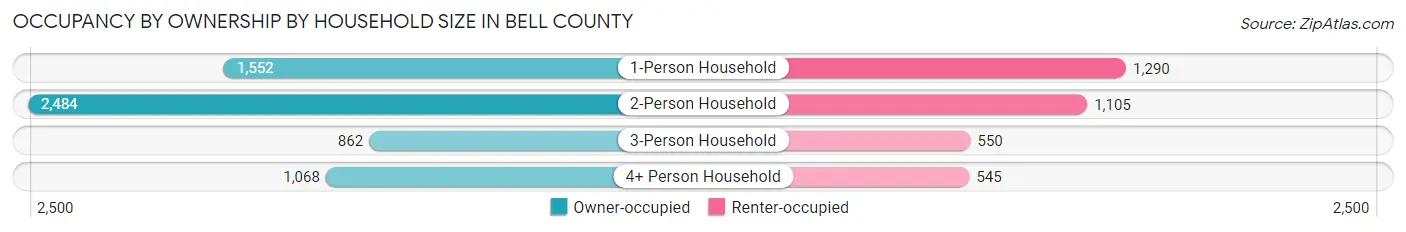
| Household Size | Owner-occupied | Renter-occupied |
| 1-Person Household | 1,552 (54.6%) | 1,290 (45.4%) |
| 2-Person Household | 2,484 (69.2%) | 1,105 (30.8%) |
| 3-Person Household | 862 (61.1%) | 550 (39.0%) |
| 4+ Person Household | 1,068 (66.2%) | 545 (33.8%) |
| Total Housing Units | 5,966 (63.1%) | 3,490 (36.9%) |
Occupancy by Educational Attainment in Bell County
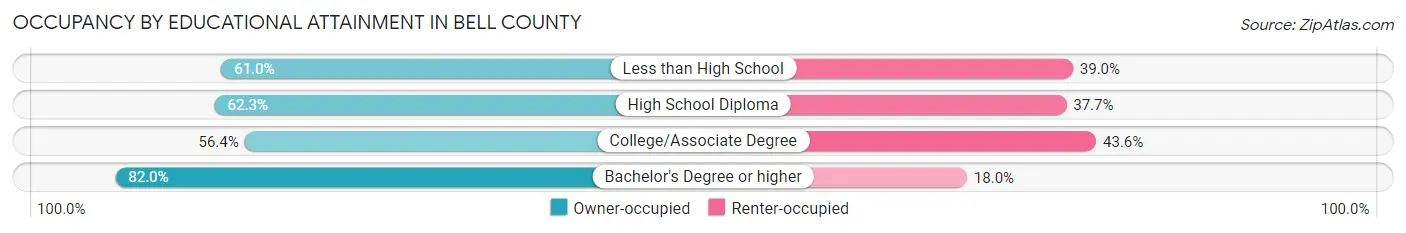
| Household Size | Owner-occupied | Renter-occupied |
| Less than High School | 1,256 (61.0%) | 803 (39.0%) |
| High School Diploma | 2,303 (62.3%) | 1,393 (37.7%) |
| College/Associate Degree | 1,382 (56.4%) | 1,069 (43.6%) |
| Bachelor's Degree or higher | 1,025 (82.0%) | 225 (18.0%) |
Occupancy by Age of Householder in Bell County
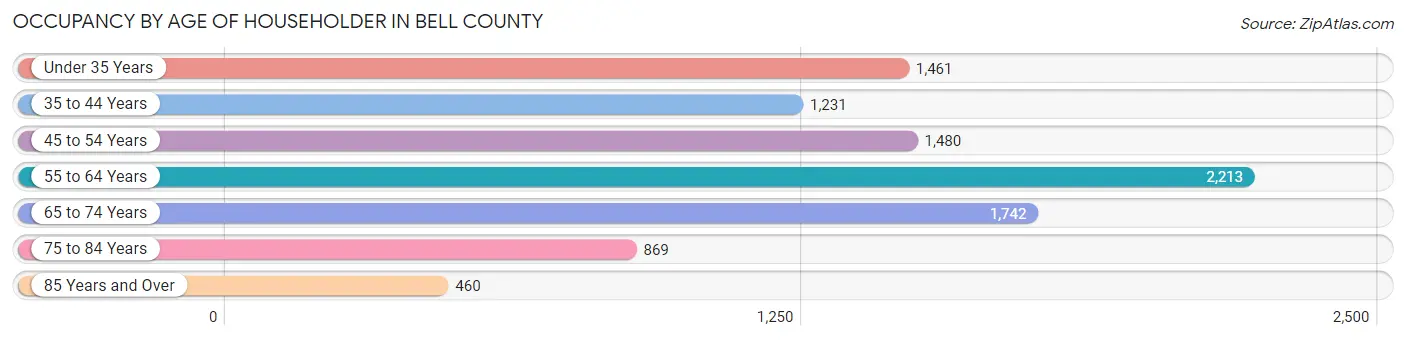
| Age Bracket | # Households | % Households |
| Under 35 Years | 1,461 | 15.4% |
| 35 to 44 Years | 1,231 | 13.0% |
| 45 to 54 Years | 1,480 | 15.7% |
| 55 to 64 Years | 2,213 | 23.4% |
| 65 to 74 Years | 1,742 | 18.4% |
| 75 to 84 Years | 869 | 9.2% |
| 85 Years and Over | 460 | 4.9% |
| Total | 9,456 | 100.0% |
Housing Finances in Bell County
Median Income by Occupancy in Bell County
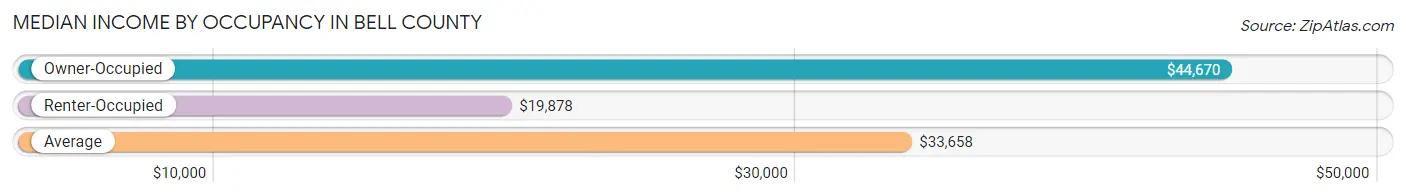
| Occupancy Type | # Households | Median Income |
| Owner-Occupied | 5,966 (63.1%) | $44,670 |
| Renter-Occupied | 3,490 (36.9%) | $19,878 |
| Average | 9,456 (100.0%) | $33,658 |
Occupancy by Householder Income Bracket in Bell County
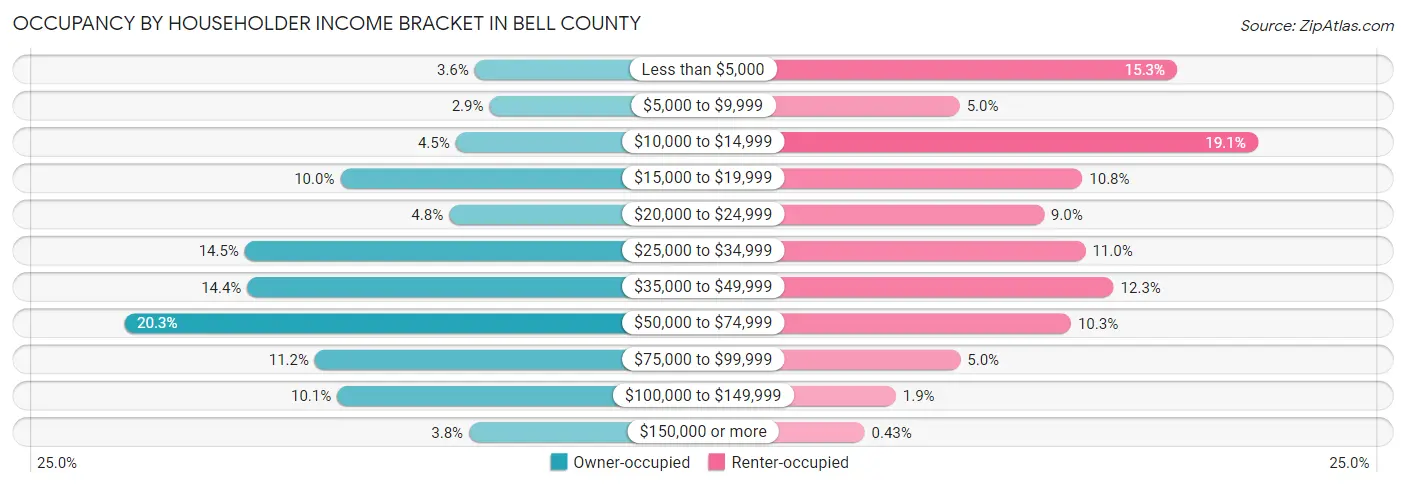
| Income Bracket | Owner-occupied | Renter-occupied |
| Less than $5,000 | 213 (3.6%) | 534 (15.3%) |
| $5,000 to $9,999 | 171 (2.9%) | 173 (5.0%) |
| $10,000 to $14,999 | 267 (4.5%) | 668 (19.1%) |
| $15,000 to $19,999 | 595 (10.0%) | 377 (10.8%) |
| $20,000 to $24,999 | 286 (4.8%) | 313 (9.0%) |
| $25,000 to $34,999 | 866 (14.5%) | 382 (11.0%) |
| $35,000 to $49,999 | 859 (14.4%) | 429 (12.3%) |
| $50,000 to $74,999 | 1,209 (20.3%) | 358 (10.3%) |
| $75,000 to $99,999 | 667 (11.2%) | 174 (5.0%) |
| $100,000 to $149,999 | 604 (10.1%) | 67 (1.9%) |
| $150,000 or more | 229 (3.8%) | 15 (0.4%) |
| Total | 5,966 (100.0%) | 3,490 (100.0%) |
Monthly Housing Cost Tiers in Bell County
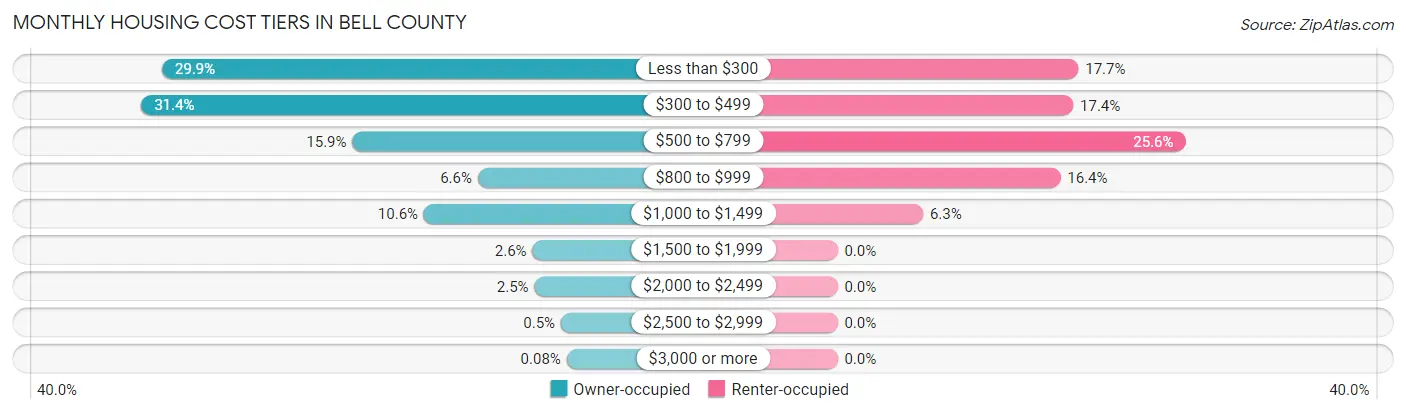
| Monthly Cost | Owner-occupied | Renter-occupied |
| Less than $300 | 1,783 (29.9%) | 619 (17.7%) |
| $300 to $499 | 1,874 (31.4%) | 606 (17.4%) |
| $500 to $799 | 946 (15.9%) | 894 (25.6%) |
| $800 to $999 | 395 (6.6%) | 573 (16.4%) |
| $1,000 to $1,499 | 632 (10.6%) | 220 (6.3%) |
| $1,500 to $1,999 | 155 (2.6%) | 0 (0.0%) |
| $2,000 to $2,499 | 146 (2.5%) | 0 (0.0%) |
| $2,500 to $2,999 | 30 (0.5%) | 0 (0.0%) |
| $3,000 or more | 5 (0.1%) | 0 (0.0%) |
| Total | 5,966 (100.0%) | 3,490 (100.0%) |
Physical Housing Characteristics in Bell County
Housing Structures in Bell County
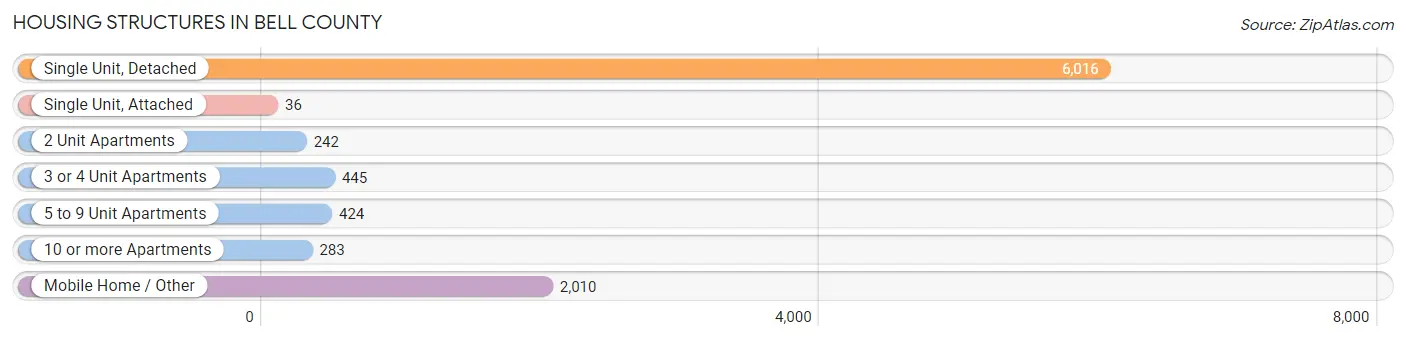
| Structure Type | # Housing Units | % Housing Units |
| Single Unit, Detached | 6,016 | 63.6% |
| Single Unit, Attached | 36 | 0.4% |
| 2 Unit Apartments | 242 | 2.6% |
| 3 or 4 Unit Apartments | 445 | 4.7% |
| 5 to 9 Unit Apartments | 424 | 4.5% |
| 10 or more Apartments | 283 | 3.0% |
| Mobile Home / Other | 2,010 | 21.3% |
| Total | 9,456 | 100.0% |
Housing Structures by Occupancy in Bell County
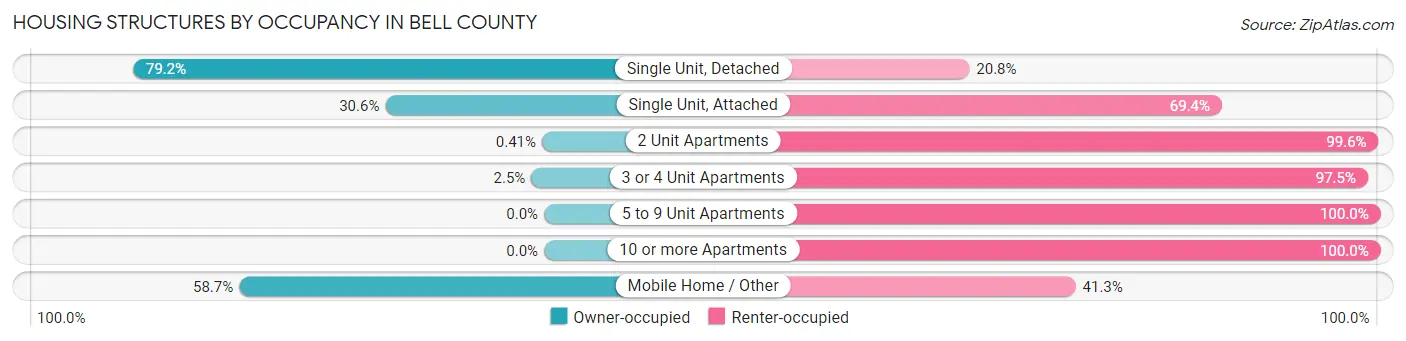
| Structure Type | Owner-occupied | Renter-occupied |
| Single Unit, Detached | 4,763 (79.2%) | 1,253 (20.8%) |
| Single Unit, Attached | 11 (30.6%) | 25 (69.4%) |
| 2 Unit Apartments | 1 (0.4%) | 241 (99.6%) |
| 3 or 4 Unit Apartments | 11 (2.5%) | 434 (97.5%) |
| 5 to 9 Unit Apartments | 0 (0.0%) | 424 (100.0%) |
| 10 or more Apartments | 0 (0.0%) | 283 (100.0%) |
| Mobile Home / Other | 1,180 (58.7%) | 830 (41.3%) |
| Total | 5,966 (63.1%) | 3,490 (36.9%) |
Housing Structures by Number of Rooms in Bell County
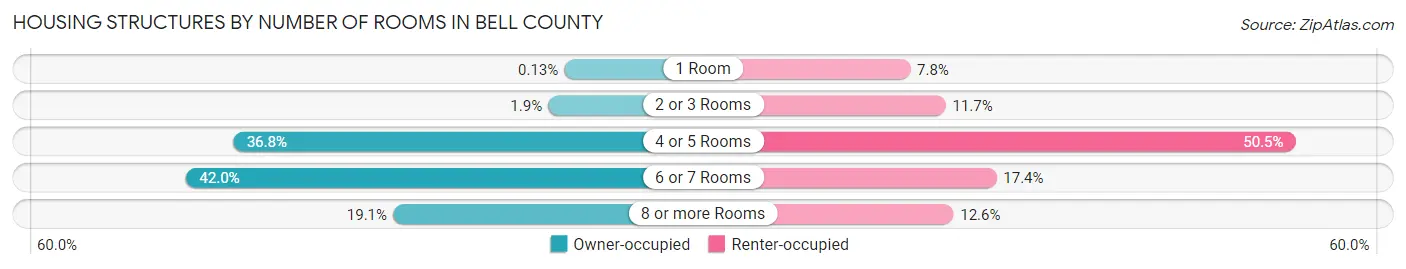
| Number of Rooms | Owner-occupied | Renter-occupied |
| 1 Room | 8 (0.1%) | 272 (7.8%) |
| 2 or 3 Rooms | 114 (1.9%) | 409 (11.7%) |
| 4 or 5 Rooms | 2,195 (36.8%) | 1,764 (50.5%) |
| 6 or 7 Rooms | 2,508 (42.0%) | 606 (17.4%) |
| 8 or more Rooms | 1,141 (19.1%) | 439 (12.6%) |
| Total | 5,966 (100.0%) | 3,490 (100.0%) |
Housing Structure by Heating Type in Bell County
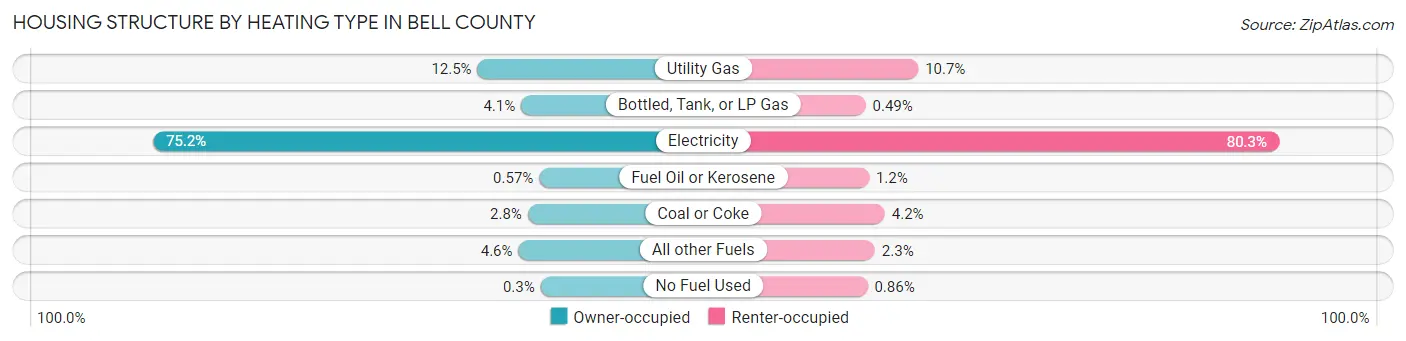
| Heating Type | Owner-occupied | Renter-occupied |
| Utility Gas | 745 (12.5%) | 372 (10.7%) |
| Bottled, Tank, or LP Gas | 243 (4.1%) | 17 (0.5%) |
| Electricity | 4,486 (75.2%) | 2,804 (80.3%) |
| Fuel Oil or Kerosene | 34 (0.6%) | 40 (1.1%) |
| Coal or Coke | 166 (2.8%) | 147 (4.2%) |
| All other Fuels | 274 (4.6%) | 80 (2.3%) |
| No Fuel Used | 18 (0.3%) | 30 (0.9%) |
| Total | 5,966 (100.0%) | 3,490 (100.0%) |
Household Vehicle Usage in Bell County
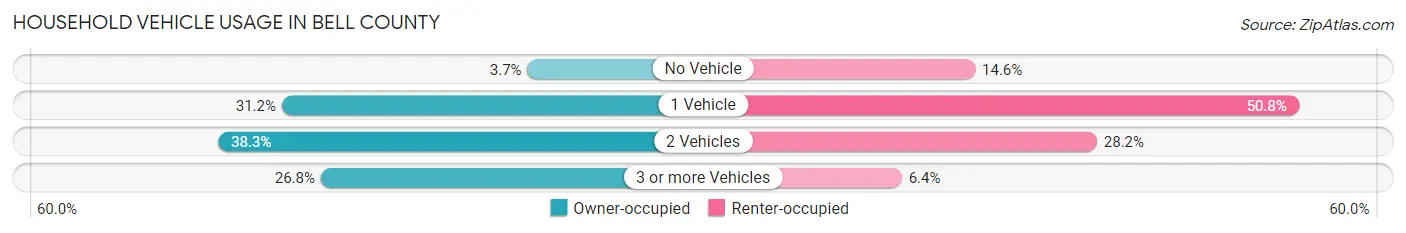
| Vehicles per Household | Owner-occupied | Renter-occupied |
| No Vehicle | 219 (3.7%) | 509 (14.6%) |
| 1 Vehicle | 1,861 (31.2%) | 1,774 (50.8%) |
| 2 Vehicles | 2,286 (38.3%) | 985 (28.2%) |
| 3 or more Vehicles | 1,600 (26.8%) | 222 (6.4%) |
| Total | 5,966 (100.0%) | 3,490 (100.0%) |
Real Estate & Mortgages in Bell County
Real Estate and Mortgage Overview in Bell County
| Characteristic | Without Mortgage | With Mortgage |
| Housing Units | 4,137 | 1,829 |
| Median Property Value | $60,000 | $123,300 |
| Median Household Income | $38,163 | $142 |
| Monthly Housing Costs | $318 | $5 |
| Real Estate Taxes | $514 | $147 |
Property Value by Mortgage Status in Bell County
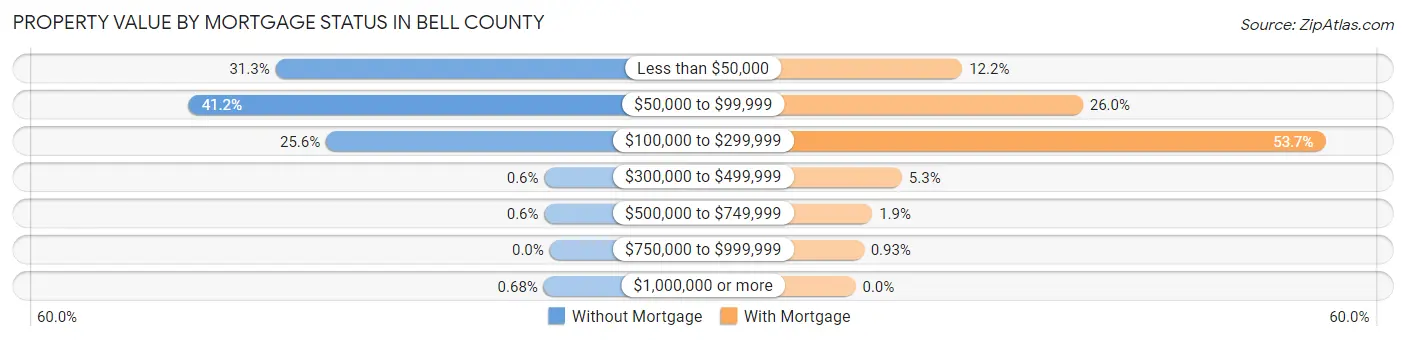
| Property Value | Without Mortgage | With Mortgage |
| Less than $50,000 | 1,296 (31.3%) | 223 (12.2%) |
| $50,000 to $99,999 | 1,706 (41.2%) | 475 (26.0%) |
| $100,000 to $299,999 | 1,057 (25.6%) | 982 (53.7%) |
| $300,000 to $499,999 | 25 (0.6%) | 97 (5.3%) |
| $500,000 to $749,999 | 25 (0.6%) | 35 (1.9%) |
| $750,000 to $999,999 | 0 (0.0%) | 17 (0.9%) |
| $1,000,000 or more | 28 (0.7%) | 0 (0.0%) |
| Total | 4,137 (100.0%) | 1,829 (100.0%) |
Household Income by Mortgage Status in Bell County
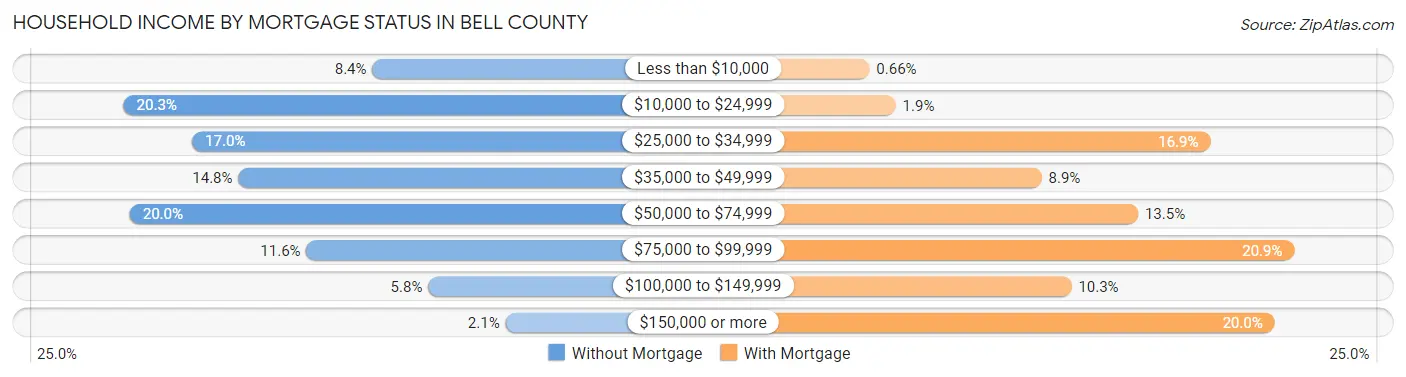
| Household Income | Without Mortgage | With Mortgage |
| Less than $10,000 | 349 (8.4%) | 12 (0.7%) |
| $10,000 to $24,999 | 839 (20.3%) | 35 (1.9%) |
| $25,000 to $34,999 | 704 (17.0%) | 309 (16.9%) |
| $35,000 to $49,999 | 613 (14.8%) | 162 (8.9%) |
| $50,000 to $74,999 | 827 (20.0%) | 246 (13.5%) |
| $75,000 to $99,999 | 479 (11.6%) | 382 (20.9%) |
| $100,000 to $149,999 | 239 (5.8%) | 188 (10.3%) |
| $150,000 or more | 87 (2.1%) | 365 (20.0%) |
| Total | 4,137 (100.0%) | 1,829 (100.0%) |
Property Value to Household Income Ratio in Bell County
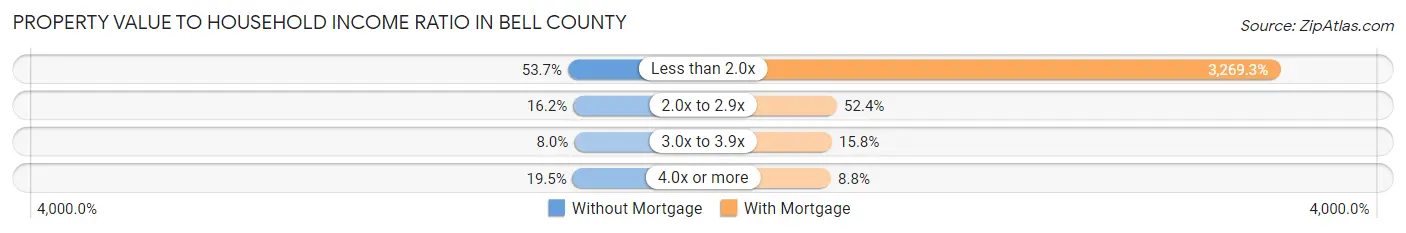
| Value-to-Income Ratio | Without Mortgage | With Mortgage |
| Less than 2.0x | 2,222 (53.7%) | 59,796 (3,269.3%) |
| 2.0x to 2.9x | 670 (16.2%) | 959 (52.4%) |
| 3.0x to 3.9x | 332 (8.0%) | 289 (15.8%) |
| 4.0x or more | 808 (19.5%) | 161 (8.8%) |
| Total | 4,137 (100.0%) | 1,829 (100.0%) |
Real Estate Taxes by Mortgage Status in Bell County
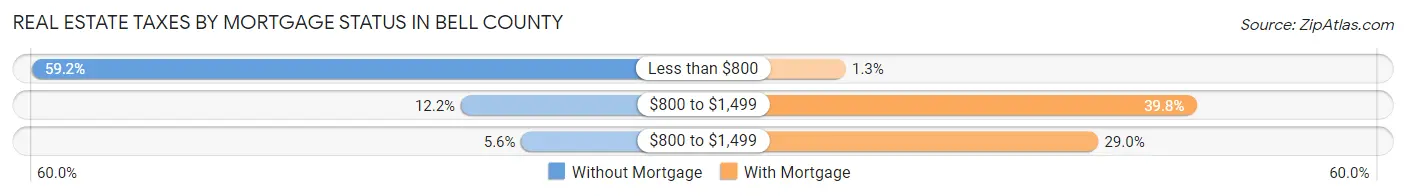
| Property Taxes | Without Mortgage | With Mortgage |
| Less than $800 | 2,449 (59.2%) | 24 (1.3%) |
| $800 to $1,499 | 504 (12.2%) | 728 (39.8%) |
| $800 to $1,499 | 230 (5.6%) | 530 (29.0%) |
| Total | 4,137 (100.0%) | 1,829 (100.0%) |
Health & Disability in Bell County
Health Insurance Coverage by Age in Bell County
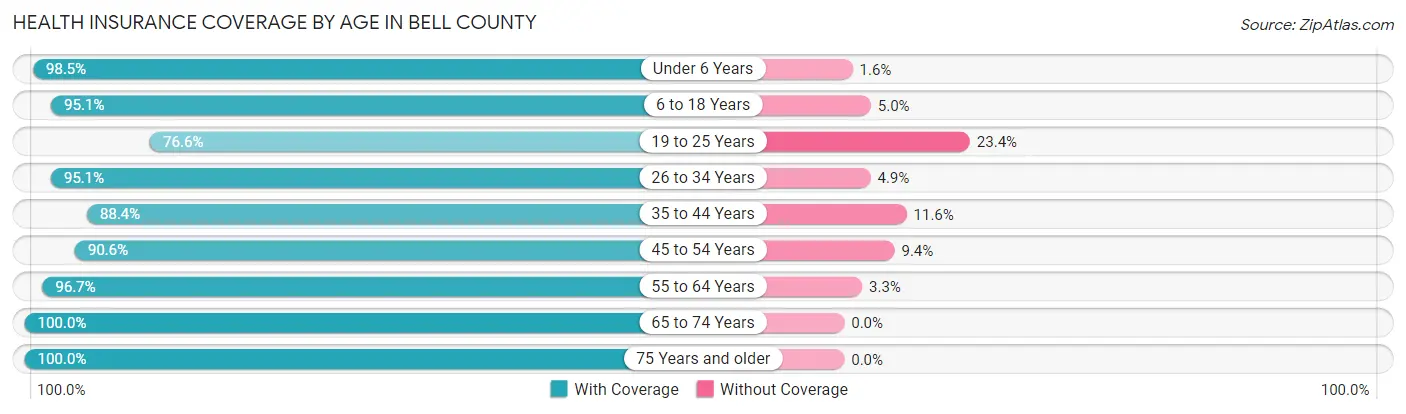
| Age Bracket | With Coverage | Without Coverage |
| Under 6 Years | 1,844 (98.5%) | 29 (1.5%) |
| 6 to 18 Years | 3,575 (95.1%) | 186 (5.0%) |
| 19 to 25 Years | 1,337 (76.6%) | 409 (23.4%) |
| 26 to 34 Years | 2,549 (95.1%) | 131 (4.9%) |
| 35 to 44 Years | 2,281 (88.4%) | 300 (11.6%) |
| 45 to 54 Years | 2,834 (90.6%) | 293 (9.4%) |
| 55 to 64 Years | 3,412 (96.7%) | 117 (3.3%) |
| 65 to 74 Years | 2,702 (100.0%) | 0 (0.0%) |
| 75 Years and older | 1,668 (100.0%) | 0 (0.0%) |
| Total | 22,202 (93.8%) | 1,465 (6.2%) |
Health Insurance Coverage by Citizenship Status in Bell County
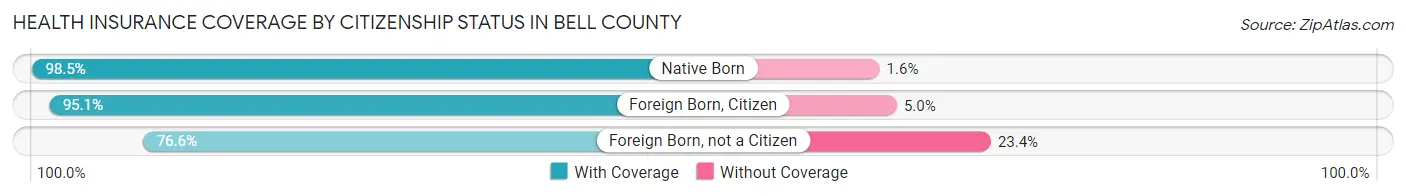
| Citizenship Status | With Coverage | Without Coverage |
| Native Born | 1,844 (98.5%) | 29 (1.5%) |
| Foreign Born, Citizen | 3,575 (95.1%) | 186 (5.0%) |
| Foreign Born, not a Citizen | 1,337 (76.6%) | 409 (23.4%) |
Health Insurance Coverage by Household Income in Bell County
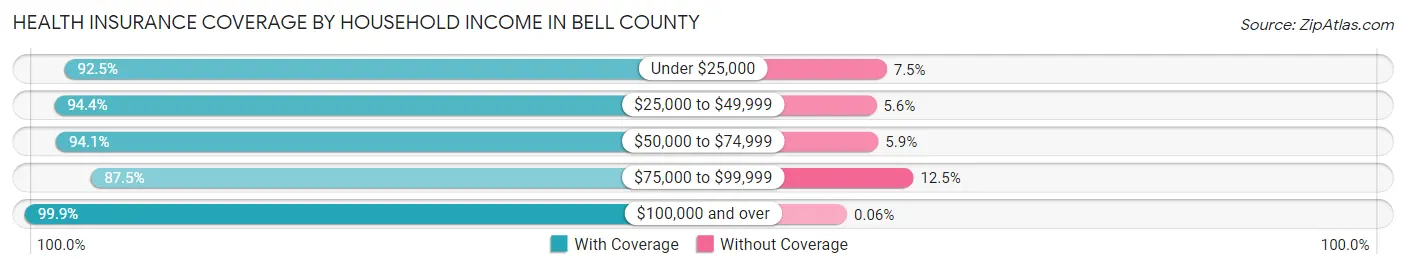
| Household Income | With Coverage | Without Coverage |
| Under $25,000 | 5,840 (92.5%) | 473 (7.5%) |
| $25,000 to $49,999 | 6,492 (94.4%) | 382 (5.6%) |
| $50,000 to $74,999 | 4,117 (94.1%) | 259 (5.9%) |
| $75,000 to $99,999 | 2,418 (87.5%) | 345 (12.5%) |
| $100,000 and over | 3,223 (99.9%) | 2 (0.1%) |
Public vs Private Health Insurance Coverage by Age in Bell County
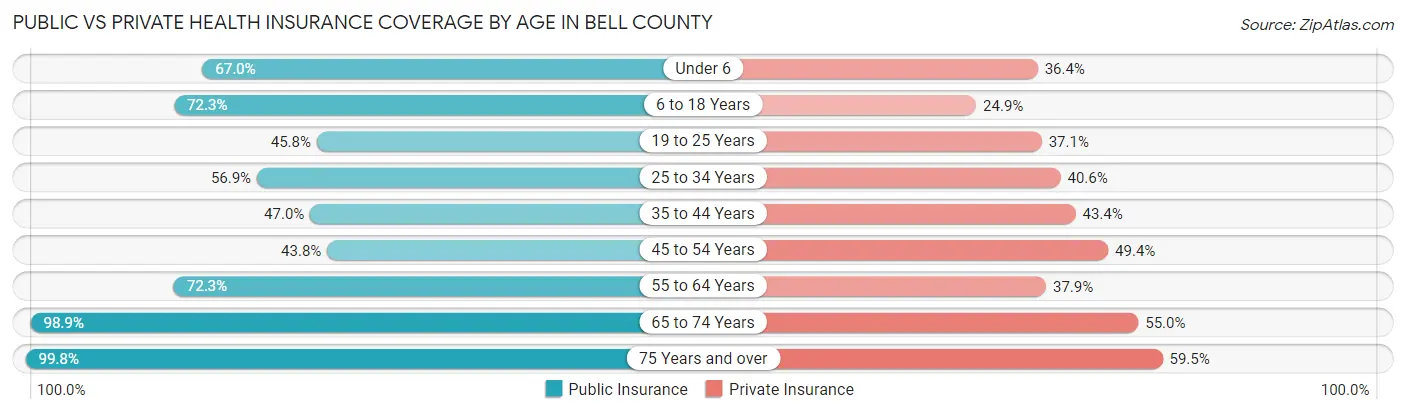
| Age Bracket | Public Insurance | Private Insurance |
| Under 6 | 1,255 (67.0%) | 681 (36.4%) |
| 6 to 18 Years | 2,718 (72.3%) | 938 (24.9%) |
| 19 to 25 Years | 799 (45.8%) | 648 (37.1%) |
| 25 to 34 Years | 1,524 (56.9%) | 1,088 (40.6%) |
| 35 to 44 Years | 1,213 (47.0%) | 1,120 (43.4%) |
| 45 to 54 Years | 1,371 (43.8%) | 1,546 (49.4%) |
| 55 to 64 Years | 2,551 (72.3%) | 1,338 (37.9%) |
| 65 to 74 Years | 2,672 (98.9%) | 1,487 (55.0%) |
| 75 Years and over | 1,665 (99.8%) | 993 (59.5%) |
| Total | 15,768 (66.6%) | 9,839 (41.6%) |
Disability Status by Sex by Age in Bell County
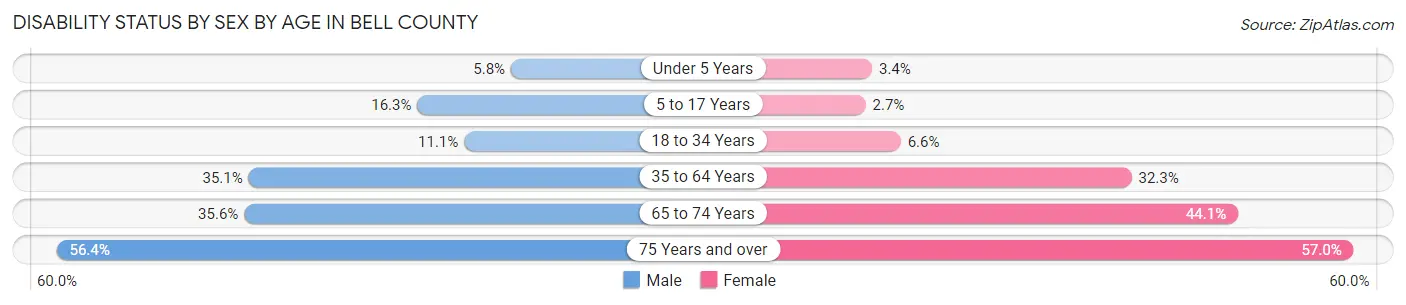
| Age Bracket | Male | Female |
| Under 5 Years | 43 (5.8%) | 24 (3.4%) |
| 5 to 17 Years | 336 (16.3%) | 46 (2.6%) |
| 18 to 34 Years | 280 (11.1%) | 149 (6.6%) |
| 35 to 64 Years | 1,572 (35.1%) | 1,534 (32.3%) |
| 65 to 74 Years | 444 (35.5%) | 641 (44.1%) |
| 75 Years and over | 381 (56.4%) | 566 (57.0%) |
Disability Class by Sex by Age in Bell County
Disability Class: Hearing Difficulty
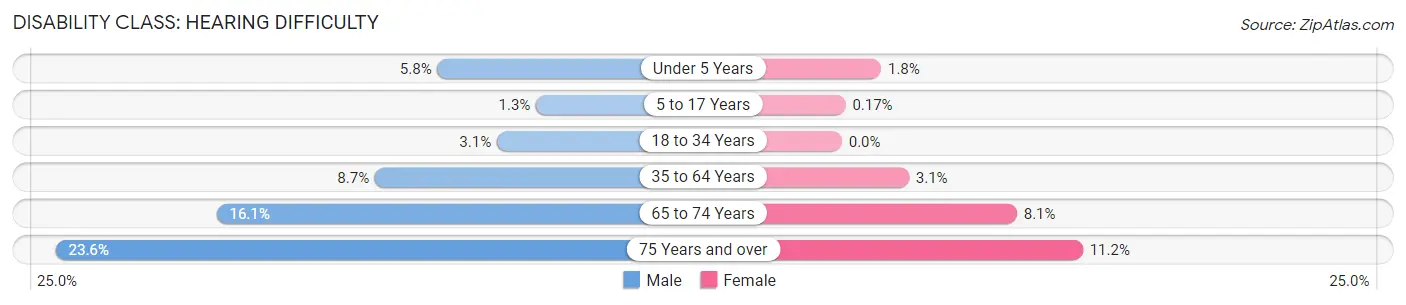
| Age Bracket | Male | Female |
| Under 5 Years | 43 (5.8%) | 13 (1.8%) |
| 5 to 17 Years | 26 (1.3%) | 3 (0.2%) |
| 18 to 34 Years | 78 (3.1%) | 0 (0.0%) |
| 35 to 64 Years | 392 (8.7%) | 148 (3.1%) |
| 65 to 74 Years | 201 (16.1%) | 118 (8.1%) |
| 75 Years and over | 159 (23.6%) | 111 (11.2%) |
Disability Class: Vision Difficulty
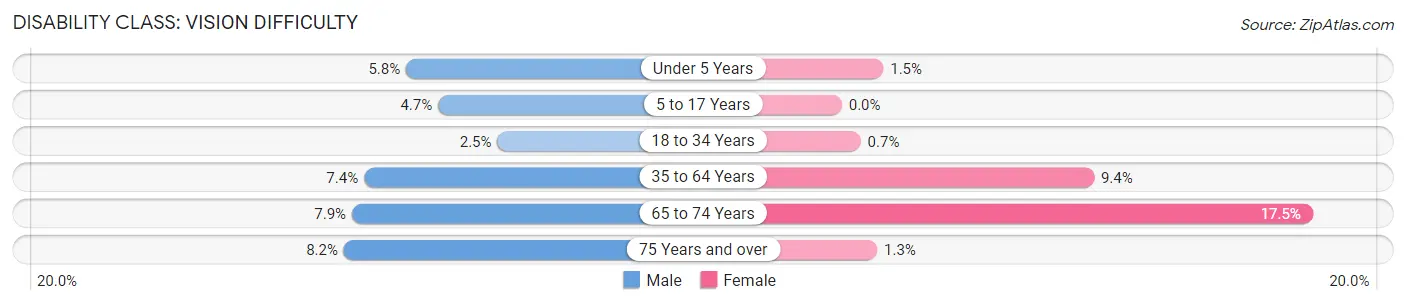
| Age Bracket | Male | Female |
| Under 5 Years | 43 (5.8%) | 11 (1.5%) |
| 5 to 17 Years | 96 (4.6%) | 0 (0.0%) |
| 18 to 34 Years | 62 (2.5%) | 16 (0.7%) |
| 35 to 64 Years | 332 (7.4%) | 445 (9.4%) |
| 65 to 74 Years | 98 (7.9%) | 254 (17.5%) |
| 75 Years and over | 55 (8.2%) | 13 (1.3%) |
Disability Class: Cognitive Difficulty
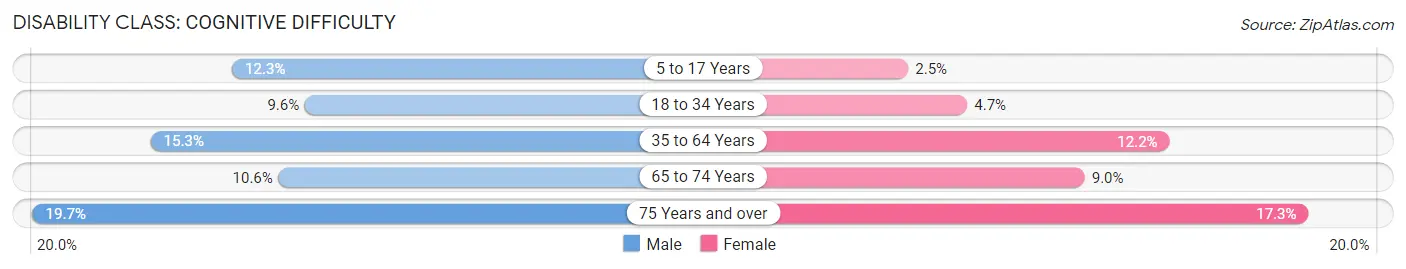
| Age Bracket | Male | Female |
| 5 to 17 Years | 254 (12.3%) | 43 (2.5%) |
| 18 to 34 Years | 243 (9.6%) | 106 (4.7%) |
| 35 to 64 Years | 687 (15.3%) | 578 (12.2%) |
| 65 to 74 Years | 132 (10.6%) | 131 (9.0%) |
| 75 Years and over | 133 (19.7%) | 172 (17.3%) |
Disability Class: Ambulatory Difficulty
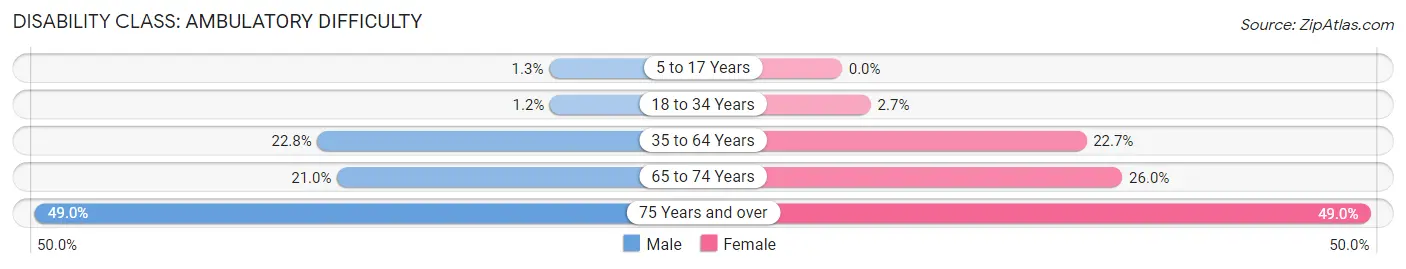
| Age Bracket | Male | Female |
| 5 to 17 Years | 27 (1.3%) | 0 (0.0%) |
| 18 to 34 Years | 31 (1.2%) | 61 (2.7%) |
| 35 to 64 Years | 1,023 (22.8%) | 1,078 (22.7%) |
| 65 to 74 Years | 262 (21.0%) | 378 (26.0%) |
| 75 Years and over | 331 (49.0%) | 487 (49.0%) |
Disability Class: Self-Care Difficulty
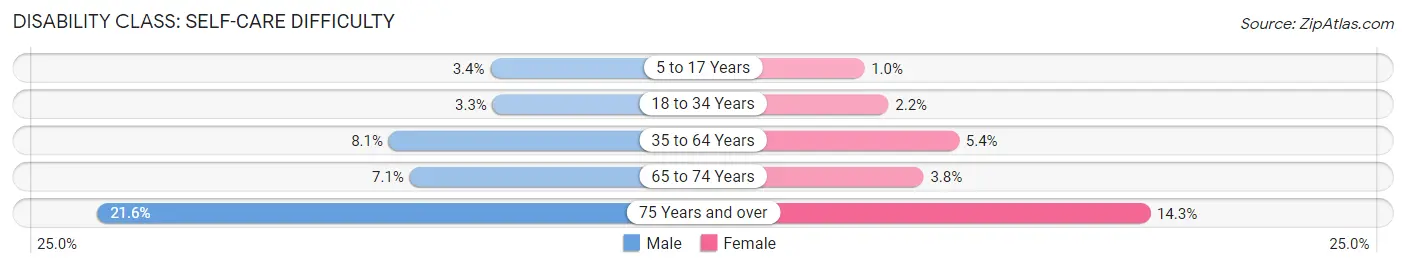
| Age Bracket | Male | Female |
| 5 to 17 Years | 70 (3.4%) | 18 (1.0%) |
| 18 to 34 Years | 83 (3.3%) | 49 (2.2%) |
| 35 to 64 Years | 363 (8.1%) | 258 (5.4%) |
| 65 to 74 Years | 89 (7.1%) | 55 (3.8%) |
| 75 Years and over | 146 (21.6%) | 142 (14.3%) |
Technology Access in Bell County
Computing Device Access in Bell County
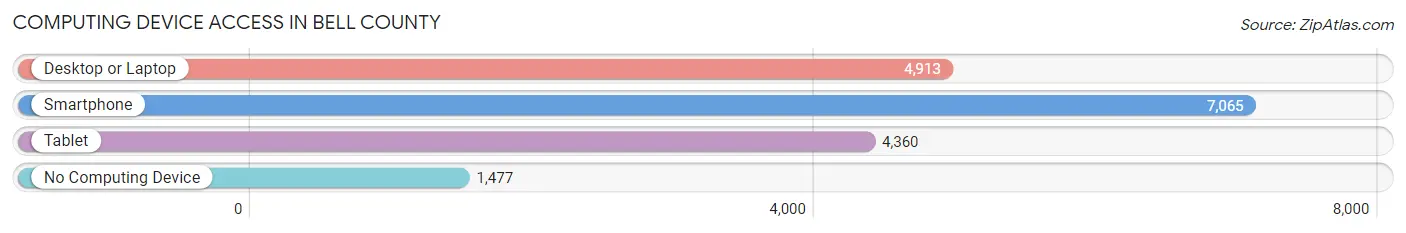
| Device Type | # Households | % Households |
| Desktop or Laptop | 4,913 | 52.0% |
| Smartphone | 7,065 | 74.7% |
| Tablet | 4,360 | 46.1% |
| No Computing Device | 1,477 | 15.6% |
| Total | 9,456 | 100.0% |
Internet Access in Bell County
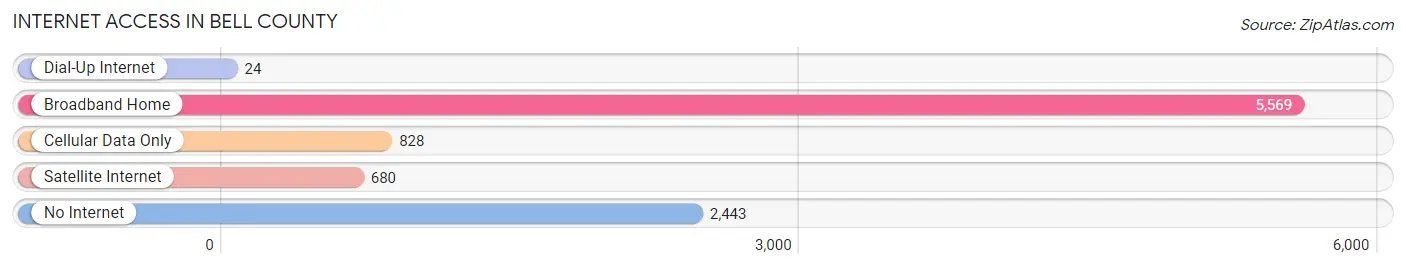
| Internet Type | # Households | % Households |
| Dial-Up Internet | 24 | 0.3% |
| Broadband Home | 5,569 | 58.9% |
| Cellular Data Only | 828 | 8.8% |
| Satellite Internet | 680 | 7.2% |
| No Internet | 2,443 | 25.8% |
| Total | 9,456 | 100.0% |
Bell County Summary
Bell County is located in the southeastern corner of Kentucky, and is bordered by Tennessee to the south, Virginia to the east, and Harlan and Knox Counties to the north and west, respectively. The county seat is Pineville, and the county was formed in 1867 from parts of Harlan and Knox Counties. The county is named for Joshua Fry Bell, a Kentucky politician and soldier who fought in the War of 1812.
Geography
Bell County is located in the Appalachian Mountains region of Kentucky, and is characterized by rugged terrain and steep hills. The county is mostly forested, with the majority of the land being used for timber production. The county is drained by the Cumberland River, which forms the county's eastern border. The county has a total area of 441 square miles, of which 437 square miles is land and 4.2 square miles is water.
Demographics
As of the 2010 census, Bell County had a population of 28,691. The racial makeup of the county was 97.2% White, 0.9% Black or African American, 0.3% Native American, 0.2% Asian, 0.1% Pacific Islander, 0.3% from other races, and 0.9% from two or more races. 1.6% of the population were Hispanic or Latino of any race.
The median income for a household in the county was $25,945, and the median income for a family was $32,917. The per capita income for the county was $14,945. About 20.2% of the population were below the poverty line.
Economy
The economy of Bell County is largely based on agriculture and timber production. The county is home to several large timber companies, and the timber industry is the largest employer in the county. Other major industries in the county include coal mining, manufacturing, and tourism.
The county is also home to several large employers, including the Bell County School District, Bell County Hospital, and the Bell County Sheriff's Office.
History
Bell County was formed in 1867 from parts of Harlan and Knox Counties. The county was named for Joshua Fry Bell, a Kentucky politician and soldier who fought in the War of 1812.
The county was largely rural until the early 20th century, when coal mining began to take off in the area. The coal industry was the main driver of the county's economy until the mid-20th century, when the timber industry began to take over.
In the late 20th century, the county began to diversify its economy, with the addition of manufacturing and tourism. The county is now home to several large employers, including the Bell County School District, Bell County Hospital, and the Bell County Sheriff's Office.
Common Questions
What is Per Capita Income in Bell County?
Per Capita income in Bell County is $19,262.
What is the Median Family Income in Bell County?
Median Family Income in Bell County is $44,936.
What is the Median Household income in Bell County?
Median Household Income in Bell County is $33,658.
What is Income or Wage Gap in Bell County?
Income or Wage Gap in Bell County is 18.5%.
Women in Bell County earn 81.5 cents for every dollar earned by a man.
What is Family Income Deficit in Bell County?
Family Income Deficit in Bell County is $8,371.
Families that are below poverty line in Bell County earn $8,371 less on average than the poverty threshold level.
What is Inequality or Gini Index in Bell County?
Inequality or Gini Index in Bell County is 0.48.
What is the Total Population of Bell County?
Total Population of Bell County is 24,248.
What is the Total Male Population of Bell County?
Total Male Population of Bell County is 12,167.
What is the Total Female Population of Bell County?
Total Female Population of Bell County is 12,081.
What is the Ratio of Males per 100 Females in Bell County?
There are 100.71 Males per 100 Females in Bell County.
What is the Ratio of Females per 100 Males in Bell County?
There are 99.29 Females per 100 Males in Bell County.
What is the Median Population Age in Bell County?
Median Population Age in Bell County is 41.5 Years.
What is the Average Family Size in Bell County
Average Family Size in Bell County is 3.1 People.
What is the Average Household Size in Bell County
Average Household Size in Bell County is 2.5 People.
How Large is the Labor Force in Bell County?
There are 8,042 People in the Labor Forcein in Bell County.
What is the Percentage of People in the Labor Force in Bell County?
40.9% of People are in the Labor Force in Bell County.
What is the Unemployment Rate in Bell County?
Unemployment Rate in Bell County is 10.0%.