Bath County, KY Map & Demographics
Bath County Overview
$27,018
PER CAPITA INCOME
$60,313
AVG FAMILY INCOME
$51,471
AVG HOUSEHOLD INCOME
26.6%
WAGE / INCOME GAP [ % ]
73.4¢/ $1
WAGE / INCOME GAP [ $ ]
$10,528
FAMILY INCOME DEFICIT
0.52
INEQUALITY / GINI INDEX
12,739
TOTAL POPULATION
6,434
MALE POPULATION
6,305
FEMALE POPULATION
102.05
MALES / 100 FEMALES
98.00
FEMALES / 100 MALES
39.5
MEDIAN AGE
3.1
AVG FAMILY SIZE
2.6
AVG HOUSEHOLD SIZE
5,009
LABOR FORCE [ PEOPLE ]
51.0%
PERCENT IN LABOR FORCE
2.9%
UNEMPLOYMENT RATE
Income in Bath County
Income Overview in Bath County
Per Capita Income in Bath County is $27,018, while median incomes of families and households are $60,313 and $51,471 respectively.
| Characteristic | Number | Measure |
| Per Capita Income | 12,739 | $27,018 |
| Median Family Income | 3,379 | $60,313 |
| Mean Family Income | 3,379 | $90,830 |
| Median Household Income | 4,844 | $51,471 |
| Mean Household Income | 4,844 | $75,187 |
| Income Deficit | 3,379 | $10,528 |
| Wage / Income Gap (%) | 12,739 | 26.58% |
| Wage / Income Gap ($) | 12,739 | 73.42¢ per $1 |
| Gini / Inequality Index | 12,739 | 0.52 |
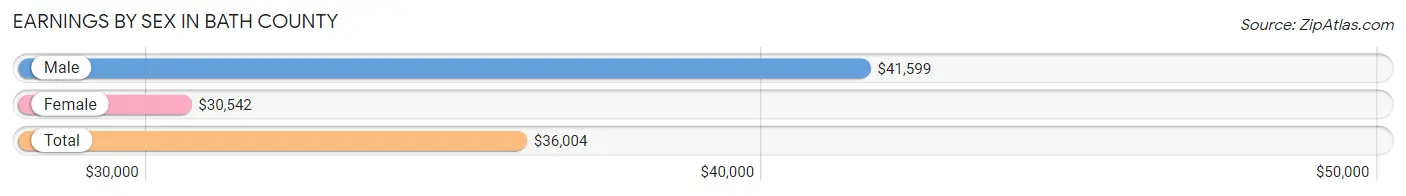
Earnings by Sex in Bath County
Average Earnings in Bath County are $36,004, $41,599 for men and $30,542 for women, a difference of 26.6%.
| Sex | Number | Average Earnings |
| Male | 2,937 (54.9%) | $41,599 |
| Female | 2,414 (45.1%) | $30,542 |
| Total | 5,351 (100.0%) | $36,004 |
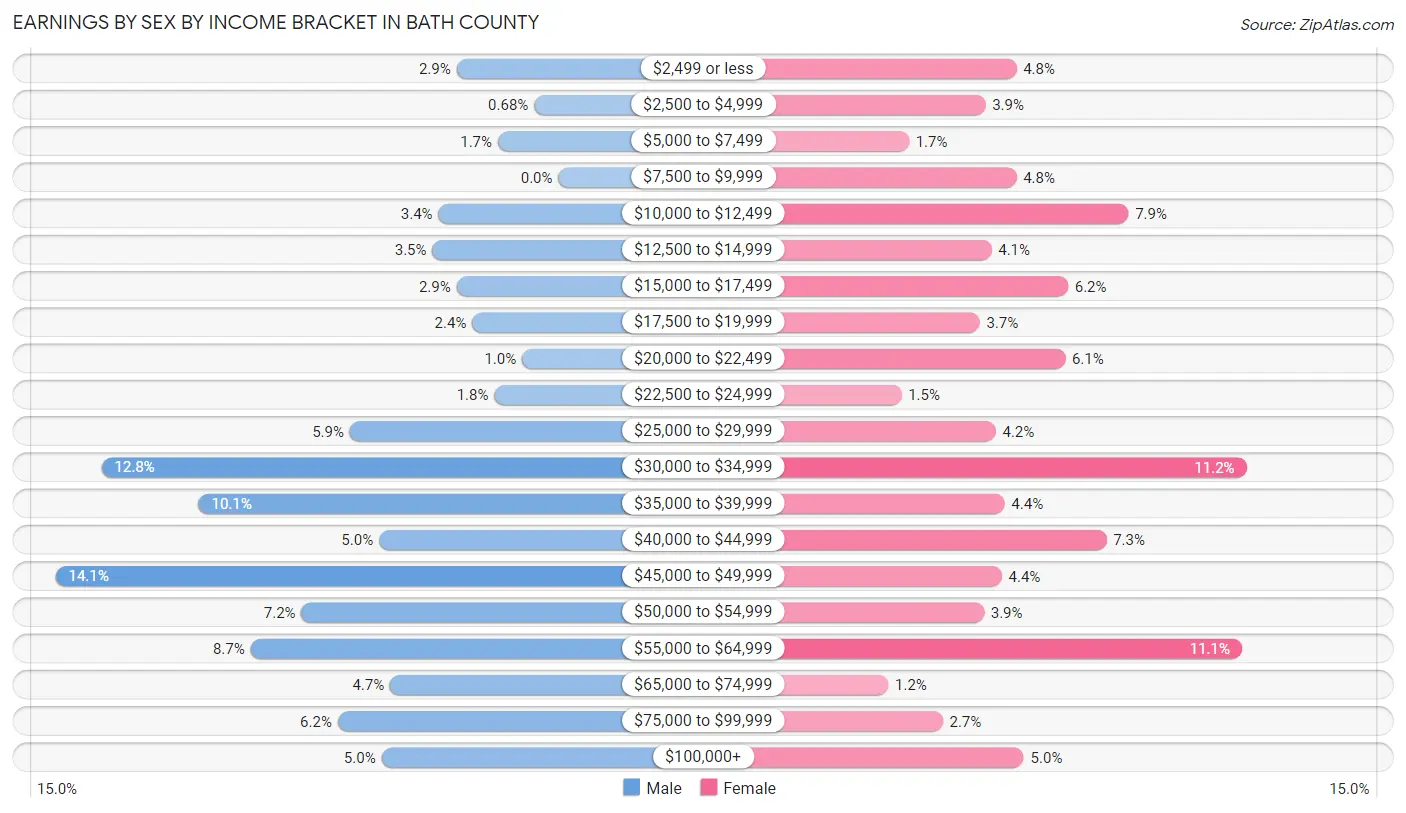
Earnings by Sex by Income Bracket in Bath County
The most common earnings brackets in Bath County are $45,000 to $49,999 for men (415 | 14.1%) and $30,000 to $34,999 for women (271 | 11.2%).
| Income | Male | Female |
| $2,499 or less | 84 (2.9%) | 115 (4.8%) |
| $2,500 to $4,999 | 20 (0.7%) | 94 (3.9%) |
| $5,000 to $7,499 | 50 (1.7%) | 42 (1.7%) |
| $7,500 to $9,999 | 0 (0.0%) | 115 (4.8%) |
| $10,000 to $12,499 | 99 (3.4%) | 191 (7.9%) |
| $12,500 to $14,999 | 104 (3.5%) | 98 (4.1%) |
| $15,000 to $17,499 | 84 (2.9%) | 150 (6.2%) |
| $17,500 to $19,999 | 71 (2.4%) | 90 (3.7%) |
| $20,000 to $22,499 | 30 (1.0%) | 148 (6.1%) |
| $22,500 to $24,999 | 53 (1.8%) | 37 (1.5%) |
| $25,000 to $29,999 | 172 (5.9%) | 101 (4.2%) |
| $30,000 to $34,999 | 377 (12.8%) | 271 (11.2%) |
| $35,000 to $39,999 | 297 (10.1%) | 107 (4.4%) |
| $40,000 to $44,999 | 148 (5.0%) | 176 (7.3%) |
| $45,000 to $49,999 | 415 (14.1%) | 105 (4.3%) |
| $50,000 to $54,999 | 212 (7.2%) | 93 (3.8%) |
| $55,000 to $64,999 | 254 (8.6%) | 268 (11.1%) |
| $65,000 to $74,999 | 139 (4.7%) | 28 (1.2%) |
| $75,000 to $99,999 | 182 (6.2%) | 65 (2.7%) |
| $100,000+ | 146 (5.0%) | 120 (5.0%) |
| Total | 2,937 (100.0%) | 2,414 (100.0%) |
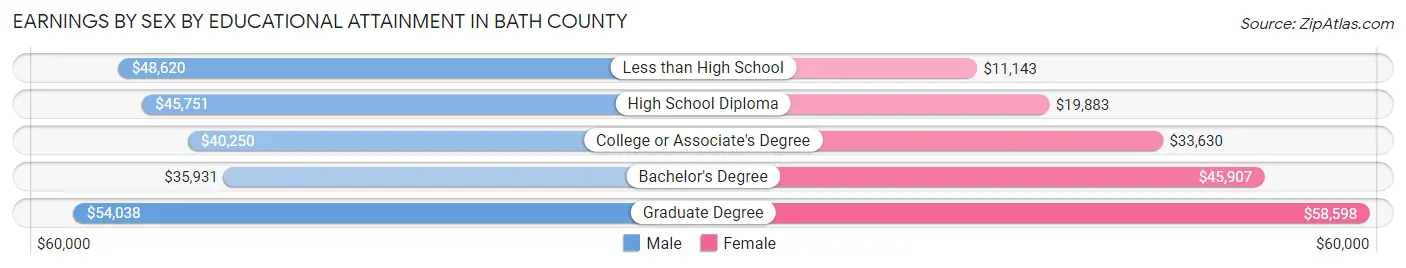
Earnings by Sex by Educational Attainment in Bath County
Average earnings in Bath County are $46,070 for men and $33,105 for women, a difference of 28.1%. Men with an educational attainment of graduate degree enjoy the highest average annual earnings of $54,038, while those with bachelor's degree education earn the least with $35,931. Women with an educational attainment of graduate degree earn the most with the average annual earnings of $58,598, while those with less than high school education have the smallest earnings of $11,143.
| Educational Attainment | Male Income | Female Income |
| Less than High School | $48,620 | $11,143 |
| High School Diploma | $45,751 | $19,883 |
| College or Associate's Degree | $40,250 | $33,630 |
| Bachelor's Degree | $35,931 | $45,907 |
| Graduate Degree | $54,038 | $58,598 |
| Total | $46,070 | $33,105 |
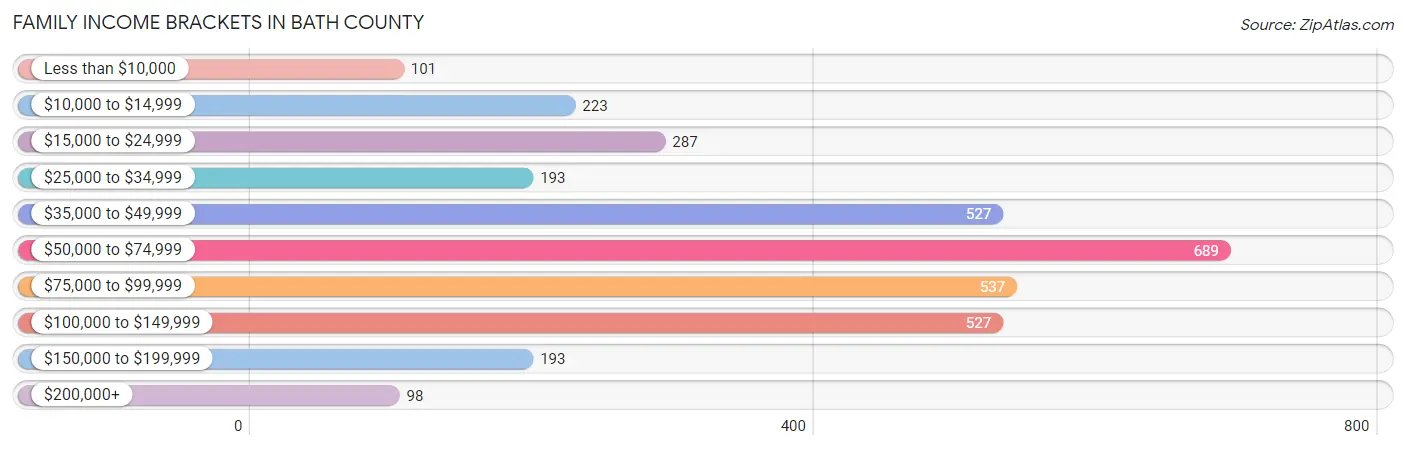
Family Income in Bath County
Family Income Brackets in Bath County
According to the Bath County family income data, there are 689 families falling into the $50,000 to $74,999 income range, which is the most common income bracket and makes up 20.4% of all families. Conversely, the $200,000+ income bracket is the least frequent group with only 98 families (2.9%) belonging to this category.
| Income Bracket | # Families | % Families |
| Less than $10,000 | 101 | 3.0% |
| $10,000 to $14,999 | 223 | 6.6% |
| $15,000 to $24,999 | 287 | 8.5% |
| $25,000 to $34,999 | 193 | 5.7% |
| $35,000 to $49,999 | 527 | 15.6% |
| $50,000 to $74,999 | 689 | 20.4% |
| $75,000 to $99,999 | 537 | 15.9% |
| $100,000 to $149,999 | 527 | 15.6% |
| $150,000 to $199,999 | 193 | 5.7% |
| $200,000+ | 98 | 2.9% |
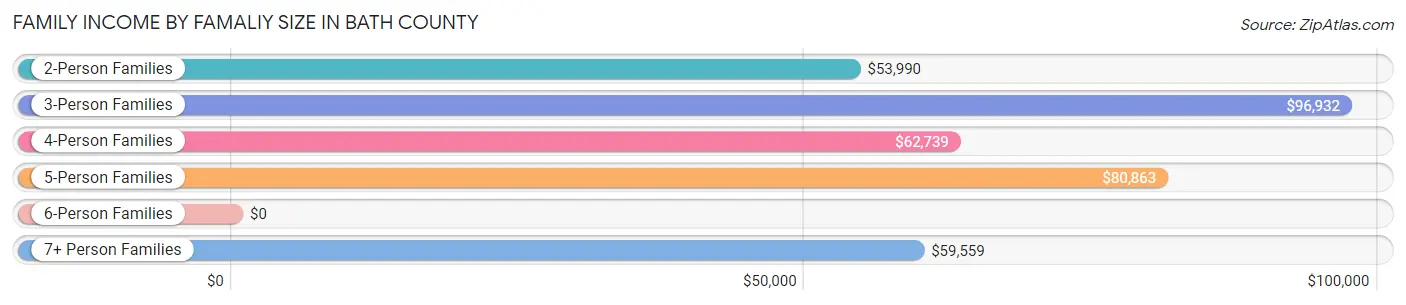
Family Income by Famaliy Size in Bath County
3-person families (808 | 23.9%) account for the highest median family income in Bath County with $96,932 per family, while 3-person families (808 | 23.9%) have the highest median income of $32,311 per family member.
| Income Bracket | # Families | Median Income |
| 2-Person Families | 1,429 (42.3%) | $53,990 |
| 3-Person Families | 808 (23.9%) | $96,932 |
| 4-Person Families | 675 (20.0%) | $62,739 |
| 5-Person Families | 307 (9.1%) | $80,863 |
| 6-Person Families | 74 (2.2%) | $0 |
| 7+ Person Families | 86 (2.5%) | $59,559 |
| Total | 3,379 (100.0%) | $60,313 |
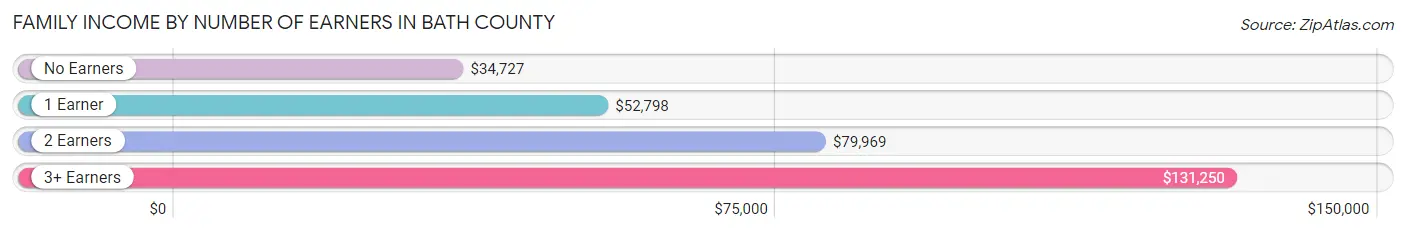
Family Income by Number of Earners in Bath County
The median family income in Bath County is $60,313, with families comprising 3+ earners (251) having the highest median family income of $131,250, while families with no earners (769) have the lowest median family income of $34,727, accounting for 7.4% and 22.8% of families, respectively.
| Number of Earners | # Families | Median Income |
| No Earners | 769 (22.8%) | $34,727 |
| 1 Earner | 1,080 (32.0%) | $52,798 |
| 2 Earners | 1,279 (37.9%) | $79,969 |
| 3+ Earners | 251 (7.4%) | $131,250 |
| Total | 3,379 (100.0%) | $60,313 |
Household Income in Bath County
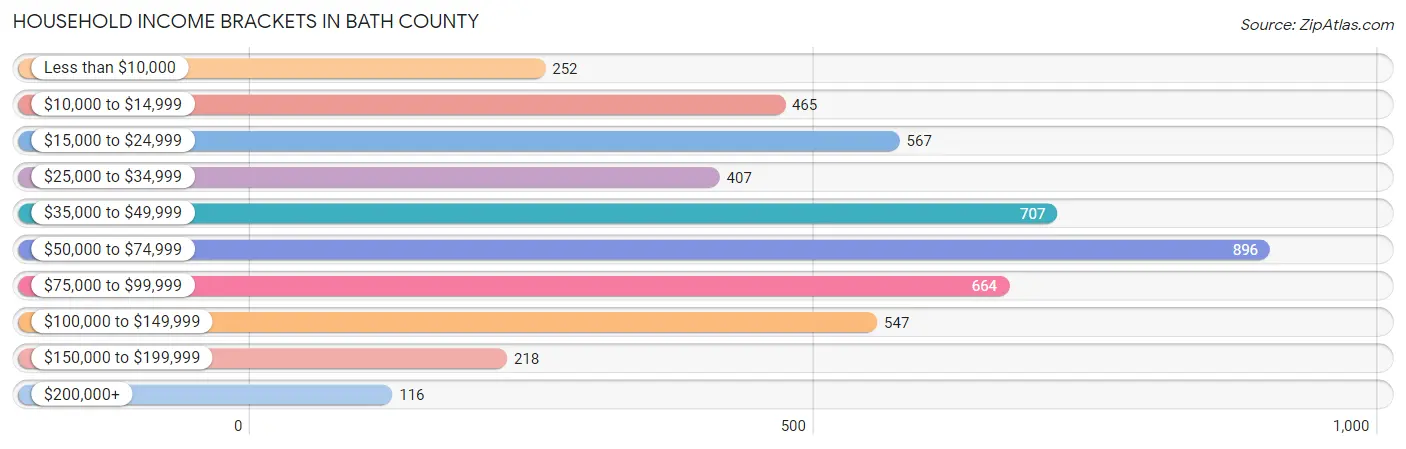
Household Income Brackets in Bath County
With 896 households falling in the category, the $50,000 to $74,999 income range is the most frequent in Bath County, accounting for 18.5% of all households. In contrast, only 116 households (2.4%) fall into the $200,000+ income bracket, making it the least populous group.
| Income Bracket | # Households | % Households |
| Less than $10,000 | 252 | 5.2% |
| $10,000 to $14,999 | 465 | 9.6% |
| $15,000 to $24,999 | 567 | 11.7% |
| $25,000 to $34,999 | 407 | 8.4% |
| $35,000 to $49,999 | 707 | 14.6% |
| $50,000 to $74,999 | 896 | 18.5% |
| $75,000 to $99,999 | 664 | 13.7% |
| $100,000 to $149,999 | 547 | 11.3% |
| $150,000 to $199,999 | 218 | 4.5% |
| $200,000+ | 116 | 2.4% |
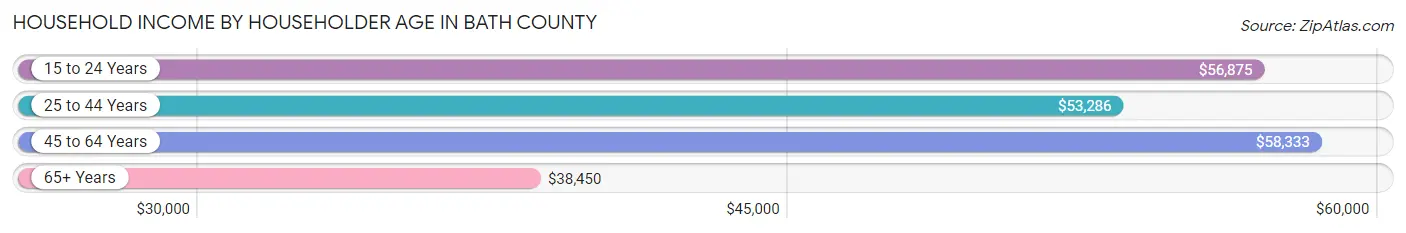
Household Income by Householder Age in Bath County
The median household income in Bath County is $51,471, with the highest median household income of $58,333 found in the 45 to 64 years age bracket for the primary householder. A total of 1,938 households (40.0%) fall into this category. Meanwhile, the 65+ years age bracket for the primary householder has the lowest median household income of $38,450, with 1,354 households (28.0%) in this group.
| Income Bracket | # Households | Median Income |
| 15 to 24 Years | 166 (3.4%) | $56,875 |
| 25 to 44 Years | 1,386 (28.6%) | $53,286 |
| 45 to 64 Years | 1,938 (40.0%) | $58,333 |
| 65+ Years | 1,354 (28.0%) | $38,450 |
| Total | 4,844 (100.0%) | $51,471 |
Poverty in Bath County
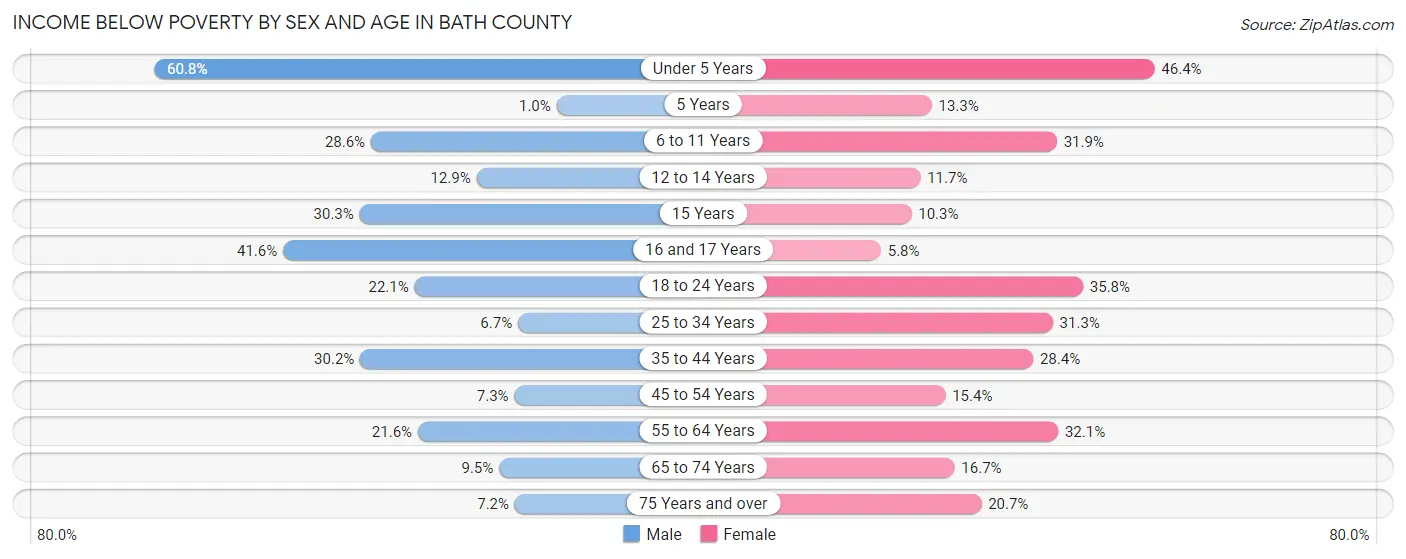
Income Below Poverty by Sex and Age in Bath County
With 20.3% poverty level for males and 26.0% for females among the residents of Bath County, under 5 year old males and under 5 year old females are the most vulnerable to poverty, with 265 males (60.8%) and 188 females (46.4%) in their respective age groups living below the poverty level.
| Age Bracket | Male | Female |
| Under 5 Years | 265 (60.8%) | 188 (46.4%) |
| 5 Years | 2 (1.0%) | 4 (13.3%) |
| 6 to 11 Years | 162 (28.6%) | 164 (31.9%) |
| 12 to 14 Years | 20 (12.9%) | 36 (11.7%) |
| 15 Years | 36 (30.2%) | 13 (10.3%) |
| 16 and 17 Years | 72 (41.6%) | 7 (5.8%) |
| 18 to 24 Years | 124 (22.1%) | 179 (35.8%) |
| 25 to 34 Years | 48 (6.7%) | 222 (31.3%) |
| 35 to 44 Years | 213 (30.2%) | 203 (28.4%) |
| 45 to 54 Years | 59 (7.3%) | 127 (15.4%) |
| 55 to 64 Years | 211 (21.6%) | 269 (32.1%) |
| 65 to 74 Years | 58 (9.5%) | 115 (16.7%) |
| 75 Years and over | 25 (7.2%) | 94 (20.7%) |
| Total | 1,295 (20.3%) | 1,621 (26.0%) |
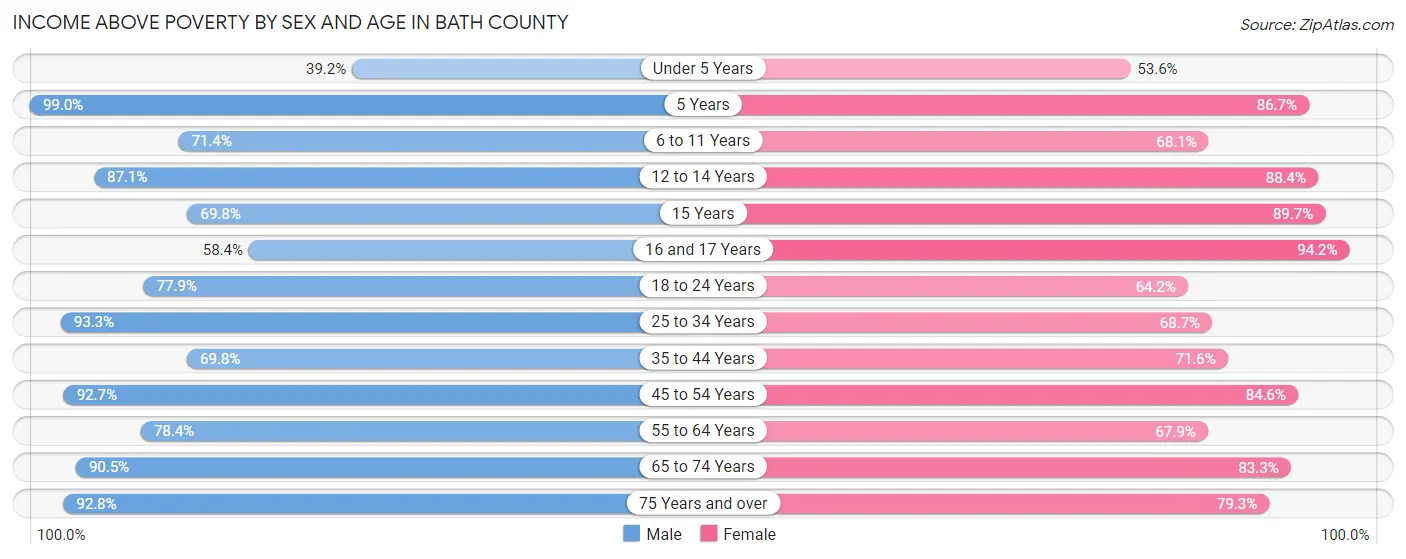
Income Above Poverty by Sex and Age in Bath County
According to the poverty statistics in Bath County, males aged 5 years and females aged 16 and 17 years are the age groups that are most secure financially, with 99.0% of males and 94.2% of females in these age groups living above the poverty line.
| Age Bracket | Male | Female |
| Under 5 Years | 171 (39.2%) | 217 (53.6%) |
| 5 Years | 198 (99.0%) | 26 (86.7%) |
| 6 to 11 Years | 405 (71.4%) | 350 (68.1%) |
| 12 to 14 Years | 135 (87.1%) | 273 (88.3%) |
| 15 Years | 83 (69.8%) | 113 (89.7%) |
| 16 and 17 Years | 101 (58.4%) | 114 (94.2%) |
| 18 to 24 Years | 437 (77.9%) | 321 (64.2%) |
| 25 to 34 Years | 664 (93.3%) | 487 (68.7%) |
| 35 to 44 Years | 493 (69.8%) | 512 (71.6%) |
| 45 to 54 Years | 752 (92.7%) | 700 (84.6%) |
| 55 to 64 Years | 766 (78.4%) | 569 (67.9%) |
| 65 to 74 Years | 550 (90.5%) | 573 (83.3%) |
| 75 Years and over | 322 (92.8%) | 360 (79.3%) |
| Total | 5,077 (79.7%) | 4,615 (74.0%) |
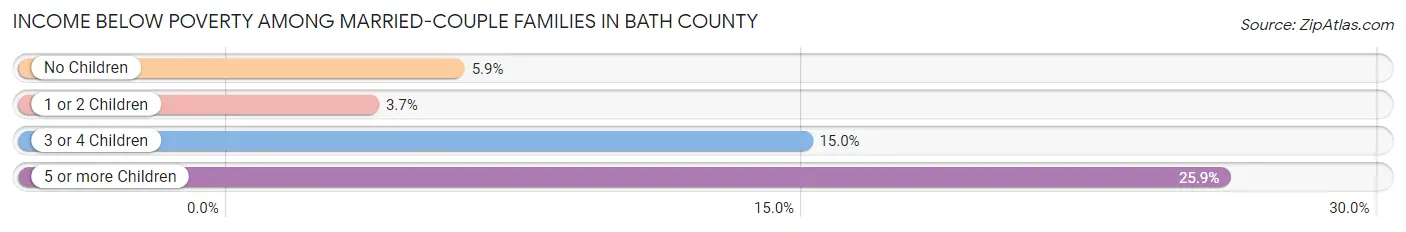
Income Below Poverty Among Married-Couple Families in Bath County
The poverty statistics for married-couple families in Bath County show that 6.4% or 161 of the total 2,518 families live below the poverty line. Families with 5 or more children have the highest poverty rate of 25.9%, comprising of 14 families. On the other hand, families with 1 or 2 children have the lowest poverty rate of 3.7%, which includes 28 families.
| Children | Above Poverty | Below Poverty |
| No Children | 1,415 (94.1%) | 89 (5.9%) |
| 1 or 2 Children | 732 (96.3%) | 28 (3.7%) |
| 3 or 4 Children | 170 (85.0%) | 30 (15.0%) |
| 5 or more Children | 40 (74.1%) | 14 (25.9%) |
| Total | 2,357 (93.6%) | 161 (6.4%) |
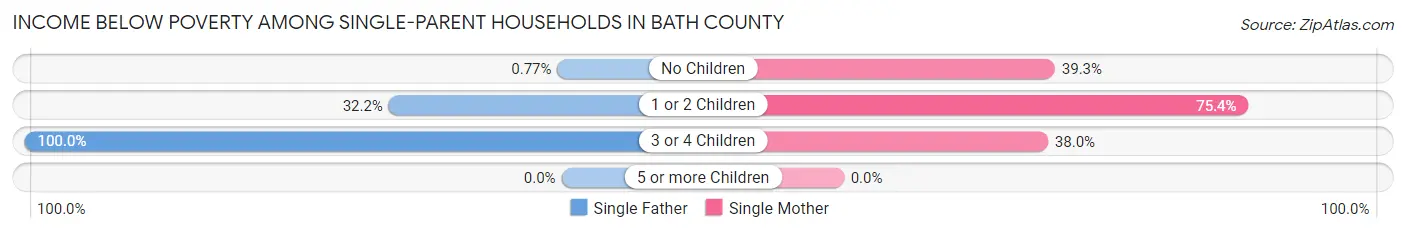
Income Below Poverty Among Single-Parent Households in Bath County
According to the poverty data in Bath County, 20.0% or 47 single-father households and 58.6% or 367 single-mother households are living below the poverty line. Among single-father households, those with 3 or 4 children have the highest poverty rate, with 18 households (100.0%) experiencing poverty. Likewise, among single-mother households, those with 1 or 2 children have the highest poverty rate, with 257 households (75.4%) falling below the poverty line.
| Children | Single Father | Single Mother |
| No Children | 1 (0.8%) | 48 (39.3%) |
| 1 or 2 Children | 28 (32.2%) | 257 (75.4%) |
| 3 or 4 Children | 18 (100.0%) | 62 (38.0%) |
| 5 or more Children | 0 (0.0%) | 0 (0.0%) |
| Total | 47 (20.0%) | 367 (58.6%) |
Income Below Poverty Among Married-Couple vs Single-Parent Households in Bath County
The poverty data for Bath County shows that 161 of the married-couple family households (6.4%) and 414 of the single-parent households (48.1%) are living below the poverty level. Within the married-couple family households, those with 5 or more children have the highest poverty rate, with 14 households (25.9%) falling below the poverty line. Among the single-parent households, those with 1 or 2 children have the highest poverty rate, with 285 household (66.6%) living below poverty.
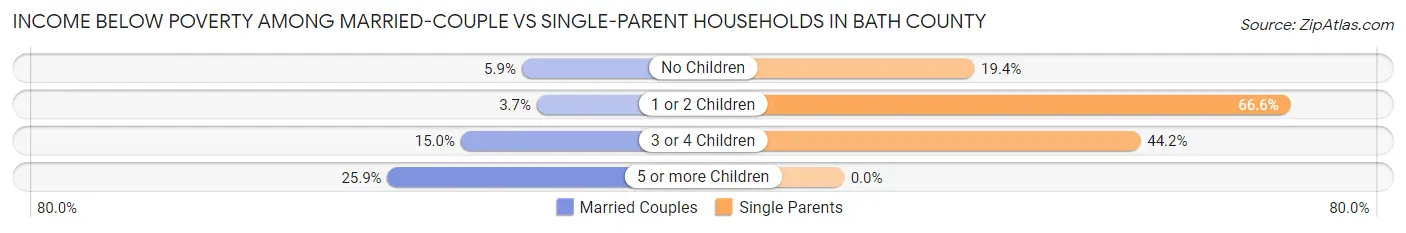
| Children | Married-Couple Families | Single-Parent Households |
| No Children | 89 (5.9%) | 49 (19.4%) |
| 1 or 2 Children | 28 (3.7%) | 285 (66.6%) |
| 3 or 4 Children | 30 (15.0%) | 80 (44.2%) |
| 5 or more Children | 14 (25.9%) | 0 (0.0%) |
| Total | 161 (6.4%) | 414 (48.1%) |
Race in Bath County
The most populous races in Bath County are White / Caucasian (12,170 | 95.5%), Hispanic or Latino (228 | 1.8%), and Black / African American (216 | 1.7%).
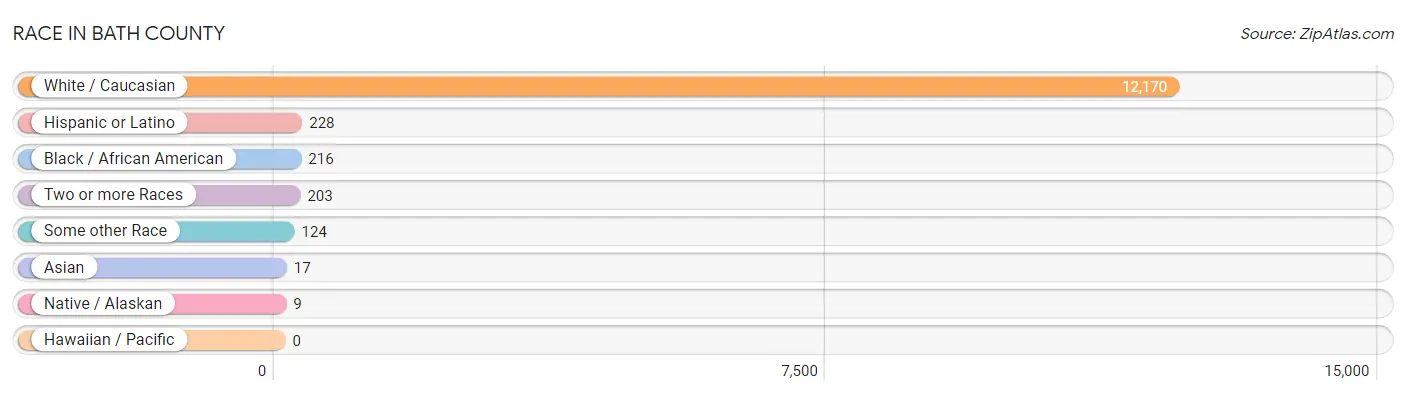
| Race | # Population | % Population |
| Asian | 17 | 0.1% |
| Black / African American | 216 | 1.7% |
| Hawaiian / Pacific | 0 | 0.0% |
| Hispanic or Latino | 228 | 1.8% |
| Native / Alaskan | 9 | 0.1% |
| White / Caucasian | 12,170 | 95.5% |
| Two or more Races | 203 | 1.6% |
| Some other Race | 124 | 1.0% |
| Total | 12,739 | 100.0% |
Ancestry in Bath County
The most populous ancestries reported in Bath County are American (4,504 | 35.4%), Irish (1,465 | 11.5%), English (1,107 | 8.7%), German (1,013 | 8.0%), and Mexican (211 | 1.7%), together accounting for 65.2% of all Bath County residents.
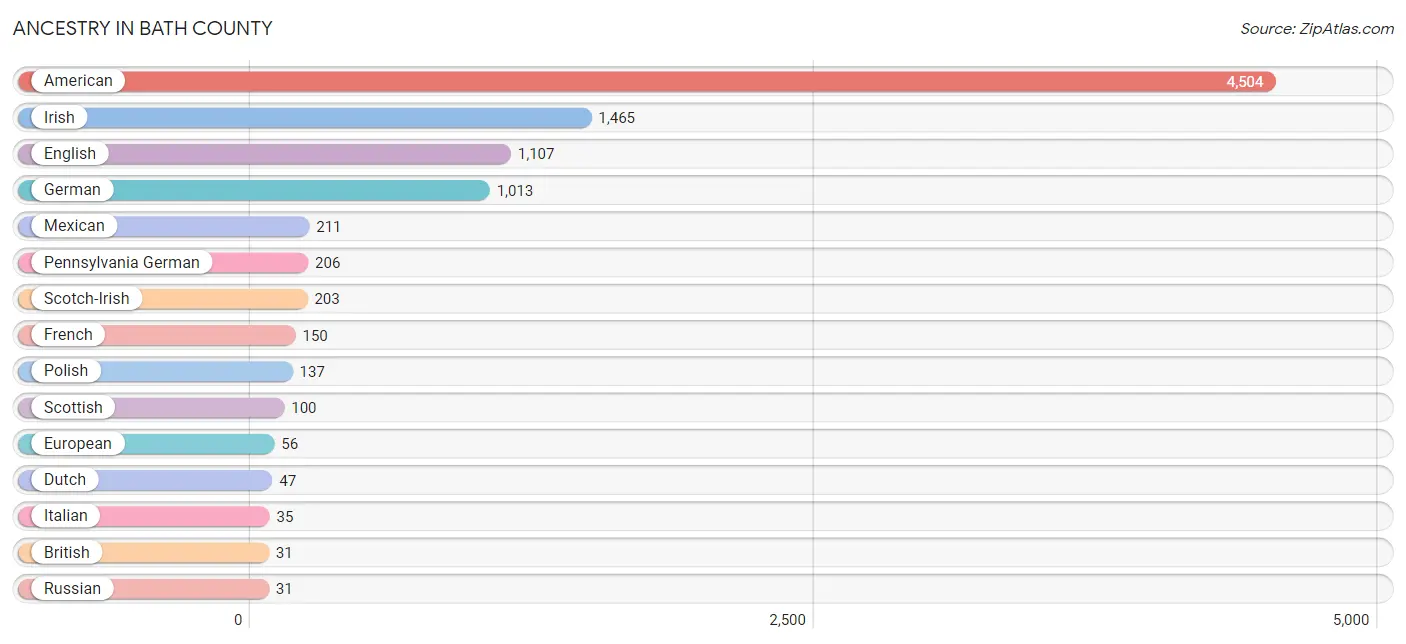
| Ancestry | # Population | % Population |
| American | 4,504 | 35.4% |
| Blackfeet | 5 | 0.0% |
| British | 31 | 0.2% |
| Burmese | 23 | 0.2% |
| Cherokee | 28 | 0.2% |
| Dutch | 47 | 0.4% |
| English | 1,107 | 8.7% |
| European | 56 | 0.4% |
| French | 150 | 1.2% |
| German | 1,013 | 8.0% |
| Irish | 1,465 | 11.5% |
| Iroquois | 3 | 0.0% |
| Italian | 35 | 0.3% |
| Mexican | 211 | 1.7% |
| Mexican American Indian | 6 | 0.1% |
| Norwegian | 17 | 0.1% |
| Pennsylvania German | 206 | 1.6% |
| Polish | 137 | 1.1% |
| Russian | 31 | 0.2% |
| Scandinavian | 4 | 0.0% |
| Scotch-Irish | 203 | 1.6% |
| Scottish | 100 | 0.8% |
| Swedish | 28 | 0.2% |
| Swiss | 31 | 0.2% |
| Tohono O'Odham | 3 | 0.0% |
| Welsh | 19 | 0.2% | View All 26 Rows |
Immigrants in Bath County
The most numerous immigrant groups reported in Bath County came from Central America (16 | 0.1%), Latin America (16 | 0.1%), Mexico (16 | 0.1%), Africa (10 | 0.1%), and Middle Africa (10 | 0.1%), together accounting for 0.6% of all Bath County residents.
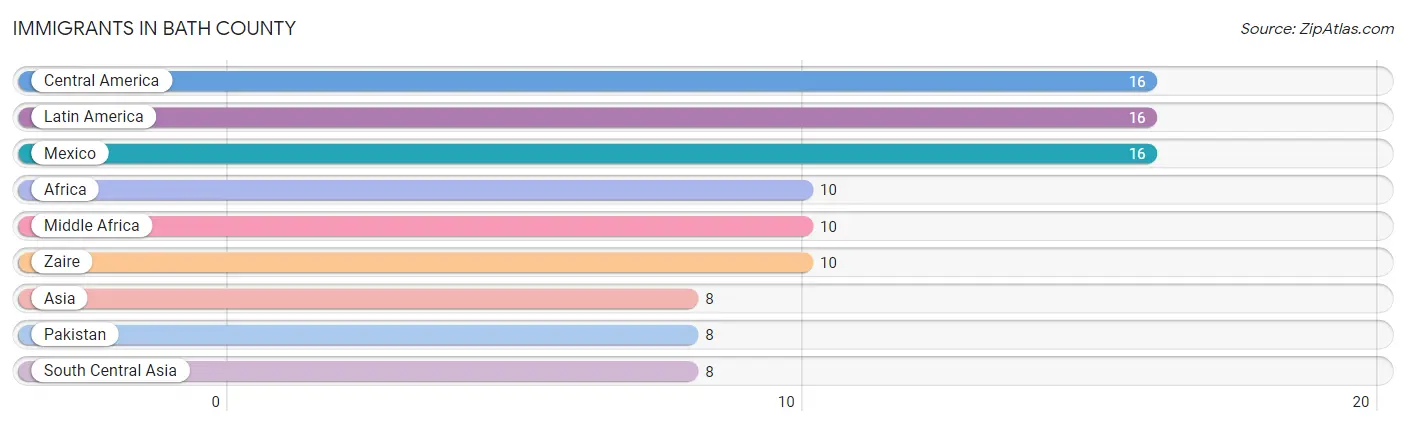
| Immigration Origin | # Population | % Population |
| Africa | 10 | 0.1% |
| Asia | 8 | 0.1% |
| Central America | 16 | 0.1% |
| Latin America | 16 | 0.1% |
| Mexico | 16 | 0.1% |
| Middle Africa | 10 | 0.1% |
| Pakistan | 8 | 0.1% |
| South Central Asia | 8 | 0.1% |
| Zaire | 10 | 0.1% | View All 9 Rows |
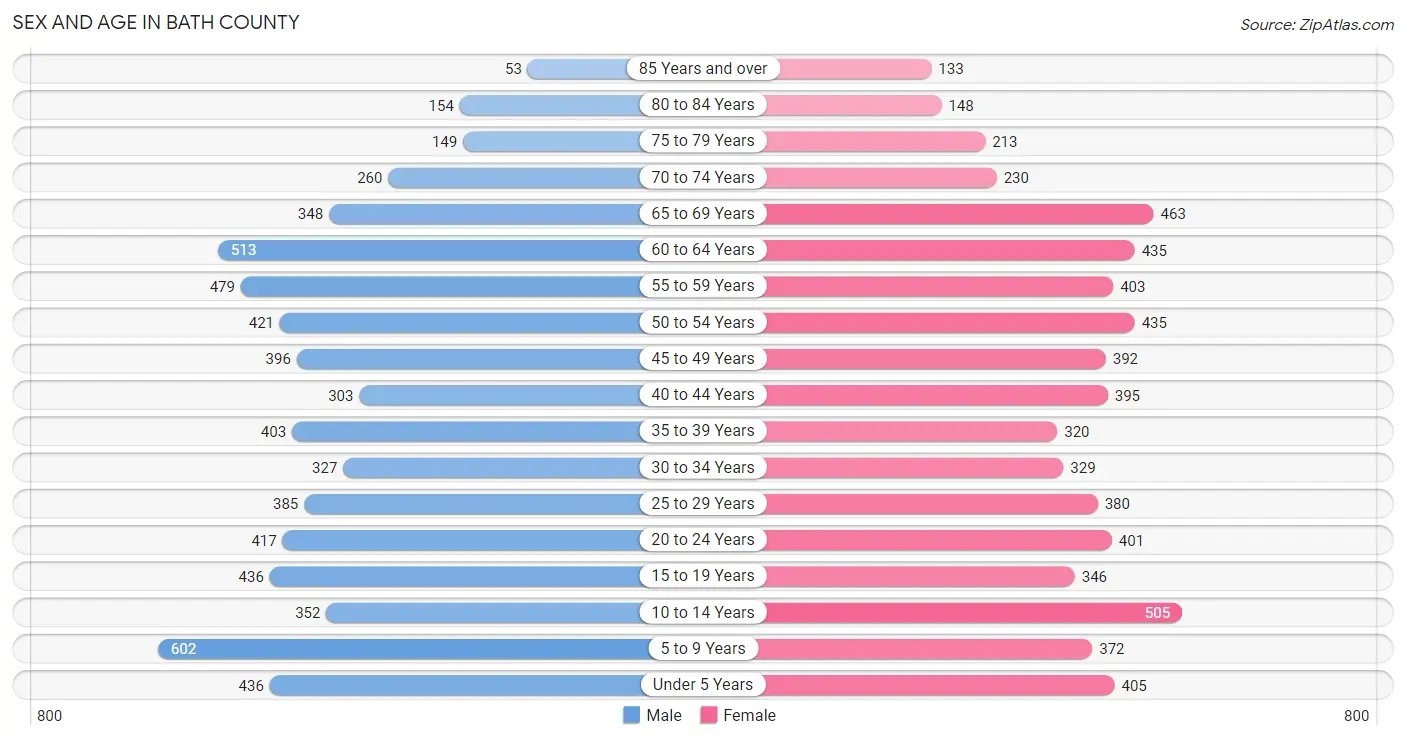
Sex and Age in Bath County
Sex and Age in Bath County
The most populous age groups in Bath County are 5 to 9 Years (602 | 9.4%) for men and 10 to 14 Years (505 | 8.0%) for women.
| Age Bracket | Male | Female |
| Under 5 Years | 436 (6.8%) | 405 (6.4%) |
| 5 to 9 Years | 602 (9.4%) | 372 (5.9%) |
| 10 to 14 Years | 352 (5.5%) | 505 (8.0%) |
| 15 to 19 Years | 436 (6.8%) | 346 (5.5%) |
| 20 to 24 Years | 417 (6.5%) | 401 (6.4%) |
| 25 to 29 Years | 385 (6.0%) | 380 (6.0%) |
| 30 to 34 Years | 327 (5.1%) | 329 (5.2%) |
| 35 to 39 Years | 403 (6.3%) | 320 (5.1%) |
| 40 to 44 Years | 303 (4.7%) | 395 (6.3%) |
| 45 to 49 Years | 396 (6.1%) | 392 (6.2%) |
| 50 to 54 Years | 421 (6.5%) | 435 (6.9%) |
| 55 to 59 Years | 479 (7.4%) | 403 (6.4%) |
| 60 to 64 Years | 513 (8.0%) | 435 (6.9%) |
| 65 to 69 Years | 348 (5.4%) | 463 (7.3%) |
| 70 to 74 Years | 260 (4.0%) | 230 (3.6%) |
| 75 to 79 Years | 149 (2.3%) | 213 (3.4%) |
| 80 to 84 Years | 154 (2.4%) | 148 (2.4%) |
| 85 Years and over | 53 (0.8%) | 133 (2.1%) |
| Total | 6,434 (100.0%) | 6,305 (100.0%) |
Families and Households in Bath County
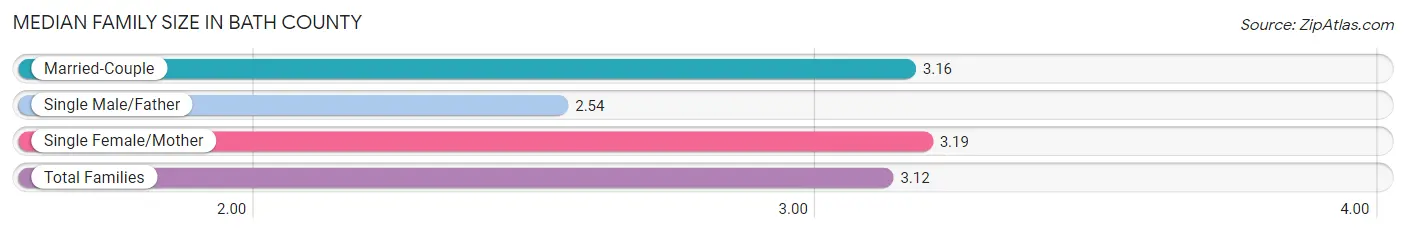
Median Family Size in Bath County
The median family size in Bath County is 3.12 persons per family, with single female/mother families (626 | 18.5%) accounting for the largest median family size of 3.19 persons per family. On the other hand, single male/father families (235 | 7.0%) represent the smallest median family size with 2.54 persons per family.
| Family Type | # Families | Family Size |
| Married-Couple | 2,518 (74.5%) | 3.16 |
| Single Male/Father | 235 (7.0%) | 2.54 |
| Single Female/Mother | 626 (18.5%) | 3.19 |
| Total Families | 3,379 (100.0%) | 3.12 |
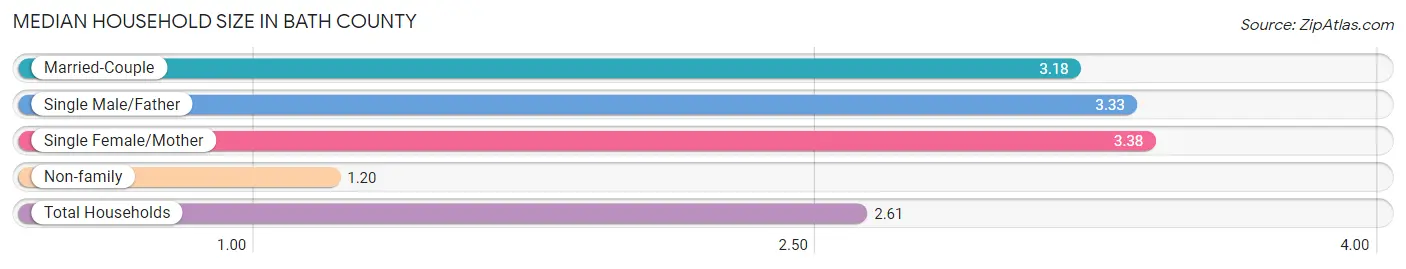
Median Household Size in Bath County
The median household size in Bath County is 2.61 persons per household, with single female/mother households (626 | 12.9%) accounting for the largest median household size of 3.38 persons per household. non-family households (1,465 | 30.2%) represent the smallest median household size with 1.20 persons per household.
| Household Type | # Households | Household Size |
| Married-Couple | 2,518 (52.0%) | 3.18 |
| Single Male/Father | 235 (4.9%) | 3.33 |
| Single Female/Mother | 626 (12.9%) | 3.38 |
| Non-family | 1,465 (30.2%) | 1.20 |
| Total Households | 4,844 (100.0%) | 2.61 |
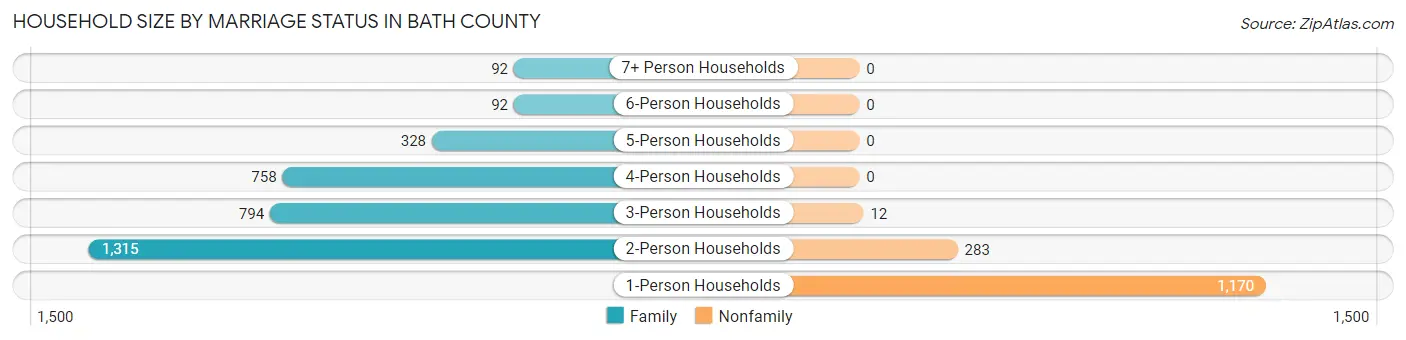
Household Size by Marriage Status in Bath County
Out of a total of 4,844 households in Bath County, 3,379 (69.8%) are family households, while 1,465 (30.2%) are nonfamily households. The most numerous type of family households are 2-person households, comprising 1,315, and the most common type of nonfamily households are 1-person households, comprising 1,170.
| Household Size | Family Households | Nonfamily Households |
| 1-Person Households | - | 1,170 (24.1%) |
| 2-Person Households | 1,315 (27.2%) | 283 (5.8%) |
| 3-Person Households | 794 (16.4%) | 12 (0.3%) |
| 4-Person Households | 758 (15.7%) | 0 (0.0%) |
| 5-Person Households | 328 (6.8%) | 0 (0.0%) |
| 6-Person Households | 92 (1.9%) | 0 (0.0%) |
| 7+ Person Households | 92 (1.9%) | 0 (0.0%) |
| Total | 3,379 (69.8%) | 1,465 (30.2%) |
Female Fertility in Bath County
Fertility by Age in Bath County
Average fertility rate in Bath County is 57.0 births per 1,000 women. Women in the age bracket of 20 to 34 years have the highest fertility rate with 82.0 births per 1,000 women. Women in the age bracket of 20 to 34 years acount for 60.7% of all women with births.
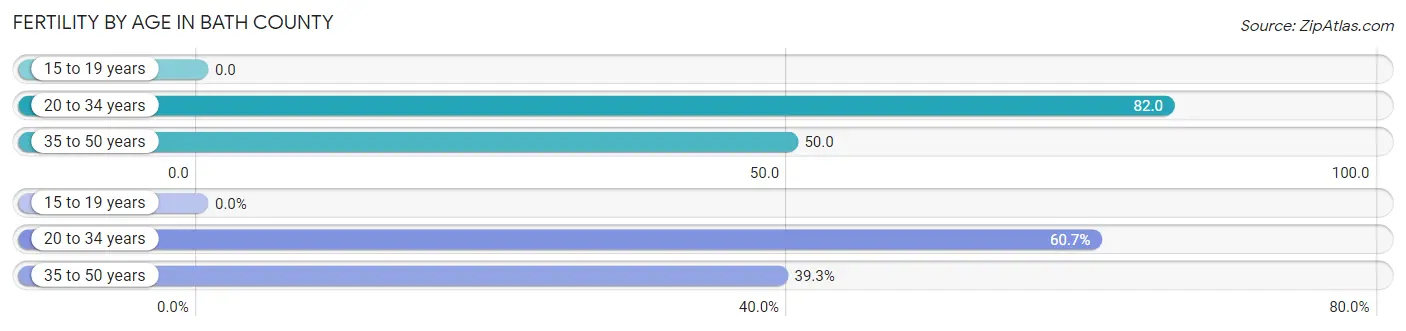
| Age Bracket | Women with Births | Births / 1,000 Women |
| 15 to 19 years | 0 (0.0%) | 0.0 |
| 20 to 34 years | 91 (60.7%) | 82.0 |
| 35 to 50 years | 59 (39.3%) | 50.0 |
| Total | 150 (100.0%) | 57.0 |
Fertility by Age by Marriage Status in Bath County
68.7% of women with births (150) in Bath County are married. The highest percentage of unmarried women with births falls into 20 to 34 years age bracket with 51.6% of them unmarried at the time of birth, while the lowest percentage of unmarried women with births belong to 35 to 50 years age bracket with 0.0% of them unmarried.
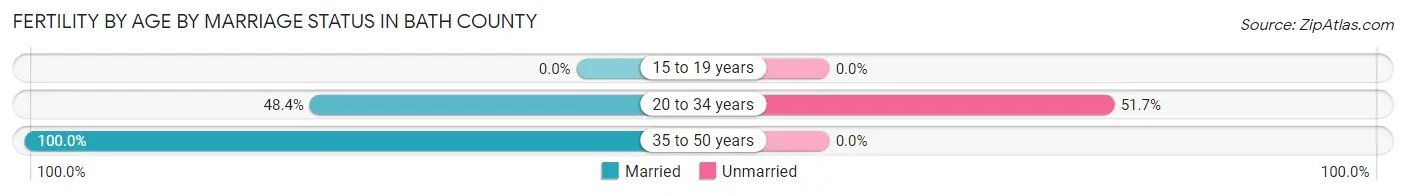
| Age Bracket | Married | Unmarried |
| 15 to 19 years | 0 (0.0%) | 0 (0.0%) |
| 20 to 34 years | 44 (48.3%) | 47 (51.6%) |
| 35 to 50 years | 59 (100.0%) | 0 (0.0%) |
| Total | 103 (68.7%) | 47 (31.3%) |
Fertility by Education in Bath County
Average fertility rate in Bath County is 57.0 births per 1,000 women. Women with the education attainment of less than high school have the highest fertility rate of 124.0 births per 1,000 women, while women with the education attainment of high school diploma have the lowest fertility at 20.0 births per 1,000 women. Women with the education attainment of college or associate's degree represent 41.3% of all women with births.
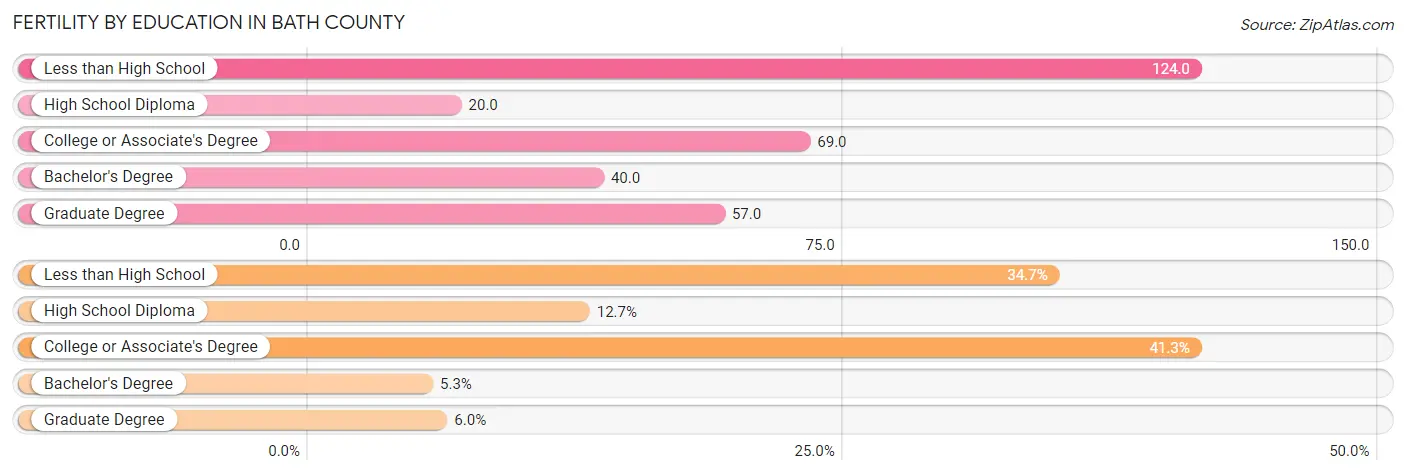
| Educational Attainment | Women with Births | Births / 1,000 Women |
| Less than High School | 52 (34.7%) | 124.0 |
| High School Diploma | 19 (12.7%) | 20.0 |
| College or Associate's Degree | 62 (41.3%) | 69.0 |
| Bachelor's Degree | 8 (5.3%) | 40.0 |
| Graduate Degree | 9 (6.0%) | 57.0 |
| Total | 150 (100.0%) | 57.0 |
Fertility by Education by Marriage Status in Bath County
31.3% of women with births in Bath County are unmarried. Women with the educational attainment of less than high school are most likely to be married with 100.0% of them married at childbirth, while women with the educational attainment of college or associate's degree are least likely to be married with 71.0% of them unmarried at childbirth.
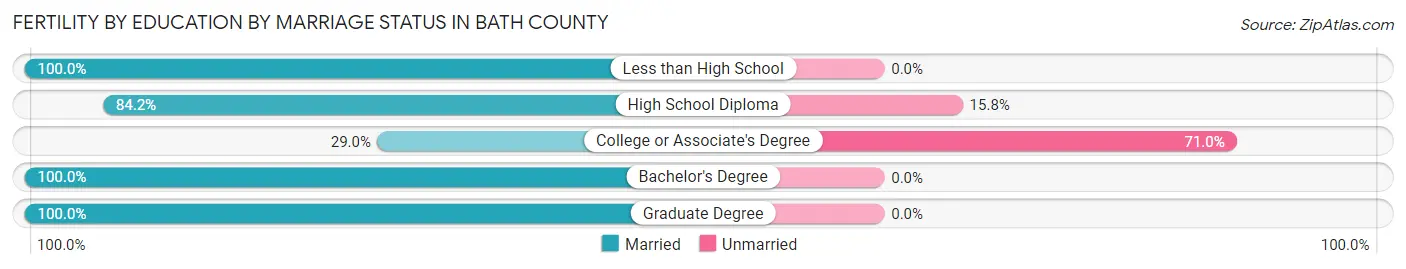
| Educational Attainment | Married | Unmarried |
| Less than High School | 52 (100.0%) | 0 (0.0%) |
| High School Diploma | 16 (84.2%) | 3 (15.8%) |
| College or Associate's Degree | 18 (29.0%) | 44 (71.0%) |
| Bachelor's Degree | 8 (100.0%) | 0 (0.0%) |
| Graduate Degree | 9 (100.0%) | 0 (0.0%) |
| Total | 103 (68.7%) | 47 (31.3%) |
Employment Characteristics in Bath County
Employment by Class of Employer in Bath County
Among the 4,661 employed individuals in Bath County, private company employees (3,284 | 70.5%), state government employees (335 | 7.2%), and self-employed (not incorporated) (328 | 7.0%) make up the most common classes of employment.
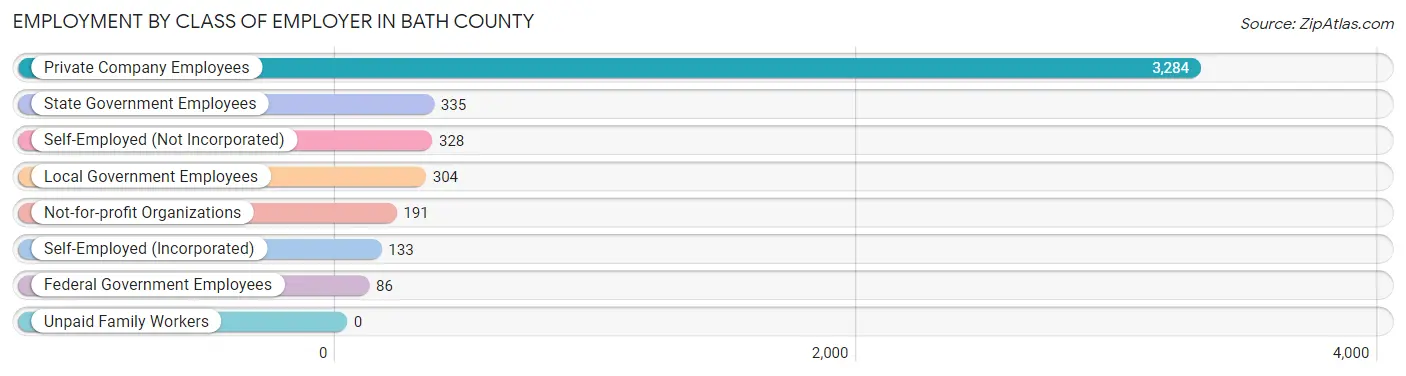
| Employer Class | # Employees | % Employees |
| Private Company Employees | 3,284 | 70.5% |
| Self-Employed (Incorporated) | 133 | 2.9% |
| Self-Employed (Not Incorporated) | 328 | 7.0% |
| Not-for-profit Organizations | 191 | 4.1% |
| Local Government Employees | 304 | 6.5% |
| State Government Employees | 335 | 7.2% |
| Federal Government Employees | 86 | 1.8% |
| Unpaid Family Workers | 0 | 0.0% |
| Total | 4,661 | 100.0% |
Employment Status by Age in Bath County
According to the labor force statistics for Bath County, out of the total population over 16 years of age (9,822), 51.0% or 5,009 individuals are in the labor force, with 2.9% or 145 of them unemployed. The age group with the highest labor force participation rate is 20 to 24 years, with 78.5% or 642 individuals in the labor force. Within the labor force, the 16 to 19 years age range has the highest percentage of unemployed individuals, with 22.1% or 33 of them being unemployed.
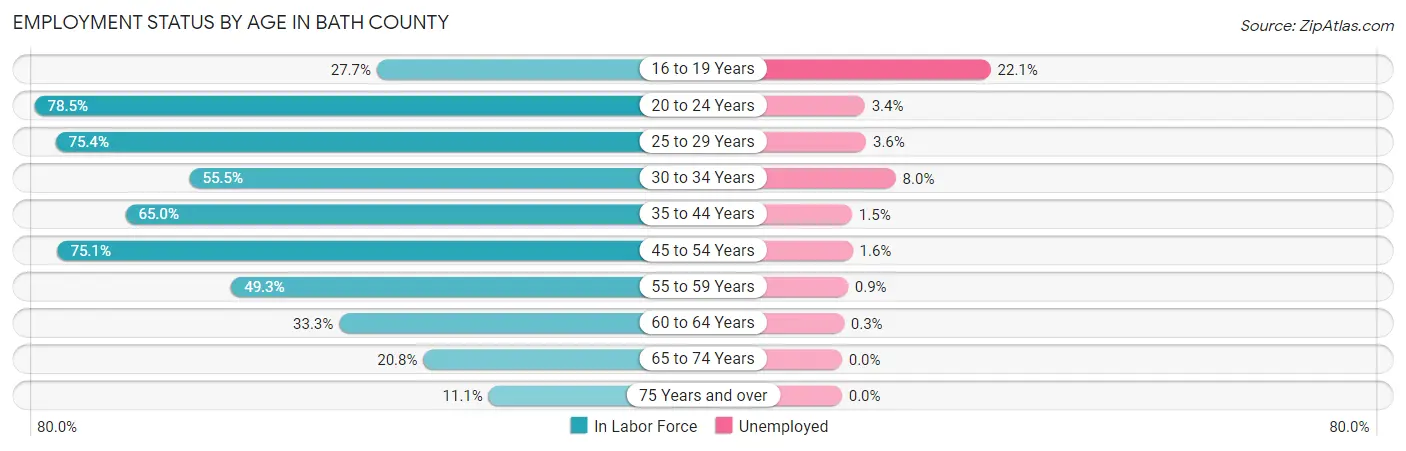
| Age Bracket | In Labor Force | Unemployed |
| 16 to 19 Years | 149 (27.7%) | 33 (22.1%) |
| 20 to 24 Years | 642 (78.5%) | 22 (3.4%) |
| 25 to 29 Years | 577 (75.4%) | 21 (3.6%) |
| 30 to 34 Years | 364 (55.5%) | 29 (8.0%) |
| 35 to 44 Years | 924 (65.0%) | 14 (1.5%) |
| 45 to 54 Years | 1,235 (75.1%) | 20 (1.6%) |
| 55 to 59 Years | 435 (49.3%) | 4 (0.9%) |
| 60 to 64 Years | 316 (33.3%) | 1 (0.3%) |
| 65 to 74 Years | 271 (20.8%) | 0 (0.0%) |
| 75 Years and over | 94 (11.1%) | 0 (0.0%) |
| Total | 5,009 (51.0%) | 145 (2.9%) |
Employment Status by Educational Attainment in Bath County
According to labor force statistics for Bath County, 61.0% of individuals (3,853) out of the total population between 25 and 64 years of age (6,316) are in the labor force, with 2.3% or 89 of them being unemployed. The group with the highest labor force participation rate are those with the educational attainment of bachelor's degree or higher, with 81.1% or 756 individuals in the labor force. Within the labor force, individuals with college / associate degree education have the highest percentage of unemployment, with 4.2% or 42 of them being unemployed.
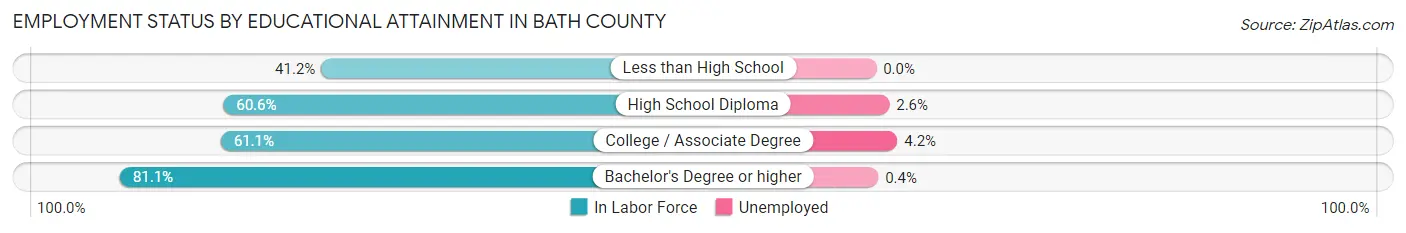
| Educational Attainment | In Labor Force | Unemployed |
| Less than High School | 379 (41.2%) | 0 (0.0%) |
| High School Diploma | 1,720 (60.6%) | 74 (2.6%) |
| College / Associate Degree | 993 (61.1%) | 68 (4.2%) |
| Bachelor's Degree or higher | 756 (81.1%) | 4 (0.4%) |
| Total | 3,853 (61.0%) | 145 (2.3%) |
Employment Occupations by Sex in Bath County
Management, Business, Science and Arts Occupations
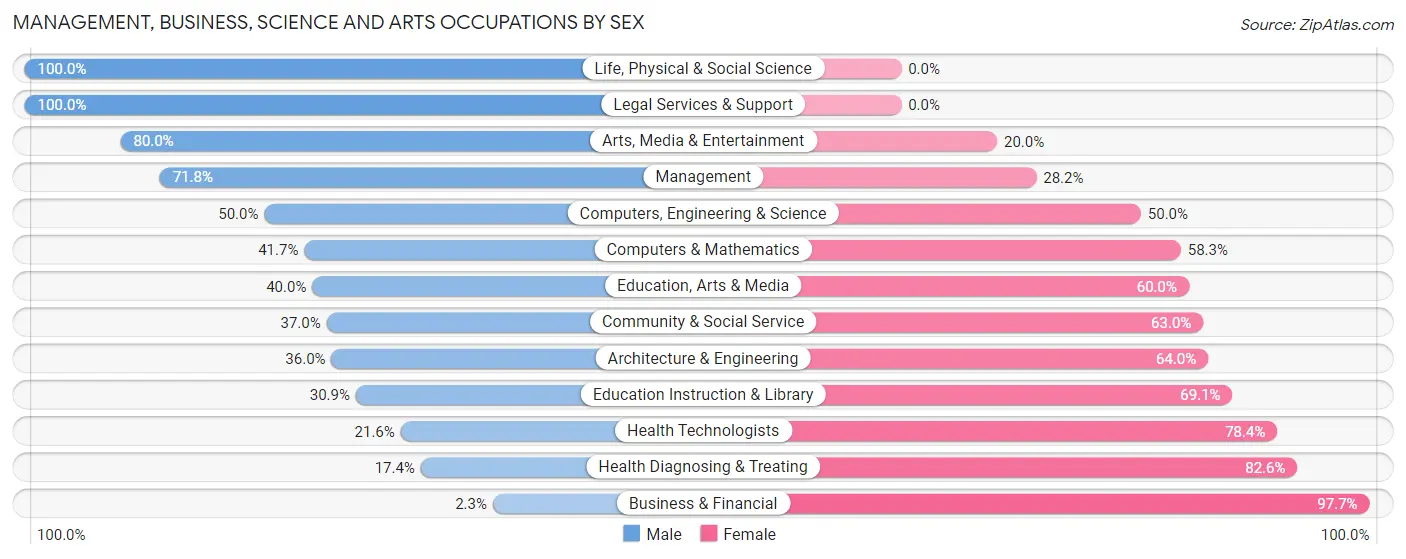
The most common Management, Business, Science and Arts occupations in Bath County are Management (493 | 10.1%), Community & Social Service (308 | 6.3%), Health Diagnosing & Treating (236 | 4.9%), Health Technologists (167 | 3.4%), and Education Instruction & Library (165 | 3.4%).
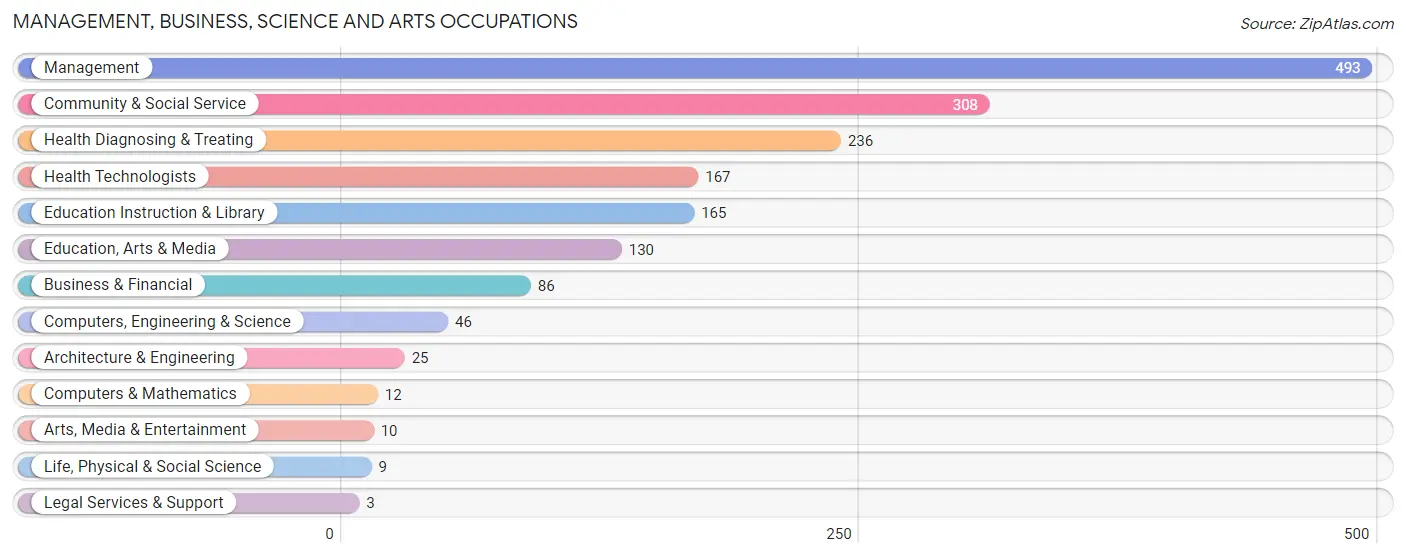
Management, Business, Science and Arts Occupations by Sex
Within the Management, Business, Science and Arts occupations in Bath County, the most male-oriented occupations are Life, Physical & Social Science (100.0%), Legal Services & Support (100.0%), and Arts, Media & Entertainment (80.0%), while the most female-oriented occupations are Business & Financial (97.7%), Health Diagnosing & Treating (82.6%), and Health Technologists (78.4%).
| Occupation | Male | Female |
| Management | 354 (71.8%) | 139 (28.2%) |
| Business & Financial | 2 (2.3%) | 84 (97.7%) |
| Computers, Engineering & Science | 23 (50.0%) | 23 (50.0%) |
| Computers & Mathematics | 5 (41.7%) | 7 (58.3%) |
| Architecture & Engineering | 9 (36.0%) | 16 (64.0%) |
| Life, Physical & Social Science | 9 (100.0%) | 0 (0.0%) |
| Community & Social Service | 114 (37.0%) | 194 (63.0%) |
| Education, Arts & Media | 52 (40.0%) | 78 (60.0%) |
| Legal Services & Support | 3 (100.0%) | 0 (0.0%) |
| Education Instruction & Library | 51 (30.9%) | 114 (69.1%) |
| Arts, Media & Entertainment | 8 (80.0%) | 2 (20.0%) |
| Health Diagnosing & Treating | 41 (17.4%) | 195 (82.6%) |
| Health Technologists | 36 (21.6%) | 131 (78.4%) |
| Total (Category) | 534 (45.7%) | 635 (54.3%) |
| Total (Overall) | 2,751 (56.6%) | 2,111 (43.4%) |
Services Occupations
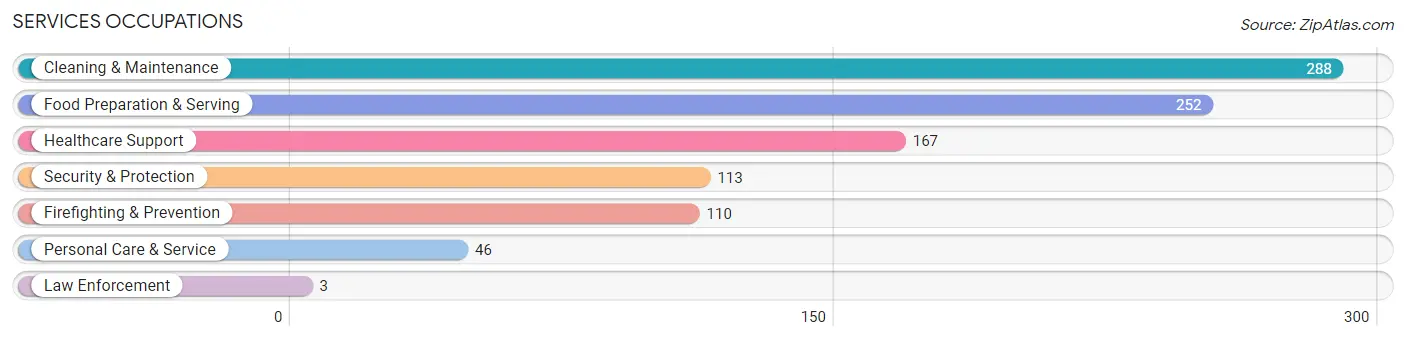
The most common Services occupations in Bath County are Cleaning & Maintenance (288 | 5.9%), Food Preparation & Serving (252 | 5.2%), Healthcare Support (167 | 3.4%), Security & Protection (113 | 2.3%), and Firefighting & Prevention (110 | 2.3%).
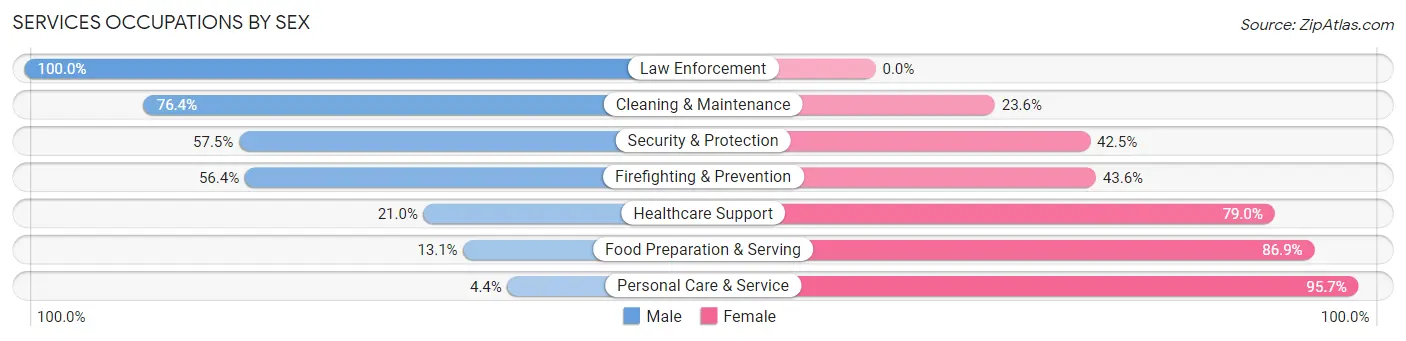
Services Occupations by Sex
Within the Services occupations in Bath County, the most male-oriented occupations are Law Enforcement (100.0%), Cleaning & Maintenance (76.4%), and Security & Protection (57.5%), while the most female-oriented occupations are Personal Care & Service (95.7%), Food Preparation & Serving (86.9%), and Healthcare Support (79.0%).
| Occupation | Male | Female |
| Healthcare Support | 35 (21.0%) | 132 (79.0%) |
| Security & Protection | 65 (57.5%) | 48 (42.5%) |
| Firefighting & Prevention | 62 (56.4%) | 48 (43.6%) |
| Law Enforcement | 3 (100.0%) | 0 (0.0%) |
| Food Preparation & Serving | 33 (13.1%) | 219 (86.9%) |
| Cleaning & Maintenance | 220 (76.4%) | 68 (23.6%) |
| Personal Care & Service | 2 (4.3%) | 44 (95.7%) |
| Total (Category) | 355 (41.0%) | 511 (59.0%) |
| Total (Overall) | 2,751 (56.6%) | 2,111 (43.4%) |
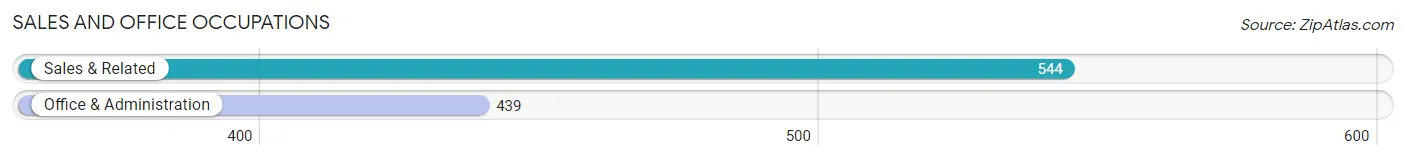
Sales and Office Occupations
The most common Sales and Office occupations in Bath County are Sales & Related (544 | 11.2%), and Office & Administration (439 | 9.0%).
Sales and Office Occupations by Sex
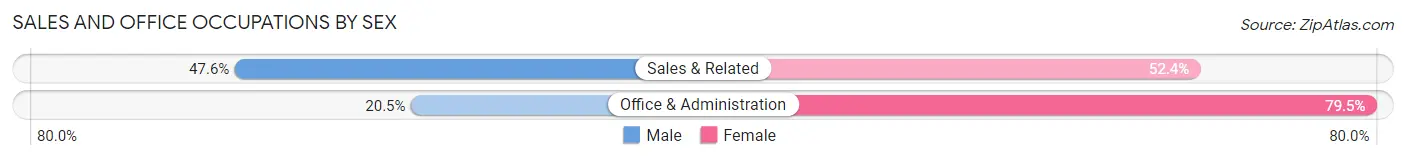
| Occupation | Male | Female |
| Sales & Related | 259 (47.6%) | 285 (52.4%) |
| Office & Administration | 90 (20.5%) | 349 (79.5%) |
| Total (Category) | 349 (35.5%) | 634 (64.5%) |
| Total (Overall) | 2,751 (56.6%) | 2,111 (43.4%) |
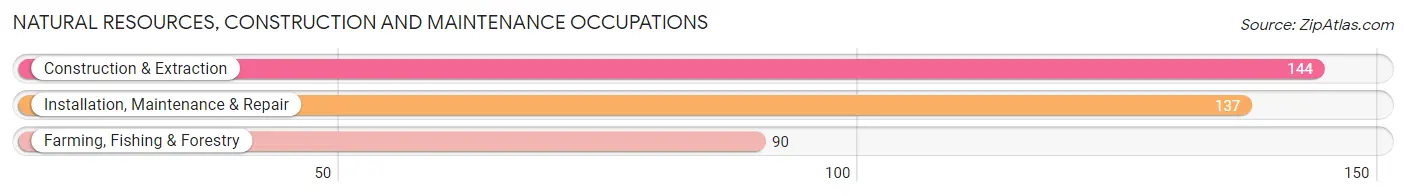
Natural Resources, Construction and Maintenance Occupations
The most common Natural Resources, Construction and Maintenance occupations in Bath County are Construction & Extraction (144 | 3.0%), Installation, Maintenance & Repair (137 | 2.8%), and Farming, Fishing & Forestry (90 | 1.8%).
Natural Resources, Construction and Maintenance Occupations by Sex
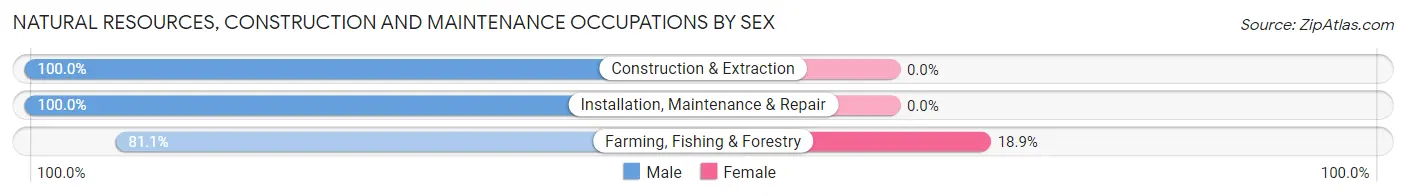
| Occupation | Male | Female |
| Farming, Fishing & Forestry | 73 (81.1%) | 17 (18.9%) |
| Construction & Extraction | 144 (100.0%) | 0 (0.0%) |
| Installation, Maintenance & Repair | 137 (100.0%) | 0 (0.0%) |
| Total (Category) | 354 (95.4%) | 17 (4.6%) |
| Total (Overall) | 2,751 (56.6%) | 2,111 (43.4%) |
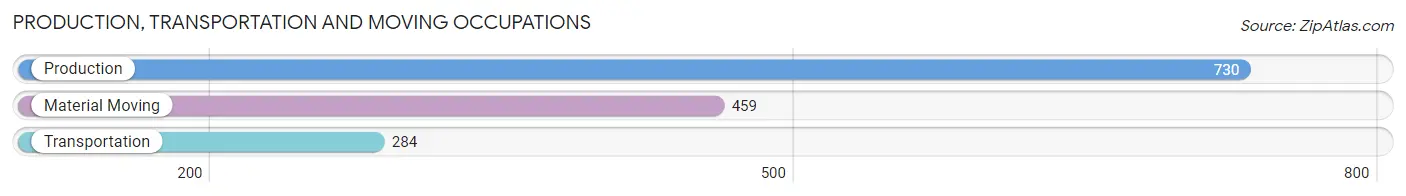
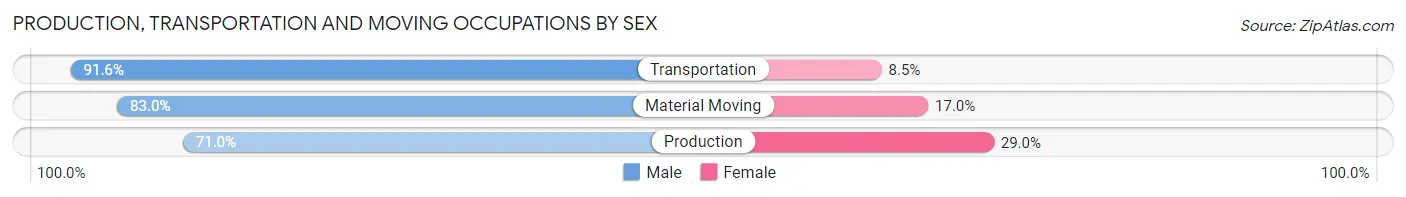
Production, Transportation and Moving Occupations
The most common Production, Transportation and Moving occupations in Bath County are Production (730 | 15.0%), Material Moving (459 | 9.4%), and Transportation (284 | 5.8%).
Production, Transportation and Moving Occupations by Sex
| Occupation | Male | Female |
| Production | 518 (71.0%) | 212 (29.0%) |
| Transportation | 260 (91.5%) | 24 (8.5%) |
| Material Moving | 381 (83.0%) | 78 (17.0%) |
| Total (Category) | 1,159 (78.7%) | 314 (21.3%) |
| Total (Overall) | 2,751 (56.6%) | 2,111 (43.4%) |
Employment Industries by Sex in Bath County
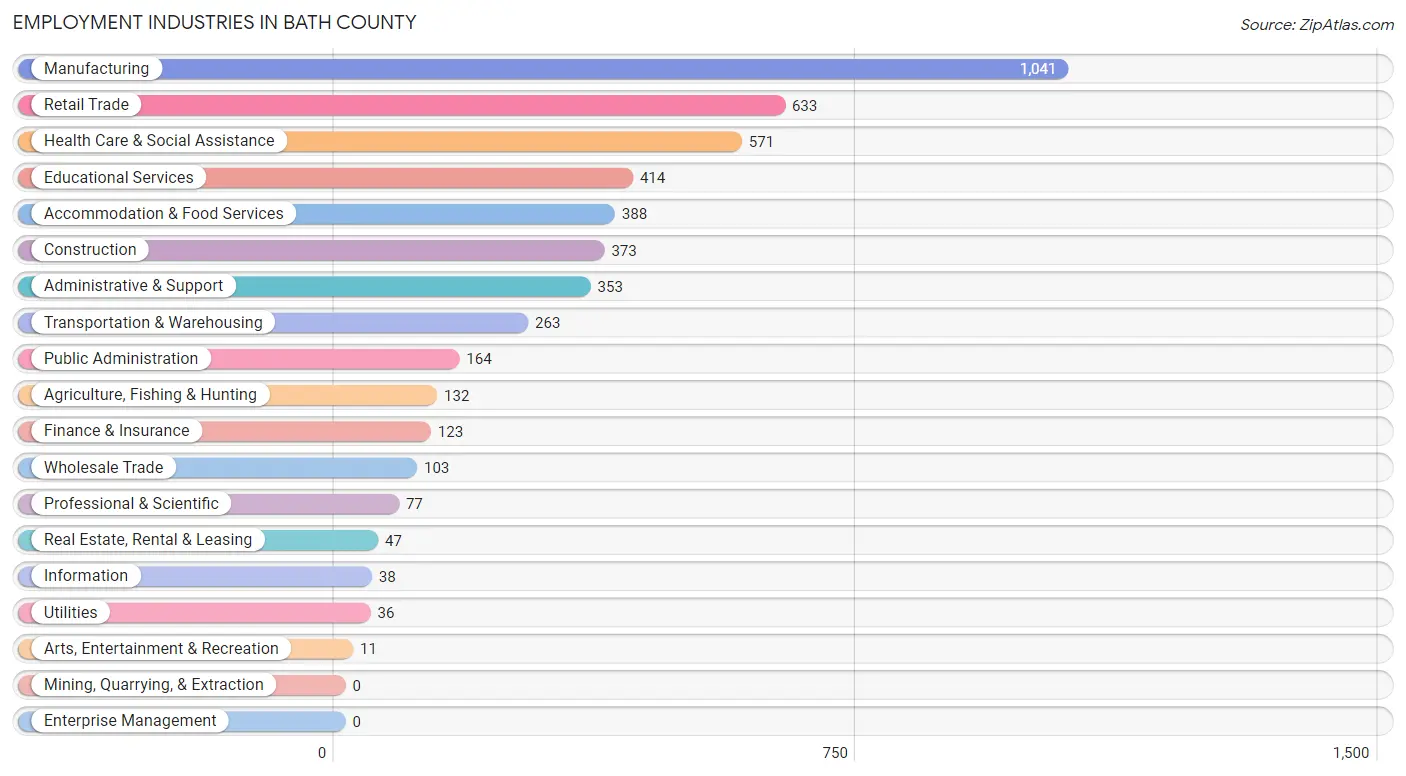
Employment Industries in Bath County
The major employment industries in Bath County include Manufacturing (1,041 | 21.4%), Retail Trade (633 | 13.0%), Health Care & Social Assistance (571 | 11.7%), Educational Services (414 | 8.5%), and Accommodation & Food Services (388 | 8.0%).
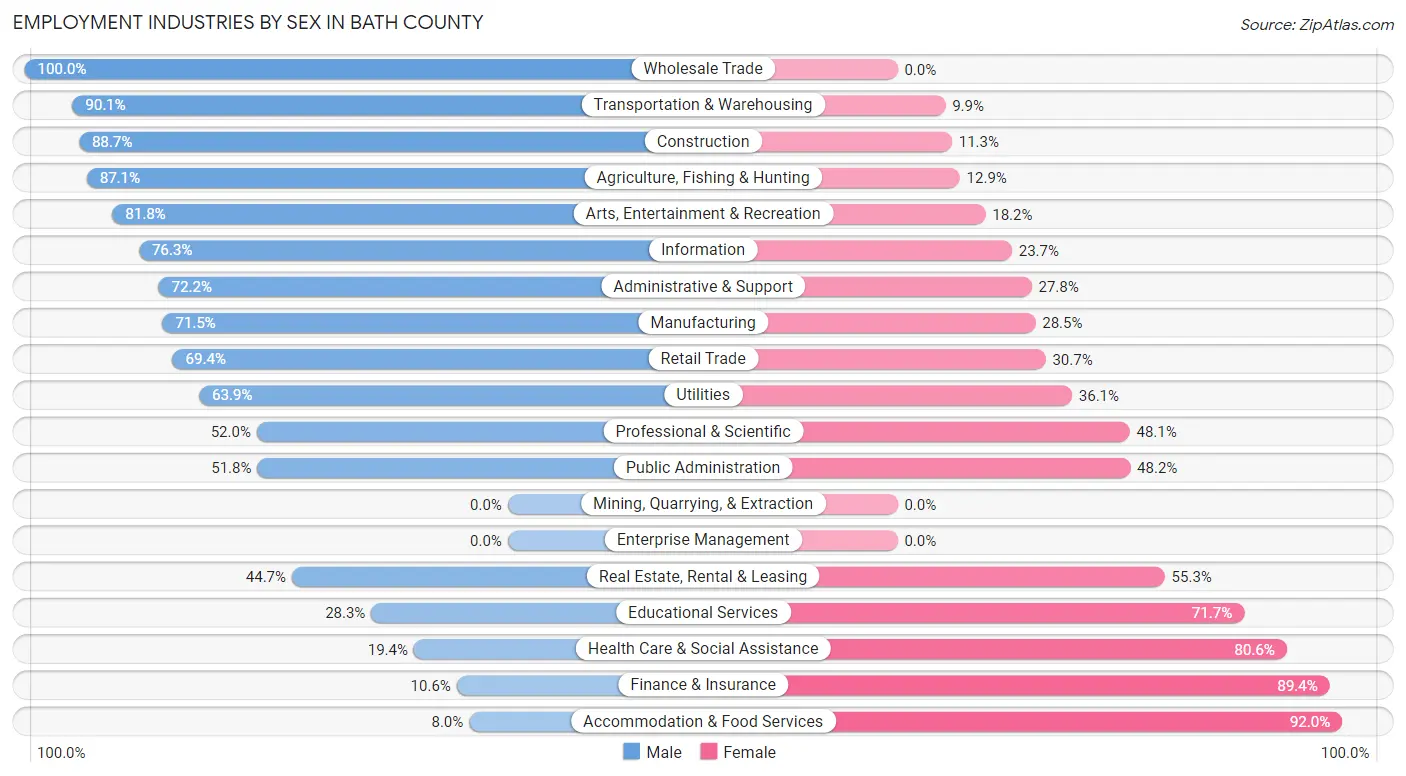
Employment Industries by Sex in Bath County
The Bath County industries that see more men than women are Wholesale Trade (100.0%), Transportation & Warehousing (90.1%), and Construction (88.7%), whereas the industries that tend to have a higher number of women are Accommodation & Food Services (92.0%), Finance & Insurance (89.4%), and Health Care & Social Assistance (80.6%).
| Industry | Male | Female |
| Agriculture, Fishing & Hunting | 115 (87.1%) | 17 (12.9%) |
| Mining, Quarrying, & Extraction | 0 (0.0%) | 0 (0.0%) |
| Construction | 331 (88.7%) | 42 (11.3%) |
| Manufacturing | 744 (71.5%) | 297 (28.5%) |
| Wholesale Trade | 103 (100.0%) | 0 (0.0%) |
| Retail Trade | 439 (69.4%) | 194 (30.6%) |
| Transportation & Warehousing | 237 (90.1%) | 26 (9.9%) |
| Utilities | 23 (63.9%) | 13 (36.1%) |
| Information | 29 (76.3%) | 9 (23.7%) |
| Finance & Insurance | 13 (10.6%) | 110 (89.4%) |
| Real Estate, Rental & Leasing | 21 (44.7%) | 26 (55.3%) |
| Professional & Scientific | 40 (51.9%) | 37 (48.0%) |
| Enterprise Management | 0 (0.0%) | 0 (0.0%) |
| Administrative & Support | 255 (72.2%) | 98 (27.8%) |
| Educational Services | 117 (28.3%) | 297 (71.7%) |
| Health Care & Social Assistance | 111 (19.4%) | 460 (80.6%) |
| Arts, Entertainment & Recreation | 9 (81.8%) | 2 (18.2%) |
| Accommodation & Food Services | 31 (8.0%) | 357 (92.0%) |
| Public Administration | 85 (51.8%) | 79 (48.2%) |
| Total | 2,751 (56.6%) | 2,111 (43.4%) |
Education in Bath County
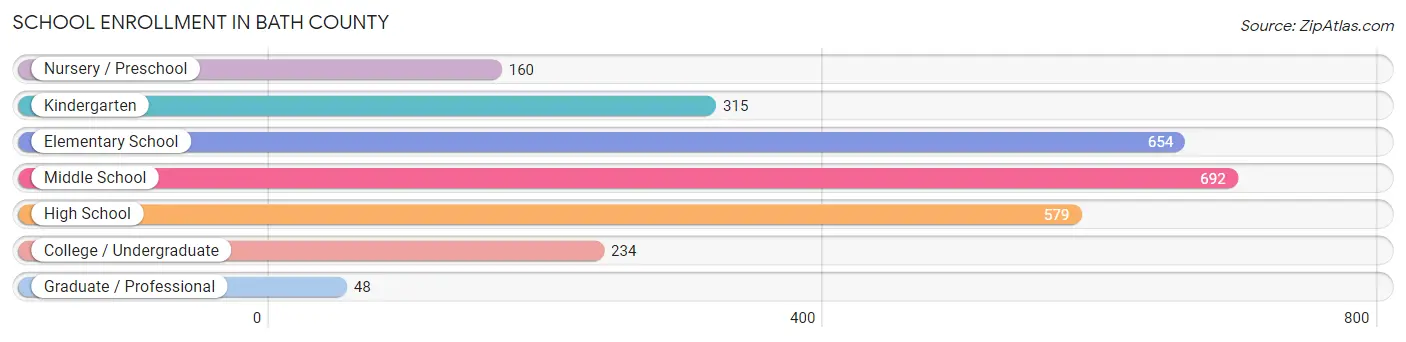
School Enrollment in Bath County
The most common levels of schooling among the 2,682 students in Bath County are middle school (692 | 25.8%), elementary school (654 | 24.4%), and high school (579 | 21.6%).
| School Level | # Students | % Students |
| Nursery / Preschool | 160 | 6.0% |
| Kindergarten | 315 | 11.7% |
| Elementary School | 654 | 24.4% |
| Middle School | 692 | 25.8% |
| High School | 579 | 21.6% |
| College / Undergraduate | 234 | 8.7% |
| Graduate / Professional | 48 | 1.8% |
| Total | 2,682 | 100.0% |
School Enrollment by Age by Funding Source in Bath County
Out of a total of 2,682 students who are enrolled in schools in Bath County, 319 (11.9%) attend a private institution, while the remaining 2,363 (88.1%) are enrolled in public schools. The age group of 35 years and over has the highest likelihood of being enrolled in private schools, with 24 (32.9% in the age bracket) enrolled. Conversely, the age group of 18 to 19 year olds has the lowest likelihood of being enrolled in a private school, with 127 (100.0% in the age bracket) attending a public institution.
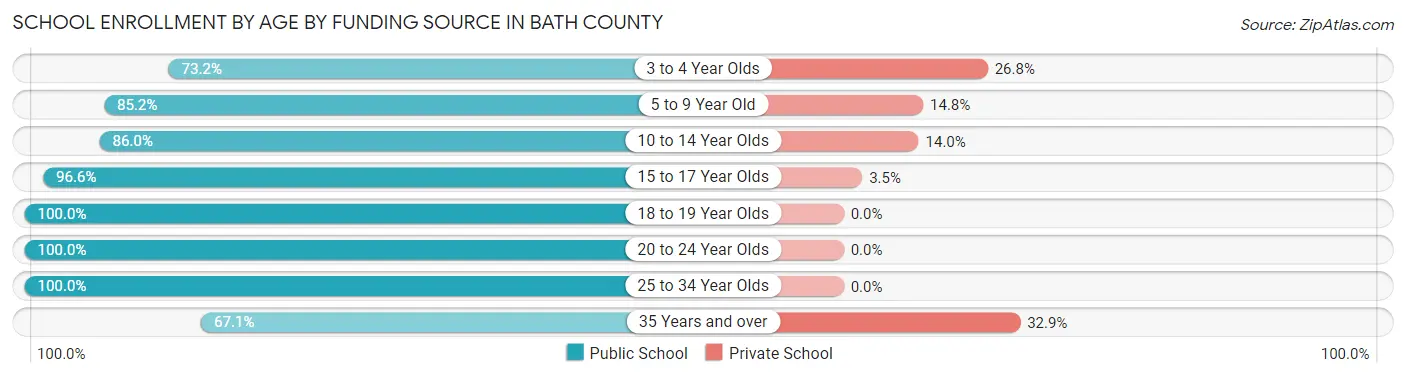
| Age Bracket | Public School | Private School |
| 3 to 4 Year Olds | 60 (73.2%) | 22 (26.8%) |
| 5 to 9 Year Old | 783 (85.2%) | 136 (14.8%) |
| 10 to 14 Year Olds | 727 (86.0%) | 118 (14.0%) |
| 15 to 17 Year Olds | 504 (96.6%) | 18 (3.5%) |
| 18 to 19 Year Olds | 127 (100.0%) | 0 (0.0%) |
| 20 to 24 Year Olds | 63 (100.0%) | 0 (0.0%) |
| 25 to 34 Year Olds | 51 (100.0%) | 0 (0.0%) |
| 35 Years and over | 49 (67.1%) | 24 (32.9%) |
| Total | 2,363 (88.1%) | 319 (11.9%) |
Educational Attainment by Field of Study in Bath County
Education (337 | 26.7%), arts & humanities (185 | 14.7%), business (138 | 10.9%), bio, nature & agricultural (130 | 10.3%), and engineering (120 | 9.5%) are the most common fields of study among 1,261 individuals in Bath County who have obtained a bachelor's degree or higher.
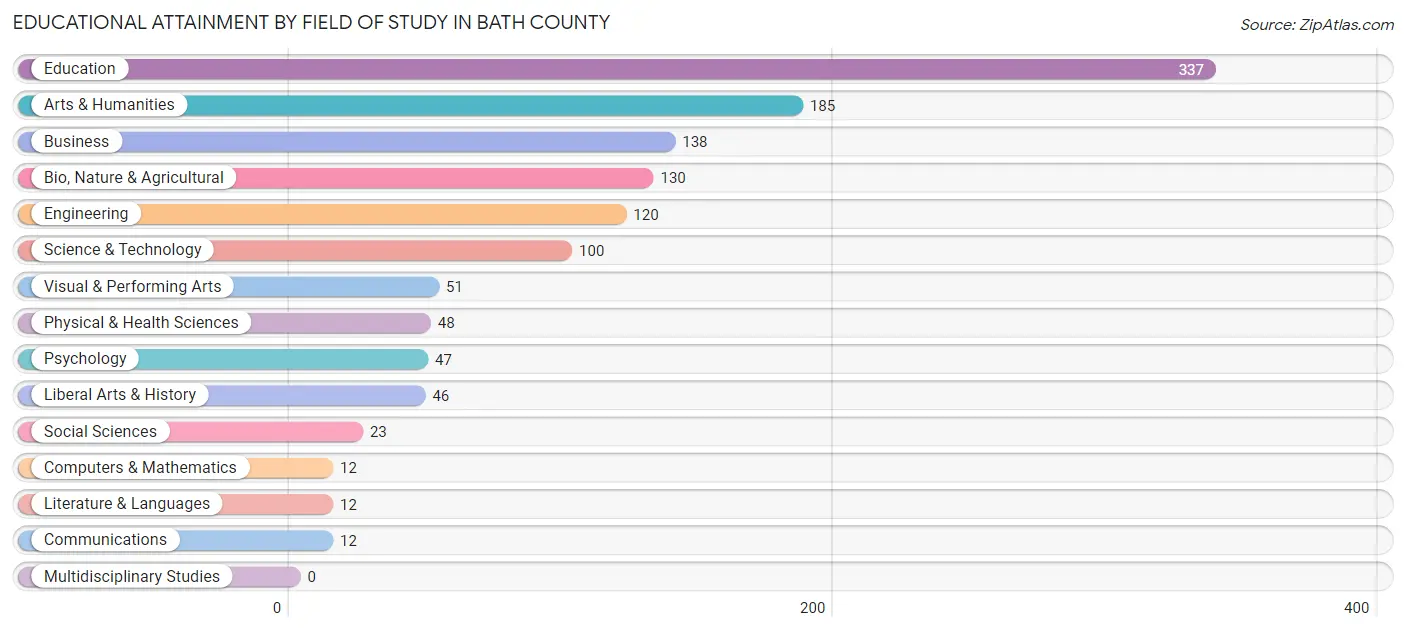
| Field of Study | # Graduates | % Graduates |
| Computers & Mathematics | 12 | 0.9% |
| Bio, Nature & Agricultural | 130 | 10.3% |
| Physical & Health Sciences | 48 | 3.8% |
| Psychology | 47 | 3.7% |
| Social Sciences | 23 | 1.8% |
| Engineering | 120 | 9.5% |
| Multidisciplinary Studies | 0 | 0.0% |
| Science & Technology | 100 | 7.9% |
| Business | 138 | 10.9% |
| Education | 337 | 26.7% |
| Literature & Languages | 12 | 0.9% |
| Liberal Arts & History | 46 | 3.6% |
| Visual & Performing Arts | 51 | 4.0% |
| Communications | 12 | 0.9% |
| Arts & Humanities | 185 | 14.7% |
| Total | 1,261 | 100.0% |
Transportation & Commute in Bath County
Vehicle Availability by Sex in Bath County
The most prevalent vehicle ownership categories in Bath County are males with 2 vehicles (1,113, accounting for 41.0%) and females with 2 vehicles (795, making up 57.1%).
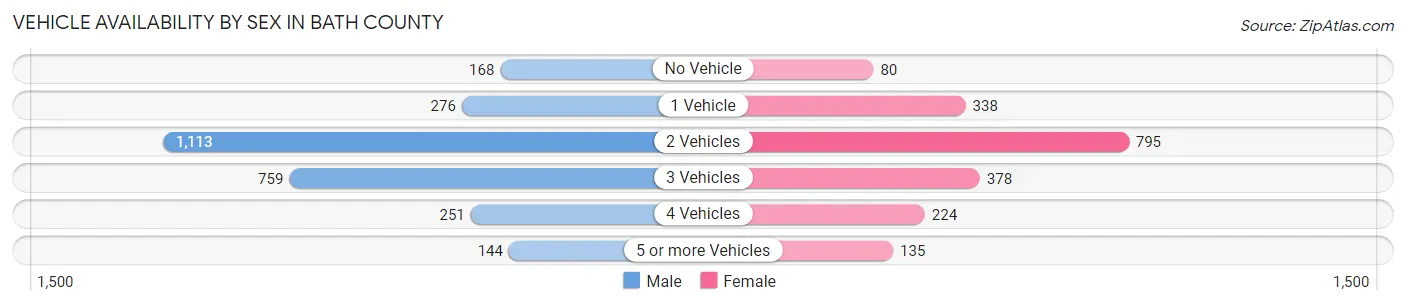
| Vehicles Available | Male | Female |
| No Vehicle | 168 (6.2%) | 80 (4.1%) |
| 1 Vehicle | 276 (10.2%) | 338 (17.3%) |
| 2 Vehicles | 1,113 (41.0%) | 795 (40.8%) |
| 3 Vehicles | 759 (28.0%) | 378 (19.4%) |
| 4 Vehicles | 251 (9.3%) | 224 (11.5%) |
| 5 or more Vehicles | 144 (5.3%) | 135 (6.9%) |
| Total | 2,711 (100.0%) | 1,950 (100.0%) |
Commute Time in Bath County
The most frequently occuring commute durations in Bath County are 20 to 24 minutes (765 commuters, 17.4%), 15 to 19 minutes (734 commuters, 16.7%), and 30 to 34 minutes (555 commuters, 12.6%).
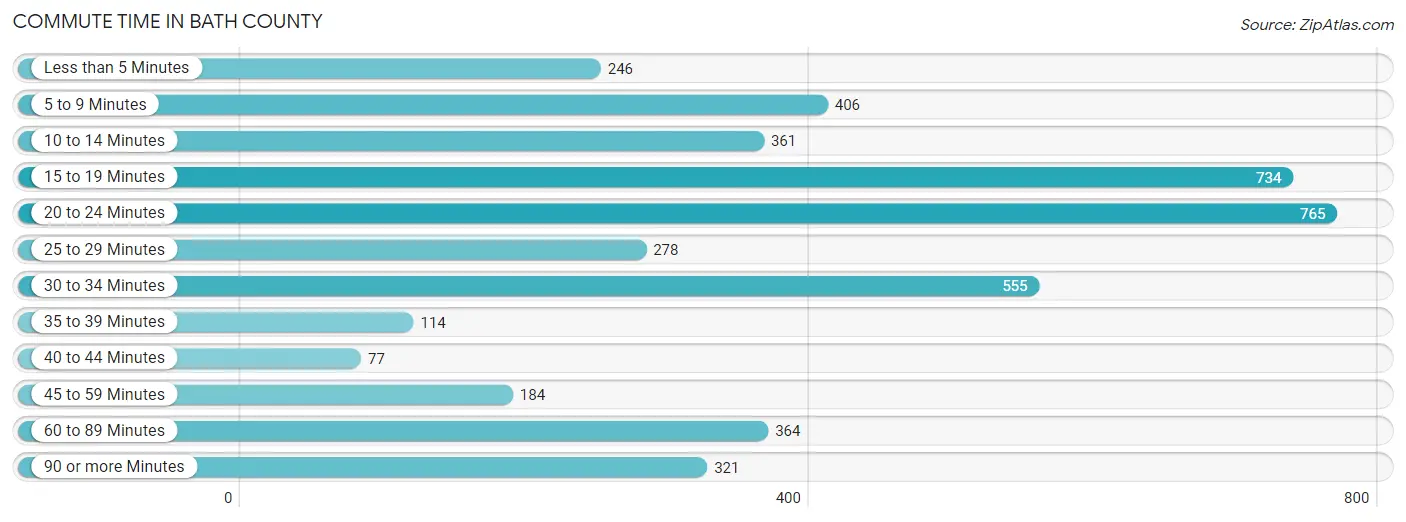
| Commute Time | # Commuters | % Commuters |
| Less than 5 Minutes | 246 | 5.6% |
| 5 to 9 Minutes | 406 | 9.2% |
| 10 to 14 Minutes | 361 | 8.2% |
| 15 to 19 Minutes | 734 | 16.7% |
| 20 to 24 Minutes | 765 | 17.4% |
| 25 to 29 Minutes | 278 | 6.3% |
| 30 to 34 Minutes | 555 | 12.6% |
| 35 to 39 Minutes | 114 | 2.6% |
| 40 to 44 Minutes | 77 | 1.8% |
| 45 to 59 Minutes | 184 | 4.2% |
| 60 to 89 Minutes | 364 | 8.3% |
| 90 or more Minutes | 321 | 7.3% |
Commute Time by Sex in Bath County
The most common commute times in Bath County are 15 to 19 minutes (481 commuters, 18.4%) for males and 20 to 24 minutes (305 commuters, 17.0%) for females.
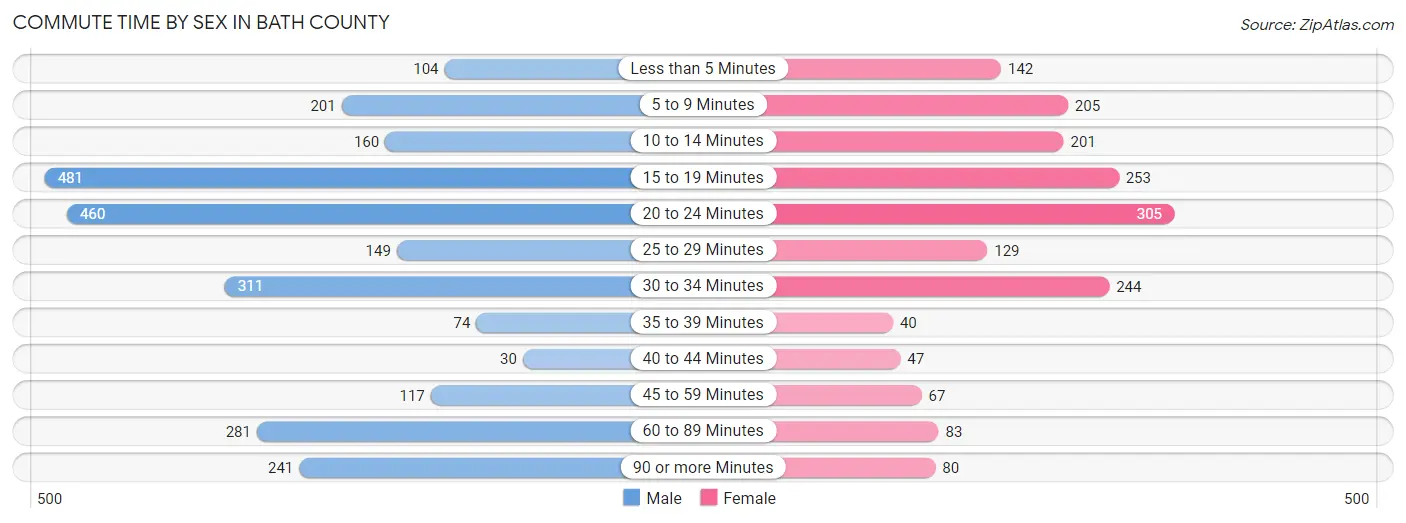
| Commute Time | Male | Female |
| Less than 5 Minutes | 104 (4.0%) | 142 (7.9%) |
| 5 to 9 Minutes | 201 (7.7%) | 205 (11.4%) |
| 10 to 14 Minutes | 160 (6.1%) | 201 (11.2%) |
| 15 to 19 Minutes | 481 (18.4%) | 253 (14.1%) |
| 20 to 24 Minutes | 460 (17.6%) | 305 (17.0%) |
| 25 to 29 Minutes | 149 (5.7%) | 129 (7.2%) |
| 30 to 34 Minutes | 311 (11.9%) | 244 (13.6%) |
| 35 to 39 Minutes | 74 (2.8%) | 40 (2.2%) |
| 40 to 44 Minutes | 30 (1.1%) | 47 (2.6%) |
| 45 to 59 Minutes | 117 (4.5%) | 67 (3.7%) |
| 60 to 89 Minutes | 281 (10.8%) | 83 (4.6%) |
| 90 or more Minutes | 241 (9.2%) | 80 (4.4%) |
Time of Departure to Work by Sex in Bath County
The most frequent times of departure to work in Bath County are 7:00 AM to 7:29 AM (525, 20.1%) for males and 7:30 AM to 7:59 AM (308, 17.2%) for females.
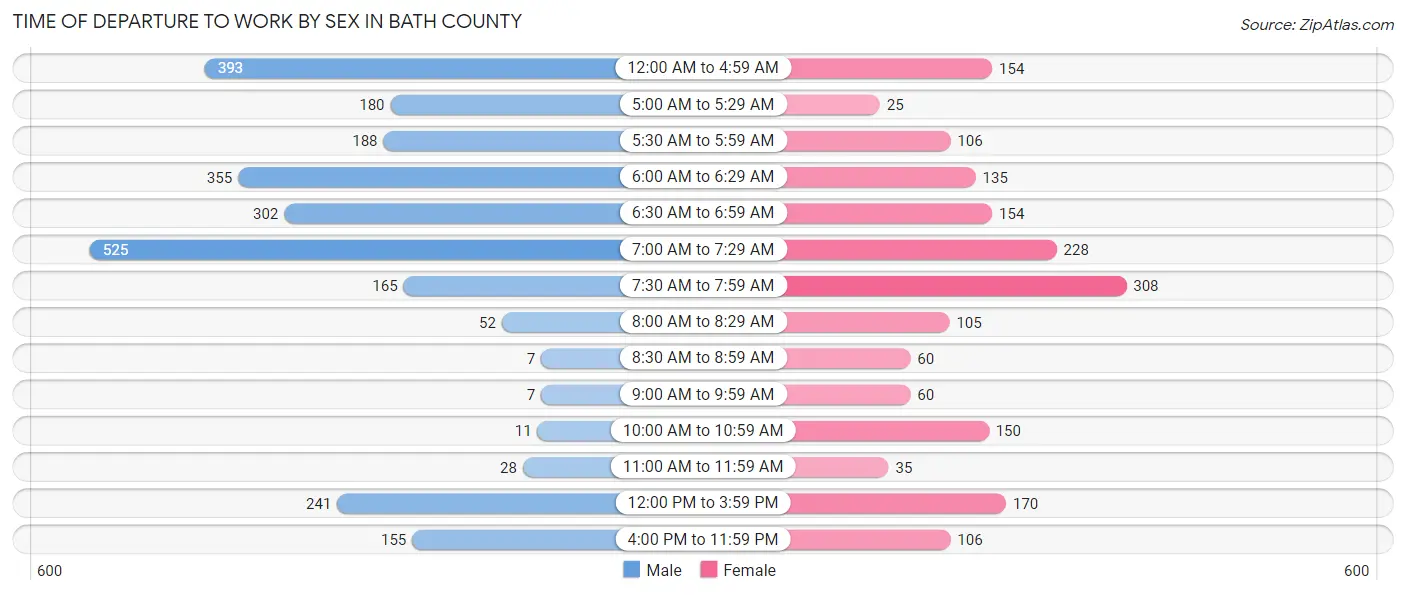
| Time of Departure | Male | Female |
| 12:00 AM to 4:59 AM | 393 (15.1%) | 154 (8.6%) |
| 5:00 AM to 5:29 AM | 180 (6.9%) | 25 (1.4%) |
| 5:30 AM to 5:59 AM | 188 (7.2%) | 106 (5.9%) |
| 6:00 AM to 6:29 AM | 355 (13.6%) | 135 (7.5%) |
| 6:30 AM to 6:59 AM | 302 (11.6%) | 154 (8.6%) |
| 7:00 AM to 7:29 AM | 525 (20.1%) | 228 (12.7%) |
| 7:30 AM to 7:59 AM | 165 (6.3%) | 308 (17.2%) |
| 8:00 AM to 8:29 AM | 52 (2.0%) | 105 (5.9%) |
| 8:30 AM to 8:59 AM | 7 (0.3%) | 60 (3.3%) |
| 9:00 AM to 9:59 AM | 7 (0.3%) | 60 (3.3%) |
| 10:00 AM to 10:59 AM | 11 (0.4%) | 150 (8.4%) |
| 11:00 AM to 11:59 AM | 28 (1.1%) | 35 (1.9%) |
| 12:00 PM to 3:59 PM | 241 (9.2%) | 170 (9.5%) |
| 4:00 PM to 11:59 PM | 155 (5.9%) | 106 (5.9%) |
| Total | 2,609 (100.0%) | 1,796 (100.0%) |
Housing Occupancy in Bath County
Occupancy by Ownership in Bath County
Of the total 4,844 dwellings in Bath County, owner-occupied units account for 3,501 (72.3%), while renter-occupied units make up 1,343 (27.7%).
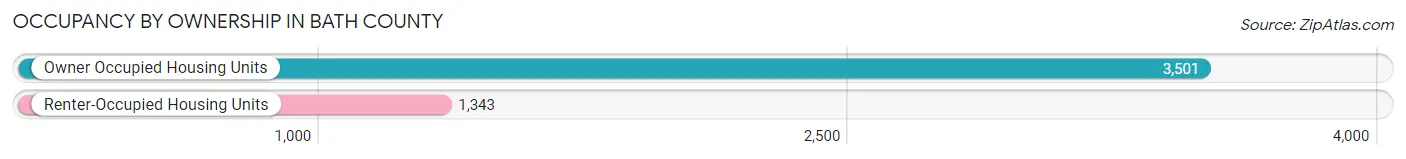
| Occupancy | # Housing Units | % Housing Units |
| Owner Occupied Housing Units | 3,501 | 72.3% |
| Renter-Occupied Housing Units | 1,343 | 27.7% |
| Total Occupied Housing Units | 4,844 | 100.0% |
Occupancy by Household Size in Bath County
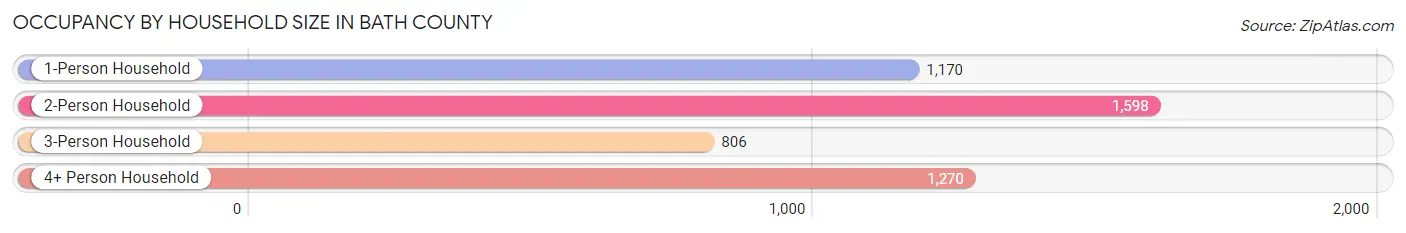
| Household Size | # Housing Units | % Housing Units |
| 1-Person Household | 1,170 | 24.1% |
| 2-Person Household | 1,598 | 33.0% |
| 3-Person Household | 806 | 16.6% |
| 4+ Person Household | 1,270 | 26.2% |
| Total Housing Units | 4,844 | 100.0% |
Occupancy by Ownership by Household Size in Bath County
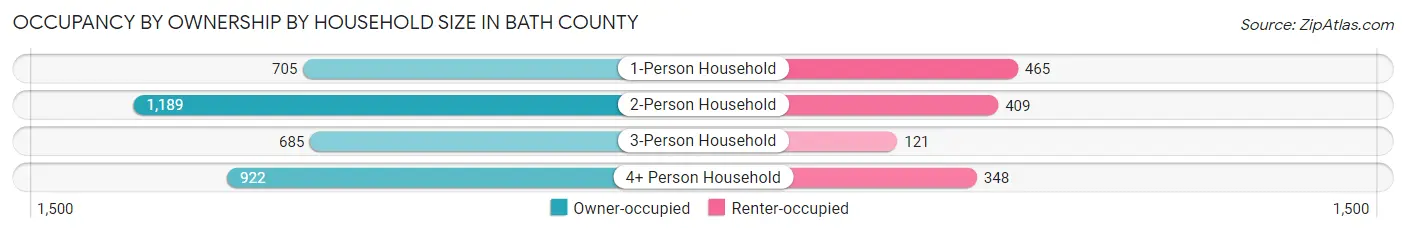
| Household Size | Owner-occupied | Renter-occupied |
| 1-Person Household | 705 (60.3%) | 465 (39.7%) |
| 2-Person Household | 1,189 (74.4%) | 409 (25.6%) |
| 3-Person Household | 685 (85.0%) | 121 (15.0%) |
| 4+ Person Household | 922 (72.6%) | 348 (27.4%) |
| Total Housing Units | 3,501 (72.3%) | 1,343 (27.7%) |
Occupancy by Educational Attainment in Bath County
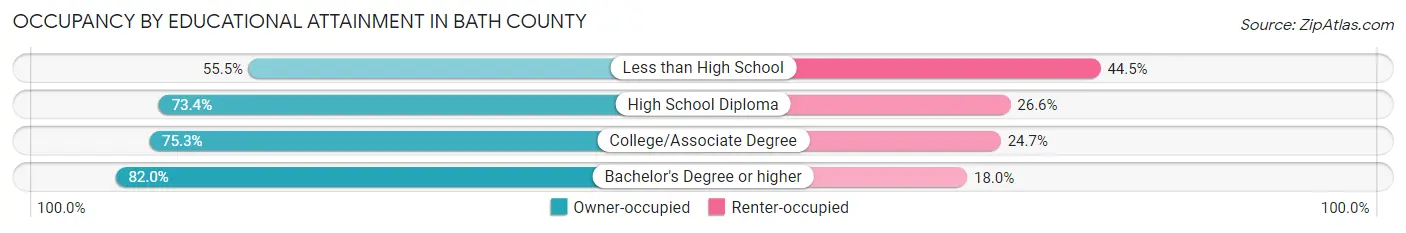
| Household Size | Owner-occupied | Renter-occupied |
| Less than High School | 457 (55.5%) | 366 (44.5%) |
| High School Diploma | 1,435 (73.4%) | 520 (26.6%) |
| College/Associate Degree | 954 (75.3%) | 313 (24.7%) |
| Bachelor's Degree or higher | 655 (82.0%) | 144 (18.0%) |
Occupancy by Age of Householder in Bath County
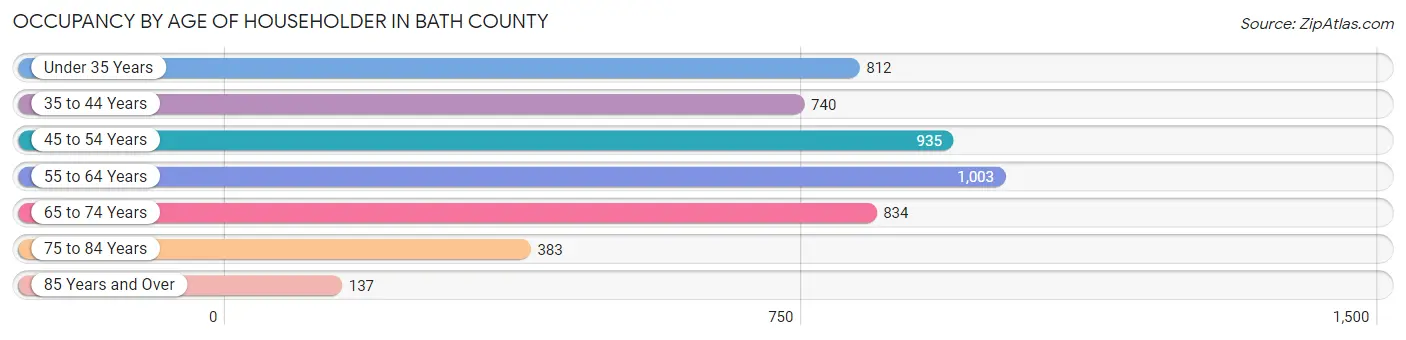
| Age Bracket | # Households | % Households |
| Under 35 Years | 812 | 16.8% |
| 35 to 44 Years | 740 | 15.3% |
| 45 to 54 Years | 935 | 19.3% |
| 55 to 64 Years | 1,003 | 20.7% |
| 65 to 74 Years | 834 | 17.2% |
| 75 to 84 Years | 383 | 7.9% |
| 85 Years and Over | 137 | 2.8% |
| Total | 4,844 | 100.0% |
Housing Finances in Bath County
Median Income by Occupancy in Bath County
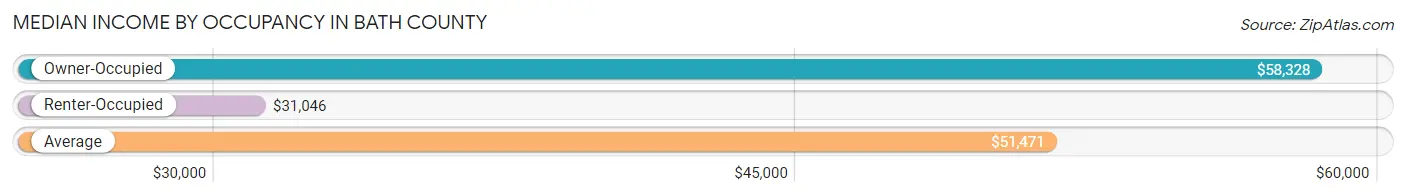
| Occupancy Type | # Households | Median Income |
| Owner-Occupied | 3,501 (72.3%) | $58,328 |
| Renter-Occupied | 1,343 (27.7%) | $31,046 |
| Average | 4,844 (100.0%) | $51,471 |
Occupancy by Householder Income Bracket in Bath County
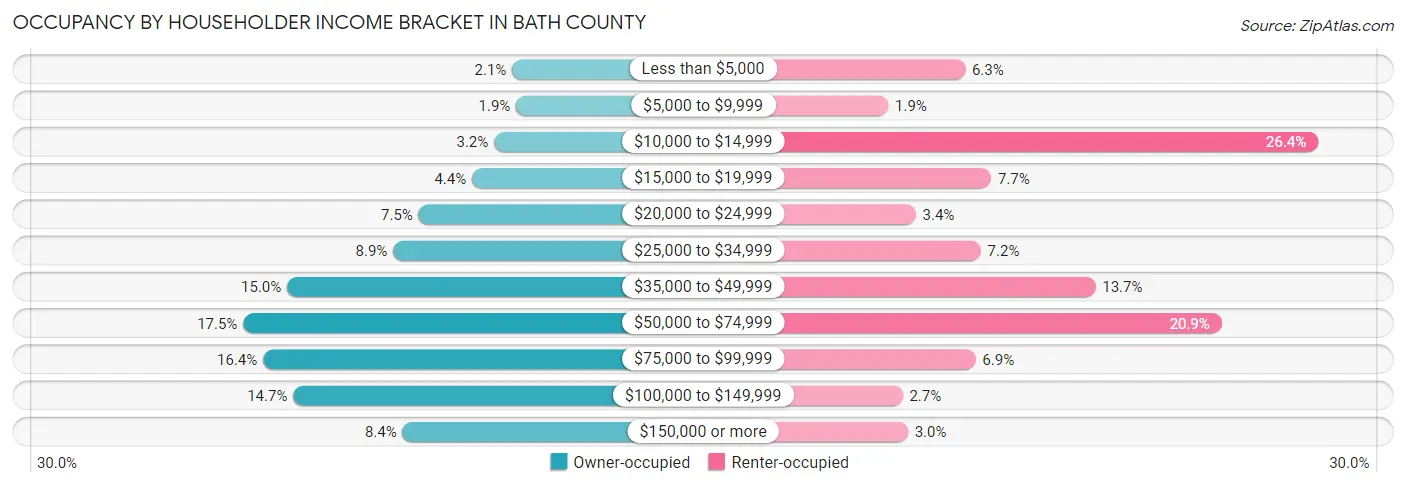
| Income Bracket | Owner-occupied | Renter-occupied |
| Less than $5,000 | 75 (2.1%) | 84 (6.2%) |
| $5,000 to $9,999 | 67 (1.9%) | 25 (1.9%) |
| $10,000 to $14,999 | 111 (3.2%) | 355 (26.4%) |
| $15,000 to $19,999 | 155 (4.4%) | 104 (7.7%) |
| $20,000 to $24,999 | 262 (7.5%) | 46 (3.4%) |
| $25,000 to $34,999 | 313 (8.9%) | 96 (7.1%) |
| $35,000 to $49,999 | 525 (15.0%) | 184 (13.7%) |
| $50,000 to $74,999 | 613 (17.5%) | 281 (20.9%) |
| $75,000 to $99,999 | 573 (16.4%) | 92 (6.9%) |
| $100,000 to $149,999 | 513 (14.6%) | 36 (2.7%) |
| $150,000 or more | 294 (8.4%) | 40 (3.0%) |
| Total | 3,501 (100.0%) | 1,343 (100.0%) |
Monthly Housing Cost Tiers in Bath County
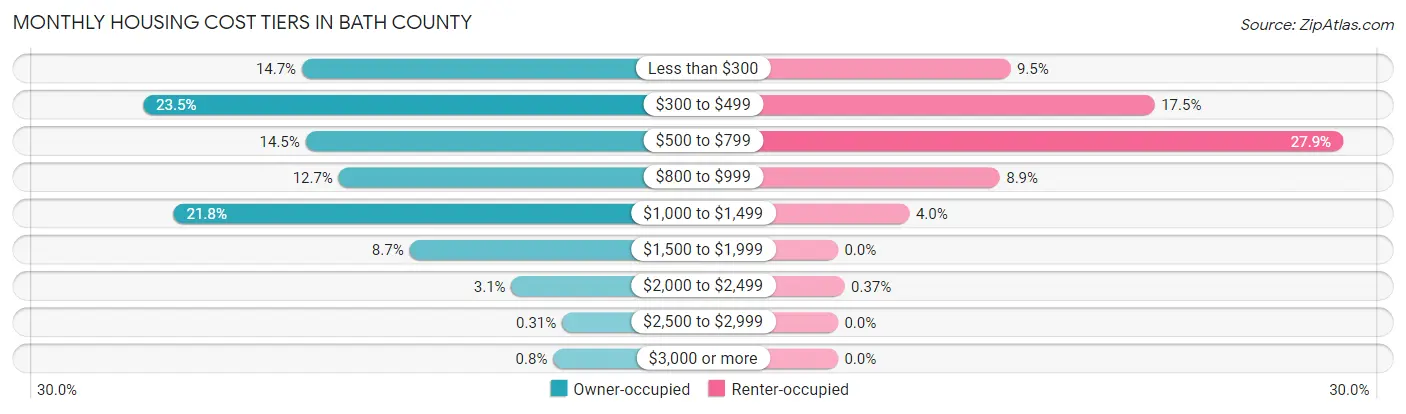
| Monthly Cost | Owner-occupied | Renter-occupied |
| Less than $300 | 514 (14.7%) | 128 (9.5%) |
| $300 to $499 | 821 (23.4%) | 235 (17.5%) |
| $500 to $799 | 507 (14.5%) | 375 (27.9%) |
| $800 to $999 | 443 (12.7%) | 120 (8.9%) |
| $1,000 to $1,499 | 762 (21.8%) | 53 (4.0%) |
| $1,500 to $1,999 | 306 (8.7%) | 0 (0.0%) |
| $2,000 to $2,499 | 109 (3.1%) | 5 (0.4%) |
| $2,500 to $2,999 | 11 (0.3%) | 0 (0.0%) |
| $3,000 or more | 28 (0.8%) | 0 (0.0%) |
| Total | 3,501 (100.0%) | 1,343 (100.0%) |
Physical Housing Characteristics in Bath County
Housing Structures in Bath County
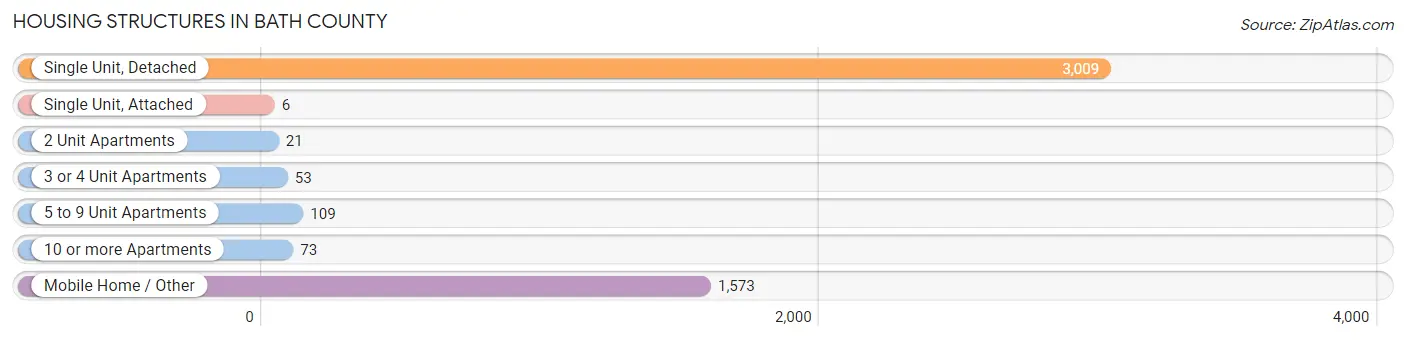
| Structure Type | # Housing Units | % Housing Units |
| Single Unit, Detached | 3,009 | 62.1% |
| Single Unit, Attached | 6 | 0.1% |
| 2 Unit Apartments | 21 | 0.4% |
| 3 or 4 Unit Apartments | 53 | 1.1% |
| 5 to 9 Unit Apartments | 109 | 2.2% |
| 10 or more Apartments | 73 | 1.5% |
| Mobile Home / Other | 1,573 | 32.5% |
| Total | 4,844 | 100.0% |
Housing Structures by Occupancy in Bath County
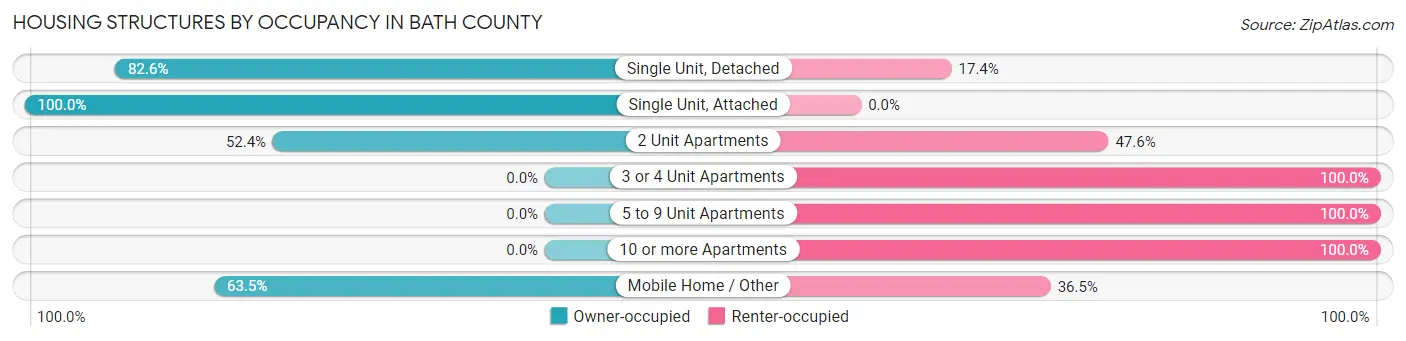
| Structure Type | Owner-occupied | Renter-occupied |
| Single Unit, Detached | 2,485 (82.6%) | 524 (17.4%) |
| Single Unit, Attached | 6 (100.0%) | 0 (0.0%) |
| 2 Unit Apartments | 11 (52.4%) | 10 (47.6%) |
| 3 or 4 Unit Apartments | 0 (0.0%) | 53 (100.0%) |
| 5 to 9 Unit Apartments | 0 (0.0%) | 109 (100.0%) |
| 10 or more Apartments | 0 (0.0%) | 73 (100.0%) |
| Mobile Home / Other | 999 (63.5%) | 574 (36.5%) |
| Total | 3,501 (72.3%) | 1,343 (27.7%) |
Housing Structures by Number of Rooms in Bath County
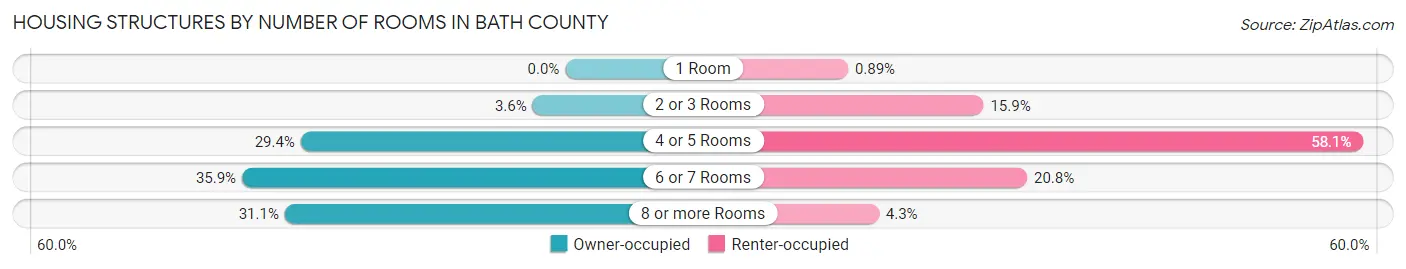
| Number of Rooms | Owner-occupied | Renter-occupied |
| 1 Room | 0 (0.0%) | 12 (0.9%) |
| 2 or 3 Rooms | 127 (3.6%) | 214 (15.9%) |
| 4 or 5 Rooms | 1,028 (29.4%) | 780 (58.1%) |
| 6 or 7 Rooms | 1,256 (35.9%) | 279 (20.8%) |
| 8 or more Rooms | 1,090 (31.1%) | 58 (4.3%) |
| Total | 3,501 (100.0%) | 1,343 (100.0%) |
Housing Structure by Heating Type in Bath County
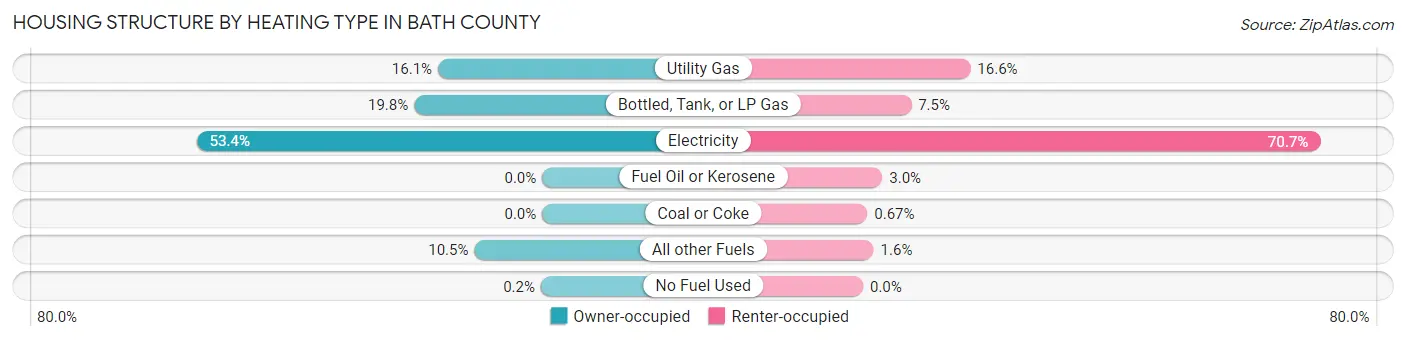
| Heating Type | Owner-occupied | Renter-occupied |
| Utility Gas | 564 (16.1%) | 223 (16.6%) |
| Bottled, Tank, or LP Gas | 693 (19.8%) | 100 (7.4%) |
| Electricity | 1,870 (53.4%) | 949 (70.7%) |
| Fuel Oil or Kerosene | 0 (0.0%) | 40 (3.0%) |
| Coal or Coke | 0 (0.0%) | 9 (0.7%) |
| All other Fuels | 367 (10.5%) | 22 (1.6%) |
| No Fuel Used | 7 (0.2%) | 0 (0.0%) |
| Total | 3,501 (100.0%) | 1,343 (100.0%) |
Household Vehicle Usage in Bath County
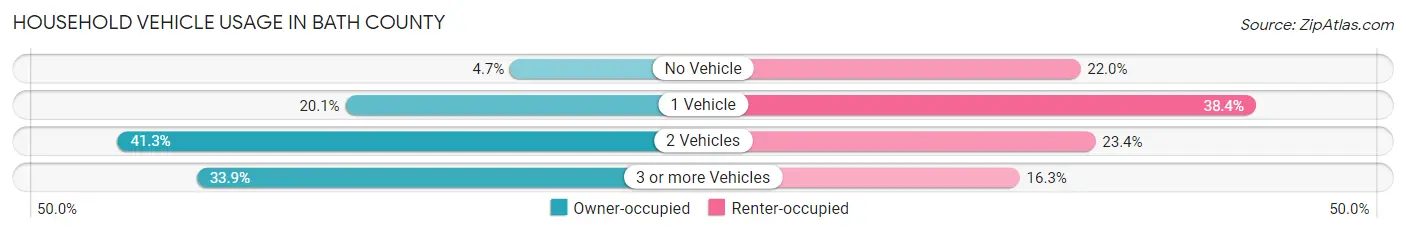
| Vehicles per Household | Owner-occupied | Renter-occupied |
| No Vehicle | 164 (4.7%) | 295 (22.0%) |
| 1 Vehicle | 702 (20.1%) | 515 (38.4%) |
| 2 Vehicles | 1,447 (41.3%) | 314 (23.4%) |
| 3 or more Vehicles | 1,188 (33.9%) | 219 (16.3%) |
| Total | 3,501 (100.0%) | 1,343 (100.0%) |
Real Estate & Mortgages in Bath County
Real Estate and Mortgage Overview in Bath County
| Characteristic | Without Mortgage | With Mortgage |
| Housing Units | 1,554 | 1,947 |
| Median Property Value | $81,100 | $127,700 |
| Median Household Income | $45,527 | $180 |
| Monthly Housing Costs | $339 | $28 |
| Real Estate Taxes | $570 | $139 |
Property Value by Mortgage Status in Bath County
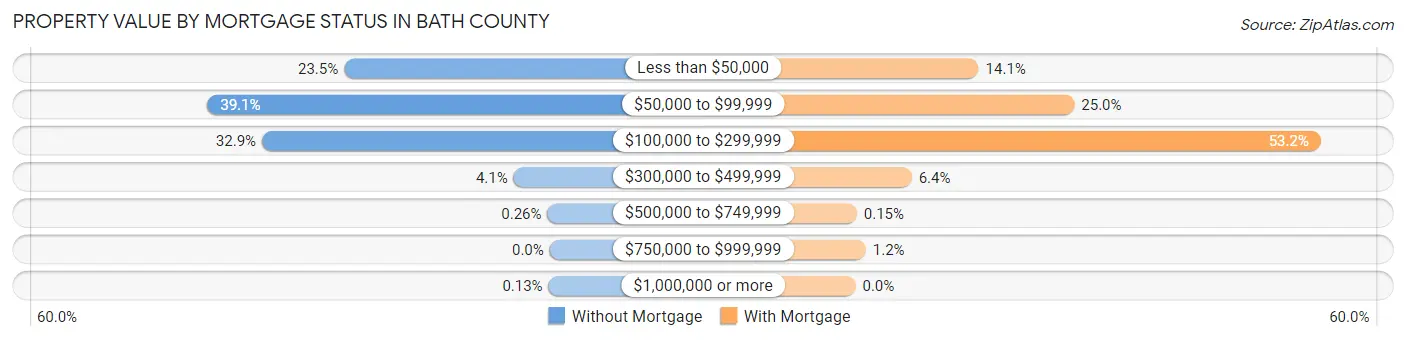
| Property Value | Without Mortgage | With Mortgage |
| Less than $50,000 | 365 (23.5%) | 274 (14.1%) |
| $50,000 to $99,999 | 608 (39.1%) | 487 (25.0%) |
| $100,000 to $299,999 | 511 (32.9%) | 1,035 (53.2%) |
| $300,000 to $499,999 | 64 (4.1%) | 125 (6.4%) |
| $500,000 to $749,999 | 4 (0.3%) | 3 (0.2%) |
| $750,000 to $999,999 | 0 (0.0%) | 23 (1.2%) |
| $1,000,000 or more | 2 (0.1%) | 0 (0.0%) |
| Total | 1,554 (100.0%) | 1,947 (100.0%) |
Household Income by Mortgage Status in Bath County
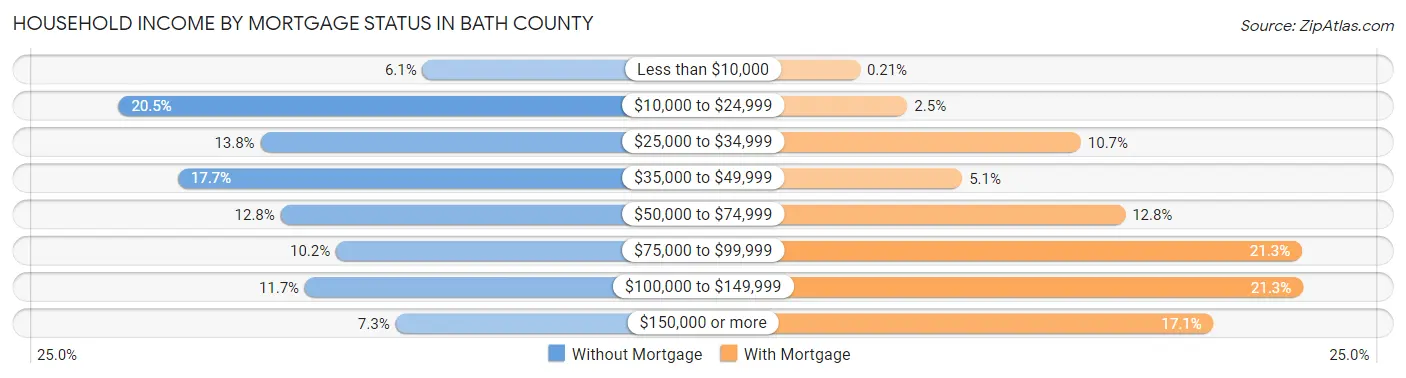
| Household Income | Without Mortgage | With Mortgage |
| Less than $10,000 | 94 (6.0%) | 4 (0.2%) |
| $10,000 to $24,999 | 319 (20.5%) | 48 (2.5%) |
| $25,000 to $34,999 | 214 (13.8%) | 209 (10.7%) |
| $35,000 to $49,999 | 275 (17.7%) | 99 (5.1%) |
| $50,000 to $74,999 | 199 (12.8%) | 250 (12.8%) |
| $75,000 to $99,999 | 158 (10.2%) | 414 (21.3%) |
| $100,000 to $149,999 | 181 (11.7%) | 415 (21.3%) |
| $150,000 or more | 114 (7.3%) | 332 (17.1%) |
| Total | 1,554 (100.0%) | 1,947 (100.0%) |
Property Value to Household Income Ratio in Bath County
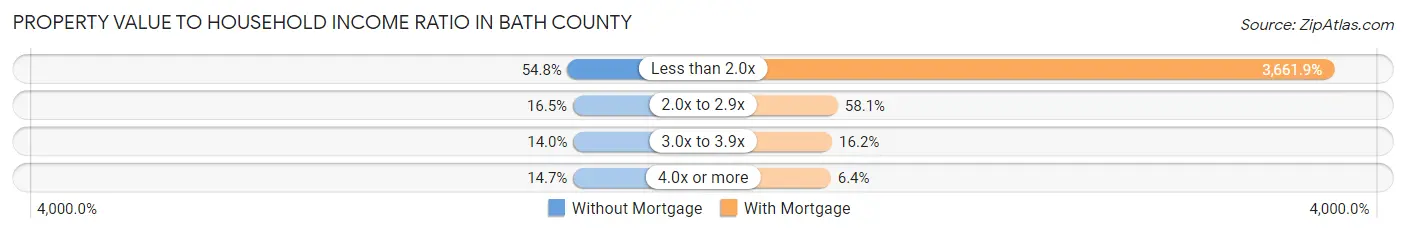
| Value-to-Income Ratio | Without Mortgage | With Mortgage |
| Less than 2.0x | 851 (54.8%) | 71,298 (3,661.9%) |
| 2.0x to 2.9x | 257 (16.5%) | 1,132 (58.1%) |
| 3.0x to 3.9x | 218 (14.0%) | 315 (16.2%) |
| 4.0x or more | 228 (14.7%) | 125 (6.4%) |
| Total | 1,554 (100.0%) | 1,947 (100.0%) |
Real Estate Taxes by Mortgage Status in Bath County
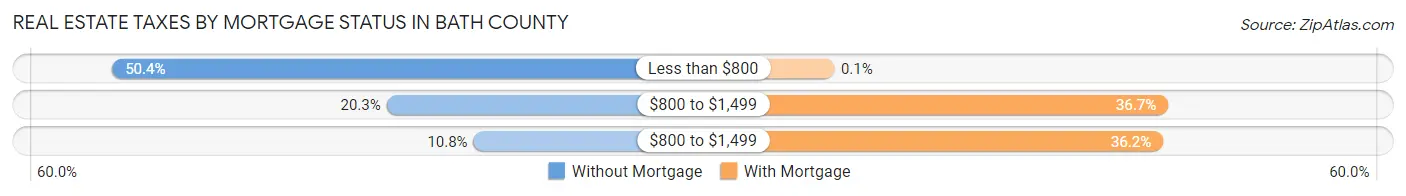
| Property Taxes | Without Mortgage | With Mortgage |
| Less than $800 | 783 (50.4%) | 2 (0.1%) |
| $800 to $1,499 | 316 (20.3%) | 715 (36.7%) |
| $800 to $1,499 | 168 (10.8%) | 704 (36.2%) |
| Total | 1,554 (100.0%) | 1,947 (100.0%) |
Health & Disability in Bath County
Health Insurance Coverage by Age in Bath County
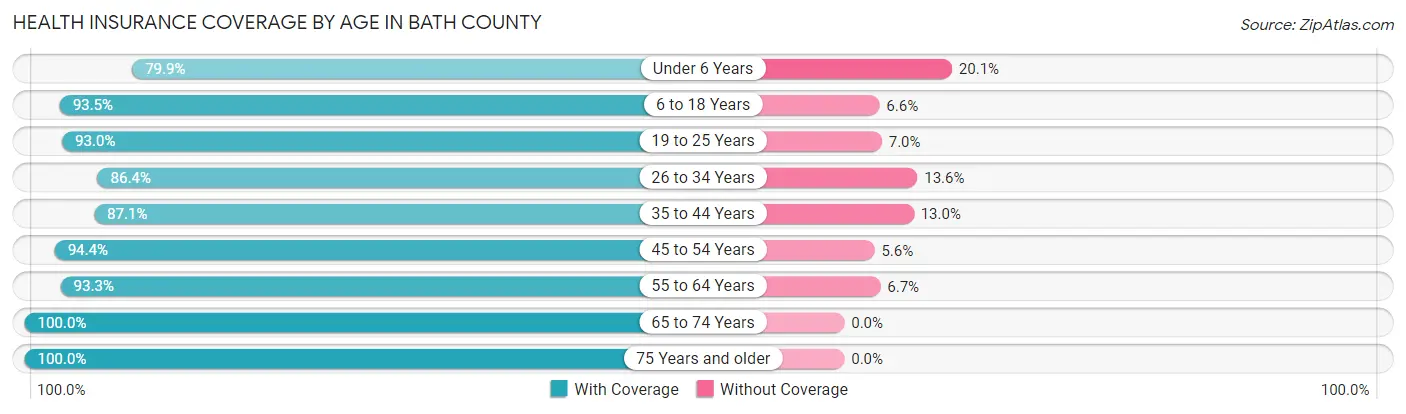
| Age Bracket | With Coverage | Without Coverage |
| Under 6 Years | 856 (79.9%) | 215 (20.1%) |
| 6 to 18 Years | 2,069 (93.4%) | 145 (6.6%) |
| 19 to 25 Years | 1,024 (93.0%) | 77 (7.0%) |
| 26 to 34 Years | 1,129 (86.4%) | 178 (13.6%) |
| 35 to 44 Years | 1,237 (87.1%) | 184 (13.0%) |
| 45 to 54 Years | 1,546 (94.4%) | 92 (5.6%) |
| 55 to 64 Years | 1,693 (93.3%) | 122 (6.7%) |
| 65 to 74 Years | 1,296 (100.0%) | 0 (0.0%) |
| 75 Years and older | 801 (100.0%) | 0 (0.0%) |
| Total | 11,651 (92.0%) | 1,013 (8.0%) |
Health Insurance Coverage by Citizenship Status in Bath County
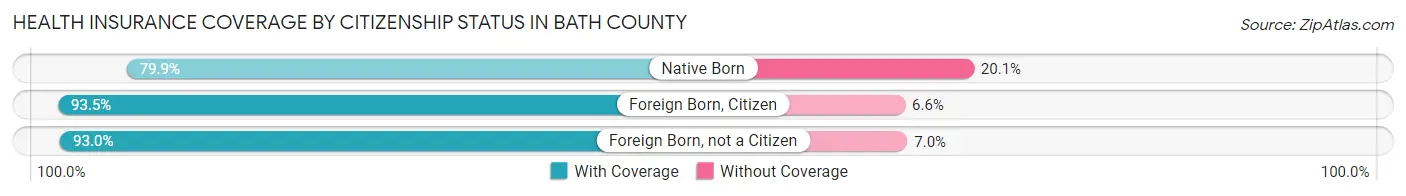
| Citizenship Status | With Coverage | Without Coverage |
| Native Born | 856 (79.9%) | 215 (20.1%) |
| Foreign Born, Citizen | 2,069 (93.4%) | 145 (6.6%) |
| Foreign Born, not a Citizen | 1,024 (93.0%) | 77 (7.0%) |
Health Insurance Coverage by Household Income in Bath County
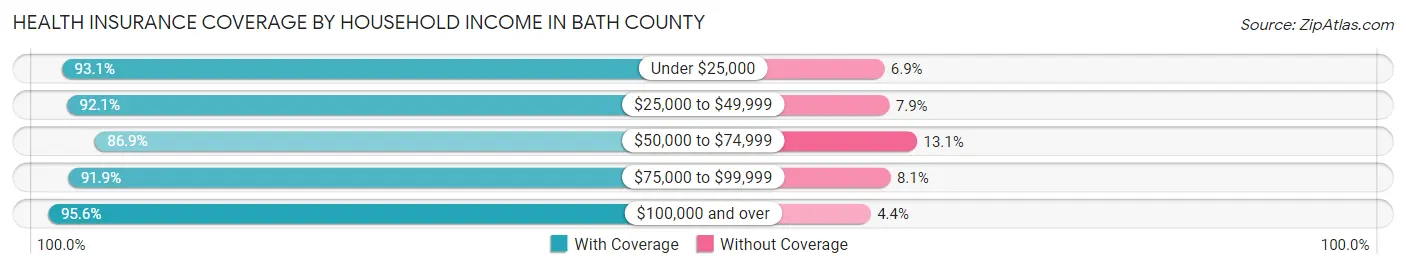
| Household Income | With Coverage | Without Coverage |
| Under $25,000 | 2,481 (93.1%) | 185 (6.9%) |
| $25,000 to $49,999 | 2,466 (92.1%) | 211 (7.9%) |
| $50,000 to $74,999 | 2,208 (86.9%) | 332 (13.1%) |
| $75,000 to $99,999 | 1,862 (91.9%) | 164 (8.1%) |
| $100,000 and over | 2,634 (95.6%) | 121 (4.4%) |
Public vs Private Health Insurance Coverage by Age in Bath County
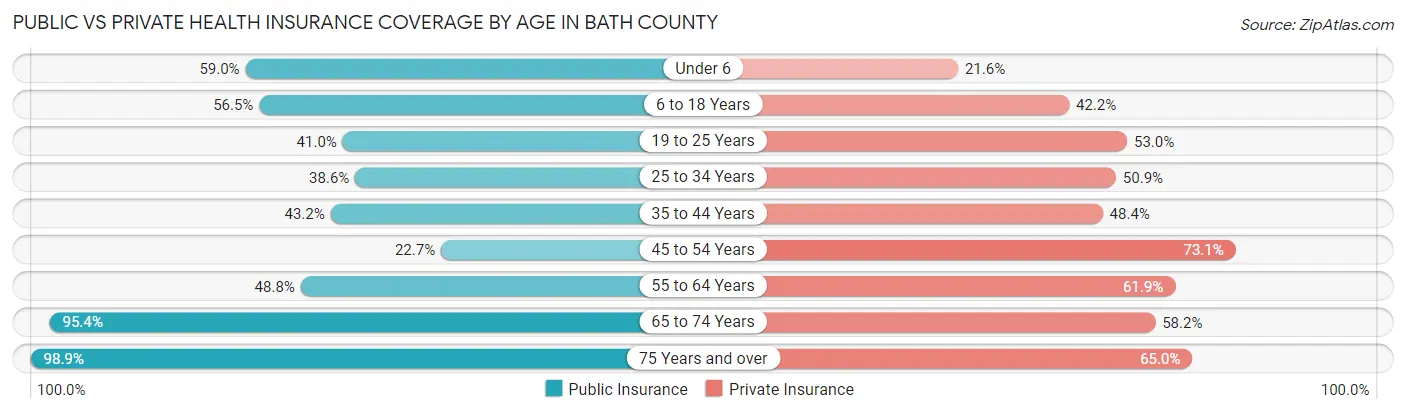
| Age Bracket | Public Insurance | Private Insurance |
| Under 6 | 632 (59.0%) | 231 (21.6%) |
| 6 to 18 Years | 1,250 (56.5%) | 934 (42.2%) |
| 19 to 25 Years | 451 (41.0%) | 583 (52.9%) |
| 25 to 34 Years | 505 (38.6%) | 665 (50.9%) |
| 35 to 44 Years | 614 (43.2%) | 688 (48.4%) |
| 45 to 54 Years | 372 (22.7%) | 1,197 (73.1%) |
| 55 to 64 Years | 885 (48.8%) | 1,123 (61.9%) |
| 65 to 74 Years | 1,236 (95.4%) | 754 (58.2%) |
| 75 Years and over | 792 (98.9%) | 521 (65.0%) |
| Total | 6,737 (53.2%) | 6,696 (52.9%) |
Disability Status by Sex by Age in Bath County
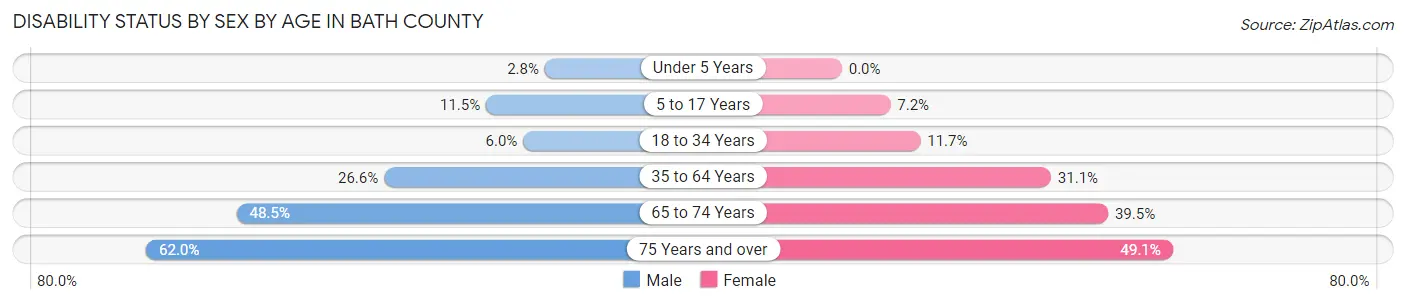
| Age Bracket | Male | Female |
| Under 5 Years | 12 (2.8%) | 0 (0.0%) |
| 5 to 17 Years | 143 (11.5%) | 81 (7.2%) |
| 18 to 34 Years | 76 (6.0%) | 141 (11.7%) |
| 35 to 64 Years | 664 (26.6%) | 739 (31.0%) |
| 65 to 74 Years | 295 (48.5%) | 272 (39.5%) |
| 75 Years and over | 215 (62.0%) | 223 (49.1%) |
Disability Class by Sex by Age in Bath County
Disability Class: Hearing Difficulty
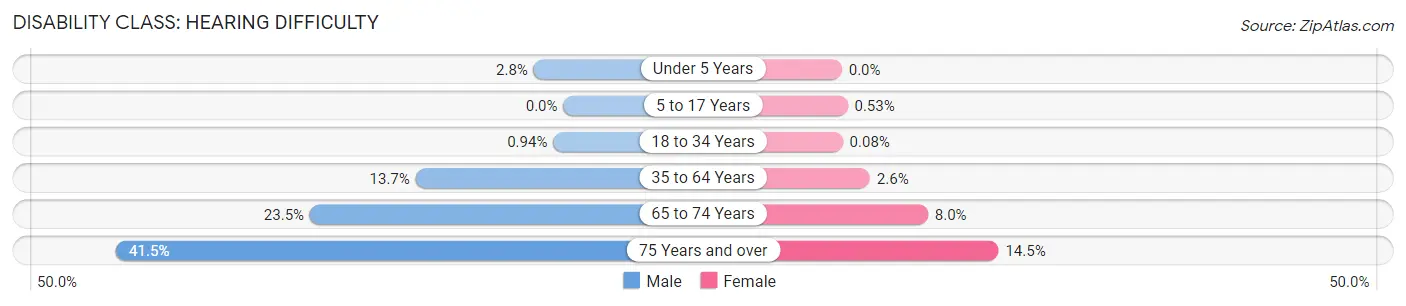
| Age Bracket | Male | Female |
| Under 5 Years | 12 (2.8%) | 0 (0.0%) |
| 5 to 17 Years | 0 (0.0%) | 6 (0.5%) |
| 18 to 34 Years | 12 (0.9%) | 1 (0.1%) |
| 35 to 64 Years | 342 (13.7%) | 62 (2.6%) |
| 65 to 74 Years | 143 (23.5%) | 55 (8.0%) |
| 75 Years and over | 144 (41.5%) | 66 (14.5%) |
Disability Class: Vision Difficulty
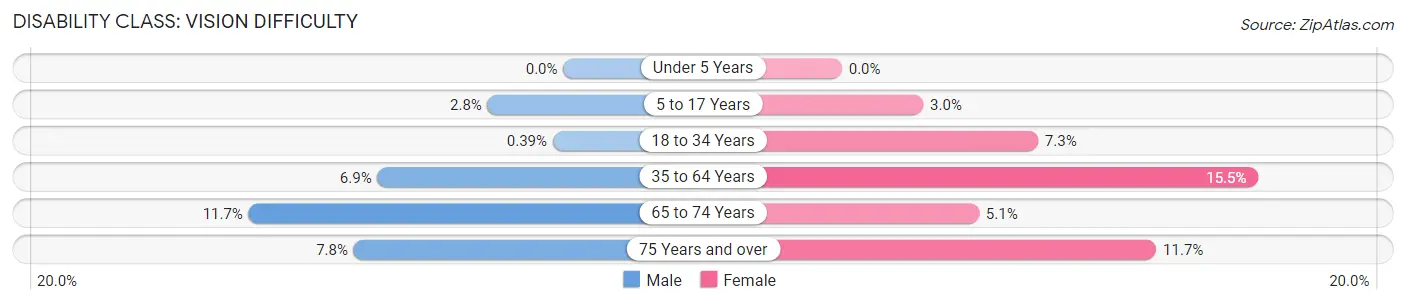
| Age Bracket | Male | Female |
| Under 5 Years | 0 (0.0%) | 0 (0.0%) |
| 5 to 17 Years | 35 (2.8%) | 34 (3.0%) |
| 18 to 34 Years | 5 (0.4%) | 88 (7.3%) |
| 35 to 64 Years | 172 (6.9%) | 368 (15.5%) |
| 65 to 74 Years | 71 (11.7%) | 35 (5.1%) |
| 75 Years and over | 27 (7.8%) | 53 (11.7%) |
Disability Class: Cognitive Difficulty
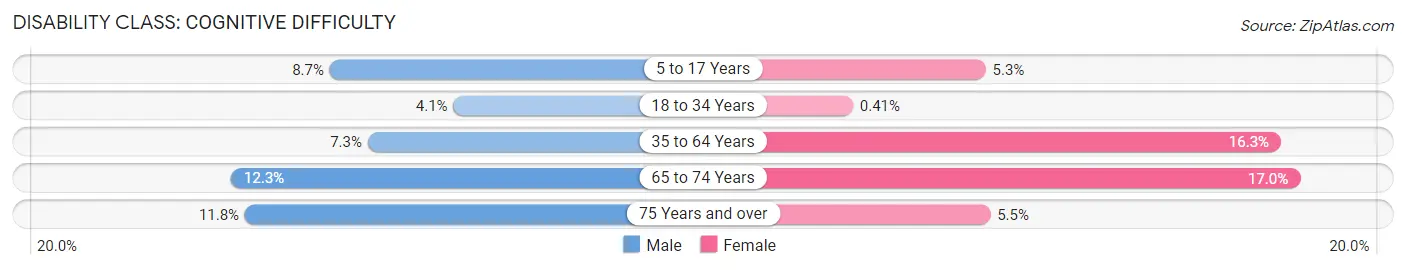
| Age Bracket | Male | Female |
| 5 to 17 Years | 108 (8.7%) | 60 (5.3%) |
| 18 to 34 Years | 52 (4.1%) | 5 (0.4%) |
| 35 to 64 Years | 181 (7.3%) | 388 (16.3%) |
| 65 to 74 Years | 75 (12.3%) | 117 (17.0%) |
| 75 Years and over | 41 (11.8%) | 25 (5.5%) |
Disability Class: Ambulatory Difficulty
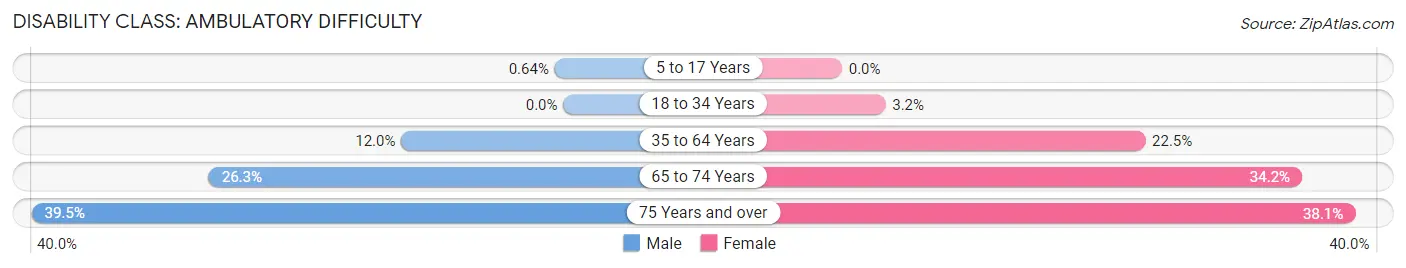
| Age Bracket | Male | Female |
| 5 to 17 Years | 8 (0.6%) | 0 (0.0%) |
| 18 to 34 Years | 0 (0.0%) | 39 (3.2%) |
| 35 to 64 Years | 300 (12.0%) | 536 (22.5%) |
| 65 to 74 Years | 160 (26.3%) | 235 (34.2%) |
| 75 Years and over | 137 (39.5%) | 173 (38.1%) |
Disability Class: Self-Care Difficulty
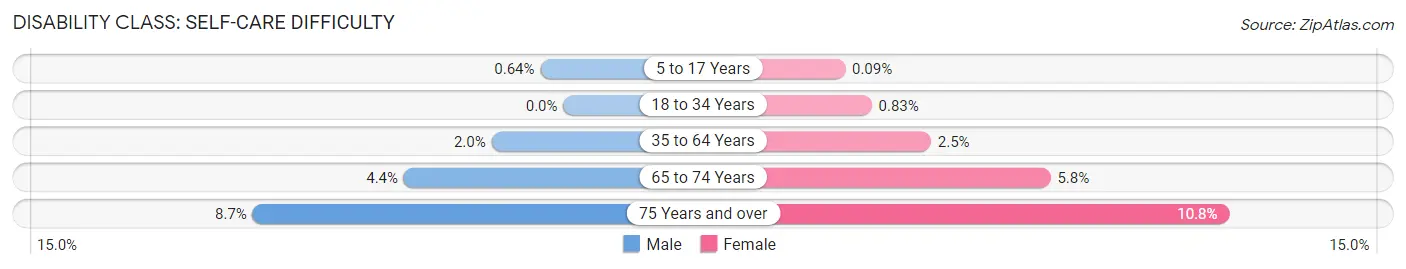
| Age Bracket | Male | Female |
| 5 to 17 Years | 8 (0.6%) | 1 (0.1%) |
| 18 to 34 Years | 0 (0.0%) | 10 (0.8%) |
| 35 to 64 Years | 50 (2.0%) | 59 (2.5%) |
| 65 to 74 Years | 27 (4.4%) | 40 (5.8%) |
| 75 Years and over | 30 (8.6%) | 49 (10.8%) |
Technology Access in Bath County
Computing Device Access in Bath County
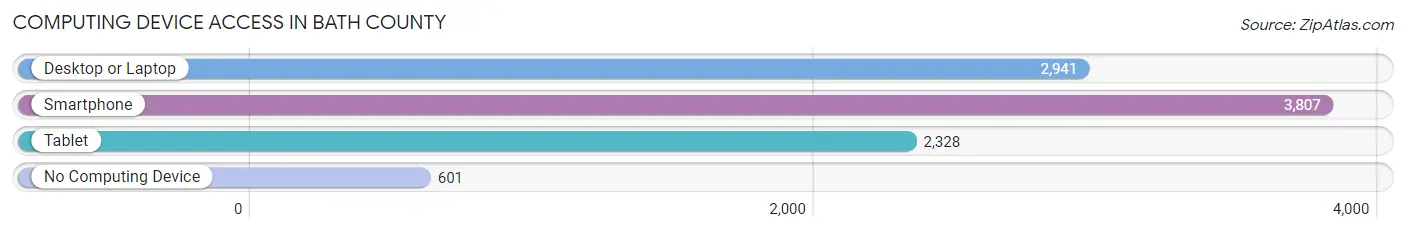
| Device Type | # Households | % Households |
| Desktop or Laptop | 2,941 | 60.7% |
| Smartphone | 3,807 | 78.6% |
| Tablet | 2,328 | 48.1% |
| No Computing Device | 601 | 12.4% |
| Total | 4,844 | 100.0% |
Internet Access in Bath County
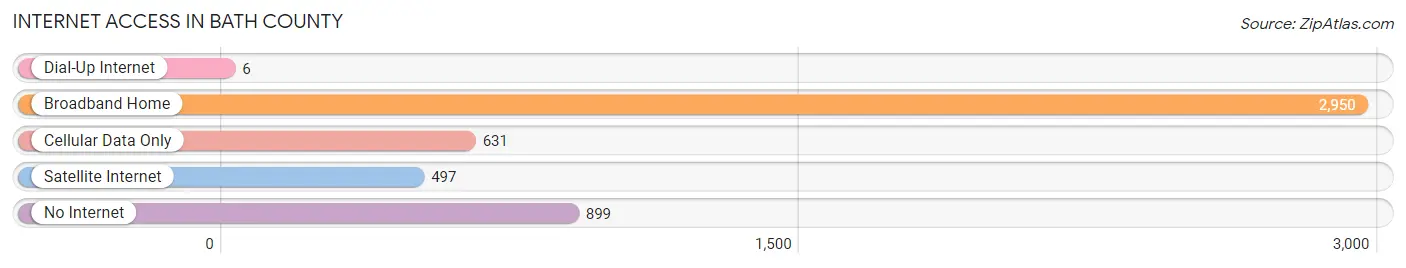
| Internet Type | # Households | % Households |
| Dial-Up Internet | 6 | 0.1% |
| Broadband Home | 2,950 | 60.9% |
| Cellular Data Only | 631 | 13.0% |
| Satellite Internet | 497 | 10.3% |
| No Internet | 899 | 18.6% |
| Total | 4,844 | 100.0% |
Bath County Summary
Bath County is a county located in the eastern part of the Commonwealth of Kentucky. It is part of the Mount Sterling-Morehead-Pikeville Combined Statistical Area. As of the 2010 census, the population was 11,591. The county seat is Owingsville.
History
Bath County was formed in 1811 from parts of Montgomery and Mason counties. It was named for the English spa and resort city of Bath. The county was a center of salt production in the 19th century, and salt works were located along the Licking River.
Geography
Bath County is located in the eastern part of Kentucky, and is bordered by Montgomery County to the north, Menifee County to the east, Rowan County to the south, and Fleming County to the west. The county has a total area of 441 square miles, of which 439 square miles is land and 2.2 square miles (0.5%) is water.
The county is located in the foothills of the Appalachian Mountains, and is mostly hilly and forested. The Licking River flows through the county, and is a popular destination for fishing and canoeing.
Economy
The economy of Bath County is largely based on agriculture and tourism. The county is home to several large farms, and the main crops grown are corn, soybeans, and hay. The county is also home to several wineries, and is a popular destination for wine tours.
Tourism is also an important part of the economy. The county is home to several state parks, including Cave Run Lake, which is a popular destination for fishing, boating, and camping. The county is also home to several historic sites, including the Owingsville Historic District and the Salt Lick Historic District.
Demographics
As of the 2010 census, there were 11,591 people, 4,541 households, and 3,092 families residing in the county. The population density was 26.3 people per square mile. The racial makeup of the county was 97.3% White, 0.9% Black or African American, 0.2% Native American, 0.2% Asian, 0.1% Pacific Islander, 0.3% from other races, and 0.9% from two or more races. 1.3% of the population were Hispanic or Latino of any race.
The median income for a household in the county was $33,945, and the median income for a family was $41,945. The per capita income for the county was $17,845. About 16.2% of families and 19.7% of the population were below the poverty line, including 25.2% of those under age 18 and 16.2% of those age 65 or over.
Common Questions
What is Per Capita Income in Bath County?
Per Capita income in Bath County is $27,018.
What is the Median Family Income in Bath County?
Median Family Income in Bath County is $60,313.
What is the Median Household income in Bath County?
Median Household Income in Bath County is $51,471.
What is Income or Wage Gap in Bath County?
Income or Wage Gap in Bath County is 26.6%.
Women in Bath County earn 73.4 cents for every dollar earned by a man.
What is Family Income Deficit in Bath County?
Family Income Deficit in Bath County is $10,528.
Families that are below poverty line in Bath County earn $10,528 less on average than the poverty threshold level.
What is Inequality or Gini Index in Bath County?
Inequality or Gini Index in Bath County is 0.52.
What is the Total Population of Bath County?
Total Population of Bath County is 12,739.
What is the Total Male Population of Bath County?
Total Male Population of Bath County is 6,434.
What is the Total Female Population of Bath County?
Total Female Population of Bath County is 6,305.
What is the Ratio of Males per 100 Females in Bath County?
There are 102.05 Males per 100 Females in Bath County.
What is the Ratio of Females per 100 Males in Bath County?
There are 98.00 Females per 100 Males in Bath County.
What is the Median Population Age in Bath County?
Median Population Age in Bath County is 39.5 Years.
What is the Average Family Size in Bath County
Average Family Size in Bath County is 3.1 People.
What is the Average Household Size in Bath County
Average Household Size in Bath County is 2.6 People.
How Large is the Labor Force in Bath County?
There are 5,009 People in the Labor Forcein in Bath County.
What is the Percentage of People in the Labor Force in Bath County?
51.0% of People are in the Labor Force in Bath County.
What is the Unemployment Rate in Bath County?
Unemployment Rate in Bath County is 2.9%.