Ballard County, KY Map & Demographics
Ballard County Map
Ballard County Overview
$31,315
PER CAPITA INCOME
$75,268
AVG FAMILY INCOME
$57,111
AVG HOUSEHOLD INCOME
23.7%
WAGE / INCOME GAP [ % ]
76.3¢/ $1
WAGE / INCOME GAP [ $ ]
$13,087
FAMILY INCOME DEFICIT
0.46
INEQUALITY / GINI INDEX
7,742
TOTAL POPULATION
3,905
MALE POPULATION
3,837
FEMALE POPULATION
101.77
MALES / 100 FEMALES
98.26
FEMALES / 100 MALES
44.7
MEDIAN AGE
3.1
AVG FAMILY SIZE
2.6
AVG HOUSEHOLD SIZE
3,433
LABOR FORCE [ PEOPLE ]
53.4%
PERCENT IN LABOR FORCE
5.2%
UNEMPLOYMENT RATE
Ballard County Area Codes
Income in Ballard County
Income Overview in Ballard County
Per Capita Income in Ballard County is $31,315, while median incomes of families and households are $75,268 and $57,111 respectively.
| Characteristic | Number | Measure |
| Per Capita Income | 7,742 | $31,315 |
| Median Family Income | 2,036 | $75,268 |
| Mean Family Income | 2,036 | $93,464 |
| Median Household Income | 2,959 | $57,111 |
| Mean Household Income | 2,959 | $77,040 |
| Income Deficit | 2,036 | $13,087 |
| Wage / Income Gap (%) | 7,742 | 23.75% |
| Wage / Income Gap ($) | 7,742 | 76.25¢ per $1 |
| Gini / Inequality Index | 7,742 | 0.46 |
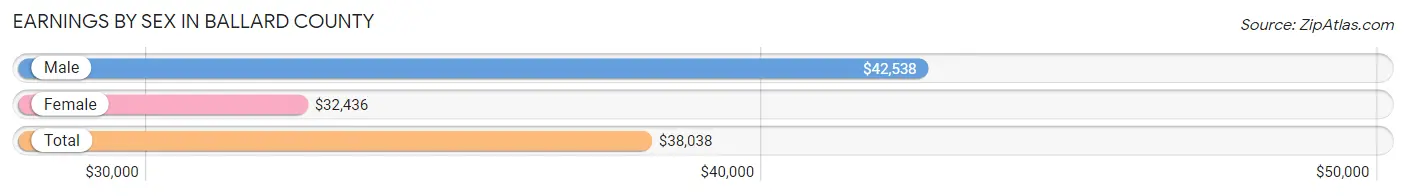
Earnings by Sex in Ballard County
Average Earnings in Ballard County are $38,038, $42,538 for men and $32,436 for women, a difference of 23.7%.
| Sex | Number | Average Earnings |
| Male | 1,993 (55.9%) | $42,538 |
| Female | 1,572 (44.1%) | $32,436 |
| Total | 3,565 (100.0%) | $38,038 |
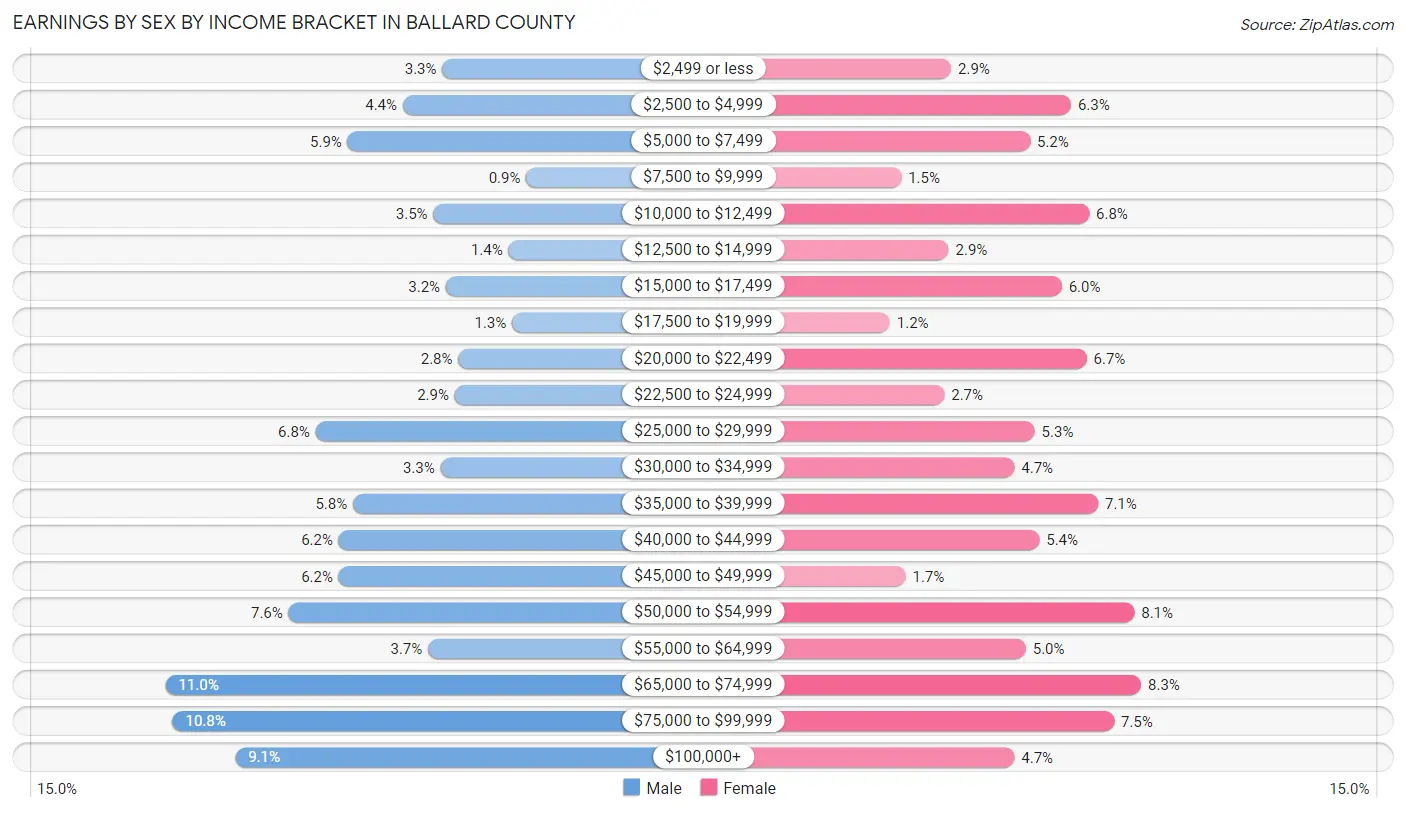
Earnings by Sex by Income Bracket in Ballard County
The most common earnings brackets in Ballard County are $65,000 to $74,999 for men (220 | 11.0%) and $65,000 to $74,999 for women (130 | 8.3%).
| Income | Male | Female |
| $2,499 or less | 65 (3.3%) | 46 (2.9%) |
| $2,500 to $4,999 | 87 (4.4%) | 99 (6.3%) |
| $5,000 to $7,499 | 118 (5.9%) | 81 (5.1%) |
| $7,500 to $9,999 | 18 (0.9%) | 24 (1.5%) |
| $10,000 to $12,499 | 70 (3.5%) | 107 (6.8%) |
| $12,500 to $14,999 | 28 (1.4%) | 45 (2.9%) |
| $15,000 to $17,499 | 63 (3.2%) | 95 (6.0%) |
| $17,500 to $19,999 | 26 (1.3%) | 19 (1.2%) |
| $20,000 to $22,499 | 56 (2.8%) | 106 (6.7%) |
| $22,500 to $24,999 | 58 (2.9%) | 43 (2.7%) |
| $25,000 to $29,999 | 136 (6.8%) | 83 (5.3%) |
| $30,000 to $34,999 | 66 (3.3%) | 74 (4.7%) |
| $35,000 to $39,999 | 115 (5.8%) | 111 (7.1%) |
| $40,000 to $44,999 | 123 (6.2%) | 85 (5.4%) |
| $45,000 to $49,999 | 123 (6.2%) | 26 (1.7%) |
| $50,000 to $54,999 | 151 (7.6%) | 127 (8.1%) |
| $55,000 to $64,999 | 73 (3.7%) | 79 (5.0%) |
| $65,000 to $74,999 | 220 (11.0%) | 130 (8.3%) |
| $75,000 to $99,999 | 216 (10.8%) | 118 (7.5%) |
| $100,000+ | 181 (9.1%) | 74 (4.7%) |
| Total | 1,993 (100.0%) | 1,572 (100.0%) |
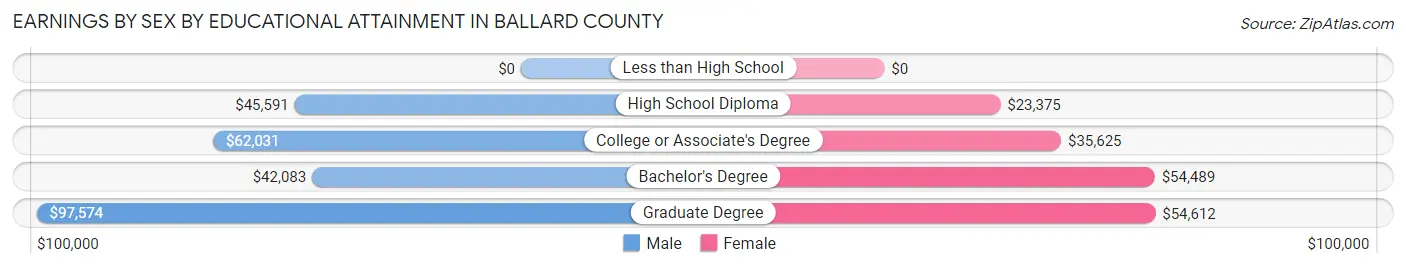
Earnings by Sex by Educational Attainment in Ballard County
Average earnings in Ballard County are $49,563 for men and $36,758 for women, a difference of 25.8%. Men with an educational attainment of graduate degree enjoy the highest average annual earnings of $97,574, while those with bachelor's degree education earn the least with $42,083. Women with an educational attainment of graduate degree earn the most with the average annual earnings of $54,612, while those with high school diploma education have the smallest earnings of $23,375.
| Educational Attainment | Male Income | Female Income |
| Less than High School | - | - |
| High School Diploma | $45,591 | $23,375 |
| College or Associate's Degree | $62,031 | $35,625 |
| Bachelor's Degree | $42,083 | $54,489 |
| Graduate Degree | $97,574 | $54,612 |
| Total | $49,563 | $36,758 |
Family Income in Ballard County
Family Income Brackets in Ballard County
According to the Ballard County family income data, there are 397 families falling into the $100,000 to $149,999 income range, which is the most common income bracket and makes up 19.5% of all families. Conversely, the $10,000 to $14,999 income bracket is the least frequent group with only 57 families (2.8%) belonging to this category.
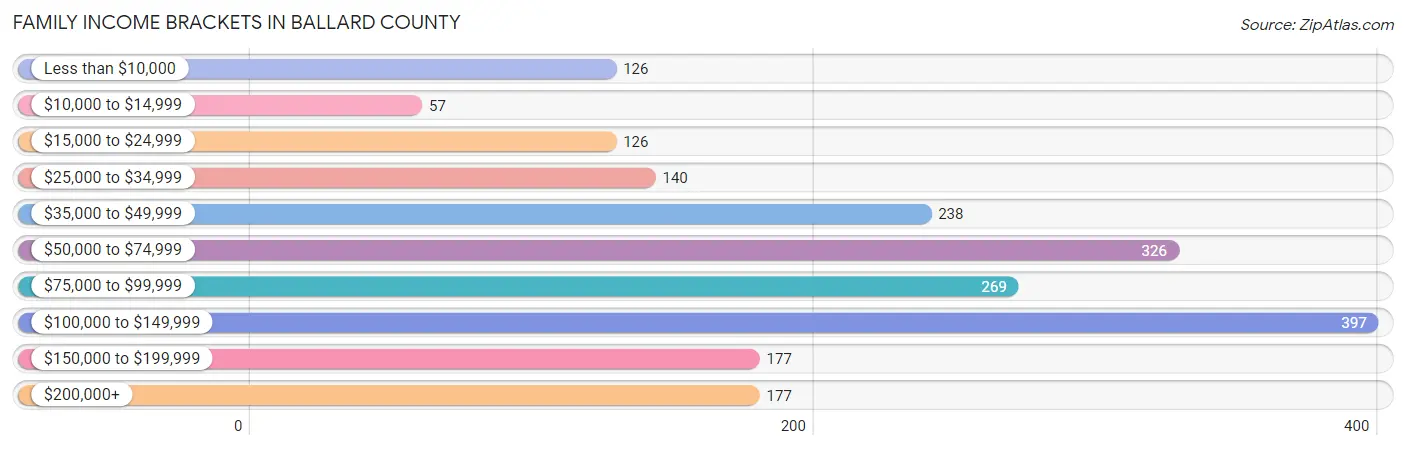
| Income Bracket | # Families | % Families |
| Less than $10,000 | 126 | 6.2% |
| $10,000 to $14,999 | 57 | 2.8% |
| $15,000 to $24,999 | 126 | 6.2% |
| $25,000 to $34,999 | 140 | 6.9% |
| $35,000 to $49,999 | 238 | 11.7% |
| $50,000 to $74,999 | 326 | 16.0% |
| $75,000 to $99,999 | 269 | 13.2% |
| $100,000 to $149,999 | 397 | 19.5% |
| $150,000 to $199,999 | 177 | 8.7% |
| $200,000+ | 177 | 8.7% |
Family Income by Famaliy Size in Ballard County
7+ person families (52 | 2.5%) account for the highest median family income in Ballard County with $248,333 per family, while 7+ person families (52 | 2.5%) have the highest median income of $35,476 per family member.
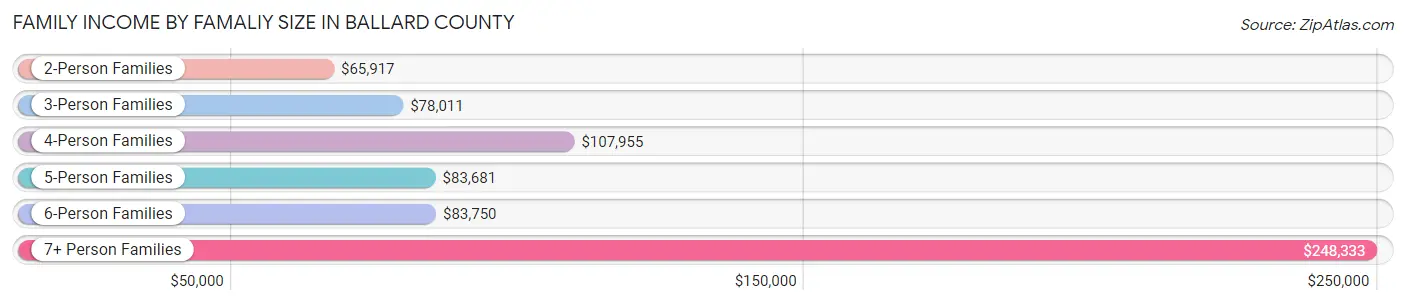
| Income Bracket | # Families | Median Income |
| 2-Person Families | 1,097 (53.9%) | $65,917 |
| 3-Person Families | 409 (20.1%) | $78,011 |
| 4-Person Families | 272 (13.4%) | $107,955 |
| 5-Person Families | 193 (9.5%) | $83,681 |
| 6-Person Families | 13 (0.6%) | $83,750 |
| 7+ Person Families | 52 (2.5%) | $248,333 |
| Total | 2,036 (100.0%) | $75,268 |
Family Income by Number of Earners in Ballard County
The median family income in Ballard County is $75,268, with families comprising 3+ earners (220) having the highest median family income of $154,722, while families with no earners (528) have the lowest median family income of $41,607, accounting for 10.8% and 25.9% of families, respectively.
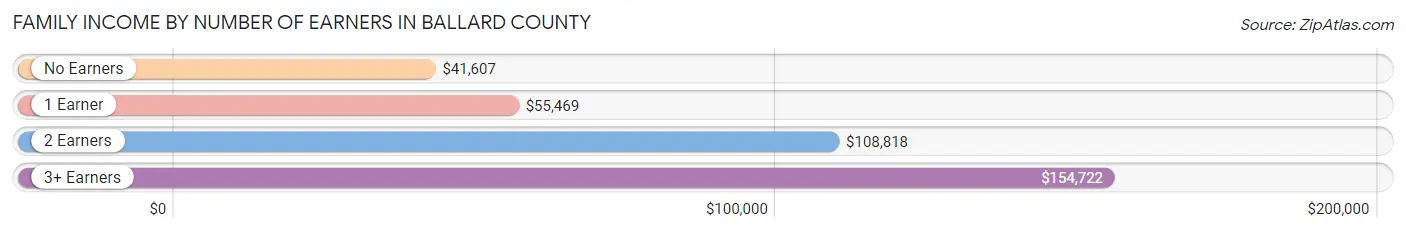
| Number of Earners | # Families | Median Income |
| No Earners | 528 (25.9%) | $41,607 |
| 1 Earner | 615 (30.2%) | $55,469 |
| 2 Earners | 673 (33.1%) | $108,818 |
| 3+ Earners | 220 (10.8%) | $154,722 |
| Total | 2,036 (100.0%) | $75,268 |
Household Income in Ballard County
Household Income Brackets in Ballard County
With 524 households falling in the category, the $50,000 to $74,999 income range is the most frequent in Ballard County, accounting for 17.7% of all households. In contrast, only 133 households (4.5%) fall into the $10,000 to $14,999 income bracket, making it the least populous group.
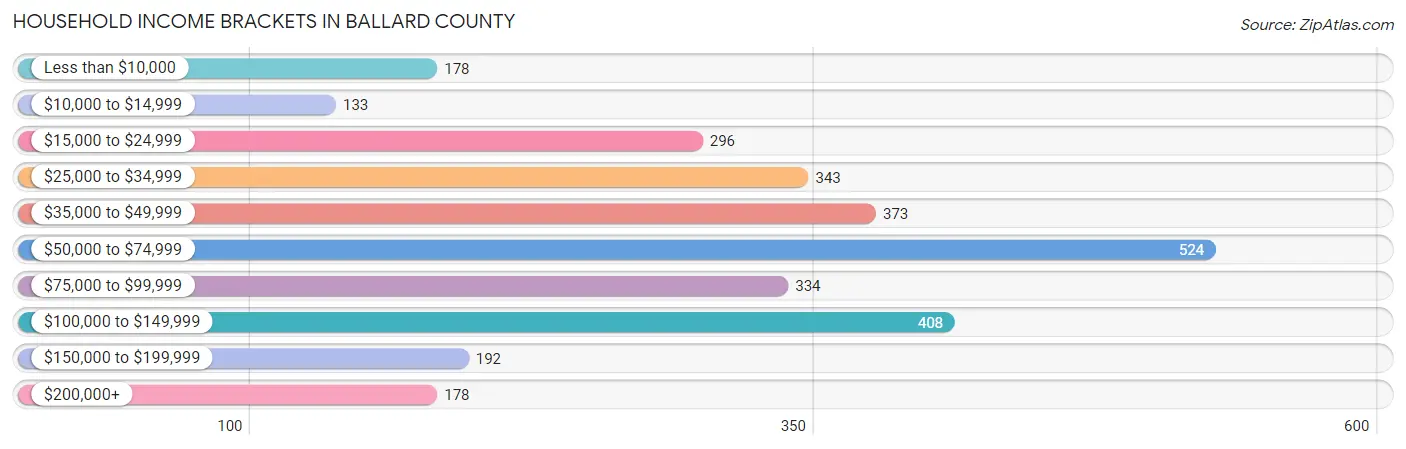
| Income Bracket | # Households | % Households |
| Less than $10,000 | 178 | 6.0% |
| $10,000 to $14,999 | 133 | 4.5% |
| $15,000 to $24,999 | 296 | 10.0% |
| $25,000 to $34,999 | 343 | 11.6% |
| $35,000 to $49,999 | 373 | 12.6% |
| $50,000 to $74,999 | 524 | 17.7% |
| $75,000 to $99,999 | 334 | 11.3% |
| $100,000 to $149,999 | 408 | 13.8% |
| $150,000 to $199,999 | 192 | 6.5% |
| $200,000+ | 178 | 6.0% |
Household Income by Householder Age in Ballard County
The median household income in Ballard County is $57,111, with the highest median household income of $70,750 found in the 45 to 64 years age bracket for the primary householder. A total of 1,079 households (36.5%) fall into this category. Meanwhile, the 15 to 24 years age bracket for the primary householder has the lowest median household income of $26,553, with 101 households (3.4%) in this group.
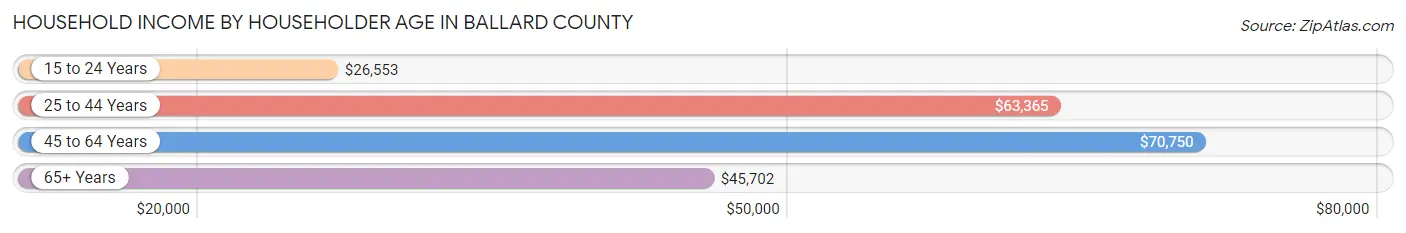
| Income Bracket | # Households | Median Income |
| 15 to 24 Years | 101 (3.4%) | $26,553 |
| 25 to 44 Years | 761 (25.7%) | $63,365 |
| 45 to 64 Years | 1,079 (36.5%) | $70,750 |
| 65+ Years | 1,018 (34.4%) | $45,702 |
| Total | 2,959 (100.0%) | $57,111 |
Poverty in Ballard County
Income Below Poverty by Sex and Age in Ballard County
With 13.5% poverty level for males and 15.1% for females among the residents of Ballard County, 5 year old males and 12 to 14 year old females are the most vulnerable to poverty, with 12 males (75.0%) and 54 females (46.6%) in their respective age groups living below the poverty level.
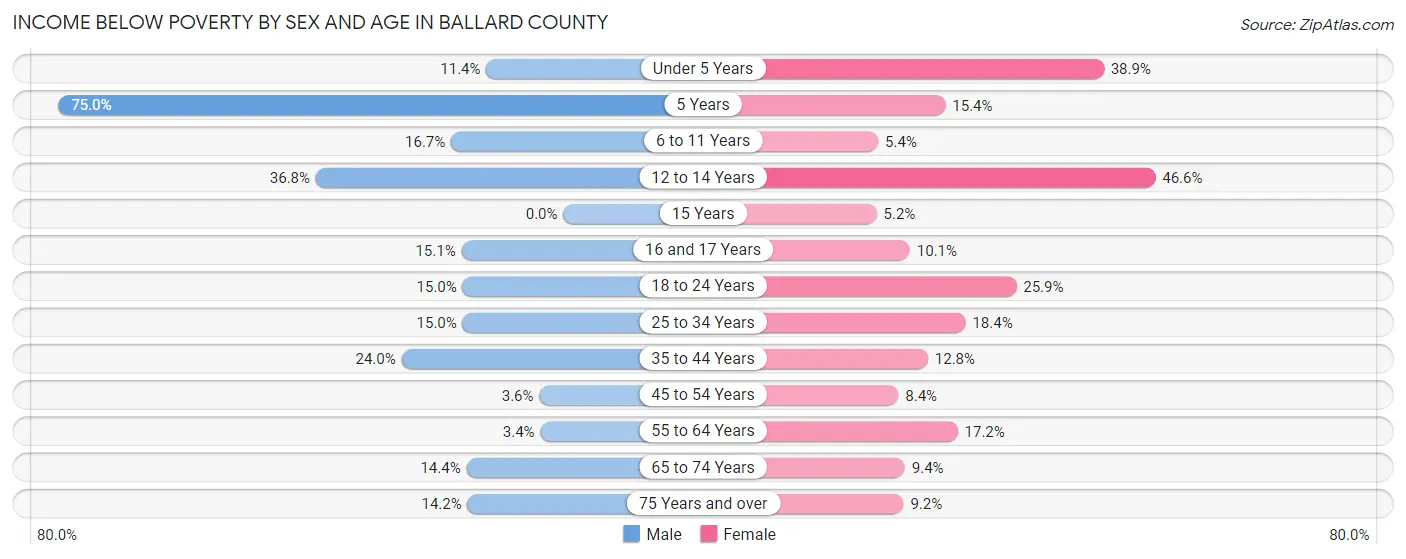
| Age Bracket | Male | Female |
| Under 5 Years | 20 (11.4%) | 63 (38.9%) |
| 5 Years | 12 (75.0%) | 12 (15.4%) |
| 6 to 11 Years | 56 (16.7%) | 11 (5.4%) |
| 12 to 14 Years | 43 (36.7%) | 54 (46.6%) |
| 15 Years | 0 (0.0%) | 3 (5.2%) |
| 16 and 17 Years | 23 (15.1%) | 9 (10.1%) |
| 18 to 24 Years | 57 (15.0%) | 64 (25.9%) |
| 25 to 34 Years | 57 (15.0%) | 70 (18.4%) |
| 35 to 44 Years | 105 (24.0%) | 58 (12.8%) |
| 45 to 54 Years | 19 (3.6%) | 41 (8.4%) |
| 55 to 64 Years | 18 (3.4%) | 97 (17.2%) |
| 65 to 74 Years | 68 (14.4%) | 48 (9.4%) |
| 75 Years and over | 40 (14.2%) | 37 (9.2%) |
| Total | 518 (13.5%) | 567 (15.1%) |
Income Above Poverty by Sex and Age in Ballard County
According to the poverty statistics in Ballard County, males aged 15 years and females aged 15 years are the age groups that are most secure financially, with 100.0% of males and 94.8% of females in these age groups living above the poverty line.
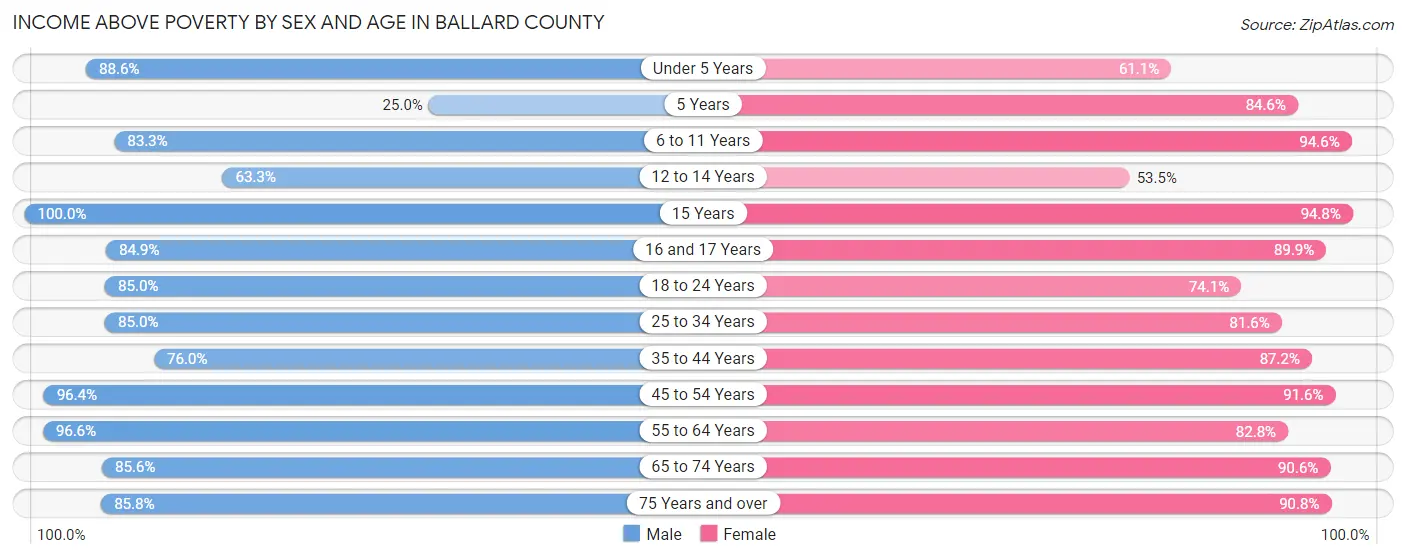
| Age Bracket | Male | Female |
| Under 5 Years | 155 (88.6%) | 99 (61.1%) |
| 5 Years | 4 (25.0%) | 66 (84.6%) |
| 6 to 11 Years | 280 (83.3%) | 193 (94.6%) |
| 12 to 14 Years | 74 (63.2%) | 62 (53.4%) |
| 15 Years | 18 (100.0%) | 55 (94.8%) |
| 16 and 17 Years | 129 (84.9%) | 80 (89.9%) |
| 18 to 24 Years | 324 (85.0%) | 183 (74.1%) |
| 25 to 34 Years | 324 (85.0%) | 311 (81.6%) |
| 35 to 44 Years | 332 (76.0%) | 396 (87.2%) |
| 45 to 54 Years | 515 (96.4%) | 447 (91.6%) |
| 55 to 64 Years | 512 (96.6%) | 467 (82.8%) |
| 65 to 74 Years | 405 (85.6%) | 465 (90.6%) |
| 75 Years and over | 241 (85.8%) | 367 (90.8%) |
| Total | 3,313 (86.5%) | 3,191 (84.9%) |
Income Below Poverty Among Married-Couple Families in Ballard County
The poverty statistics for married-couple families in Ballard County show that 7.2% or 117 of the total 1,620 families live below the poverty line. Families with 5 or more children have the highest poverty rate of 100.0%, comprising of 2 families. On the other hand, families with 3 or 4 children have the lowest poverty rate of 3.7%, which includes 5 families.
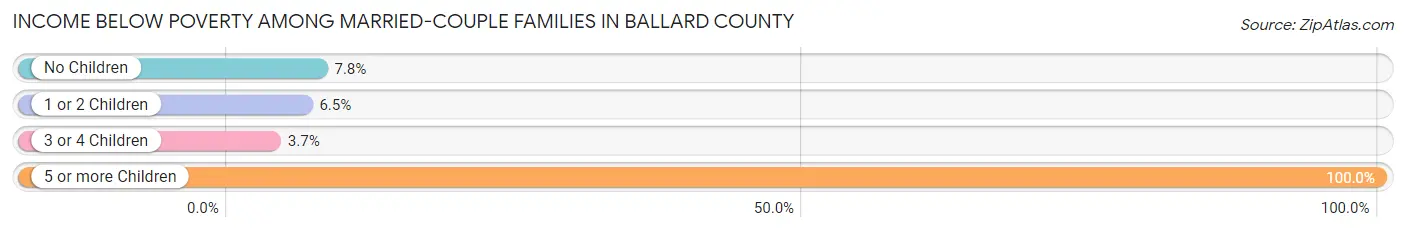
| Children | Above Poverty | Below Poverty |
| No Children | 970 (92.2%) | 82 (7.8%) |
| 1 or 2 Children | 404 (93.5%) | 28 (6.5%) |
| 3 or 4 Children | 129 (96.3%) | 5 (3.7%) |
| 5 or more Children | 0 (0.0%) | 2 (100.0%) |
| Total | 1,503 (92.8%) | 117 (7.2%) |
Income Below Poverty Among Single-Parent Households in Ballard County
According to the poverty data in Ballard County, 32.5% or 55 single-father households and 35.6% or 88 single-mother households are living below the poverty line. Among single-father households, those with 1 or 2 children have the highest poverty rate, with 55 households (50.5%) experiencing poverty. Likewise, among single-mother households, those with 3 or 4 children have the highest poverty rate, with 20 households (100.0%) falling below the poverty line.
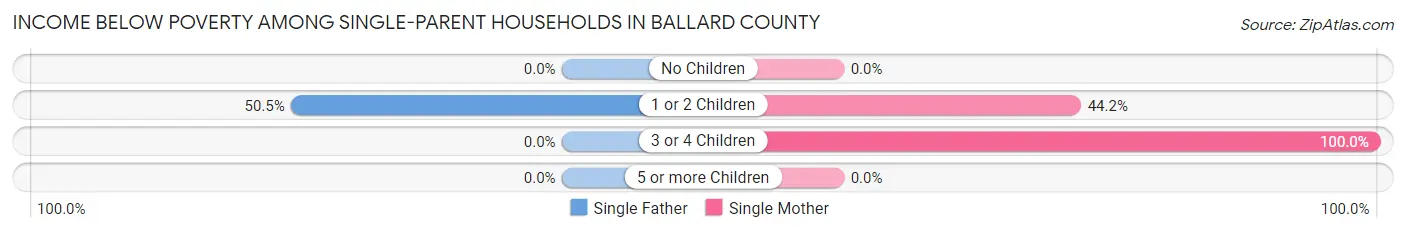
| Children | Single Father | Single Mother |
| No Children | 0 (0.0%) | 0 (0.0%) |
| 1 or 2 Children | 55 (50.5%) | 68 (44.2%) |
| 3 or 4 Children | 0 (0.0%) | 20 (100.0%) |
| 5 or more Children | 0 (0.0%) | 0 (0.0%) |
| Total | 55 (32.5%) | 88 (35.6%) |
Income Below Poverty Among Married-Couple vs Single-Parent Households in Ballard County
The poverty data for Ballard County shows that 117 of the married-couple family households (7.2%) and 143 of the single-parent households (34.4%) are living below the poverty level. Within the married-couple family households, those with 5 or more children have the highest poverty rate, with 2 households (100.0%) falling below the poverty line. Among the single-parent households, those with 3 or 4 children have the highest poverty rate, with 20 household (69.0%) living below poverty.
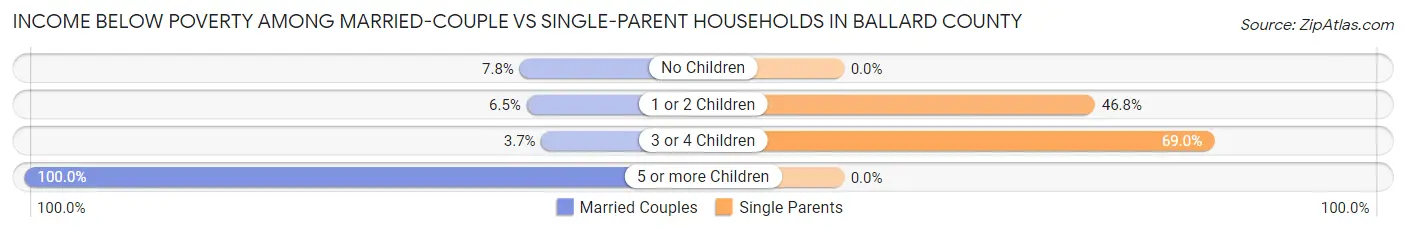
| Children | Married-Couple Families | Single-Parent Households |
| No Children | 82 (7.8%) | 0 (0.0%) |
| 1 or 2 Children | 28 (6.5%) | 123 (46.8%) |
| 3 or 4 Children | 5 (3.7%) | 20 (69.0%) |
| 5 or more Children | 2 (100.0%) | 0 (0.0%) |
| Total | 117 (7.2%) | 143 (34.4%) |
Race in Ballard County
The most populous races in Ballard County are White / Caucasian (7,162 | 92.5%), Black / African American (301 | 3.9%), and Two or more Races (226 | 2.9%).
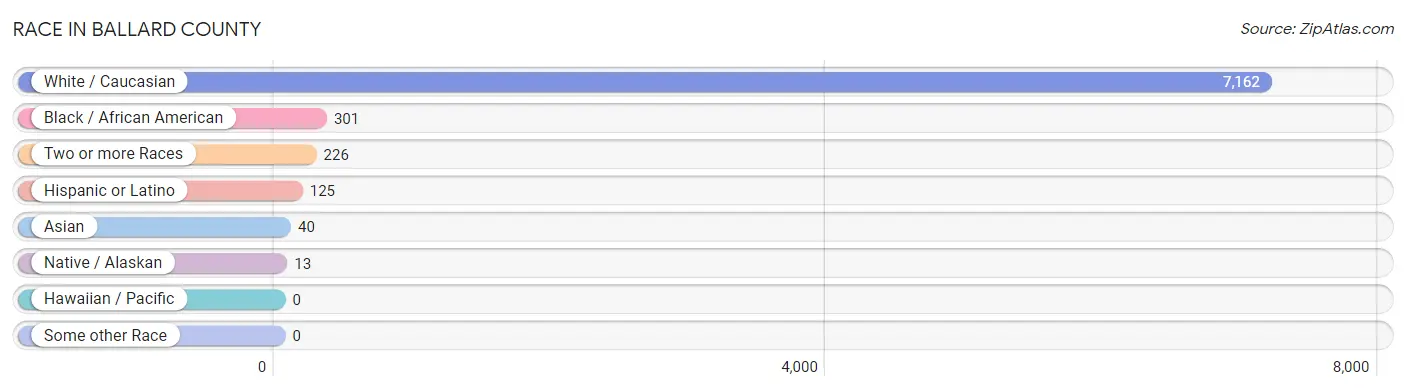
| Race | # Population | % Population |
| Asian | 40 | 0.5% |
| Black / African American | 301 | 3.9% |
| Hawaiian / Pacific | 0 | 0.0% |
| Hispanic or Latino | 125 | 1.6% |
| Native / Alaskan | 13 | 0.2% |
| White / Caucasian | 7,162 | 92.5% |
| Two or more Races | 226 | 2.9% |
| Some other Race | 0 | 0.0% |
| Total | 7,742 | 100.0% |
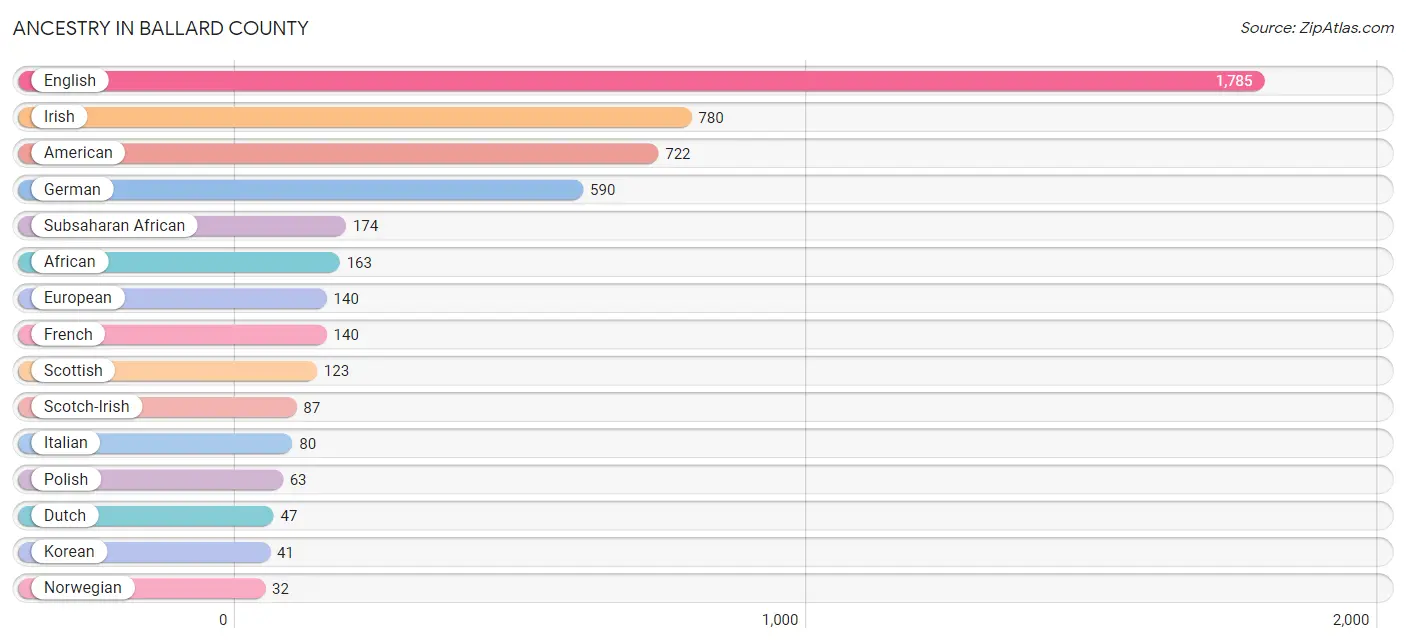
Ancestry in Ballard County
The most populous ancestries reported in Ballard County are English (1,785 | 23.1%), Irish (780 | 10.1%), American (722 | 9.3%), German (590 | 7.6%), and Subsaharan African (174 | 2.2%), together accounting for 52.3% of all Ballard County residents.
| Ancestry | # Population | % Population |
| African | 163 | 2.1% |
| American | 722 | 9.3% |
| Arab | 17 | 0.2% |
| Austrian | 4 | 0.1% |
| Bhutanese | 5 | 0.1% |
| Central American | 11 | 0.1% |
| Central American Indian | 11 | 0.1% |
| Cherokee | 29 | 0.4% |
| Cuban | 22 | 0.3% |
| Czech | 3 | 0.0% |
| Danish | 1 | 0.0% |
| Dominican | 4 | 0.1% |
| Dutch | 47 | 0.6% |
| English | 1,785 | 23.1% |
| European | 140 | 1.8% |
| French | 140 | 1.8% |
| German | 590 | 7.6% |
| Guatemalan | 11 | 0.1% |
| Haitian | 3 | 0.0% |
| Hungarian | 3 | 0.0% |
| Irish | 780 | 10.1% |
| Italian | 80 | 1.0% |
| Kenyan | 3 | 0.0% |
| Korean | 41 | 0.5% |
| Mexican | 19 | 0.3% |
| Native Hawaiian | 6 | 0.1% |
| Nigerian | 8 | 0.1% |
| Norwegian | 32 | 0.4% |
| Polish | 63 | 0.8% |
| Scotch-Irish | 87 | 1.1% |
| Scottish | 123 | 1.6% |
| Spanish | 2 | 0.0% |
| Sri Lankan | 16 | 0.2% |
| Subsaharan African | 174 | 2.2% |
| Swedish | 5 | 0.1% |
| Thai | 13 | 0.2% |
| Welsh | 16 | 0.2% |
| Yugoslavian | 3 | 0.0% | View All 38 Rows |
Immigrants in Ballard County
The most numerous immigrant groups reported in Ballard County came from Europe (35 | 0.4%), Asia (33 | 0.4%), Germany (31 | 0.4%), Western Europe (31 | 0.4%), and Latin America (14 | 0.2%), together accounting for 1.9% of all Ballard County residents.
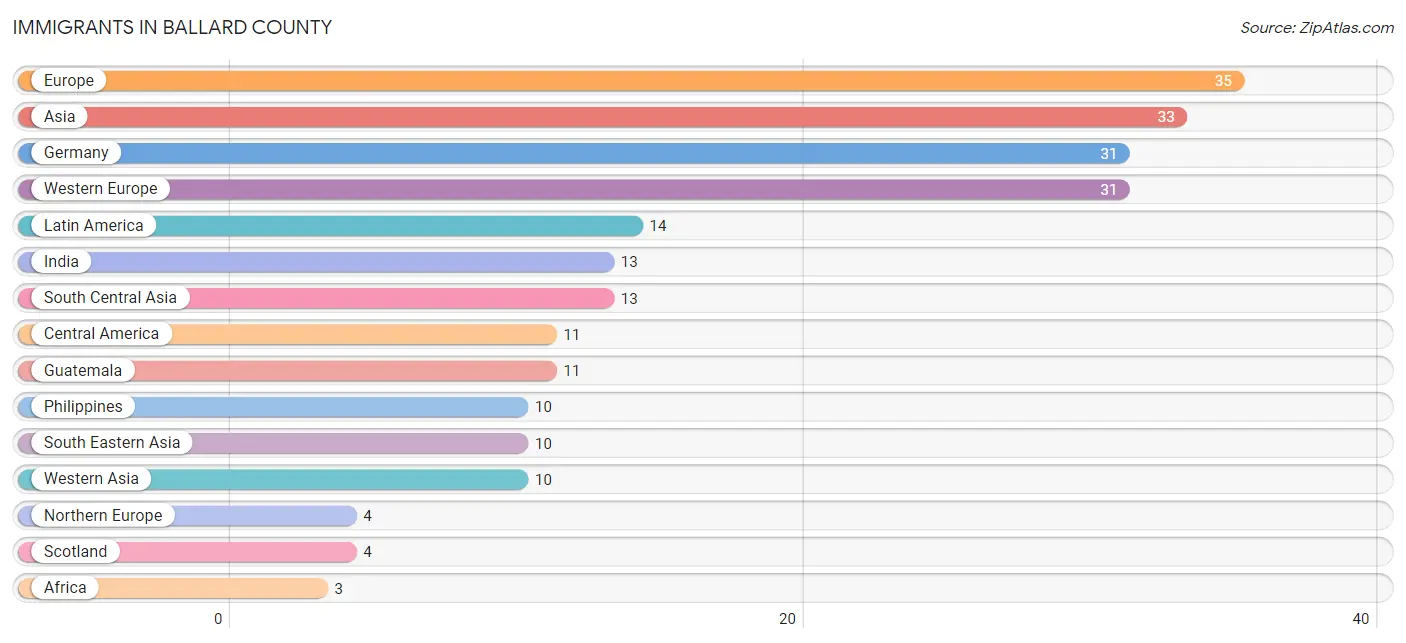
| Immigration Origin | # Population | % Population |
| Africa | 3 | 0.0% |
| Asia | 33 | 0.4% |
| Caribbean | 3 | 0.0% |
| Central America | 11 | 0.1% |
| Dominican Republic | 3 | 0.0% |
| Eastern Africa | 3 | 0.0% |
| Europe | 35 | 0.4% |
| Germany | 31 | 0.4% |
| Guatemala | 11 | 0.1% |
| India | 13 | 0.2% |
| Kenya | 3 | 0.0% |
| Latin America | 14 | 0.2% |
| Northern Europe | 4 | 0.1% |
| Philippines | 10 | 0.1% |
| Scotland | 4 | 0.1% |
| South Central Asia | 13 | 0.2% |
| South Eastern Asia | 10 | 0.1% |
| Western Asia | 10 | 0.1% |
| Western Europe | 31 | 0.4% | View All 19 Rows |
Sex and Age in Ballard County
Sex and Age in Ballard County
The most populous age groups in Ballard County are 55 to 59 Years (304 | 7.8%) for men and 60 to 64 Years (338 | 8.8%) for women.
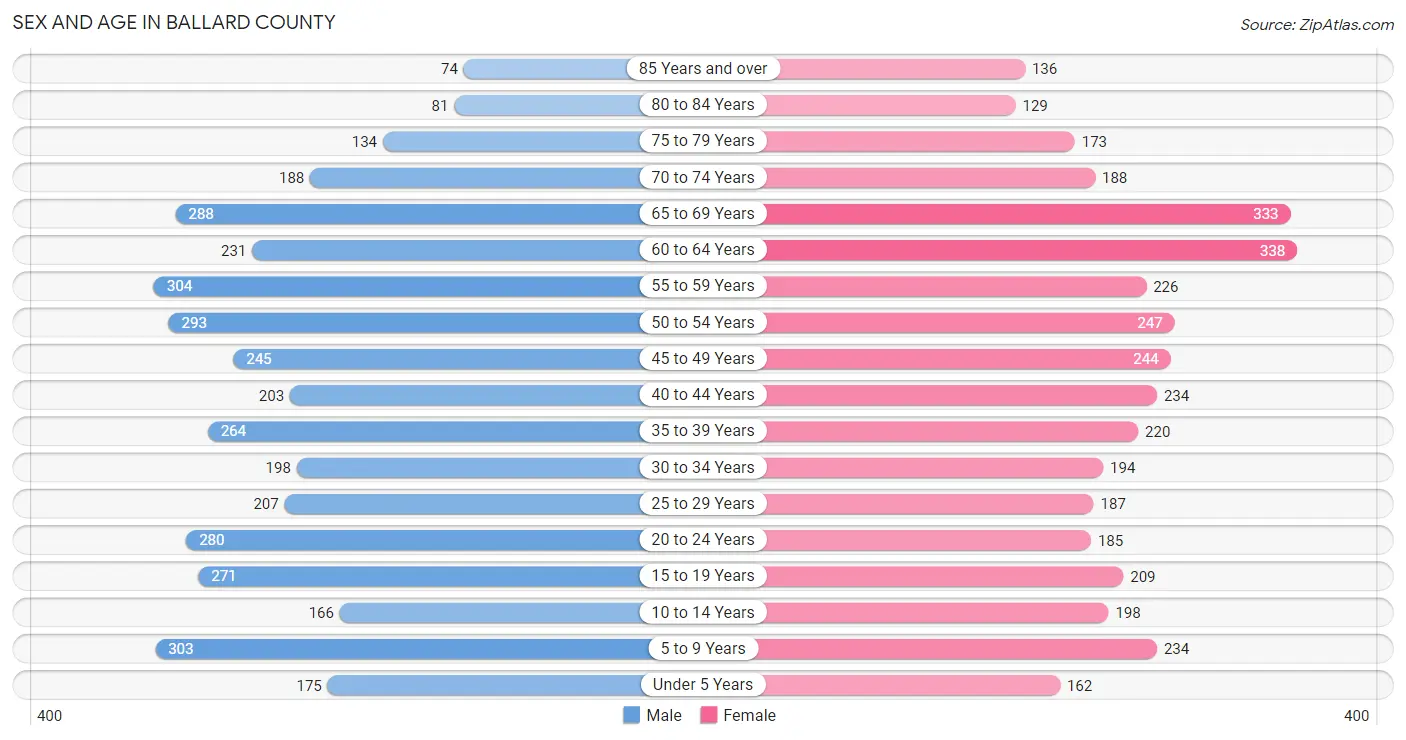
| Age Bracket | Male | Female |
| Under 5 Years | 175 (4.5%) | 162 (4.2%) |
| 5 to 9 Years | 303 (7.8%) | 234 (6.1%) |
| 10 to 14 Years | 166 (4.3%) | 198 (5.2%) |
| 15 to 19 Years | 271 (6.9%) | 209 (5.4%) |
| 20 to 24 Years | 280 (7.2%) | 185 (4.8%) |
| 25 to 29 Years | 207 (5.3%) | 187 (4.9%) |
| 30 to 34 Years | 198 (5.1%) | 194 (5.1%) |
| 35 to 39 Years | 264 (6.8%) | 220 (5.7%) |
| 40 to 44 Years | 203 (5.2%) | 234 (6.1%) |
| 45 to 49 Years | 245 (6.3%) | 244 (6.4%) |
| 50 to 54 Years | 293 (7.5%) | 247 (6.4%) |
| 55 to 59 Years | 304 (7.8%) | 226 (5.9%) |
| 60 to 64 Years | 231 (5.9%) | 338 (8.8%) |
| 65 to 69 Years | 288 (7.4%) | 333 (8.7%) |
| 70 to 74 Years | 188 (4.8%) | 188 (4.9%) |
| 75 to 79 Years | 134 (3.4%) | 173 (4.5%) |
| 80 to 84 Years | 81 (2.1%) | 129 (3.4%) |
| 85 Years and over | 74 (1.9%) | 136 (3.5%) |
| Total | 3,905 (100.0%) | 3,837 (100.0%) |
Families and Households in Ballard County
Median Family Size in Ballard County
The median family size in Ballard County is 3.15 persons per family, with married-couple families (1,620 | 79.6%) accounting for the largest median family size of 3.2 persons per family. On the other hand, single male/father families (169 | 8.3%) represent the smallest median family size with 2.73 persons per family.
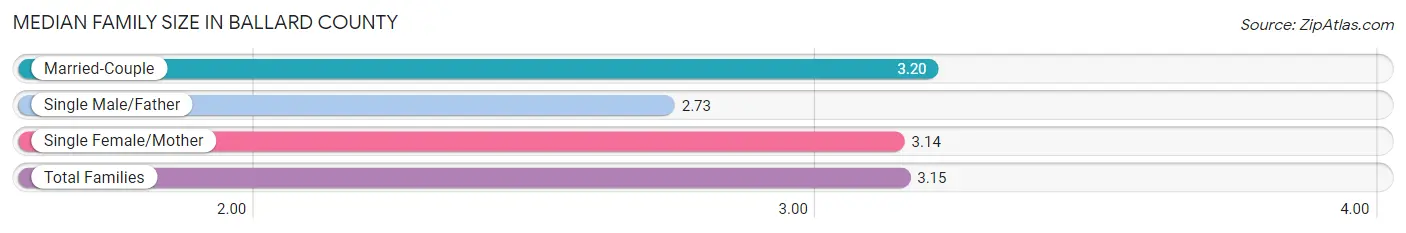
| Family Type | # Families | Family Size |
| Married-Couple | 1,620 (79.6%) | 3.20 |
| Single Male/Father | 169 (8.3%) | 2.73 |
| Single Female/Mother | 247 (12.1%) | 3.14 |
| Total Families | 2,036 (100.0%) | 3.15 |
Median Household Size in Ballard County
The median household size in Ballard County is 2.58 persons per household, with single male/father households (169 | 5.7%) accounting for the largest median household size of 3.36 persons per household. non-family households (923 | 31.2%) represent the smallest median household size with 1.10 persons per household.
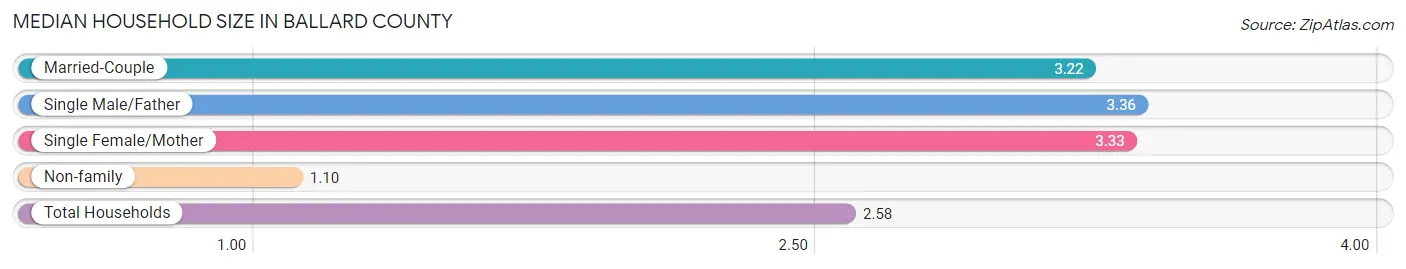
| Household Type | # Households | Household Size |
| Married-Couple | 1,620 (54.7%) | 3.22 |
| Single Male/Father | 169 (5.7%) | 3.36 |
| Single Female/Mother | 247 (8.4%) | 3.33 |
| Non-family | 923 (31.2%) | 1.10 |
| Total Households | 2,959 (100.0%) | 2.58 |
Household Size by Marriage Status in Ballard County
Out of a total of 2,959 households in Ballard County, 2,036 (68.8%) are family households, while 923 (31.2%) are nonfamily households. The most numerous type of family households are 2-person households, comprising 996, and the most common type of nonfamily households are 1-person households, comprising 842.
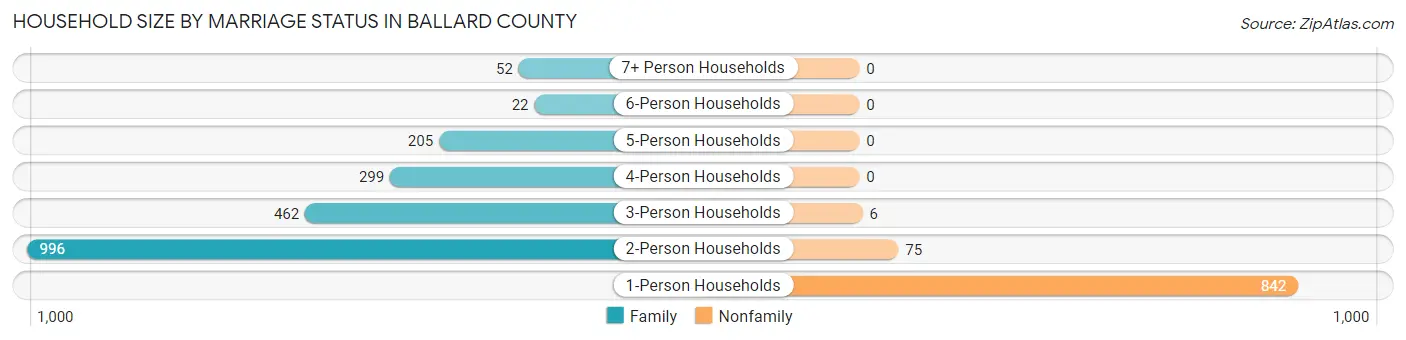
| Household Size | Family Households | Nonfamily Households |
| 1-Person Households | - | 842 (28.5%) |
| 2-Person Households | 996 (33.7%) | 75 (2.5%) |
| 3-Person Households | 462 (15.6%) | 6 (0.2%) |
| 4-Person Households | 299 (10.1%) | 0 (0.0%) |
| 5-Person Households | 205 (6.9%) | 0 (0.0%) |
| 6-Person Households | 22 (0.7%) | 0 (0.0%) |
| 7+ Person Households | 52 (1.8%) | 0 (0.0%) |
| Total | 2,036 (68.8%) | 923 (31.2%) |
Female Fertility in Ballard County
Fertility by Age in Ballard County
Average fertility rate in Ballard County is 7.0 births per 1,000 women. Women in the age bracket of 20 to 34 years have the highest fertility rate with 18.0 births per 1,000 women. Women in the age bracket of 20 to 34 years acount for 90.9% of all women with births.
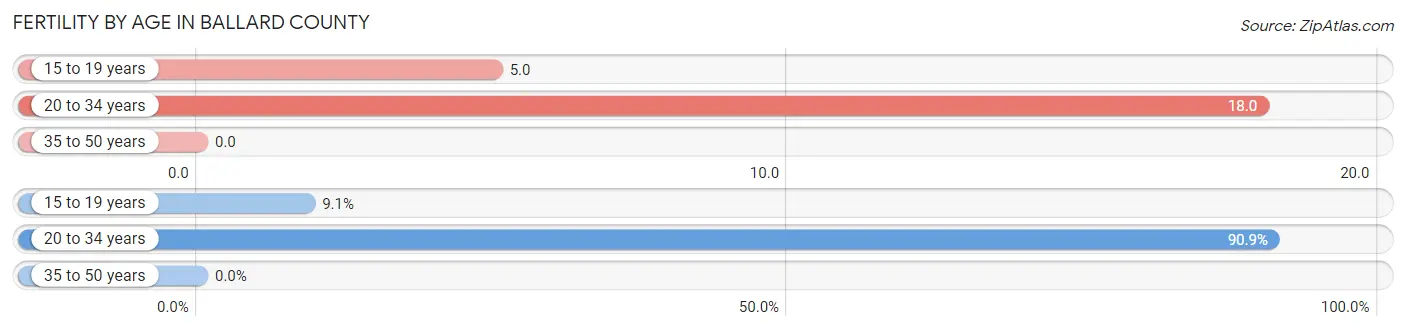
| Age Bracket | Women with Births | Births / 1,000 Women |
| 15 to 19 years | 1 (9.1%) | 5.0 |
| 20 to 34 years | 10 (90.9%) | 18.0 |
| 35 to 50 years | 0 (0.0%) | 0.0 |
| Total | 11 (100.0%) | 7.0 |
Fertility by Age by Marriage Status in Ballard County
18.2% of women with births (11) in Ballard County are married. The highest percentage of unmarried women with births falls into 15 to 19 years age bracket with 100.0% of them unmarried at the time of birth, while the lowest percentage of unmarried women with births belong to 20 to 34 years age bracket with 80.0% of them unmarried.
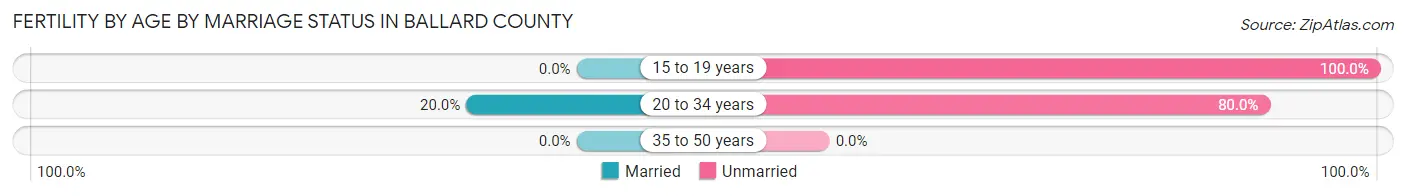
| Age Bracket | Married | Unmarried |
| 15 to 19 years | 0 (0.0%) | 1 (100.0%) |
| 20 to 34 years | 2 (20.0%) | 8 (80.0%) |
| 35 to 50 years | 0 (0.0%) | 0 (0.0%) |
| Total | 2 (18.2%) | 9 (81.8%) |
Fertility by Education in Ballard County
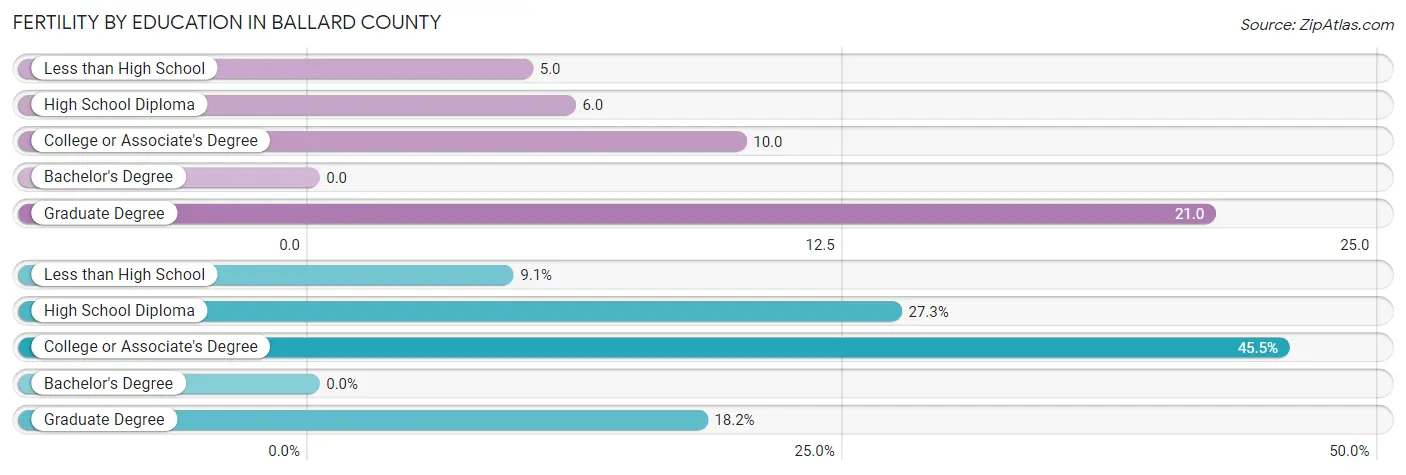
| Educational Attainment | Women with Births | Births / 1,000 Women |
| Less than High School | 1 (9.1%) | 5.0 |
| High School Diploma | 3 (27.3%) | 6.0 |
| College or Associate's Degree | 5 (45.5%) | 10.0 |
| Bachelor's Degree | 0 (0.0%) | 0.0 |
| Graduate Degree | 2 (18.2%) | 21.0 |
| Total | 11 (100.0%) | 7.0 |
Fertility by Education by Marriage Status in Ballard County
81.8% of women with births in Ballard County are unmarried. Women with the educational attainment of graduate degree are most likely to be married with 100.0% of them married at childbirth, while women with the educational attainment of less than high school are least likely to be married with 100.0% of them unmarried at childbirth.
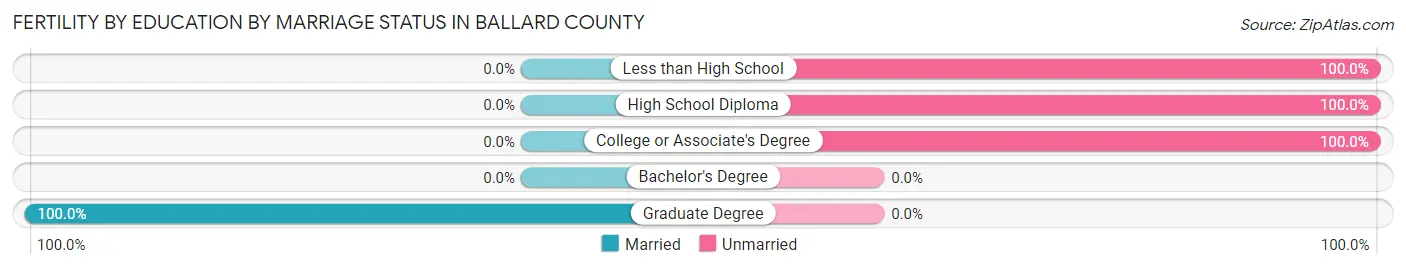
| Educational Attainment | Married | Unmarried |
| Less than High School | 0 (0.0%) | 1 (100.0%) |
| High School Diploma | 0 (0.0%) | 3 (100.0%) |
| College or Associate's Degree | 0 (0.0%) | 5 (100.0%) |
| Bachelor's Degree | 0 (0.0%) | 0 (0.0%) |
| Graduate Degree | 2 (100.0%) | 0 (0.0%) |
| Total | 2 (18.2%) | 9 (81.8%) |
Employment Characteristics in Ballard County
Employment by Class of Employer in Ballard County
Among the 3,224 employed individuals in Ballard County, private company employees (2,150 | 66.7%), not-for-profit organizations (290 | 9.0%), and self-employed (not incorporated) (192 | 6.0%) make up the most common classes of employment.
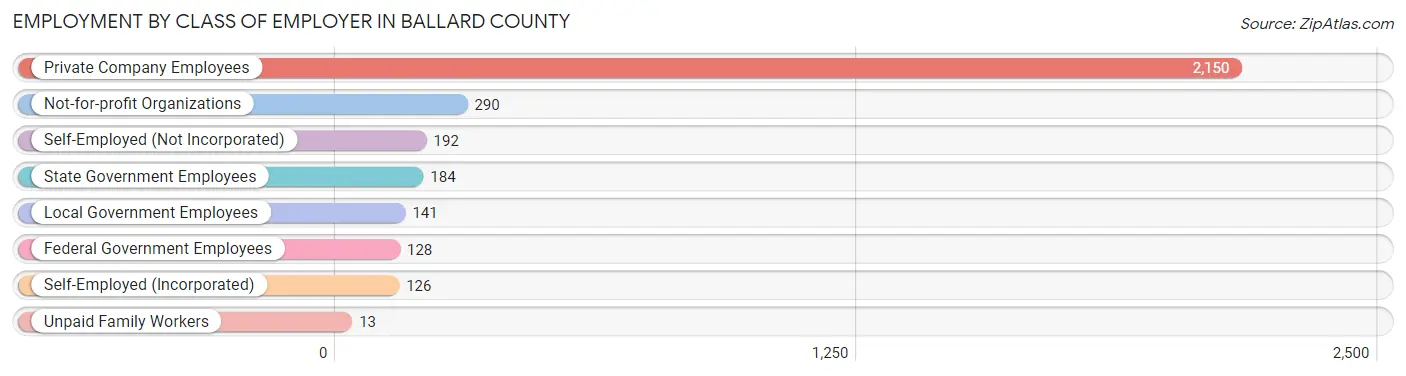
| Employer Class | # Employees | % Employees |
| Private Company Employees | 2,150 | 66.7% |
| Self-Employed (Incorporated) | 126 | 3.9% |
| Self-Employed (Not Incorporated) | 192 | 6.0% |
| Not-for-profit Organizations | 290 | 9.0% |
| Local Government Employees | 141 | 4.4% |
| State Government Employees | 184 | 5.7% |
| Federal Government Employees | 128 | 4.0% |
| Unpaid Family Workers | 13 | 0.4% |
| Total | 3,224 | 100.0% |
Employment Status by Age in Ballard County
According to the labor force statistics for Ballard County, out of the total population over 16 years of age (6,428), 53.4% or 3,433 individuals are in the labor force, with 5.2% or 179 of them unemployed. The age group with the highest labor force participation rate is 30 to 34 years, with 87.8% or 344 individuals in the labor force. Within the labor force, the 30 to 34 years age range has the highest percentage of unemployed individuals, with 8.4% or 29 of them being unemployed.
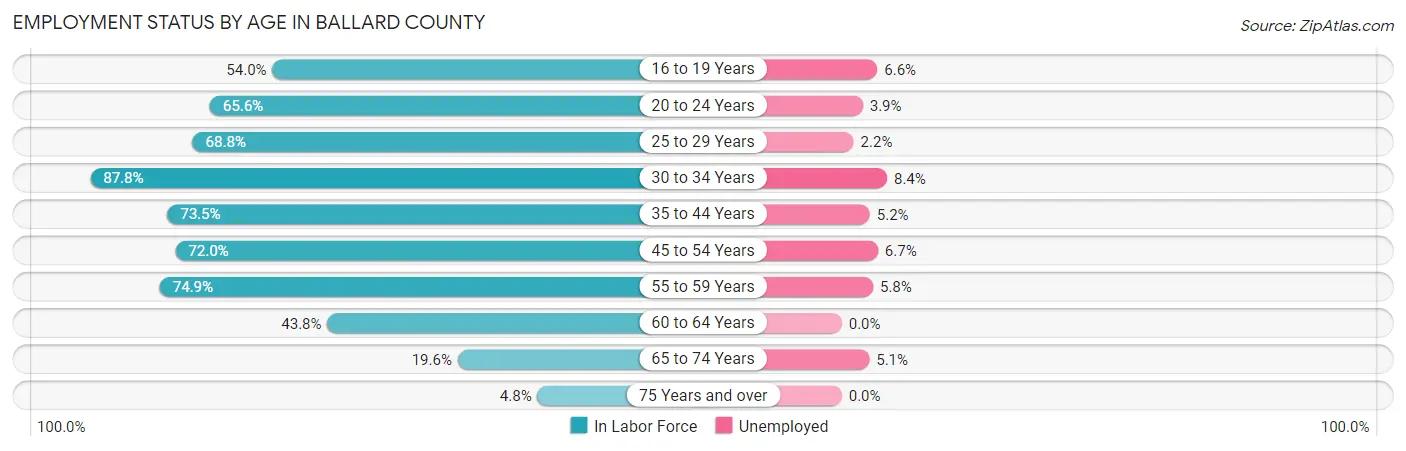
| Age Bracket | In Labor Force | Unemployed |
| 16 to 19 Years | 218 (54.0%) | 14 (6.6%) |
| 20 to 24 Years | 305 (65.6%) | 12 (3.9%) |
| 25 to 29 Years | 271 (68.8%) | 6 (2.2%) |
| 30 to 34 Years | 344 (87.8%) | 29 (8.4%) |
| 35 to 44 Years | 677 (73.5%) | 35 (5.2%) |
| 45 to 54 Years | 741 (72.0%) | 50 (6.7%) |
| 55 to 59 Years | 397 (74.9%) | 23 (5.8%) |
| 60 to 64 Years | 249 (43.8%) | 0 (0.0%) |
| 65 to 74 Years | 195 (19.6%) | 10 (5.1%) |
| 75 Years and over | 35 (4.8%) | 0 (0.0%) |
| Total | 3,433 (53.4%) | 179 (5.2%) |
Employment Status by Educational Attainment in Ballard County
According to labor force statistics for Ballard County, 69.9% of individuals (2,681) out of the total population between 25 and 64 years of age (3,835) are in the labor force, with 5.3% or 142 of them being unemployed. The group with the highest labor force participation rate are those with the educational attainment of bachelor's degree or higher, with 83.6% or 534 individuals in the labor force. Within the labor force, individuals with less than high school education have the highest percentage of unemployment, with 12.7% or 13 of them being unemployed.
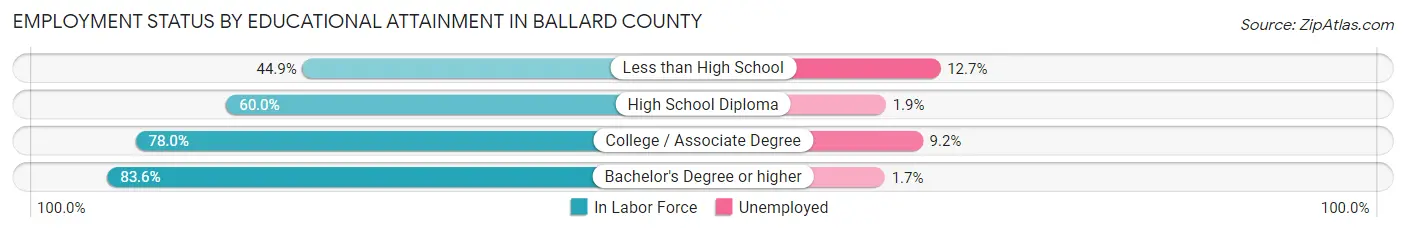
| Educational Attainment | In Labor Force | Unemployed |
| Less than High School | 102 (44.9%) | 29 (12.7%) |
| High School Diploma | 910 (60.0%) | 29 (1.9%) |
| College / Associate Degree | 1,133 (78.0%) | 134 (9.2%) |
| Bachelor's Degree or higher | 534 (83.6%) | 11 (1.7%) |
| Total | 2,681 (69.9%) | 203 (5.3%) |
Employment Occupations by Sex in Ballard County
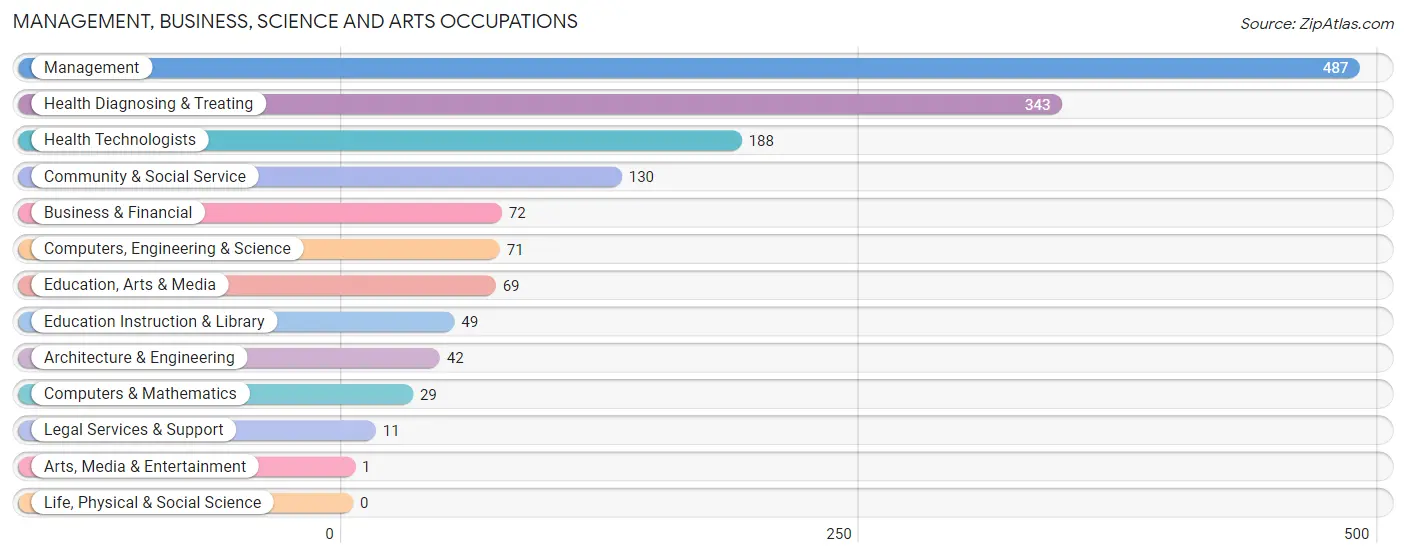
Management, Business, Science and Arts Occupations
The most common Management, Business, Science and Arts occupations in Ballard County are Management (487 | 15.0%), Health Diagnosing & Treating (343 | 10.6%), Health Technologists (188 | 5.8%), Community & Social Service (130 | 4.0%), and Business & Financial (72 | 2.2%).
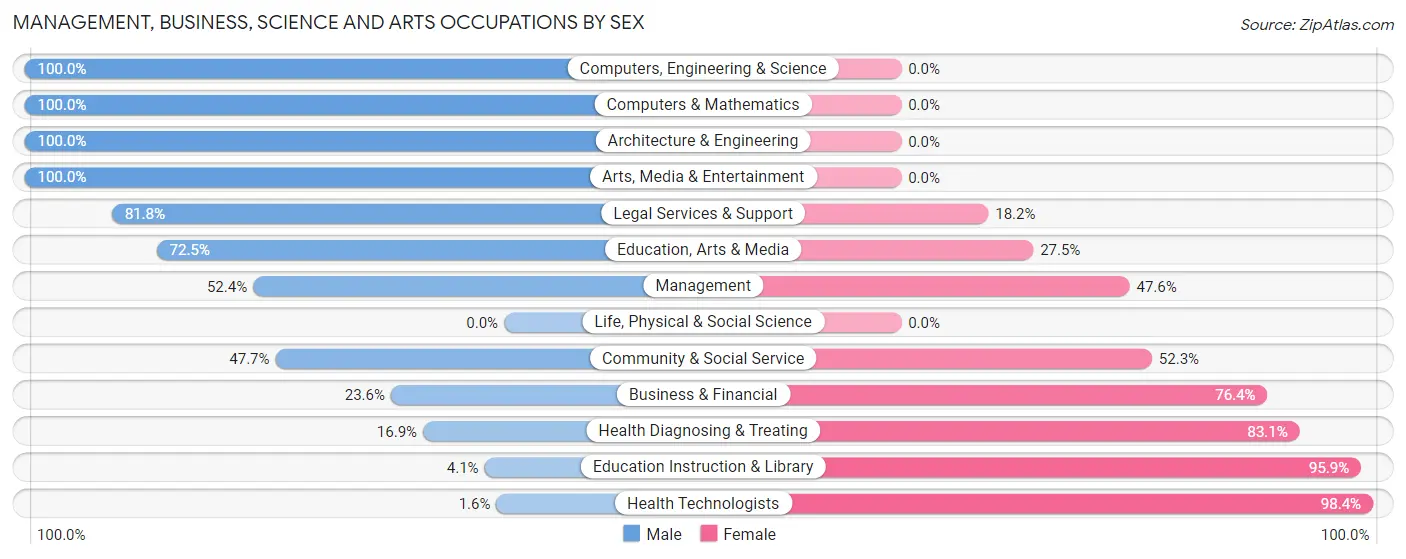
Management, Business, Science and Arts Occupations by Sex
Within the Management, Business, Science and Arts occupations in Ballard County, the most male-oriented occupations are Computers, Engineering & Science (100.0%), Computers & Mathematics (100.0%), and Architecture & Engineering (100.0%), while the most female-oriented occupations are Health Technologists (98.4%), Education Instruction & Library (95.9%), and Health Diagnosing & Treating (83.1%).
| Occupation | Male | Female |
| Management | 255 (52.4%) | 232 (47.6%) |
| Business & Financial | 17 (23.6%) | 55 (76.4%) |
| Computers, Engineering & Science | 71 (100.0%) | 0 (0.0%) |
| Computers & Mathematics | 29 (100.0%) | 0 (0.0%) |
| Architecture & Engineering | 42 (100.0%) | 0 (0.0%) |
| Life, Physical & Social Science | 0 (0.0%) | 0 (0.0%) |
| Community & Social Service | 62 (47.7%) | 68 (52.3%) |
| Education, Arts & Media | 50 (72.5%) | 19 (27.5%) |
| Legal Services & Support | 9 (81.8%) | 2 (18.2%) |
| Education Instruction & Library | 2 (4.1%) | 47 (95.9%) |
| Arts, Media & Entertainment | 1 (100.0%) | 0 (0.0%) |
| Health Diagnosing & Treating | 58 (16.9%) | 285 (83.1%) |
| Health Technologists | 3 (1.6%) | 185 (98.4%) |
| Total (Category) | 463 (42.0%) | 640 (58.0%) |
| Total (Overall) | 1,811 (55.8%) | 1,437 (44.2%) |
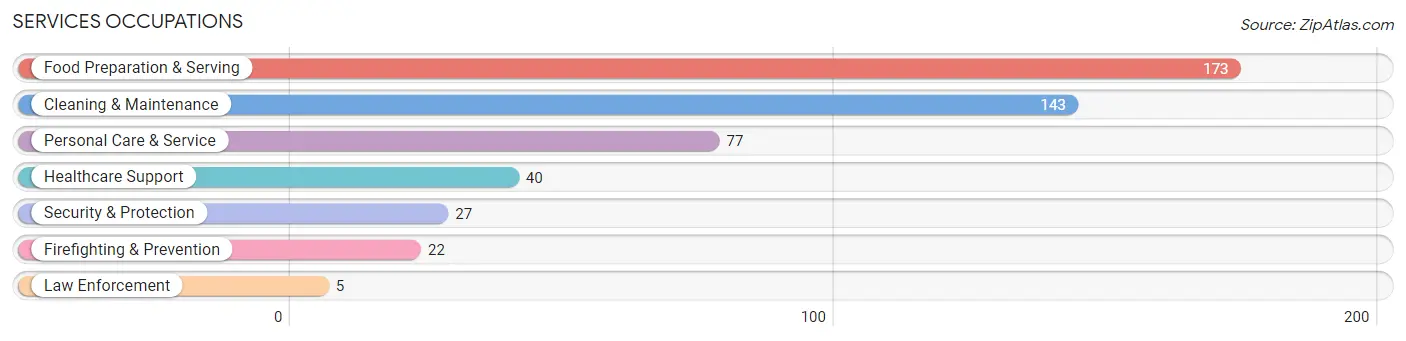
Services Occupations
The most common Services occupations in Ballard County are Food Preparation & Serving (173 | 5.3%), Cleaning & Maintenance (143 | 4.4%), Personal Care & Service (77 | 2.4%), Healthcare Support (40 | 1.2%), and Security & Protection (27 | 0.8%).
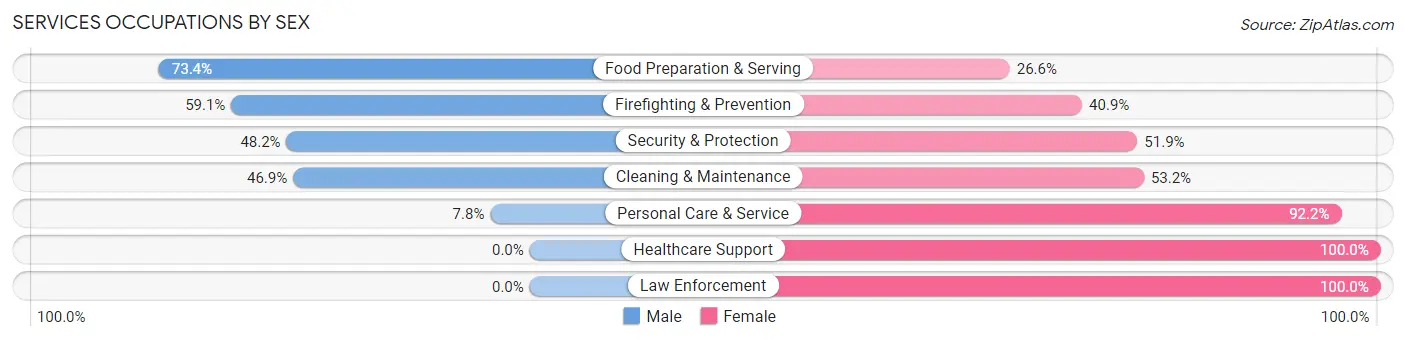
Services Occupations by Sex
Within the Services occupations in Ballard County, the most male-oriented occupations are Food Preparation & Serving (73.4%), Firefighting & Prevention (59.1%), and Security & Protection (48.1%), while the most female-oriented occupations are Healthcare Support (100.0%), Law Enforcement (100.0%), and Personal Care & Service (92.2%).
| Occupation | Male | Female |
| Healthcare Support | 0 (0.0%) | 40 (100.0%) |
| Security & Protection | 13 (48.1%) | 14 (51.8%) |
| Firefighting & Prevention | 13 (59.1%) | 9 (40.9%) |
| Law Enforcement | 0 (0.0%) | 5 (100.0%) |
| Food Preparation & Serving | 127 (73.4%) | 46 (26.6%) |
| Cleaning & Maintenance | 67 (46.9%) | 76 (53.1%) |
| Personal Care & Service | 6 (7.8%) | 71 (92.2%) |
| Total (Category) | 213 (46.3%) | 247 (53.7%) |
| Total (Overall) | 1,811 (55.8%) | 1,437 (44.2%) |
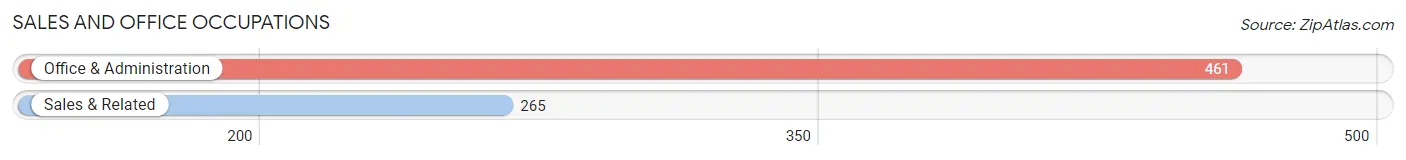
Sales and Office Occupations
The most common Sales and Office occupations in Ballard County are Office & Administration (461 | 14.2%), and Sales & Related (265 | 8.2%).
Sales and Office Occupations by Sex
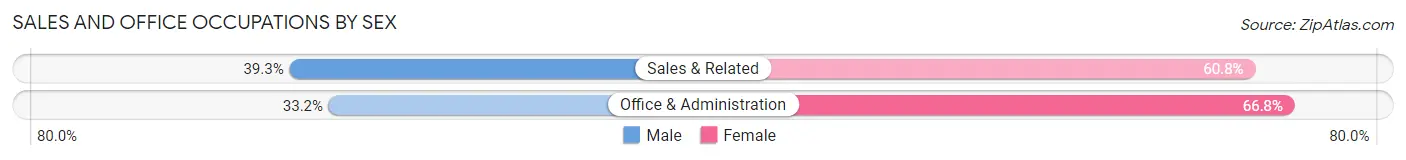
| Occupation | Male | Female |
| Sales & Related | 104 (39.3%) | 161 (60.8%) |
| Office & Administration | 153 (33.2%) | 308 (66.8%) |
| Total (Category) | 257 (35.4%) | 469 (64.6%) |
| Total (Overall) | 1,811 (55.8%) | 1,437 (44.2%) |
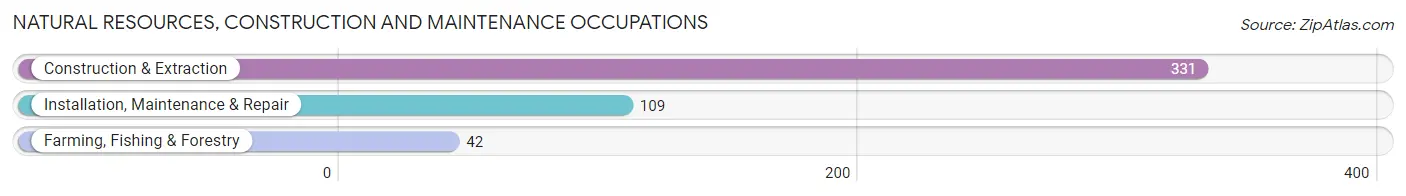
Natural Resources, Construction and Maintenance Occupations
The most common Natural Resources, Construction and Maintenance occupations in Ballard County are Construction & Extraction (331 | 10.2%), Installation, Maintenance & Repair (109 | 3.4%), and Farming, Fishing & Forestry (42 | 1.3%).
Natural Resources, Construction and Maintenance Occupations by Sex
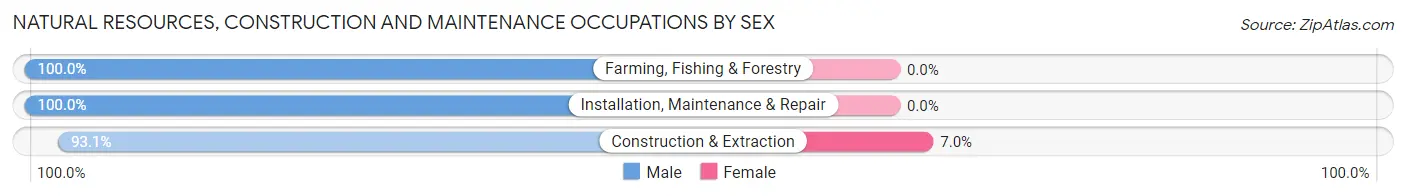
| Occupation | Male | Female |
| Farming, Fishing & Forestry | 42 (100.0%) | 0 (0.0%) |
| Construction & Extraction | 308 (93.0%) | 23 (7.0%) |
| Installation, Maintenance & Repair | 109 (100.0%) | 0 (0.0%) |
| Total (Category) | 459 (95.2%) | 23 (4.8%) |
| Total (Overall) | 1,811 (55.8%) | 1,437 (44.2%) |
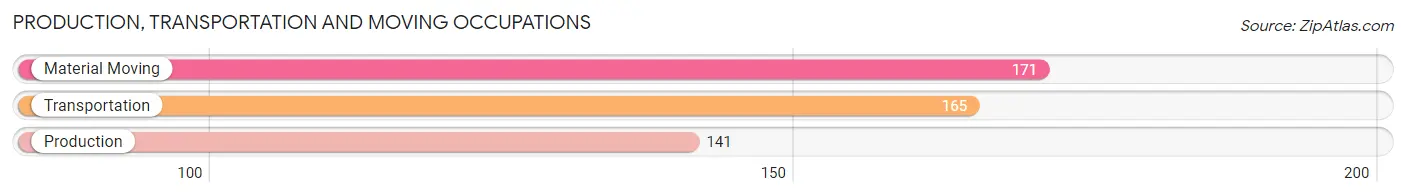
Production, Transportation and Moving Occupations
The most common Production, Transportation and Moving occupations in Ballard County are Material Moving (171 | 5.3%), Transportation (165 | 5.1%), and Production (141 | 4.3%).
Production, Transportation and Moving Occupations by Sex
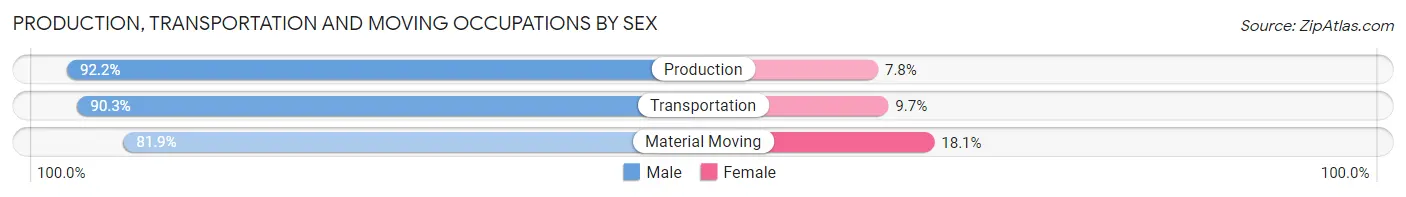
| Occupation | Male | Female |
| Production | 130 (92.2%) | 11 (7.8%) |
| Transportation | 149 (90.3%) | 16 (9.7%) |
| Material Moving | 140 (81.9%) | 31 (18.1%) |
| Total (Category) | 419 (87.8%) | 58 (12.2%) |
| Total (Overall) | 1,811 (55.8%) | 1,437 (44.2%) |
Employment Industries by Sex in Ballard County
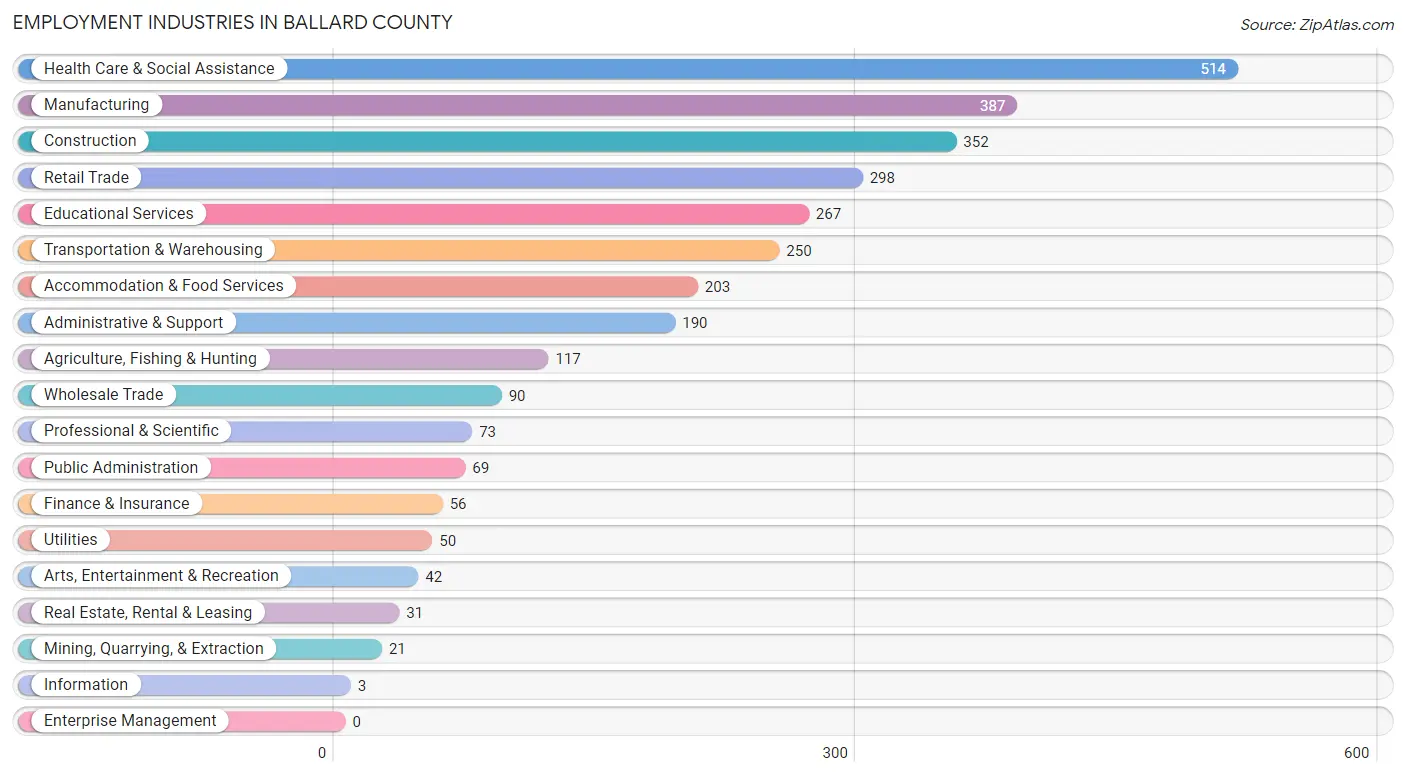
Employment Industries in Ballard County
The major employment industries in Ballard County include Health Care & Social Assistance (514 | 15.8%), Manufacturing (387 | 11.9%), Construction (352 | 10.8%), Retail Trade (298 | 9.2%), and Educational Services (267 | 8.2%).
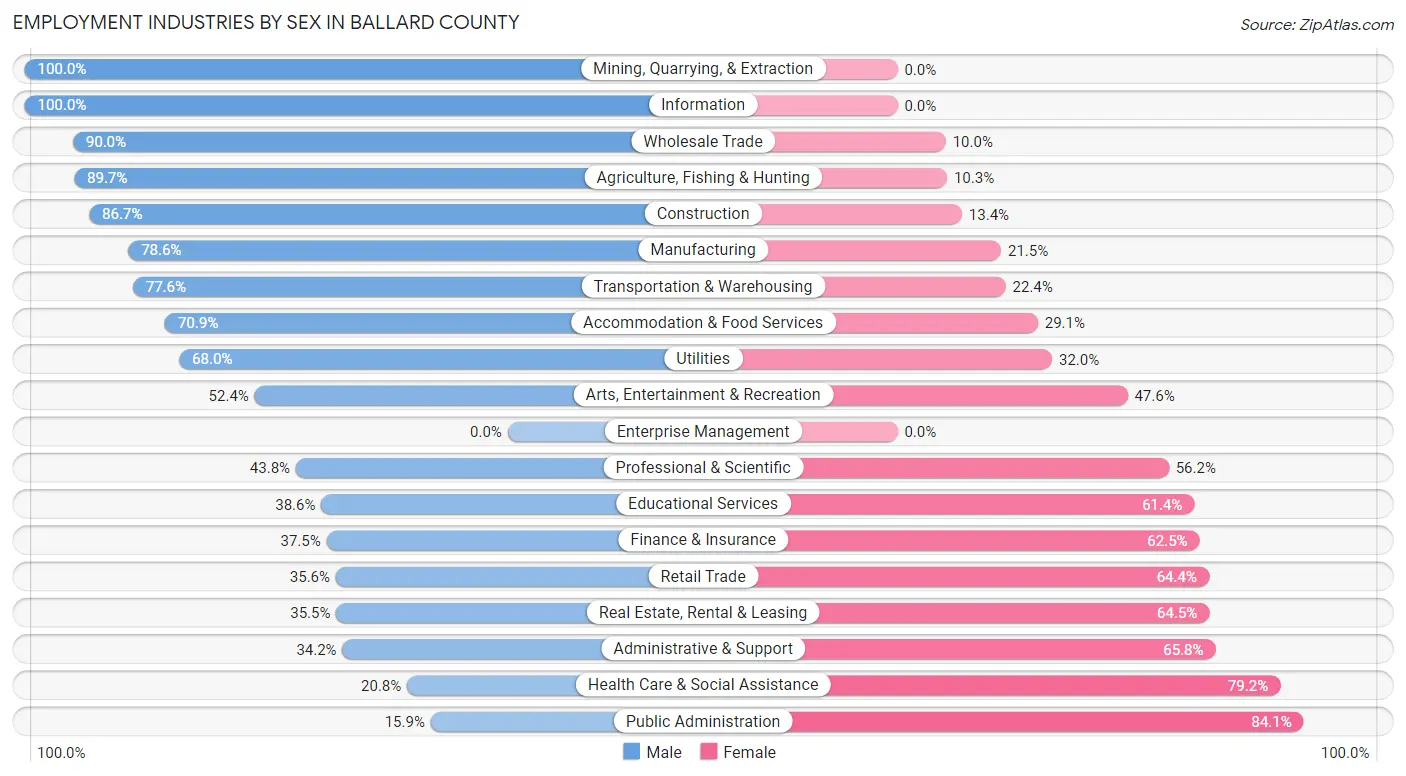
Employment Industries by Sex in Ballard County
The Ballard County industries that see more men than women are Mining, Quarrying, & Extraction (100.0%), Information (100.0%), and Wholesale Trade (90.0%), whereas the industries that tend to have a higher number of women are Public Administration (84.1%), Health Care & Social Assistance (79.2%), and Administrative & Support (65.8%).
| Industry | Male | Female |
| Agriculture, Fishing & Hunting | 105 (89.7%) | 12 (10.3%) |
| Mining, Quarrying, & Extraction | 21 (100.0%) | 0 (0.0%) |
| Construction | 305 (86.7%) | 47 (13.4%) |
| Manufacturing | 304 (78.5%) | 83 (21.4%) |
| Wholesale Trade | 81 (90.0%) | 9 (10.0%) |
| Retail Trade | 106 (35.6%) | 192 (64.4%) |
| Transportation & Warehousing | 194 (77.6%) | 56 (22.4%) |
| Utilities | 34 (68.0%) | 16 (32.0%) |
| Information | 3 (100.0%) | 0 (0.0%) |
| Finance & Insurance | 21 (37.5%) | 35 (62.5%) |
| Real Estate, Rental & Leasing | 11 (35.5%) | 20 (64.5%) |
| Professional & Scientific | 32 (43.8%) | 41 (56.2%) |
| Enterprise Management | 0 (0.0%) | 0 (0.0%) |
| Administrative & Support | 65 (34.2%) | 125 (65.8%) |
| Educational Services | 103 (38.6%) | 164 (61.4%) |
| Health Care & Social Assistance | 107 (20.8%) | 407 (79.2%) |
| Arts, Entertainment & Recreation | 22 (52.4%) | 20 (47.6%) |
| Accommodation & Food Services | 144 (70.9%) | 59 (29.1%) |
| Public Administration | 11 (15.9%) | 58 (84.1%) |
| Total | 1,811 (55.8%) | 1,437 (44.2%) |
Education in Ballard County
School Enrollment in Ballard County
The most common levels of schooling among the 1,632 students in Ballard County are elementary school (480 | 29.4%), high school (418 | 25.6%), and middle school (277 | 17.0%).
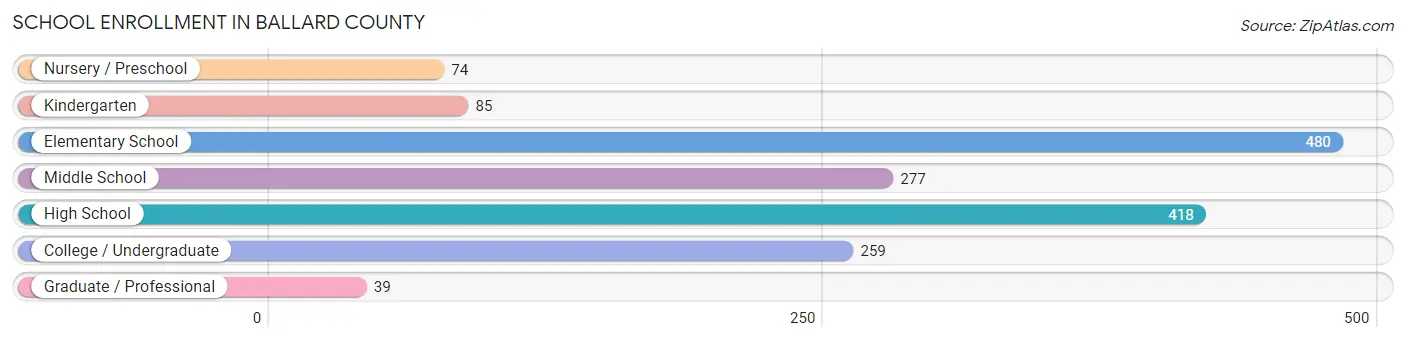
| School Level | # Students | % Students |
| Nursery / Preschool | 74 | 4.5% |
| Kindergarten | 85 | 5.2% |
| Elementary School | 480 | 29.4% |
| Middle School | 277 | 17.0% |
| High School | 418 | 25.6% |
| College / Undergraduate | 259 | 15.9% |
| Graduate / Professional | 39 | 2.4% |
| Total | 1,632 | 100.0% |
School Enrollment by Age by Funding Source in Ballard County
Out of a total of 1,632 students who are enrolled in schools in Ballard County, 135 (8.3%) attend a private institution, while the remaining 1,497 (91.7%) are enrolled in public schools. The age group of 25 to 34 year olds has the highest likelihood of being enrolled in private schools, with 40 (46.0% in the age bracket) enrolled. Conversely, the age group of 10 to 14 year olds has the lowest likelihood of being enrolled in a private school, with 358 (98.4% in the age bracket) attending a public institution.
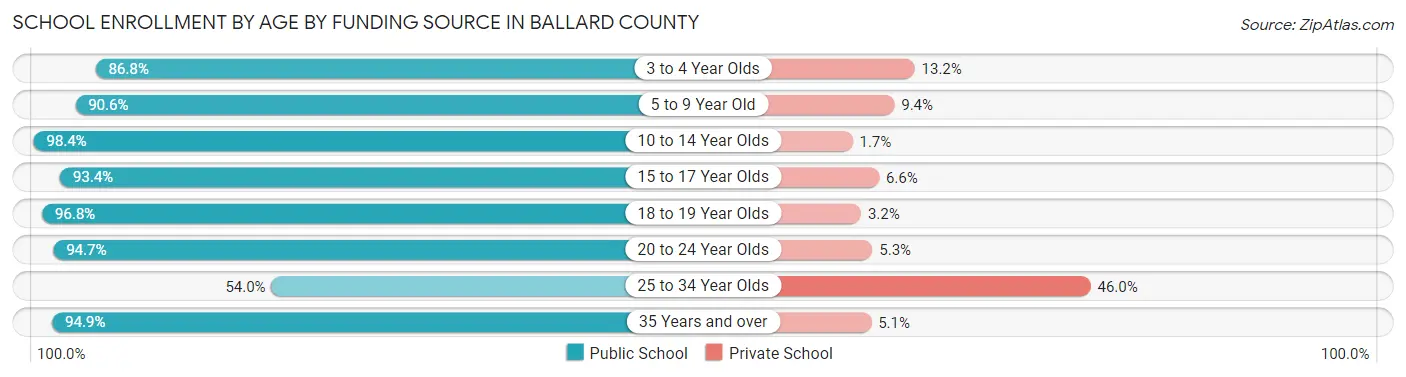
| Age Bracket | Public School | Private School |
| 3 to 4 Year Olds | 46 (86.8%) | 7 (13.2%) |
| 5 to 9 Year Old | 480 (90.6%) | 50 (9.4%) |
| 10 to 14 Year Olds | 358 (98.4%) | 6 (1.7%) |
| 15 to 17 Year Olds | 284 (93.4%) | 20 (6.6%) |
| 18 to 19 Year Olds | 120 (96.8%) | 4 (3.2%) |
| 20 to 24 Year Olds | 124 (94.7%) | 7 (5.3%) |
| 25 to 34 Year Olds | 47 (54.0%) | 40 (46.0%) |
| 35 Years and over | 37 (94.9%) | 2 (5.1%) |
| Total | 1,497 (91.7%) | 135 (8.3%) |
Educational Attainment by Field of Study in Ballard County
Education (199 | 18.1%), arts & humanities (164 | 14.9%), science & technology (159 | 14.5%), bio, nature & agricultural (101 | 9.2%), and liberal arts & history (96 | 8.7%) are the most common fields of study among 1,099 individuals in Ballard County who have obtained a bachelor's degree or higher.
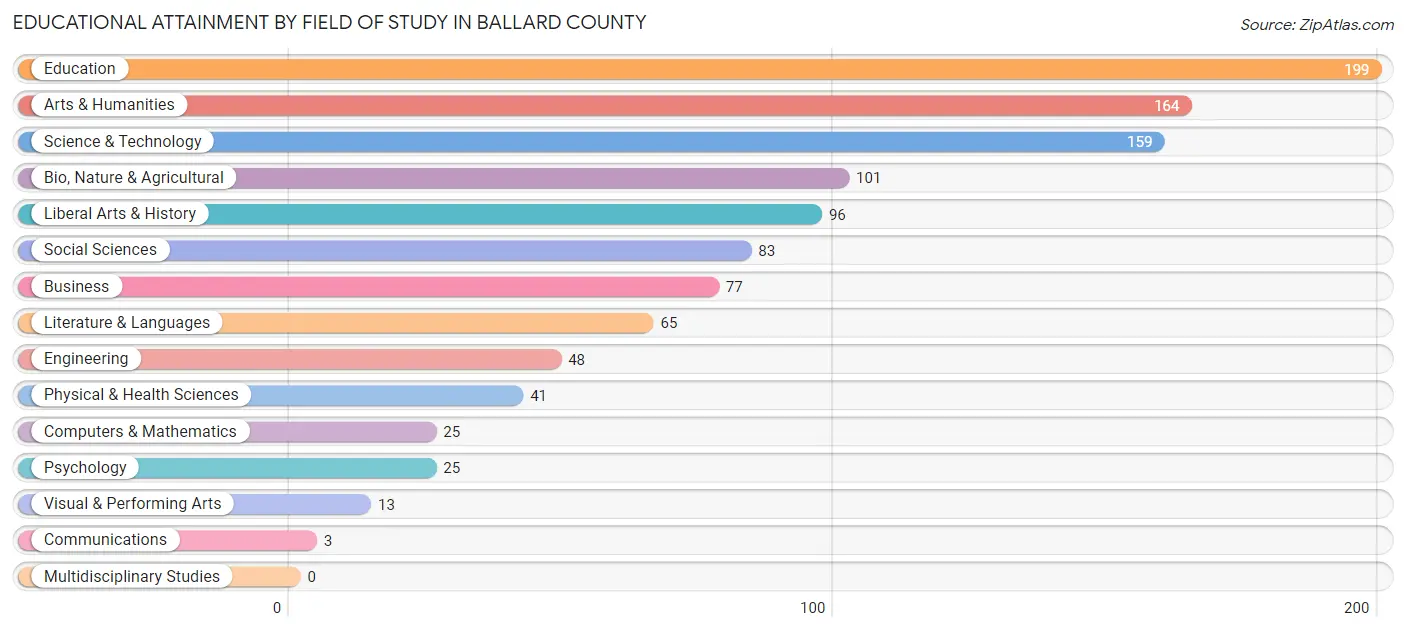
| Field of Study | # Graduates | % Graduates |
| Computers & Mathematics | 25 | 2.3% |
| Bio, Nature & Agricultural | 101 | 9.2% |
| Physical & Health Sciences | 41 | 3.7% |
| Psychology | 25 | 2.3% |
| Social Sciences | 83 | 7.5% |
| Engineering | 48 | 4.4% |
| Multidisciplinary Studies | 0 | 0.0% |
| Science & Technology | 159 | 14.5% |
| Business | 77 | 7.0% |
| Education | 199 | 18.1% |
| Literature & Languages | 65 | 5.9% |
| Liberal Arts & History | 96 | 8.7% |
| Visual & Performing Arts | 13 | 1.2% |
| Communications | 3 | 0.3% |
| Arts & Humanities | 164 | 14.9% |
| Total | 1,099 | 100.0% |
Transportation & Commute in Ballard County
Vehicle Availability by Sex in Ballard County
The most prevalent vehicle ownership categories in Ballard County are males with 2 vehicles (564, accounting for 31.5%) and females with 2 vehicles (509, making up 39.4%).
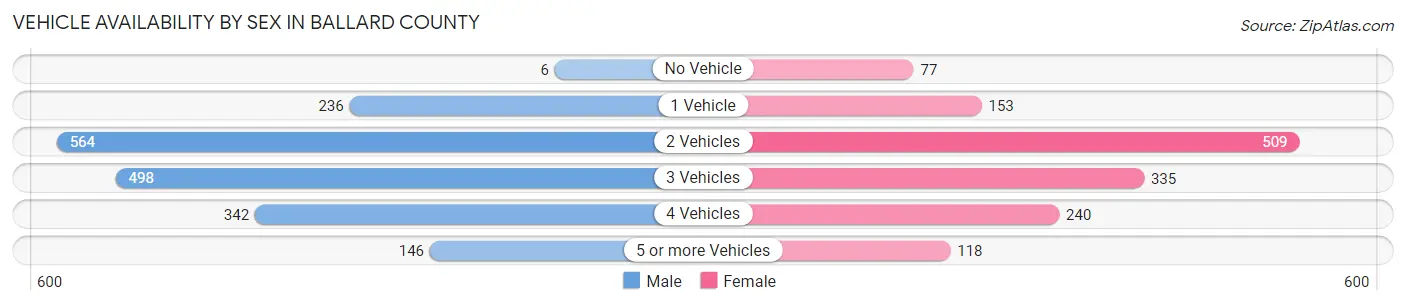
| Vehicles Available | Male | Female |
| No Vehicle | 6 (0.3%) | 77 (5.4%) |
| 1 Vehicle | 236 (13.2%) | 153 (10.7%) |
| 2 Vehicles | 564 (31.5%) | 509 (35.5%) |
| 3 Vehicles | 498 (27.8%) | 335 (23.4%) |
| 4 Vehicles | 342 (19.1%) | 240 (16.8%) |
| 5 or more Vehicles | 146 (8.2%) | 118 (8.2%) |
| Total | 1,792 (100.0%) | 1,432 (100.0%) |
Commute Time in Ballard County
The most frequently occuring commute durations in Ballard County are 10 to 14 minutes (618 commuters, 19.6%), 30 to 34 minutes (510 commuters, 16.2%), and 15 to 19 minutes (380 commuters, 12.0%).
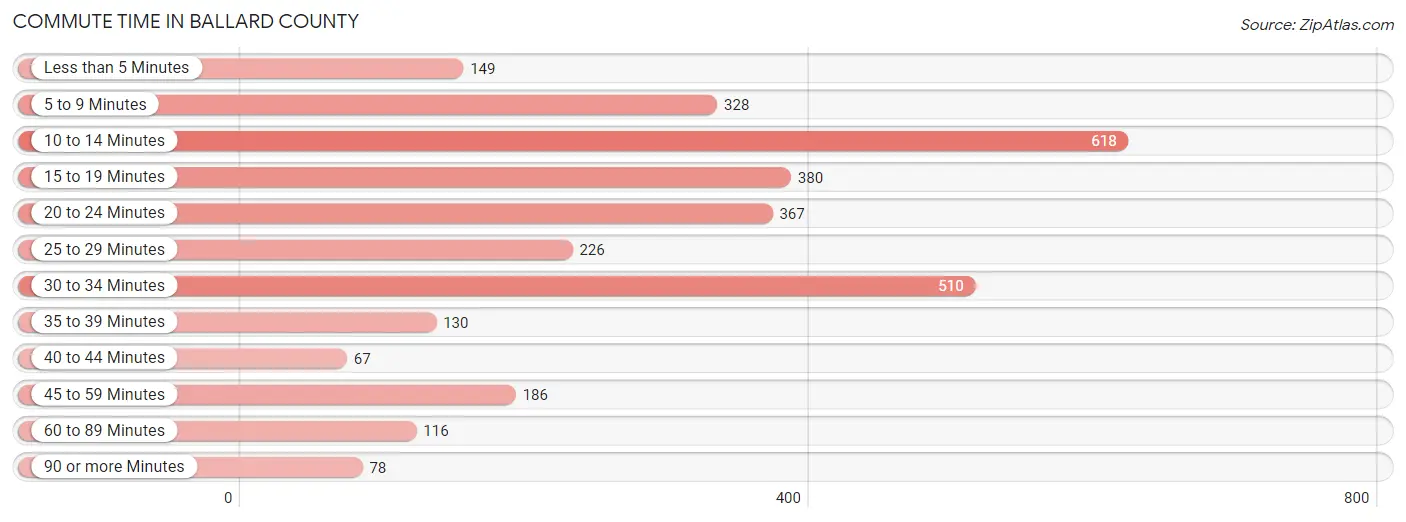
| Commute Time | # Commuters | % Commuters |
| Less than 5 Minutes | 149 | 4.7% |
| 5 to 9 Minutes | 328 | 10.4% |
| 10 to 14 Minutes | 618 | 19.6% |
| 15 to 19 Minutes | 380 | 12.0% |
| 20 to 24 Minutes | 367 | 11.6% |
| 25 to 29 Minutes | 226 | 7.2% |
| 30 to 34 Minutes | 510 | 16.2% |
| 35 to 39 Minutes | 130 | 4.1% |
| 40 to 44 Minutes | 67 | 2.1% |
| 45 to 59 Minutes | 186 | 5.9% |
| 60 to 89 Minutes | 116 | 3.7% |
| 90 or more Minutes | 78 | 2.5% |
Commute Time by Sex in Ballard County
The most common commute times in Ballard County are 10 to 14 minutes (375 commuters, 21.3%) for males and 30 to 34 minutes (265 commuters, 19.0%) for females.
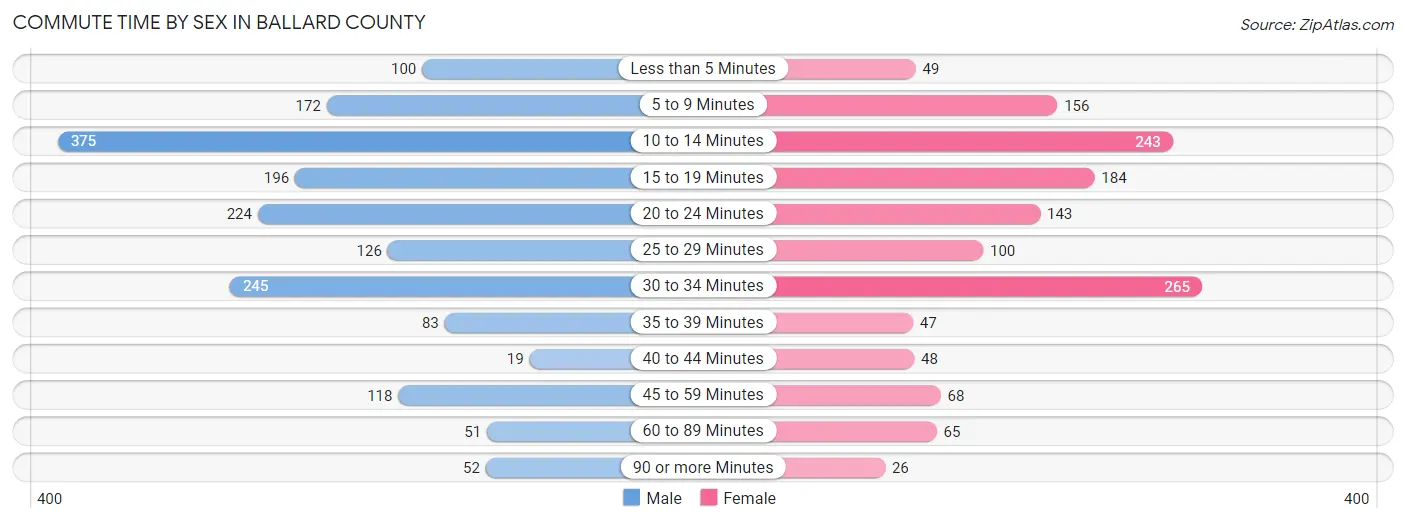
| Commute Time | Male | Female |
| Less than 5 Minutes | 100 (5.7%) | 49 (3.5%) |
| 5 to 9 Minutes | 172 (9.8%) | 156 (11.2%) |
| 10 to 14 Minutes | 375 (21.3%) | 243 (17.4%) |
| 15 to 19 Minutes | 196 (11.1%) | 184 (13.2%) |
| 20 to 24 Minutes | 224 (12.7%) | 143 (10.3%) |
| 25 to 29 Minutes | 126 (7.2%) | 100 (7.2%) |
| 30 to 34 Minutes | 245 (13.9%) | 265 (19.0%) |
| 35 to 39 Minutes | 83 (4.7%) | 47 (3.4%) |
| 40 to 44 Minutes | 19 (1.1%) | 48 (3.4%) |
| 45 to 59 Minutes | 118 (6.7%) | 68 (4.9%) |
| 60 to 89 Minutes | 51 (2.9%) | 65 (4.7%) |
| 90 or more Minutes | 52 (2.9%) | 26 (1.9%) |
Time of Departure to Work by Sex in Ballard County
The most frequent times of departure to work in Ballard County are 7:30 AM to 7:59 AM (350, 19.9%) for males and 7:00 AM to 7:29 AM (393, 28.2%) for females.
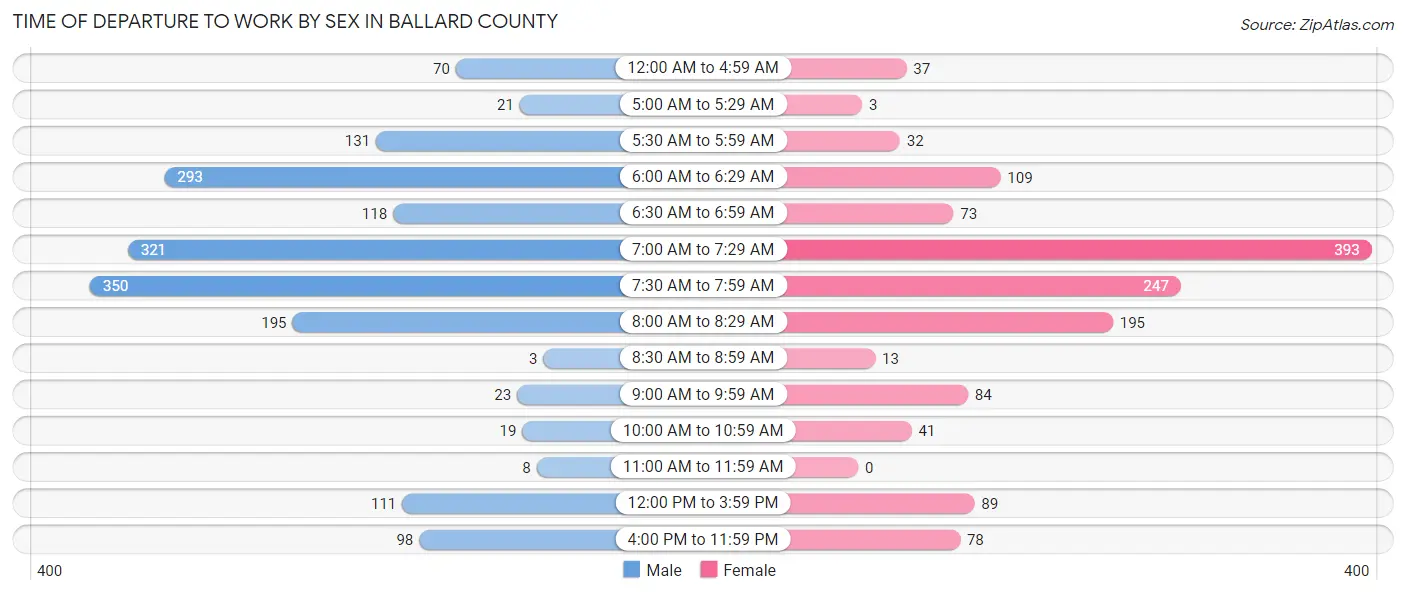
| Time of Departure | Male | Female |
| 12:00 AM to 4:59 AM | 70 (4.0%) | 37 (2.6%) |
| 5:00 AM to 5:29 AM | 21 (1.2%) | 3 (0.2%) |
| 5:30 AM to 5:59 AM | 131 (7.4%) | 32 (2.3%) |
| 6:00 AM to 6:29 AM | 293 (16.6%) | 109 (7.8%) |
| 6:30 AM to 6:59 AM | 118 (6.7%) | 73 (5.2%) |
| 7:00 AM to 7:29 AM | 321 (18.2%) | 393 (28.2%) |
| 7:30 AM to 7:59 AM | 350 (19.9%) | 247 (17.7%) |
| 8:00 AM to 8:29 AM | 195 (11.1%) | 195 (14.0%) |
| 8:30 AM to 8:59 AM | 3 (0.2%) | 13 (0.9%) |
| 9:00 AM to 9:59 AM | 23 (1.3%) | 84 (6.0%) |
| 10:00 AM to 10:59 AM | 19 (1.1%) | 41 (2.9%) |
| 11:00 AM to 11:59 AM | 8 (0.4%) | 0 (0.0%) |
| 12:00 PM to 3:59 PM | 111 (6.3%) | 89 (6.4%) |
| 4:00 PM to 11:59 PM | 98 (5.6%) | 78 (5.6%) |
| Total | 1,761 (100.0%) | 1,394 (100.0%) |
Housing Occupancy in Ballard County
Occupancy by Ownership in Ballard County
Of the total 2,959 dwellings in Ballard County, owner-occupied units account for 2,379 (80.4%), while renter-occupied units make up 580 (19.6%).
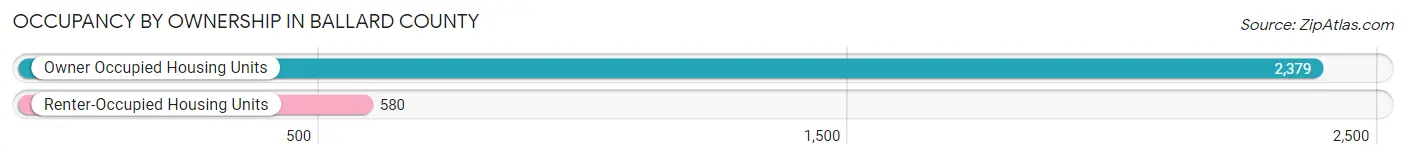
| Occupancy | # Housing Units | % Housing Units |
| Owner Occupied Housing Units | 2,379 | 80.4% |
| Renter-Occupied Housing Units | 580 | 19.6% |
| Total Occupied Housing Units | 2,959 | 100.0% |
Occupancy by Household Size in Ballard County
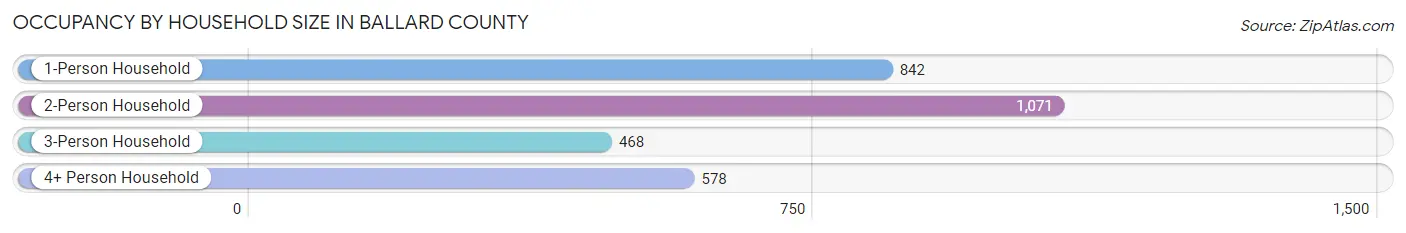
| Household Size | # Housing Units | % Housing Units |
| 1-Person Household | 842 | 28.5% |
| 2-Person Household | 1,071 | 36.2% |
| 3-Person Household | 468 | 15.8% |
| 4+ Person Household | 578 | 19.5% |
| Total Housing Units | 2,959 | 100.0% |
Occupancy by Ownership by Household Size in Ballard County
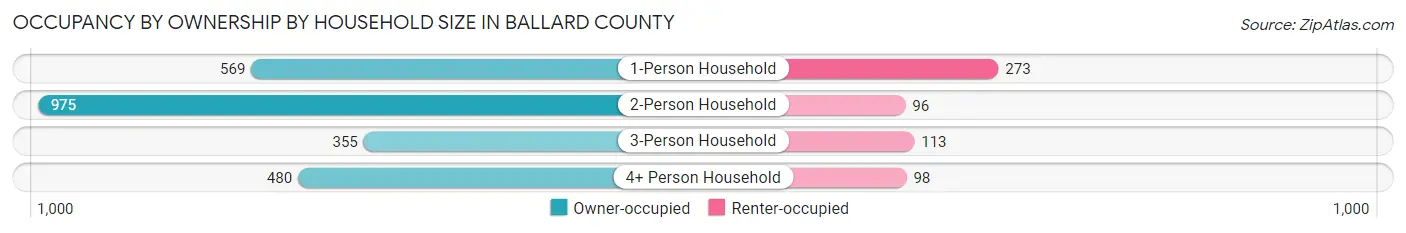
| Household Size | Owner-occupied | Renter-occupied |
| 1-Person Household | 569 (67.6%) | 273 (32.4%) |
| 2-Person Household | 975 (91.0%) | 96 (9.0%) |
| 3-Person Household | 355 (75.8%) | 113 (24.1%) |
| 4+ Person Household | 480 (83.0%) | 98 (17.0%) |
| Total Housing Units | 2,379 (80.4%) | 580 (19.6%) |
Occupancy by Educational Attainment in Ballard County
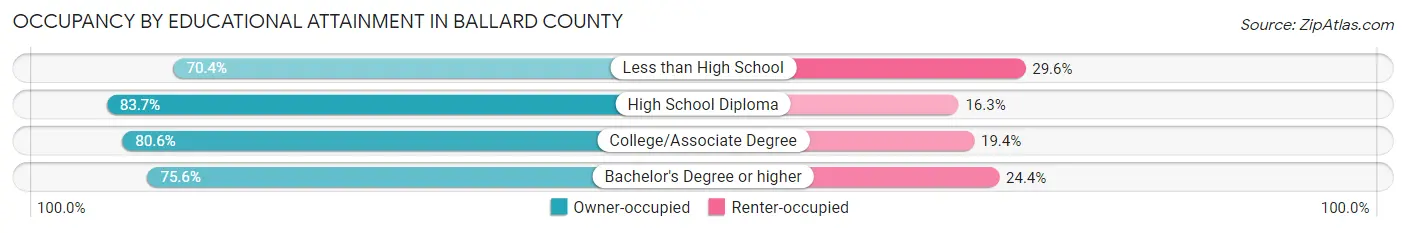
| Household Size | Owner-occupied | Renter-occupied |
| Less than High School | 143 (70.4%) | 60 (29.6%) |
| High School Diploma | 1,046 (83.7%) | 204 (16.3%) |
| College/Associate Degree | 827 (80.6%) | 199 (19.4%) |
| Bachelor's Degree or higher | 363 (75.6%) | 117 (24.4%) |
Occupancy by Age of Householder in Ballard County
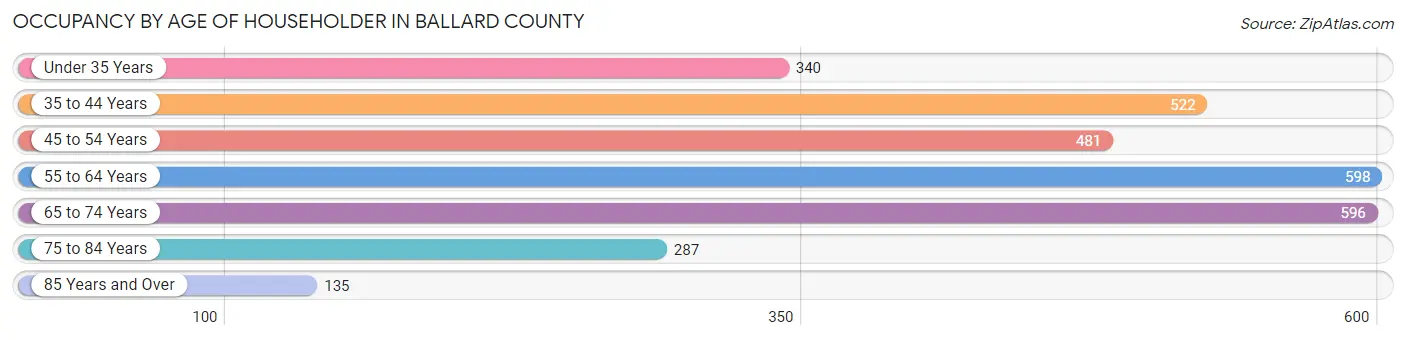
| Age Bracket | # Households | % Households |
| Under 35 Years | 340 | 11.5% |
| 35 to 44 Years | 522 | 17.6% |
| 45 to 54 Years | 481 | 16.3% |
| 55 to 64 Years | 598 | 20.2% |
| 65 to 74 Years | 596 | 20.1% |
| 75 to 84 Years | 287 | 9.7% |
| 85 Years and Over | 135 | 4.6% |
| Total | 2,959 | 100.0% |
Housing Finances in Ballard County
Median Income by Occupancy in Ballard County
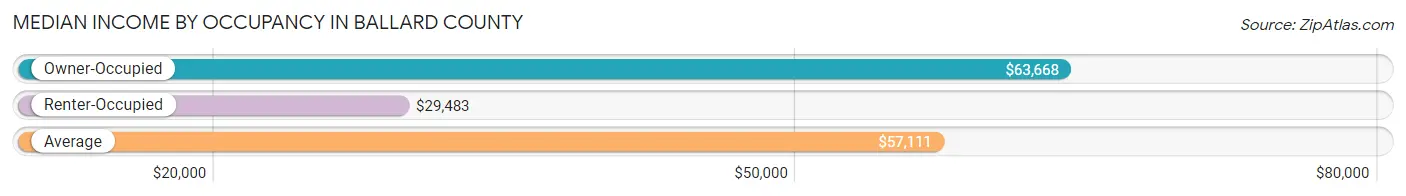
| Occupancy Type | # Households | Median Income |
| Owner-Occupied | 2,379 (80.4%) | $63,668 |
| Renter-Occupied | 580 (19.6%) | $29,483 |
| Average | 2,959 (100.0%) | $57,111 |
Occupancy by Householder Income Bracket in Ballard County
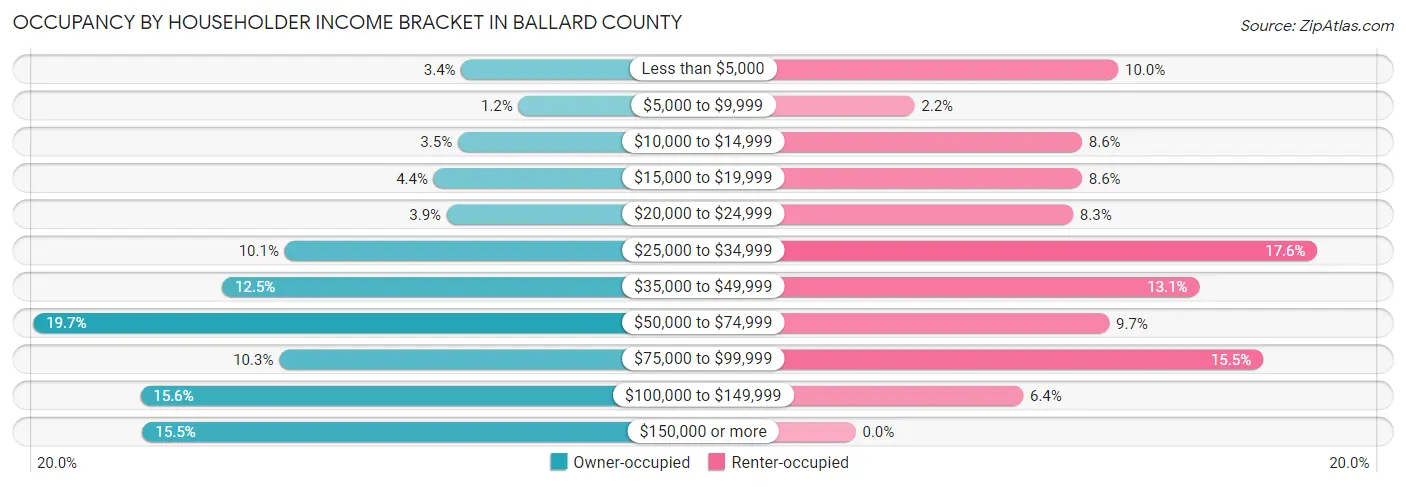
| Income Bracket | Owner-occupied | Renter-occupied |
| Less than $5,000 | 80 (3.4%) | 58 (10.0%) |
| $5,000 to $9,999 | 28 (1.2%) | 13 (2.2%) |
| $10,000 to $14,999 | 83 (3.5%) | 50 (8.6%) |
| $15,000 to $19,999 | 105 (4.4%) | 50 (8.6%) |
| $20,000 to $24,999 | 93 (3.9%) | 48 (8.3%) |
| $25,000 to $34,999 | 240 (10.1%) | 102 (17.6%) |
| $35,000 to $49,999 | 297 (12.5%) | 76 (13.1%) |
| $50,000 to $74,999 | 468 (19.7%) | 56 (9.7%) |
| $75,000 to $99,999 | 245 (10.3%) | 90 (15.5%) |
| $100,000 to $149,999 | 371 (15.6%) | 37 (6.4%) |
| $150,000 or more | 369 (15.5%) | 0 (0.0%) |
| Total | 2,379 (100.0%) | 580 (100.0%) |
Monthly Housing Cost Tiers in Ballard County
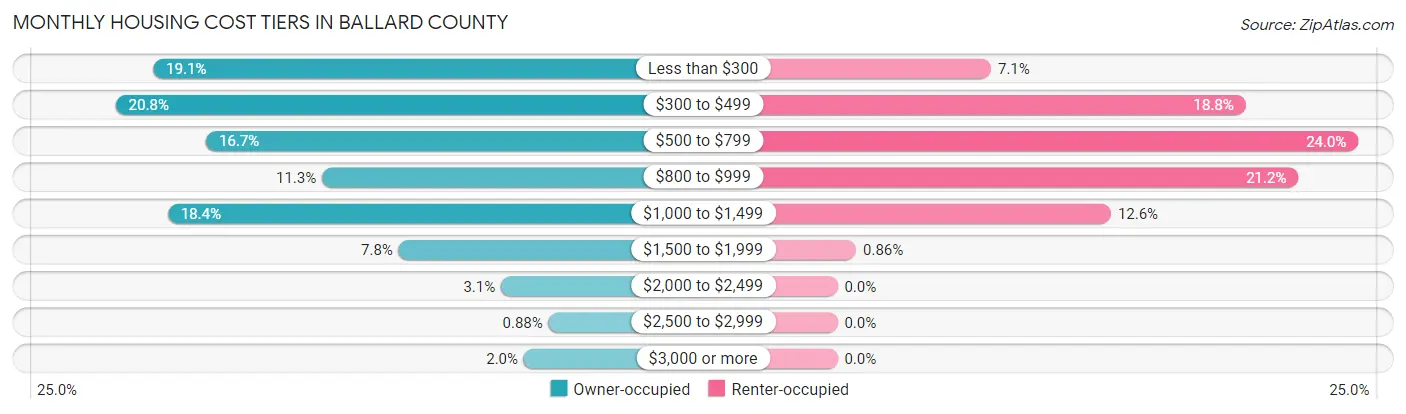
| Monthly Cost | Owner-occupied | Renter-occupied |
| Less than $300 | 454 (19.1%) | 41 (7.1%) |
| $300 to $499 | 495 (20.8%) | 109 (18.8%) |
| $500 to $799 | 396 (16.7%) | 139 (24.0%) |
| $800 to $999 | 269 (11.3%) | 123 (21.2%) |
| $1,000 to $1,499 | 438 (18.4%) | 73 (12.6%) |
| $1,500 to $1,999 | 185 (7.8%) | 5 (0.9%) |
| $2,000 to $2,499 | 73 (3.1%) | 0 (0.0%) |
| $2,500 to $2,999 | 21 (0.9%) | 0 (0.0%) |
| $3,000 or more | 48 (2.0%) | 0 (0.0%) |
| Total | 2,379 (100.0%) | 580 (100.0%) |
Physical Housing Characteristics in Ballard County
Housing Structures in Ballard County
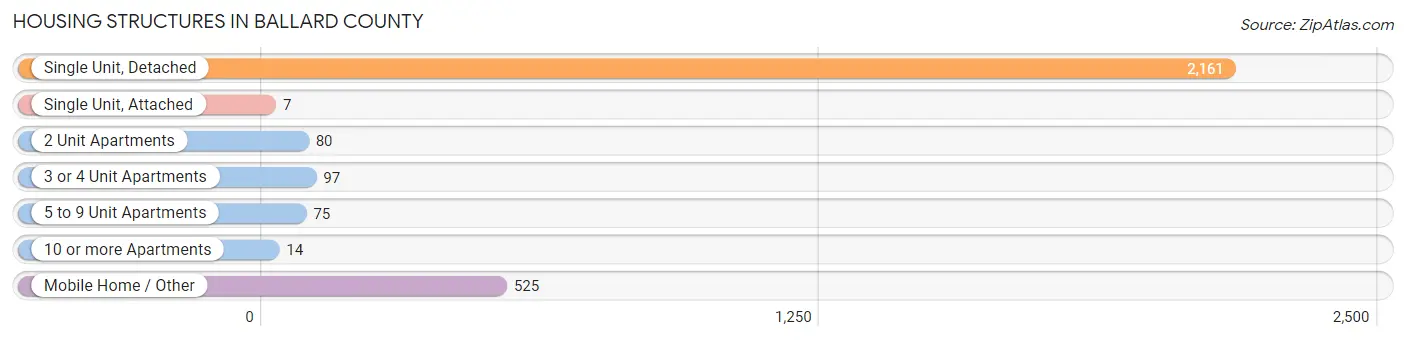
| Structure Type | # Housing Units | % Housing Units |
| Single Unit, Detached | 2,161 | 73.0% |
| Single Unit, Attached | 7 | 0.2% |
| 2 Unit Apartments | 80 | 2.7% |
| 3 or 4 Unit Apartments | 97 | 3.3% |
| 5 to 9 Unit Apartments | 75 | 2.5% |
| 10 or more Apartments | 14 | 0.5% |
| Mobile Home / Other | 525 | 17.7% |
| Total | 2,959 | 100.0% |
Housing Structures by Occupancy in Ballard County
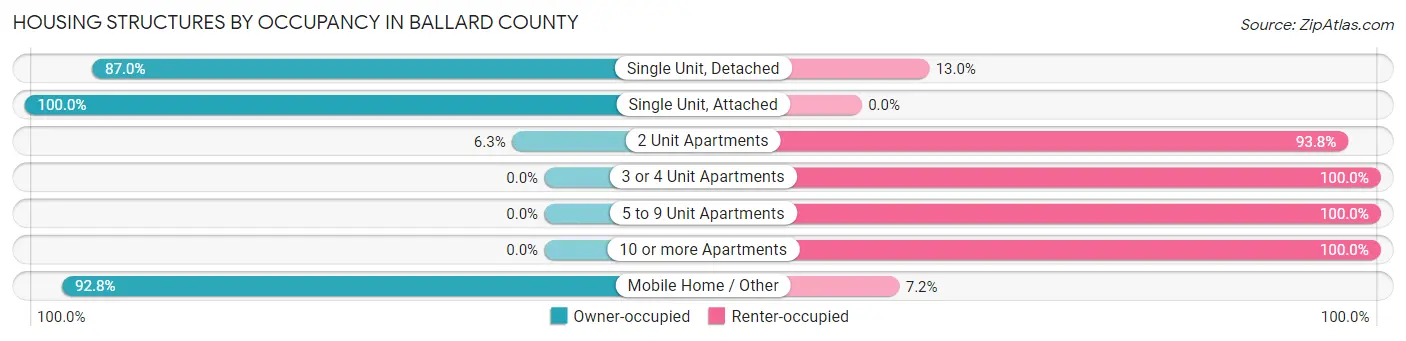
| Structure Type | Owner-occupied | Renter-occupied |
| Single Unit, Detached | 1,880 (87.0%) | 281 (13.0%) |
| Single Unit, Attached | 7 (100.0%) | 0 (0.0%) |
| 2 Unit Apartments | 5 (6.2%) | 75 (93.8%) |
| 3 or 4 Unit Apartments | 0 (0.0%) | 97 (100.0%) |
| 5 to 9 Unit Apartments | 0 (0.0%) | 75 (100.0%) |
| 10 or more Apartments | 0 (0.0%) | 14 (100.0%) |
| Mobile Home / Other | 487 (92.8%) | 38 (7.2%) |
| Total | 2,379 (80.4%) | 580 (19.6%) |
Housing Structures by Number of Rooms in Ballard County
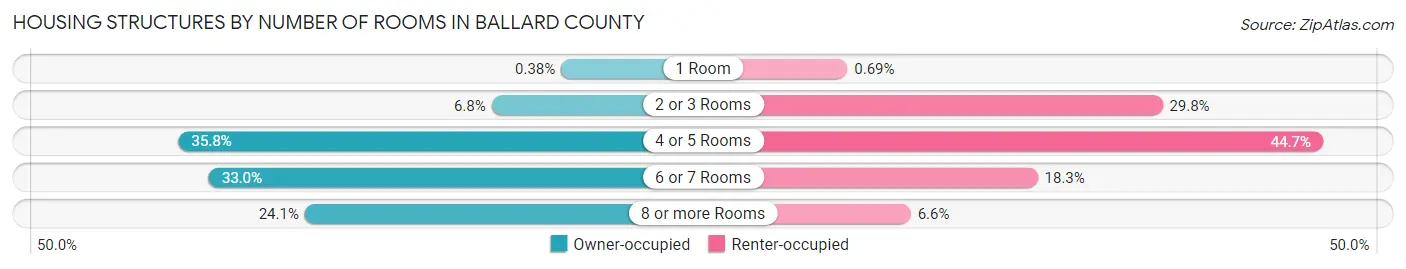
| Number of Rooms | Owner-occupied | Renter-occupied |
| 1 Room | 9 (0.4%) | 4 (0.7%) |
| 2 or 3 Rooms | 162 (6.8%) | 173 (29.8%) |
| 4 or 5 Rooms | 851 (35.8%) | 259 (44.7%) |
| 6 or 7 Rooms | 784 (33.0%) | 106 (18.3%) |
| 8 or more Rooms | 573 (24.1%) | 38 (6.6%) |
| Total | 2,379 (100.0%) | 580 (100.0%) |
Housing Structure by Heating Type in Ballard County
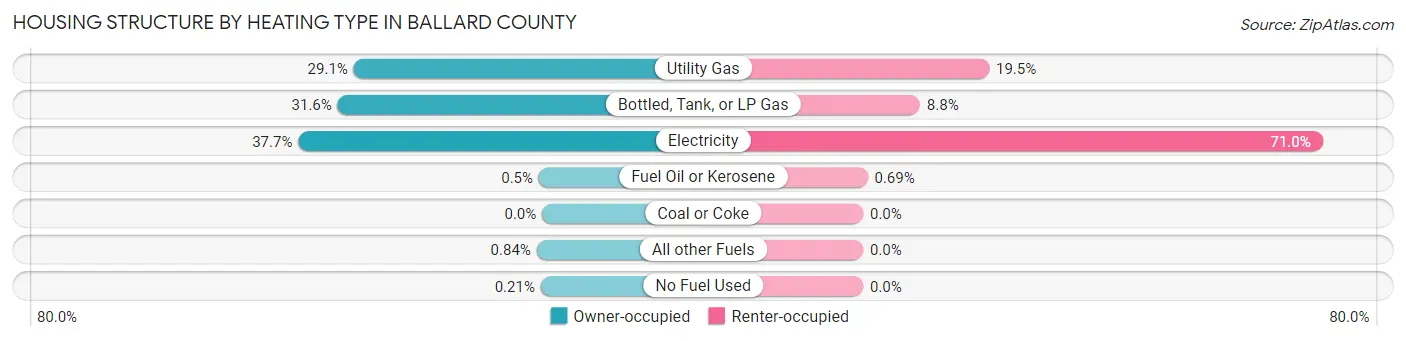
| Heating Type | Owner-occupied | Renter-occupied |
| Utility Gas | 693 (29.1%) | 113 (19.5%) |
| Bottled, Tank, or LP Gas | 752 (31.6%) | 51 (8.8%) |
| Electricity | 897 (37.7%) | 412 (71.0%) |
| Fuel Oil or Kerosene | 12 (0.5%) | 4 (0.7%) |
| Coal or Coke | 0 (0.0%) | 0 (0.0%) |
| All other Fuels | 20 (0.8%) | 0 (0.0%) |
| No Fuel Used | 5 (0.2%) | 0 (0.0%) |
| Total | 2,379 (100.0%) | 580 (100.0%) |
Household Vehicle Usage in Ballard County
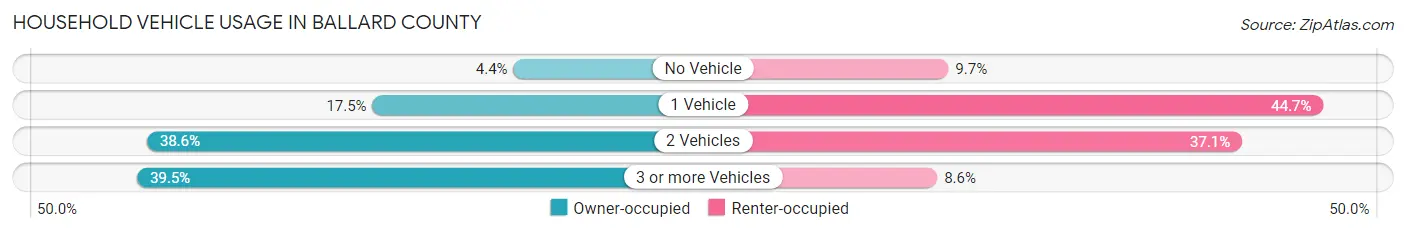
| Vehicles per Household | Owner-occupied | Renter-occupied |
| No Vehicle | 104 (4.4%) | 56 (9.7%) |
| 1 Vehicle | 417 (17.5%) | 259 (44.7%) |
| 2 Vehicles | 918 (38.6%) | 215 (37.1%) |
| 3 or more Vehicles | 940 (39.5%) | 50 (8.6%) |
| Total | 2,379 (100.0%) | 580 (100.0%) |
Real Estate & Mortgages in Ballard County
Real Estate and Mortgage Overview in Ballard County
| Characteristic | Without Mortgage | With Mortgage |
| Housing Units | 1,310 | 1,069 |
| Median Property Value | $83,100 | $148,200 |
| Median Household Income | $48,023 | $231 |
| Monthly Housing Costs | $370 | $48 |
| Real Estate Taxes | $695 | $16 |
Property Value by Mortgage Status in Ballard County
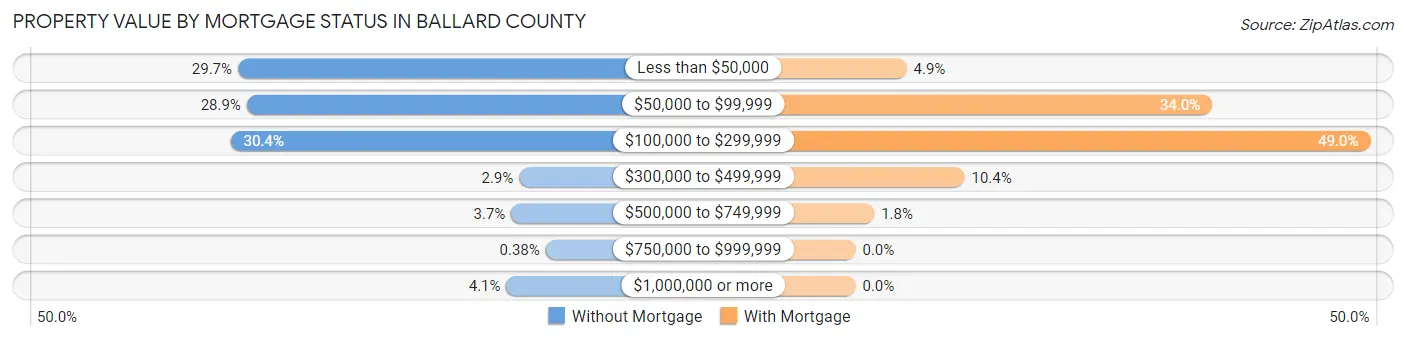
| Property Value | Without Mortgage | With Mortgage |
| Less than $50,000 | 389 (29.7%) | 52 (4.9%) |
| $50,000 to $99,999 | 378 (28.8%) | 363 (34.0%) |
| $100,000 to $299,999 | 398 (30.4%) | 524 (49.0%) |
| $300,000 to $499,999 | 38 (2.9%) | 111 (10.4%) |
| $500,000 to $749,999 | 48 (3.7%) | 19 (1.8%) |
| $750,000 to $999,999 | 5 (0.4%) | 0 (0.0%) |
| $1,000,000 or more | 54 (4.1%) | 0 (0.0%) |
| Total | 1,310 (100.0%) | 1,069 (100.0%) |
Household Income by Mortgage Status in Ballard County
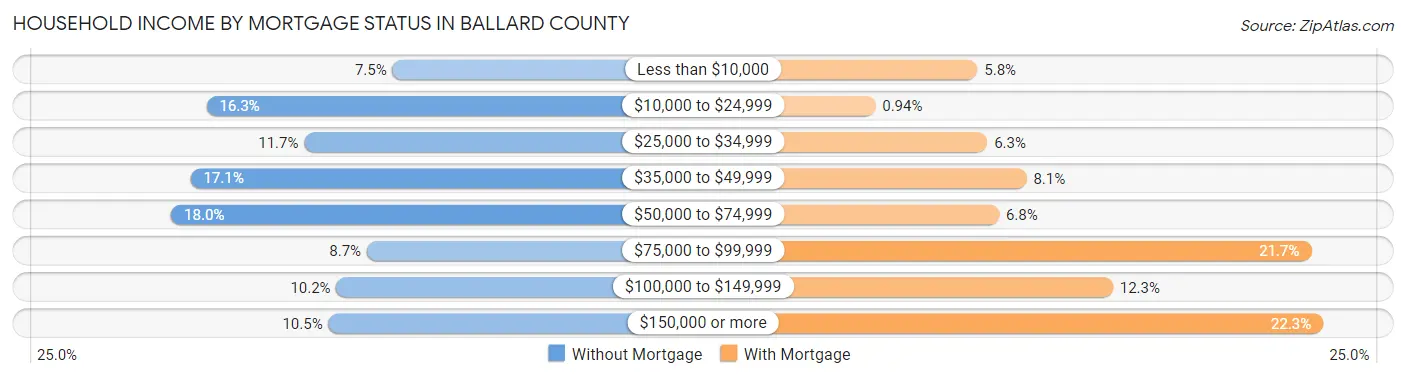
| Household Income | Without Mortgage | With Mortgage |
| Less than $10,000 | 98 (7.5%) | 62 (5.8%) |
| $10,000 to $24,999 | 214 (16.3%) | 10 (0.9%) |
| $25,000 to $34,999 | 153 (11.7%) | 67 (6.3%) |
| $35,000 to $49,999 | 224 (17.1%) | 87 (8.1%) |
| $50,000 to $74,999 | 236 (18.0%) | 73 (6.8%) |
| $75,000 to $99,999 | 114 (8.7%) | 232 (21.7%) |
| $100,000 to $149,999 | 133 (10.2%) | 131 (12.2%) |
| $150,000 or more | 138 (10.5%) | 238 (22.3%) |
| Total | 1,310 (100.0%) | 1,069 (100.0%) |
Property Value to Household Income Ratio in Ballard County
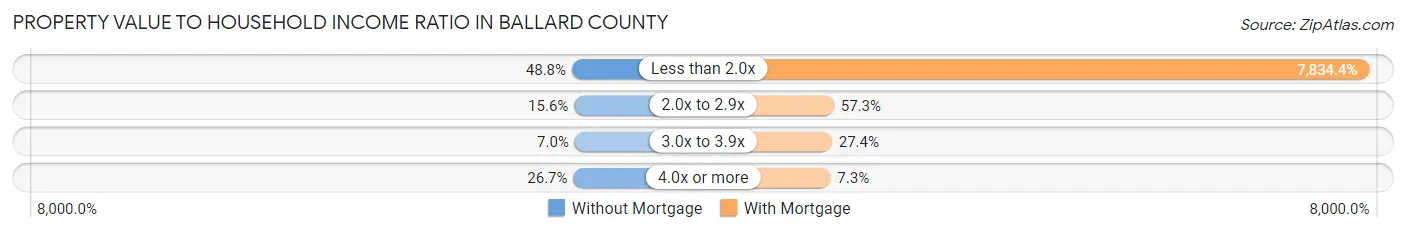
| Value-to-Income Ratio | Without Mortgage | With Mortgage |
| Less than 2.0x | 639 (48.8%) | 83,750 (7,834.4%) |
| 2.0x to 2.9x | 204 (15.6%) | 613 (57.3%) |
| 3.0x to 3.9x | 91 (7.0%) | 293 (27.4%) |
| 4.0x or more | 350 (26.7%) | 78 (7.3%) |
| Total | 1,310 (100.0%) | 1,069 (100.0%) |
Real Estate Taxes by Mortgage Status in Ballard County
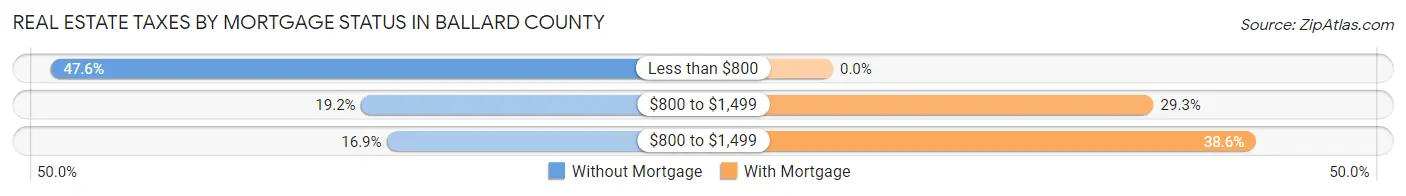
| Property Taxes | Without Mortgage | With Mortgage |
| Less than $800 | 624 (47.6%) | 0 (0.0%) |
| $800 to $1,499 | 252 (19.2%) | 313 (29.3%) |
| $800 to $1,499 | 221 (16.9%) | 413 (38.6%) |
| Total | 1,310 (100.0%) | 1,069 (100.0%) |
Health & Disability in Ballard County
Health Insurance Coverage by Age in Ballard County
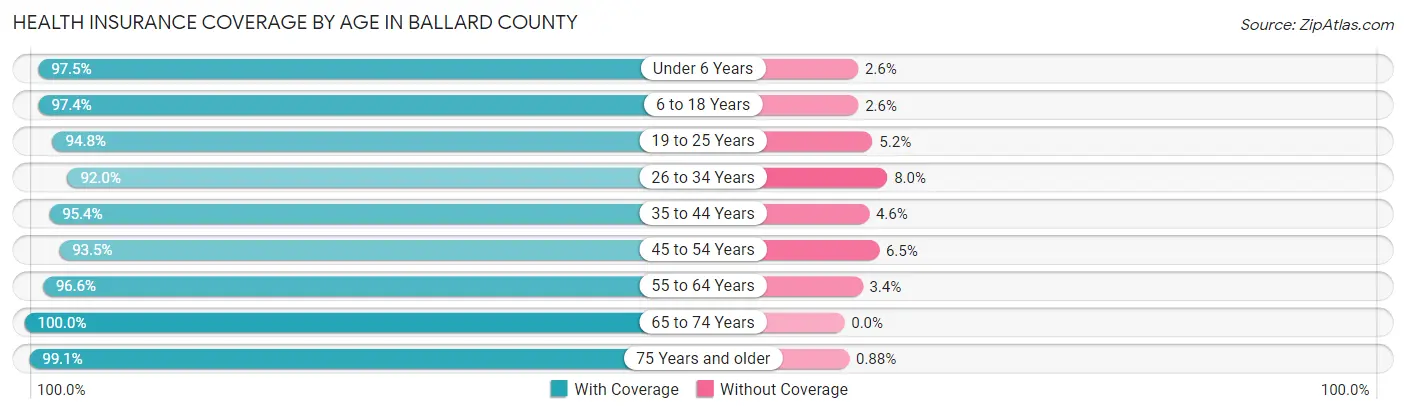
| Age Bracket | With Coverage | Without Coverage |
| Under 6 Years | 420 (97.5%) | 11 (2.5%) |
| 6 to 18 Years | 1,167 (97.4%) | 31 (2.6%) |
| 19 to 25 Years | 579 (94.8%) | 32 (5.2%) |
| 26 to 34 Years | 644 (92.0%) | 56 (8.0%) |
| 35 to 44 Years | 850 (95.4%) | 41 (4.6%) |
| 45 to 54 Years | 956 (93.5%) | 66 (6.5%) |
| 55 to 64 Years | 1,057 (96.6%) | 37 (3.4%) |
| 65 to 74 Years | 986 (100.0%) | 0 (0.0%) |
| 75 Years and older | 679 (99.1%) | 6 (0.9%) |
| Total | 7,338 (96.3%) | 280 (3.7%) |
Health Insurance Coverage by Citizenship Status in Ballard County
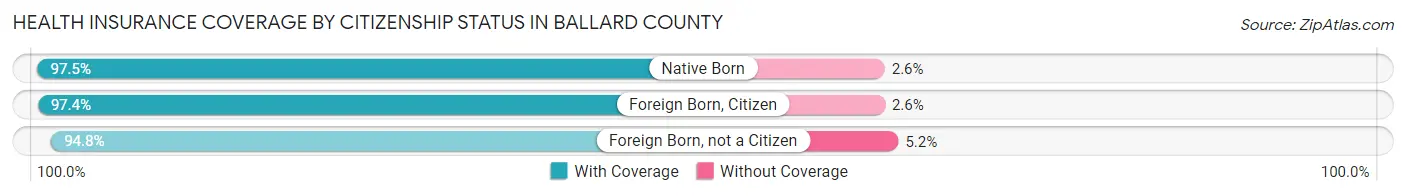
| Citizenship Status | With Coverage | Without Coverage |
| Native Born | 420 (97.5%) | 11 (2.5%) |
| Foreign Born, Citizen | 1,167 (97.4%) | 31 (2.6%) |
| Foreign Born, not a Citizen | 579 (94.8%) | 32 (5.2%) |
Health Insurance Coverage by Household Income in Ballard County
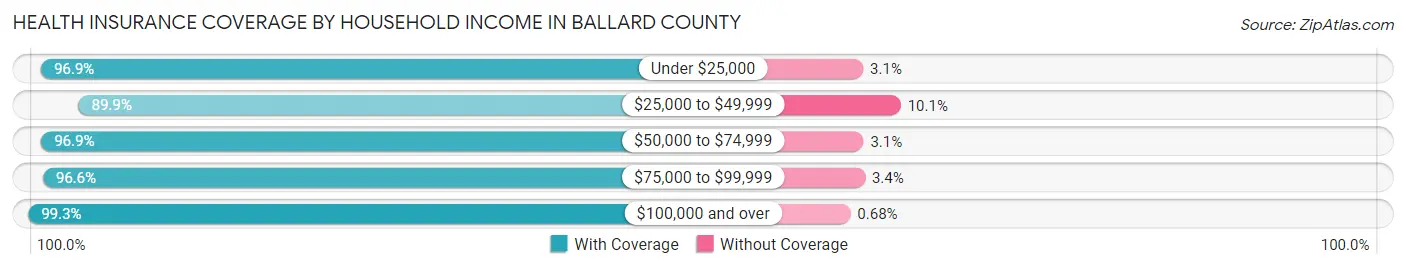
| Household Income | With Coverage | Without Coverage |
| Under $25,000 | 1,138 (96.9%) | 36 (3.1%) |
| $25,000 to $49,999 | 1,342 (89.9%) | 151 (10.1%) |
| $50,000 to $74,999 | 1,242 (96.9%) | 40 (3.1%) |
| $75,000 to $99,999 | 992 (96.6%) | 35 (3.4%) |
| $100,000 and over | 2,624 (99.3%) | 18 (0.7%) |
Public vs Private Health Insurance Coverage by Age in Ballard County
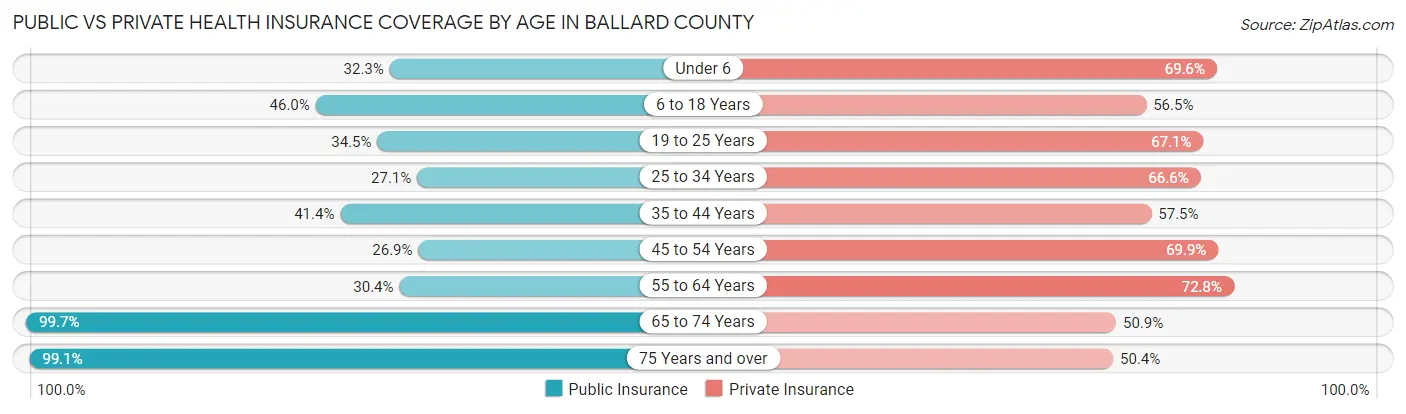
| Age Bracket | Public Insurance | Private Insurance |
| Under 6 | 139 (32.3%) | 300 (69.6%) |
| 6 to 18 Years | 551 (46.0%) | 677 (56.5%) |
| 19 to 25 Years | 211 (34.5%) | 410 (67.1%) |
| 25 to 34 Years | 190 (27.1%) | 466 (66.6%) |
| 35 to 44 Years | 369 (41.4%) | 512 (57.5%) |
| 45 to 54 Years | 275 (26.9%) | 714 (69.9%) |
| 55 to 64 Years | 333 (30.4%) | 796 (72.8%) |
| 65 to 74 Years | 983 (99.7%) | 502 (50.9%) |
| 75 Years and over | 679 (99.1%) | 345 (50.4%) |
| Total | 3,730 (49.0%) | 4,722 (62.0%) |
Disability Status by Sex by Age in Ballard County
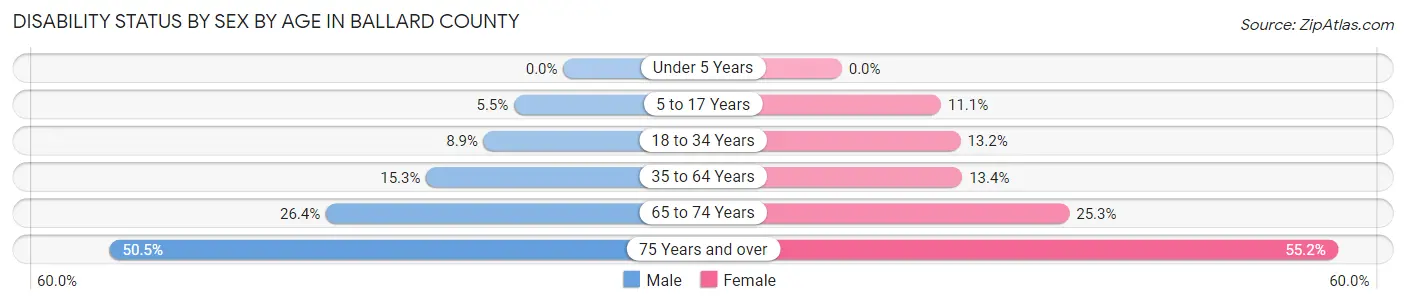
| Age Bracket | Male | Female |
| Under 5 Years | 0 (0.0%) | 0 (0.0%) |
| 5 to 17 Years | 35 (5.5%) | 64 (11.1%) |
| 18 to 34 Years | 67 (8.8%) | 83 (13.2%) |
| 35 to 64 Years | 229 (15.3%) | 202 (13.4%) |
| 65 to 74 Years | 125 (26.4%) | 130 (25.3%) |
| 75 Years and over | 142 (50.5%) | 223 (55.2%) |
Disability Class by Sex by Age in Ballard County
Disability Class: Hearing Difficulty
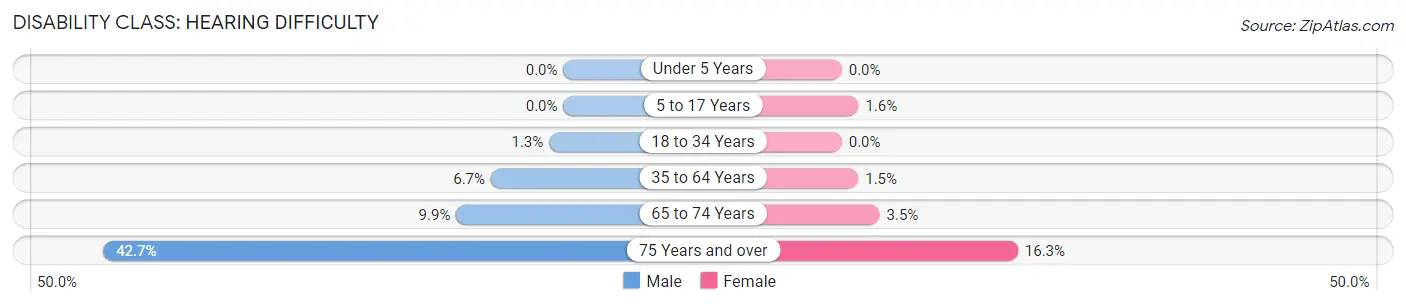
| Age Bracket | Male | Female |
| Under 5 Years | 0 (0.0%) | 0 (0.0%) |
| 5 to 17 Years | 0 (0.0%) | 9 (1.5%) |
| 18 to 34 Years | 10 (1.3%) | 0 (0.0%) |
| 35 to 64 Years | 101 (6.7%) | 23 (1.5%) |
| 65 to 74 Years | 47 (9.9%) | 18 (3.5%) |
| 75 Years and over | 120 (42.7%) | 66 (16.3%) |
Disability Class: Vision Difficulty
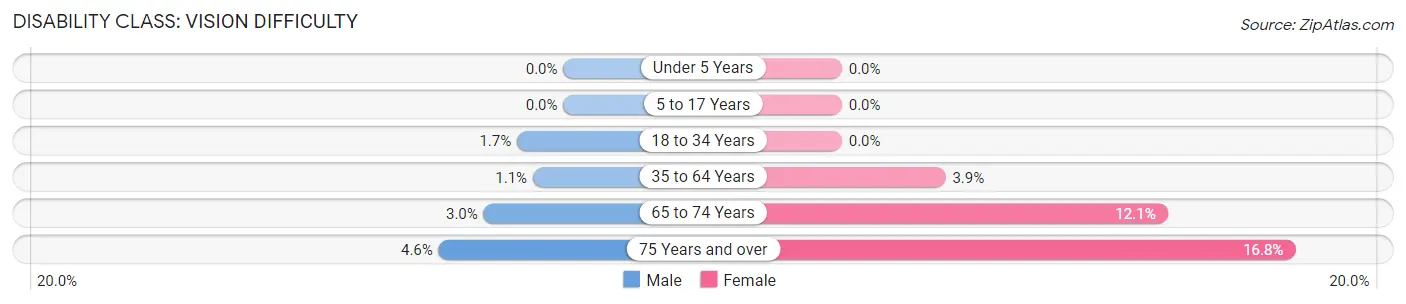
| Age Bracket | Male | Female |
| Under 5 Years | 0 (0.0%) | 0 (0.0%) |
| 5 to 17 Years | 0 (0.0%) | 0 (0.0%) |
| 18 to 34 Years | 13 (1.7%) | 0 (0.0%) |
| 35 to 64 Years | 17 (1.1%) | 58 (3.8%) |
| 65 to 74 Years | 14 (3.0%) | 62 (12.1%) |
| 75 Years and over | 13 (4.6%) | 68 (16.8%) |
Disability Class: Cognitive Difficulty
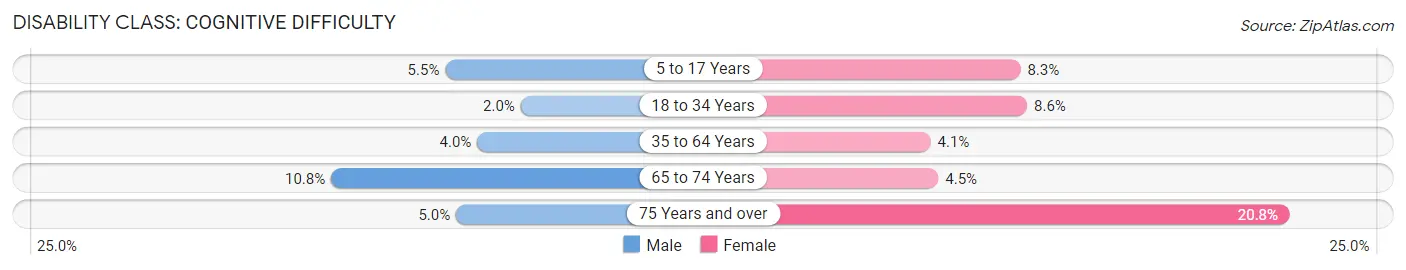
| Age Bracket | Male | Female |
| 5 to 17 Years | 35 (5.5%) | 48 (8.3%) |
| 18 to 34 Years | 15 (2.0%) | 54 (8.6%) |
| 35 to 64 Years | 60 (4.0%) | 62 (4.1%) |
| 65 to 74 Years | 51 (10.8%) | 23 (4.5%) |
| 75 Years and over | 14 (5.0%) | 84 (20.8%) |
Disability Class: Ambulatory Difficulty
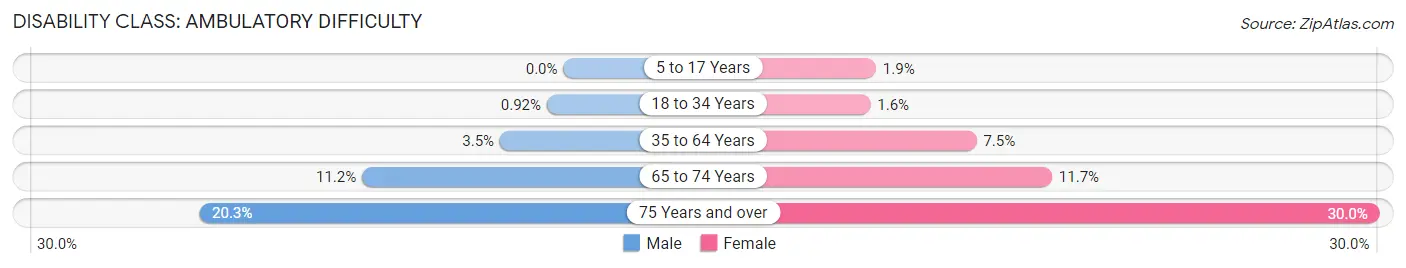
| Age Bracket | Male | Female |
| 5 to 17 Years | 0 (0.0%) | 11 (1.9%) |
| 18 to 34 Years | 7 (0.9%) | 10 (1.6%) |
| 35 to 64 Years | 53 (3.5%) | 113 (7.5%) |
| 65 to 74 Years | 53 (11.2%) | 60 (11.7%) |
| 75 Years and over | 57 (20.3%) | 121 (29.9%) |
Disability Class: Self-Care Difficulty
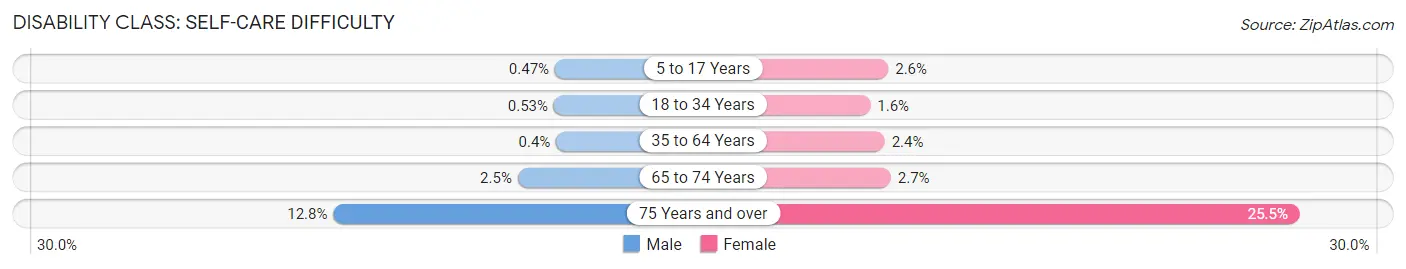
| Age Bracket | Male | Female |
| 5 to 17 Years | 3 (0.5%) | 15 (2.6%) |
| 18 to 34 Years | 4 (0.5%) | 10 (1.6%) |
| 35 to 64 Years | 6 (0.4%) | 36 (2.4%) |
| 65 to 74 Years | 12 (2.5%) | 14 (2.7%) |
| 75 Years and over | 36 (12.8%) | 103 (25.5%) |
Technology Access in Ballard County
Computing Device Access in Ballard County
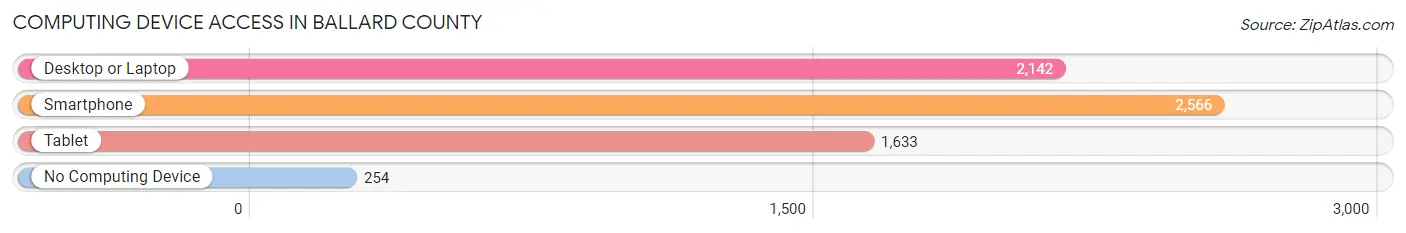
| Device Type | # Households | % Households |
| Desktop or Laptop | 2,142 | 72.4% |
| Smartphone | 2,566 | 86.7% |
| Tablet | 1,633 | 55.2% |
| No Computing Device | 254 | 8.6% |
| Total | 2,959 | 100.0% |
Internet Access in Ballard County
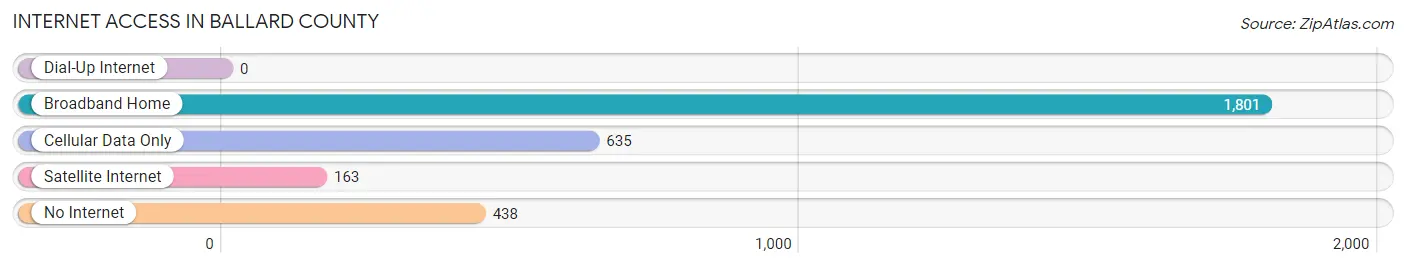
| Internet Type | # Households | % Households |
| Dial-Up Internet | 0 | 0.0% |
| Broadband Home | 1,801 | 60.9% |
| Cellular Data Only | 635 | 21.5% |
| Satellite Internet | 163 | 5.5% |
| No Internet | 438 | 14.8% |
| Total | 2,959 | 100.0% |
Ballard County Summary
Ballard County is a county located in the U.S. state of Kentucky. As of the 2010 census, the population was 8,249. The county seat is Wickliffe. The county was created by the Kentucky State Legislature in 1842 and is named for Captain Bland Ballard, a soldier, statesman, and member of the Kentucky General Assembly.
Geography
Ballard County is located in the westernmost part of Kentucky, along the Mississippi River. It is bordered by McCracken County to the north, Carlisle County to the east, Mississippi County, Arkansas to the south, and Fulton County, Tennessee to the west. The county has a total area of 441 square miles, of which 437 square miles is land and 4.2 square miles (1.0%) is water.
The county is located in the Jackson Purchase region of Kentucky, and is part of the Western Coal Fields region. The county is mostly flat, with some rolling hills in the northern part of the county. The highest point in the county is located in the northern part of the county, near the town of Kevil, and is approximately 400 feet above sea level.
The county is drained by the Mississippi River, which forms the western border of the county. The county is also drained by several creeks, including the Little Bayou Creek, the Big Bayou Creek, and the Ballard Creek.
Demographics
As of the 2010 census, there were 8,249 people, 3,521 households, and 2,395 families residing in the county. The population density was 18.9 people per square mile. There were 4,039 housing units at an average density of 9.2 per square mile. The racial makeup of the county was 95.2% White, 2.7% Black or African American, 0.2% Native American, 0.2% Asian, 0.2% from other races, and 1.7% from two or more races. 1.3% of the population were Hispanic or Latino of any race.
There were 3,521 households, out of which 28.2% had children under the age of 18 living with them, 51.2% were married couples living together, 12.2% had a female householder with no husband present, and 32.2% were non-families. 28.7% of all households were made up of individuals, and 13.2% had someone living alone who was 65 years of age or older. The average household size was 2.33 and the average family size was 2.83.
In the county, the population was spread out, with 22.2% under the age of 18, 8.2% from 18 to 24, 25.7% from 25 to 44, 27.2% from 45 to 64, and 16.7% who were 65 years of age or older. The median age was 40.4 years. For every 100 females there were 94.2 males. For every 100 females age 18 and over, there were 91.2 males.
The median income for a household in the county was $35,945, and the median income for a family was $43,945. Males had a median income of $37,945 versus $25,945 for females. The per capita income for the county was $18,945. About 13.2% of families and 16.7% of the population were below the poverty line, including 22.2% of those under age 18 and 14.2% of those age 65 or over.
Economy
The economy of Ballard County is largely based on agriculture and tourism. The county is home to several large farms, which produce corn, soybeans, wheat, and hay. The county is also home to several wineries, which produce a variety of wines.
Tourism is also an important part of the economy of Ballard County. The county is home to several historic sites, including the Wickliffe Mounds State Historic Site, the Ballard County Courthouse, and the Ballard County Jail. The county is also home to several parks, including the Ballard County Park, the Ballard County Wildlife Management Area, and the Ballard County State Nature Preserve.
The county is also home to several manufacturing companies, including a furniture manufacturer, a plastics manufacturer, and a metal fabrication company. The county is also home to several retail stores, including a grocery store, a hardware store, and several antique stores.
Conclusion
Ballard County is a county located in the U.S. state of Kentucky. As of the 2010 census, the population was 8,249. The county seat is Wickliffe. The county was created by the Kentucky State Legislature in 1842 and is named for Captain Bland Ballard, a soldier, statesman, and member of the Kentucky General Assembly. The county is located in the Jackson Purchase region of Kentucky, and is part of the Western Coal Fields region. The county is mostly flat, with some rolling hills in the northern part of the county. The economy of Ballard County is largely based on agriculture and tourism. The county is home to several large farms, which produce corn, soybeans, wheat, and hay. The county is also home to several wineries, which produce a variety of wines. Tourism is also an important part of the economy of Ballard County. The county is home to several historic sites, parks, and manufacturing companies.
Common Questions
What is Per Capita Income in Ballard County?
Per Capita income in Ballard County is $31,315.
What is the Median Family Income in Ballard County?
Median Family Income in Ballard County is $75,268.
What is the Median Household income in Ballard County?
Median Household Income in Ballard County is $57,111.
What is Income or Wage Gap in Ballard County?
Income or Wage Gap in Ballard County is 23.7%.
Women in Ballard County earn 76.3 cents for every dollar earned by a man.
What is Family Income Deficit in Ballard County?
Family Income Deficit in Ballard County is $13,087.
Families that are below poverty line in Ballard County earn $13,087 less on average than the poverty threshold level.
What is Inequality or Gini Index in Ballard County?
Inequality or Gini Index in Ballard County is 0.46.
What is the Total Population of Ballard County?
Total Population of Ballard County is 7,742.
What is the Total Male Population of Ballard County?
Total Male Population of Ballard County is 3,905.
What is the Total Female Population of Ballard County?
Total Female Population of Ballard County is 3,837.
What is the Ratio of Males per 100 Females in Ballard County?
There are 101.77 Males per 100 Females in Ballard County.
What is the Ratio of Females per 100 Males in Ballard County?
There are 98.26 Females per 100 Males in Ballard County.
What is the Median Population Age in Ballard County?
Median Population Age in Ballard County is 44.7 Years.
What is the Average Family Size in Ballard County
Average Family Size in Ballard County is 3.1 People.
What is the Average Household Size in Ballard County
Average Household Size in Ballard County is 2.6 People.
How Large is the Labor Force in Ballard County?
There are 3,433 People in the Labor Forcein in Ballard County.
What is the Percentage of People in the Labor Force in Ballard County?
53.4% of People are in the Labor Force in Ballard County.
What is the Unemployment Rate in Ballard County?
Unemployment Rate in Ballard County is 5.2%.