Allen County, KY Map & Demographics
Allen County Map
Allen County Overview
$28,307
PER CAPITA INCOME
$72,441
AVG FAMILY INCOME
$57,159
AVG HOUSEHOLD INCOME
28.4%
WAGE / INCOME GAP [ % ]
71.6¢/ $1
WAGE / INCOME GAP [ $ ]
$11,516
FAMILY INCOME DEFICIT
0.44
INEQUALITY / GINI INDEX
20,773
TOTAL POPULATION
10,364
MALE POPULATION
10,409
FEMALE POPULATION
99.57
MALES / 100 FEMALES
100.43
FEMALES / 100 MALES
40.5
MEDIAN AGE
3.1
AVG FAMILY SIZE
2.6
AVG HOUSEHOLD SIZE
9,617
LABOR FORCE [ PEOPLE ]
58.6%
PERCENT IN LABOR FORCE
7.3%
UNEMPLOYMENT RATE
Allen County Area Codes
Income in Allen County
Income Overview in Allen County
Per Capita Income in Allen County is $28,307, while median incomes of families and households are $72,441 and $57,159 respectively.
| Characteristic | Number | Measure |
| Per Capita Income | 20,773 | $28,307 |
| Median Family Income | 5,606 | $72,441 |
| Mean Family Income | 5,606 | $84,540 |
| Median Household Income | 7,816 | $57,159 |
| Mean Household Income | 7,816 | $70,978 |
| Income Deficit | 5,606 | $11,516 |
| Wage / Income Gap (%) | 20,773 | 28.38% |
| Wage / Income Gap ($) | 20,773 | 71.62¢ per $1 |
| Gini / Inequality Index | 20,773 | 0.44 |
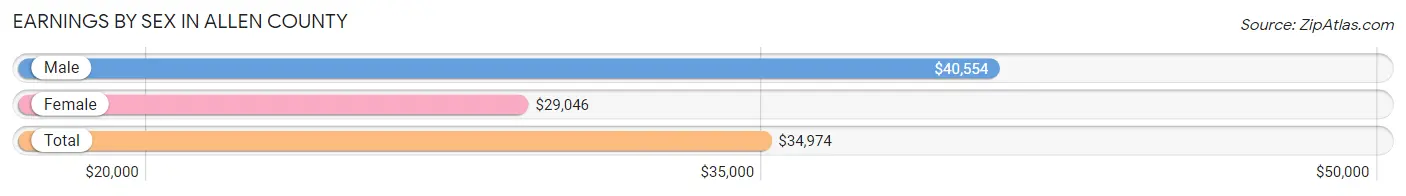
Earnings by Sex in Allen County
Average Earnings in Allen County are $34,974, $40,554 for men and $29,046 for women, a difference of 28.4%.
| Sex | Number | Average Earnings |
| Male | 5,508 (54.3%) | $40,554 |
| Female | 4,641 (45.7%) | $29,046 |
| Total | 10,149 (100.0%) | $34,974 |
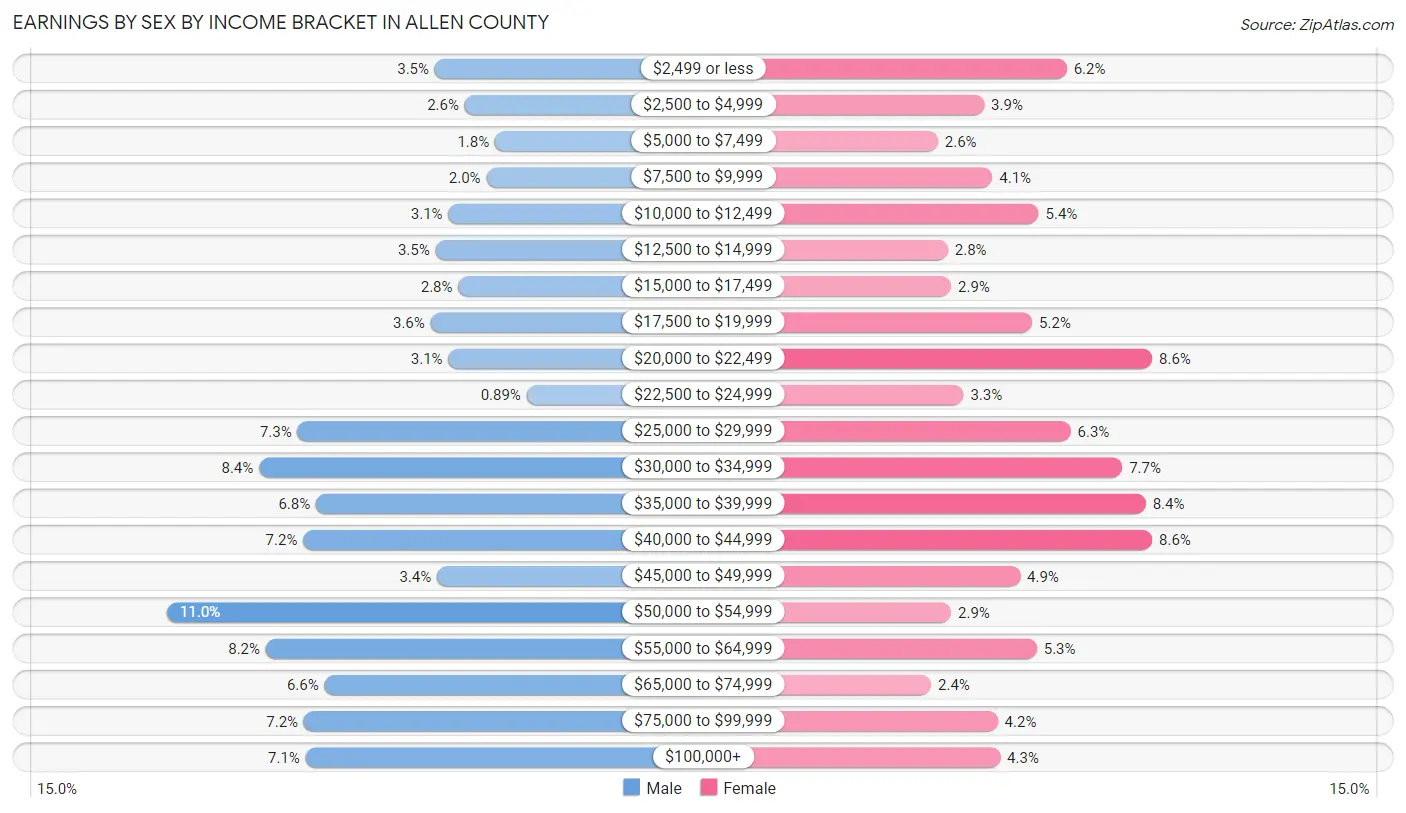
Earnings by Sex by Income Bracket in Allen County
The most common earnings brackets in Allen County are $50,000 to $54,999 for men (606 | 11.0%) and $20,000 to $22,499 for women (398 | 8.6%).
| Income | Male | Female |
| $2,499 or less | 191 (3.5%) | 287 (6.2%) |
| $2,500 to $4,999 | 145 (2.6%) | 179 (3.9%) |
| $5,000 to $7,499 | 98 (1.8%) | 119 (2.6%) |
| $7,500 to $9,999 | 111 (2.0%) | 190 (4.1%) |
| $10,000 to $12,499 | 170 (3.1%) | 250 (5.4%) |
| $12,500 to $14,999 | 190 (3.5%) | 132 (2.8%) |
| $15,000 to $17,499 | 155 (2.8%) | 136 (2.9%) |
| $17,500 to $19,999 | 198 (3.6%) | 242 (5.2%) |
| $20,000 to $22,499 | 170 (3.1%) | 398 (8.6%) |
| $22,500 to $24,999 | 49 (0.9%) | 152 (3.3%) |
| $25,000 to $29,999 | 404 (7.3%) | 292 (6.3%) |
| $30,000 to $34,999 | 463 (8.4%) | 359 (7.7%) |
| $35,000 to $39,999 | 375 (6.8%) | 390 (8.4%) |
| $40,000 to $44,999 | 395 (7.2%) | 398 (8.6%) |
| $45,000 to $49,999 | 188 (3.4%) | 226 (4.9%) |
| $50,000 to $54,999 | 606 (11.0%) | 136 (2.9%) |
| $55,000 to $64,999 | 453 (8.2%) | 248 (5.3%) |
| $65,000 to $74,999 | 362 (6.6%) | 110 (2.4%) |
| $75,000 to $99,999 | 394 (7.1%) | 197 (4.2%) |
| $100,000+ | 391 (7.1%) | 200 (4.3%) |
| Total | 5,508 (100.0%) | 4,641 (100.0%) |
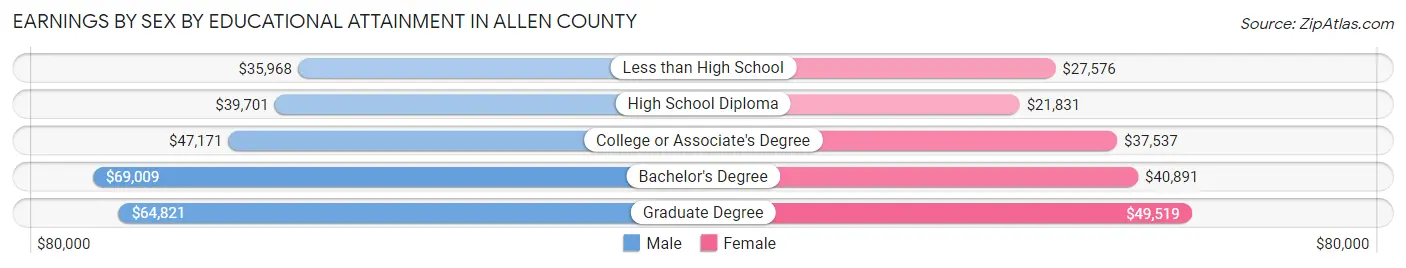
Earnings by Sex by Educational Attainment in Allen County
Average earnings in Allen County are $44,135 for men and $33,340 for women, a difference of 24.5%. Men with an educational attainment of bachelor's degree enjoy the highest average annual earnings of $69,009, while those with less than high school education earn the least with $35,968. Women with an educational attainment of graduate degree earn the most with the average annual earnings of $49,519, while those with high school diploma education have the smallest earnings of $21,831.
| Educational Attainment | Male Income | Female Income |
| Less than High School | $35,968 | $27,576 |
| High School Diploma | $39,701 | $21,831 |
| College or Associate's Degree | $47,171 | $37,537 |
| Bachelor's Degree | $69,009 | $40,891 |
| Graduate Degree | $64,821 | $49,519 |
| Total | $44,135 | $33,340 |
Family Income in Allen County
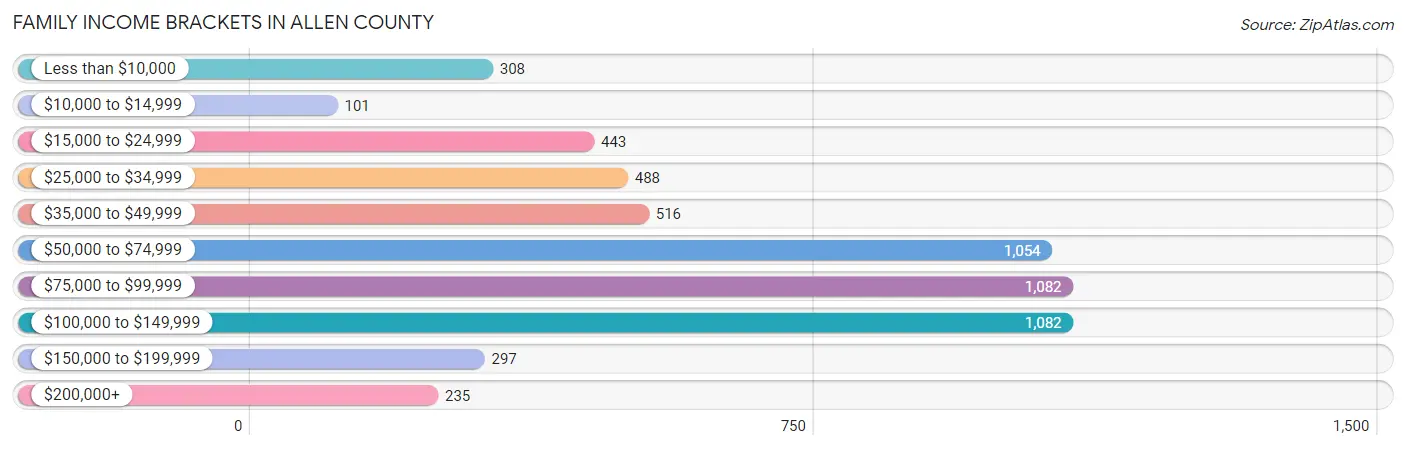
Family Income Brackets in Allen County
According to the Allen County family income data, there are 1,082 families falling into the $75,000 to $99,999 income range, which is the most common income bracket and makes up 19.3% of all families. Conversely, the $10,000 to $14,999 income bracket is the least frequent group with only 101 families (1.8%) belonging to this category.
| Income Bracket | # Families | % Families |
| Less than $10,000 | 308 | 5.5% |
| $10,000 to $14,999 | 101 | 1.8% |
| $15,000 to $24,999 | 443 | 7.9% |
| $25,000 to $34,999 | 488 | 8.7% |
| $35,000 to $49,999 | 516 | 9.2% |
| $50,000 to $74,999 | 1,054 | 18.8% |
| $75,000 to $99,999 | 1,082 | 19.3% |
| $100,000 to $149,999 | 1,082 | 19.3% |
| $150,000 to $199,999 | 297 | 5.3% |
| $200,000+ | 235 | 4.2% |
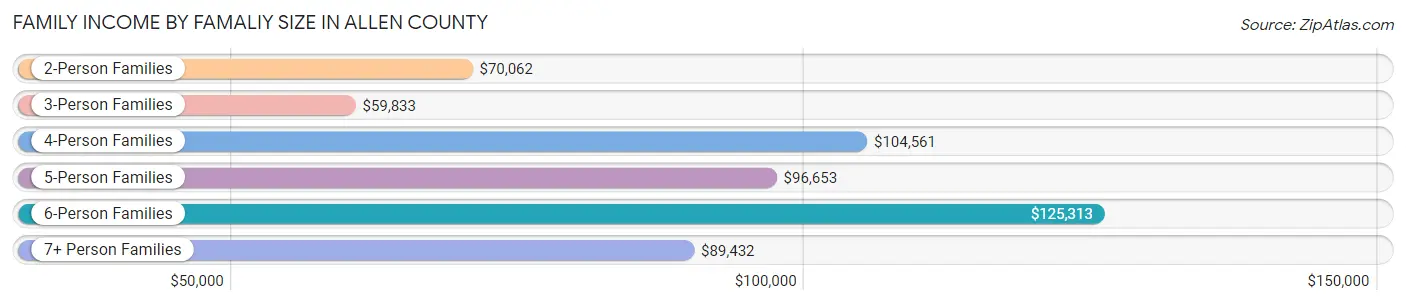
Family Income by Famaliy Size in Allen County
6-person families (119 | 2.1%) account for the highest median family income in Allen County with $125,313 per family, while 2-person families (2,588 | 46.2%) have the highest median income of $35,031 per family member.
| Income Bracket | # Families | Median Income |
| 2-Person Families | 2,588 (46.2%) | $70,062 |
| 3-Person Families | 1,604 (28.6%) | $59,833 |
| 4-Person Families | 751 (13.4%) | $104,561 |
| 5-Person Families | 335 (6.0%) | $96,653 |
| 6-Person Families | 119 (2.1%) | $125,313 |
| 7+ Person Families | 209 (3.7%) | $89,432 |
| Total | 5,606 (100.0%) | $72,441 |
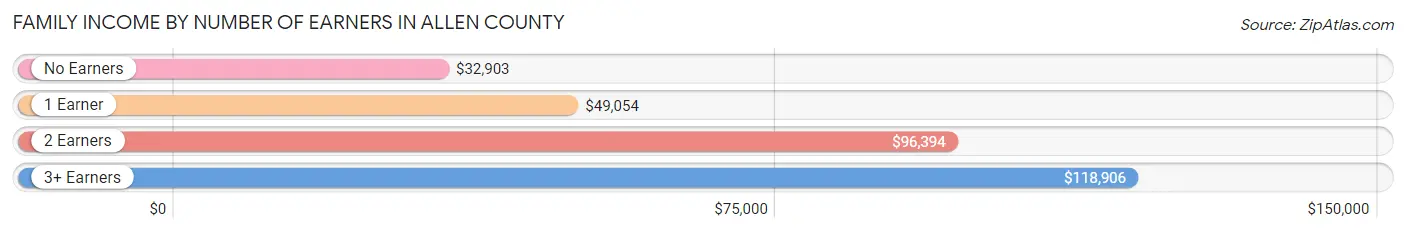
Family Income by Number of Earners in Allen County
The median family income in Allen County is $72,441, with families comprising 3+ earners (484) having the highest median family income of $118,906, while families with no earners (1,048) have the lowest median family income of $32,903, accounting for 8.6% and 18.7% of families, respectively.
| Number of Earners | # Families | Median Income |
| No Earners | 1,048 (18.7%) | $32,903 |
| 1 Earner | 1,946 (34.7%) | $49,054 |
| 2 Earners | 2,128 (38.0%) | $96,394 |
| 3+ Earners | 484 (8.6%) | $118,906 |
| Total | 5,606 (100.0%) | $72,441 |
Household Income in Allen County
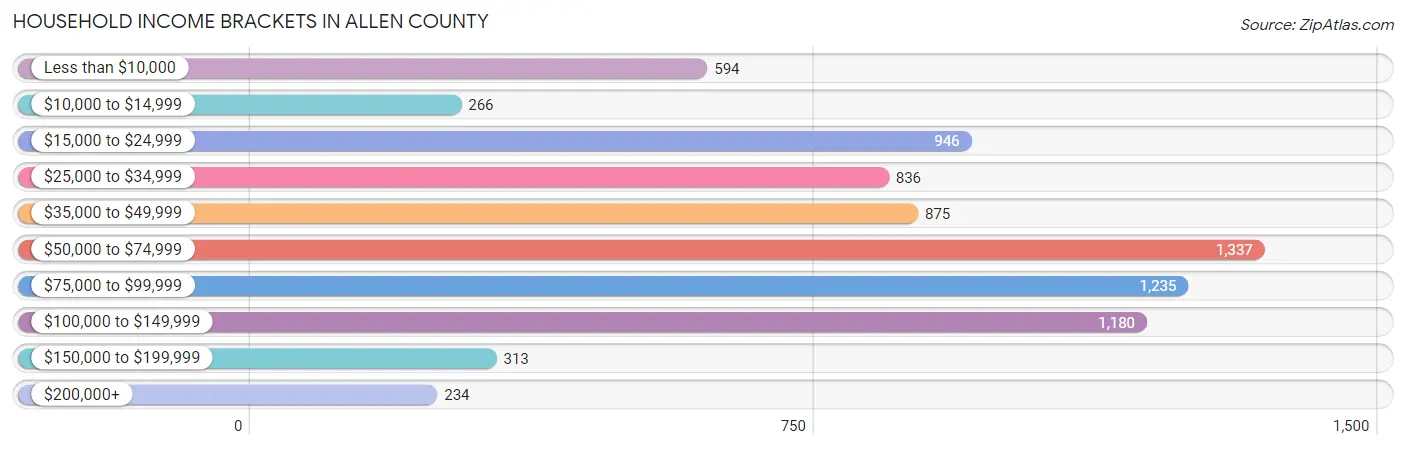
Household Income Brackets in Allen County
With 1,337 households falling in the category, the $50,000 to $74,999 income range is the most frequent in Allen County, accounting for 17.1% of all households. In contrast, only 234 households (3.0%) fall into the $200,000+ income bracket, making it the least populous group.
| Income Bracket | # Households | % Households |
| Less than $10,000 | 594 | 7.6% |
| $10,000 to $14,999 | 266 | 3.4% |
| $15,000 to $24,999 | 946 | 12.1% |
| $25,000 to $34,999 | 836 | 10.7% |
| $35,000 to $49,999 | 875 | 11.2% |
| $50,000 to $74,999 | 1,337 | 17.1% |
| $75,000 to $99,999 | 1,235 | 15.8% |
| $100,000 to $149,999 | 1,180 | 15.1% |
| $150,000 to $199,999 | 313 | 4.0% |
| $200,000+ | 234 | 3.0% |
Household Income by Householder Age in Allen County
The median household income in Allen County is $57,159, with the highest median household income of $66,312 found in the 45 to 64 years age bracket for the primary householder. A total of 3,123 households (40.0%) fall into this category. Meanwhile, the 65+ years age bracket for the primary householder has the lowest median household income of $38,983, with 2,118 households (27.1%) in this group.
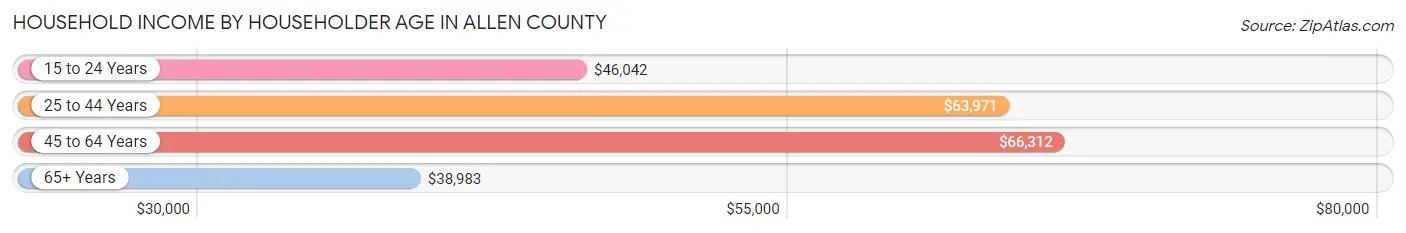
| Income Bracket | # Households | Median Income |
| 15 to 24 Years | 289 (3.7%) | $46,042 |
| 25 to 44 Years | 2,286 (29.2%) | $63,971 |
| 45 to 64 Years | 3,123 (40.0%) | $66,312 |
| 65+ Years | 2,118 (27.1%) | $38,983 |
| Total | 7,816 (100.0%) | $57,159 |
Poverty in Allen County
Income Below Poverty by Sex and Age in Allen County
With 13.9% poverty level for males and 19.1% for females among the residents of Allen County, 15 year old males and 12 to 14 year old females are the most vulnerable to poverty, with 127 males (50.8%) and 214 females (42.7%) in their respective age groups living below the poverty level.
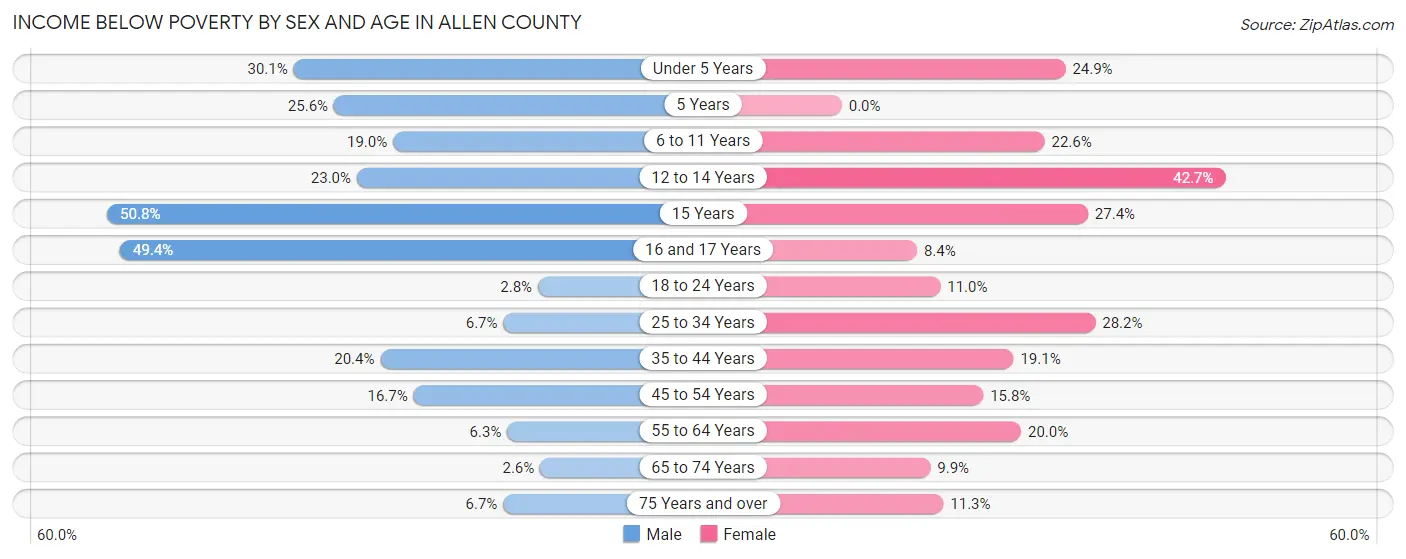
| Age Bracket | Male | Female |
| Under 5 Years | 198 (30.0%) | 137 (24.9%) |
| 5 Years | 35 (25.6%) | 0 (0.0%) |
| 6 to 11 Years | 155 (19.0%) | 170 (22.6%) |
| 12 to 14 Years | 72 (23.0%) | 214 (42.7%) |
| 15 Years | 127 (50.8%) | 37 (27.4%) |
| 16 and 17 Years | 79 (49.4%) | 21 (8.4%) |
| 18 to 24 Years | 23 (2.8%) | 88 (11.0%) |
| 25 to 34 Years | 86 (6.7%) | 376 (28.2%) |
| 35 to 44 Years | 259 (20.4%) | 222 (19.1%) |
| 45 to 54 Years | 231 (16.7%) | 209 (15.8%) |
| 55 to 64 Years | 90 (6.2%) | 286 (20.0%) |
| 65 to 74 Years | 28 (2.6%) | 109 (9.9%) |
| 75 Years and over | 41 (6.7%) | 88 (11.3%) |
| Total | 1,424 (13.9%) | 1,957 (19.1%) |
Income Above Poverty by Sex and Age in Allen County
According to the poverty statistics in Allen County, males aged 65 to 74 years and females aged 5 years are the age groups that are most secure financially, with 97.4% of males and 100.0% of females in these age groups living above the poverty line.
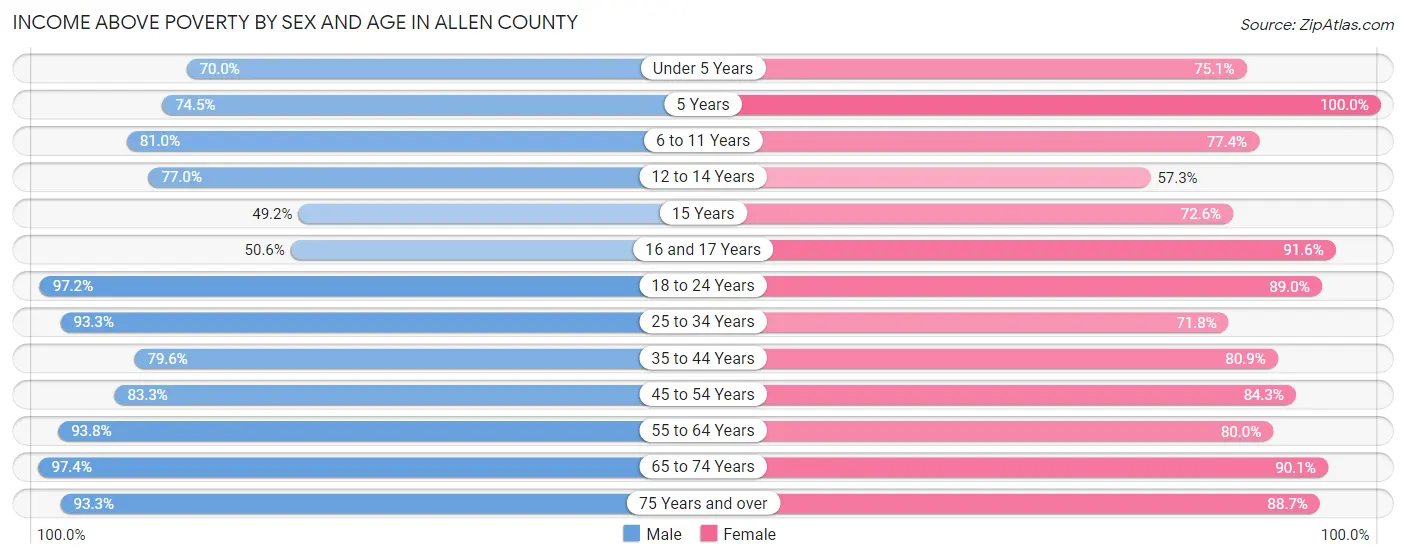
| Age Bracket | Male | Female |
| Under 5 Years | 461 (70.0%) | 413 (75.1%) |
| 5 Years | 102 (74.5%) | 109 (100.0%) |
| 6 to 11 Years | 662 (81.0%) | 583 (77.4%) |
| 12 to 14 Years | 241 (77.0%) | 287 (57.3%) |
| 15 Years | 123 (49.2%) | 98 (72.6%) |
| 16 and 17 Years | 81 (50.6%) | 230 (91.6%) |
| 18 to 24 Years | 791 (97.2%) | 714 (89.0%) |
| 25 to 34 Years | 1,201 (93.3%) | 956 (71.8%) |
| 35 to 44 Years | 1,011 (79.6%) | 939 (80.9%) |
| 45 to 54 Years | 1,154 (83.3%) | 1,118 (84.3%) |
| 55 to 64 Years | 1,351 (93.8%) | 1,147 (80.0%) |
| 65 to 74 Years | 1,054 (97.4%) | 997 (90.1%) |
| 75 Years and over | 571 (93.3%) | 690 (88.7%) |
| Total | 8,803 (86.1%) | 8,281 (80.9%) |
Income Below Poverty Among Married-Couple Families in Allen County
The poverty statistics for married-couple families in Allen County show that 6.3% or 258 of the total 4,077 families live below the poverty line. Families with 5 or more children have the highest poverty rate of 14.1%, comprising of 14 families. On the other hand, families with no children have the lowest poverty rate of 3.4%, which includes 85 families.
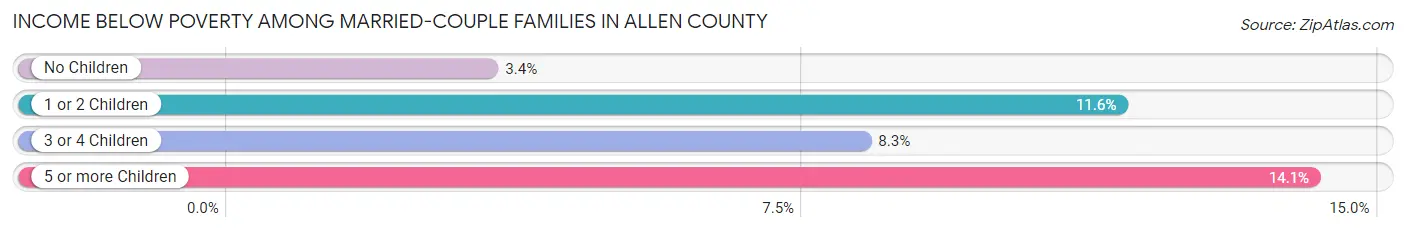
| Children | Above Poverty | Below Poverty |
| No Children | 2,413 (96.6%) | 85 (3.4%) |
| 1 or 2 Children | 966 (88.4%) | 127 (11.6%) |
| 3 or 4 Children | 355 (91.7%) | 32 (8.3%) |
| 5 or more Children | 85 (85.9%) | 14 (14.1%) |
| Total | 3,819 (93.7%) | 258 (6.3%) |
Income Below Poverty Among Single-Parent Households in Allen County
According to the poverty data in Allen County, 21.6% or 149 single-father households and 36.7% or 308 single-mother households are living below the poverty line. Among single-father households, those with 3 or 4 children have the highest poverty rate, with 14 households (100.0%) experiencing poverty. Likewise, among single-mother households, those with 3 or 4 children have the highest poverty rate, with 64 households (100.0%) falling below the poverty line.
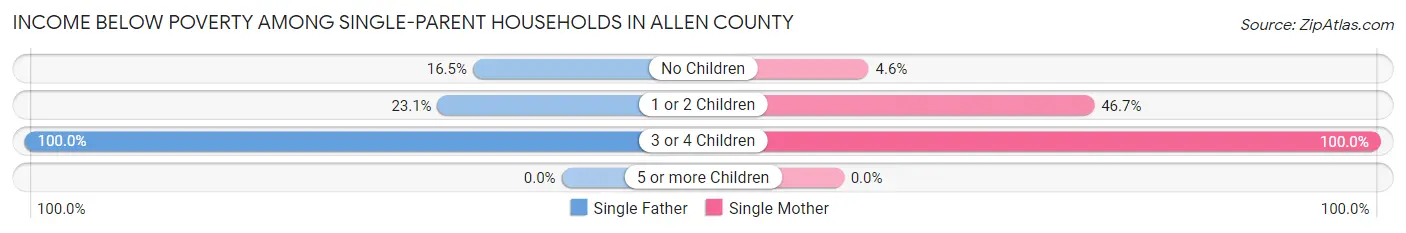
| Children | Single Father | Single Mother |
| No Children | 53 (16.5%) | 13 (4.6%) |
| 1 or 2 Children | 82 (23.1%) | 231 (46.7%) |
| 3 or 4 Children | 14 (100.0%) | 64 (100.0%) |
| 5 or more Children | 0 (0.0%) | 0 (0.0%) |
| Total | 149 (21.6%) | 308 (36.7%) |
Income Below Poverty Among Married-Couple vs Single-Parent Households in Allen County
The poverty data for Allen County shows that 258 of the married-couple family households (6.3%) and 457 of the single-parent households (29.9%) are living below the poverty level. Within the married-couple family households, those with 5 or more children have the highest poverty rate, with 14 households (14.1%) falling below the poverty line. Among the single-parent households, those with 3 or 4 children have the highest poverty rate, with 78 household (100.0%) living below poverty.
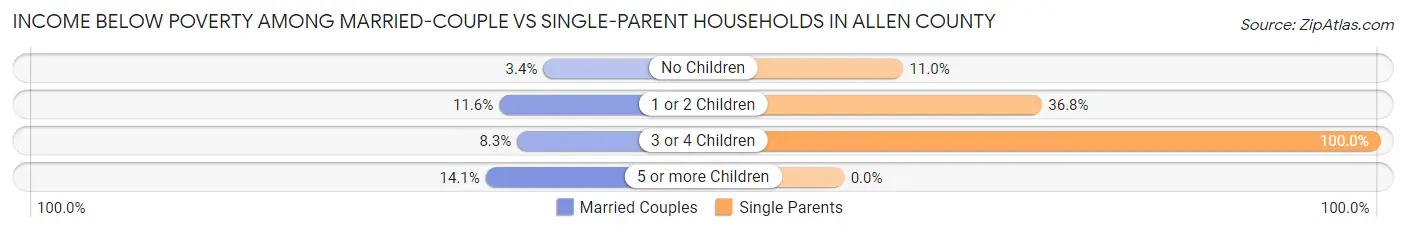
| Children | Married-Couple Families | Single-Parent Households |
| No Children | 85 (3.4%) | 66 (11.0%) |
| 1 or 2 Children | 127 (11.6%) | 313 (36.8%) |
| 3 or 4 Children | 32 (8.3%) | 78 (100.0%) |
| 5 or more Children | 14 (14.1%) | 0 (0.0%) |
| Total | 258 (6.3%) | 457 (29.9%) |
Race in Allen County
The most populous races in Allen County are White / Caucasian (19,906 | 95.8%), Two or more Races (557 | 2.7%), and Hispanic or Latino (503 | 2.4%).
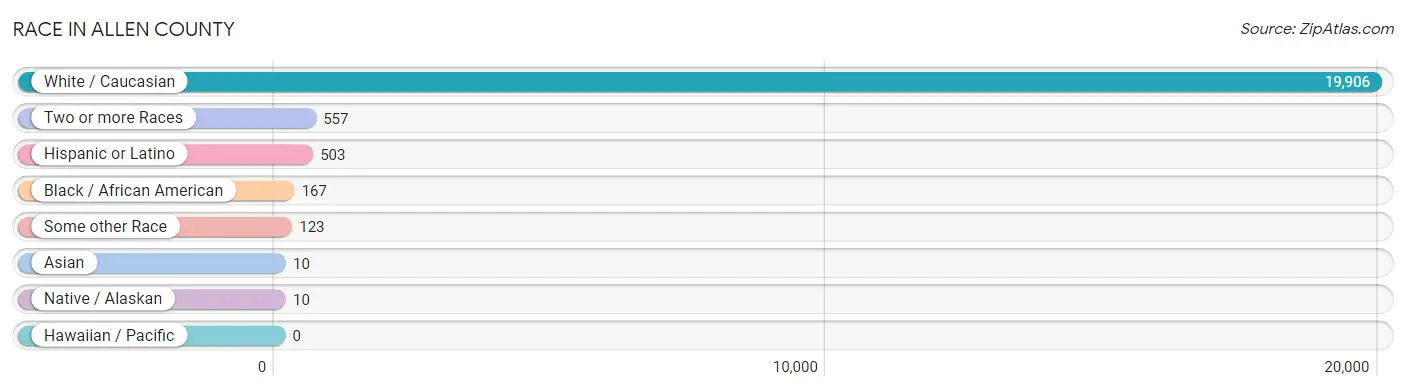
| Race | # Population | % Population |
| Asian | 10 | 0.1% |
| Black / African American | 167 | 0.8% |
| Hawaiian / Pacific | 0 | 0.0% |
| Hispanic or Latino | 503 | 2.4% |
| Native / Alaskan | 10 | 0.1% |
| White / Caucasian | 19,906 | 95.8% |
| Two or more Races | 557 | 2.7% |
| Some other Race | 123 | 0.6% |
| Total | 20,773 | 100.0% |
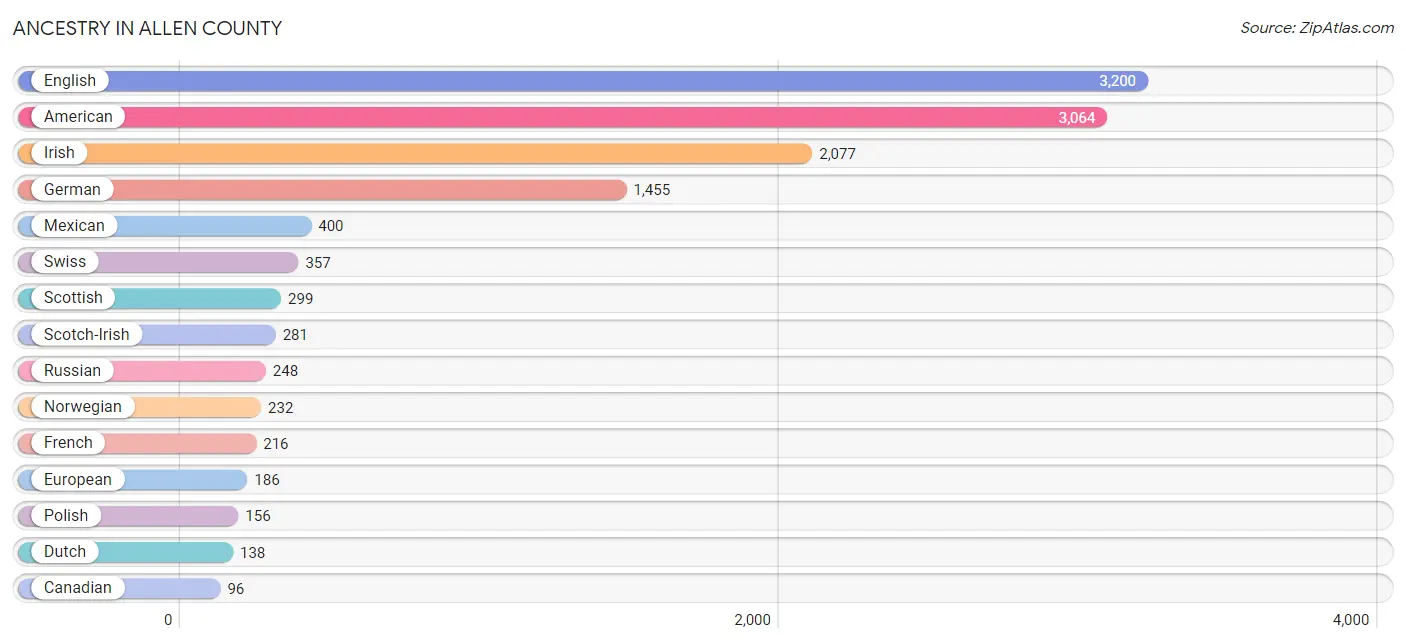
Ancestry in Allen County
The most populous ancestries reported in Allen County are English (3,200 | 15.4%), American (3,064 | 14.7%), Irish (2,077 | 10.0%), German (1,455 | 7.0%), and Mexican (400 | 1.9%), together accounting for 49.1% of all Allen County residents.
| Ancestry | # Population | % Population |
| African | 51 | 0.3% |
| American | 3,064 | 14.7% |
| Austrian | 29 | 0.1% |
| Belizean | 25 | 0.1% |
| Bhutanese | 7 | 0.0% |
| Blackfeet | 3 | 0.0% |
| Burmese | 8 | 0.0% |
| Canadian | 96 | 0.5% |
| Central American | 16 | 0.1% |
| Cherokee | 43 | 0.2% |
| Choctaw | 8 | 0.0% |
| Colombian | 27 | 0.1% |
| Costa Rican | 16 | 0.1% |
| Creek | 7 | 0.0% |
| Croatian | 4 | 0.0% |
| Crow | 2 | 0.0% |
| Czechoslovakian | 11 | 0.1% |
| Danish | 10 | 0.1% |
| Dominican | 9 | 0.0% |
| Dutch | 138 | 0.7% |
| Eastern European | 16 | 0.1% |
| English | 3,200 | 15.4% |
| European | 186 | 0.9% |
| French | 216 | 1.0% |
| French Canadian | 12 | 0.1% |
| German | 1,455 | 7.0% |
| Greek | 10 | 0.1% |
| Hungarian | 43 | 0.2% |
| Irish | 2,077 | 10.0% |
| Iroquois | 2 | 0.0% |
| Italian | 71 | 0.3% |
| Korean | 3 | 0.0% |
| Latvian | 11 | 0.1% |
| Lithuanian | 7 | 0.0% |
| Mexican | 400 | 1.9% |
| Norwegian | 232 | 1.1% |
| Pennsylvania German | 27 | 0.1% |
| Polish | 156 | 0.7% |
| Puerto Rican | 13 | 0.1% |
| Romanian | 47 | 0.2% |
| Russian | 248 | 1.2% |
| Samoan | 13 | 0.1% |
| Scandinavian | 4 | 0.0% |
| Scotch-Irish | 281 | 1.3% |
| Scottish | 299 | 1.4% |
| South American | 27 | 0.1% |
| Spanish | 38 | 0.2% |
| Subsaharan African | 51 | 0.3% |
| Swedish | 45 | 0.2% |
| Swiss | 357 | 1.7% |
| Welsh | 29 | 0.1% | View All 51 Rows |
Immigrants in Allen County
The most numerous immigrant groups reported in Allen County came from Central America (290 | 1.4%), Latin America (290 | 1.4%), Mexico (249 | 1.2%), Canada (43 | 0.2%), and Belize (25 | 0.1%), together accounting for 4.3% of all Allen County residents.
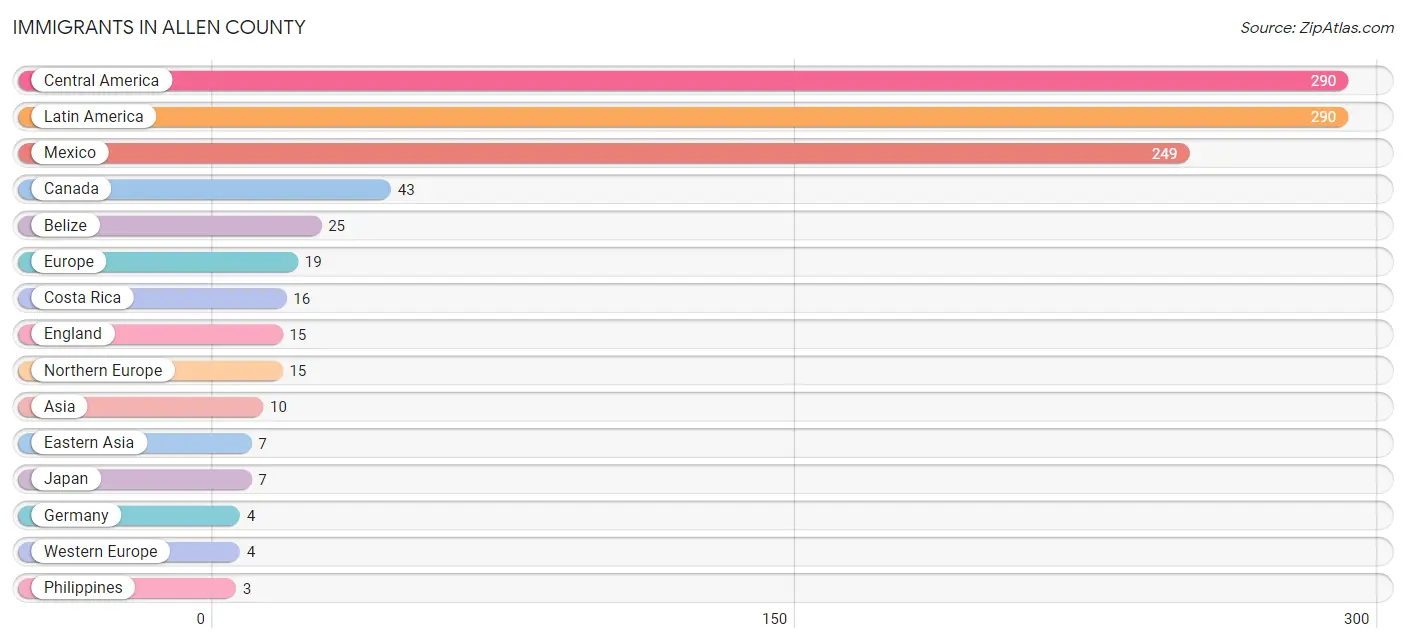
| Immigration Origin | # Population | % Population |
| Asia | 10 | 0.1% |
| Belize | 25 | 0.1% |
| Canada | 43 | 0.2% |
| Central America | 290 | 1.4% |
| Costa Rica | 16 | 0.1% |
| Eastern Asia | 7 | 0.0% |
| England | 15 | 0.1% |
| Europe | 19 | 0.1% |
| Germany | 4 | 0.0% |
| Japan | 7 | 0.0% |
| Latin America | 290 | 1.4% |
| Mexico | 249 | 1.2% |
| Northern Europe | 15 | 0.1% |
| Philippines | 3 | 0.0% |
| South Eastern Asia | 3 | 0.0% |
| Western Europe | 4 | 0.0% | View All 16 Rows |
Sex and Age in Allen County
Sex and Age in Allen County
The most populous age groups in Allen County are 5 to 9 Years (828 | 8.0%) for men and 55 to 59 Years (740 | 7.1%) for women.
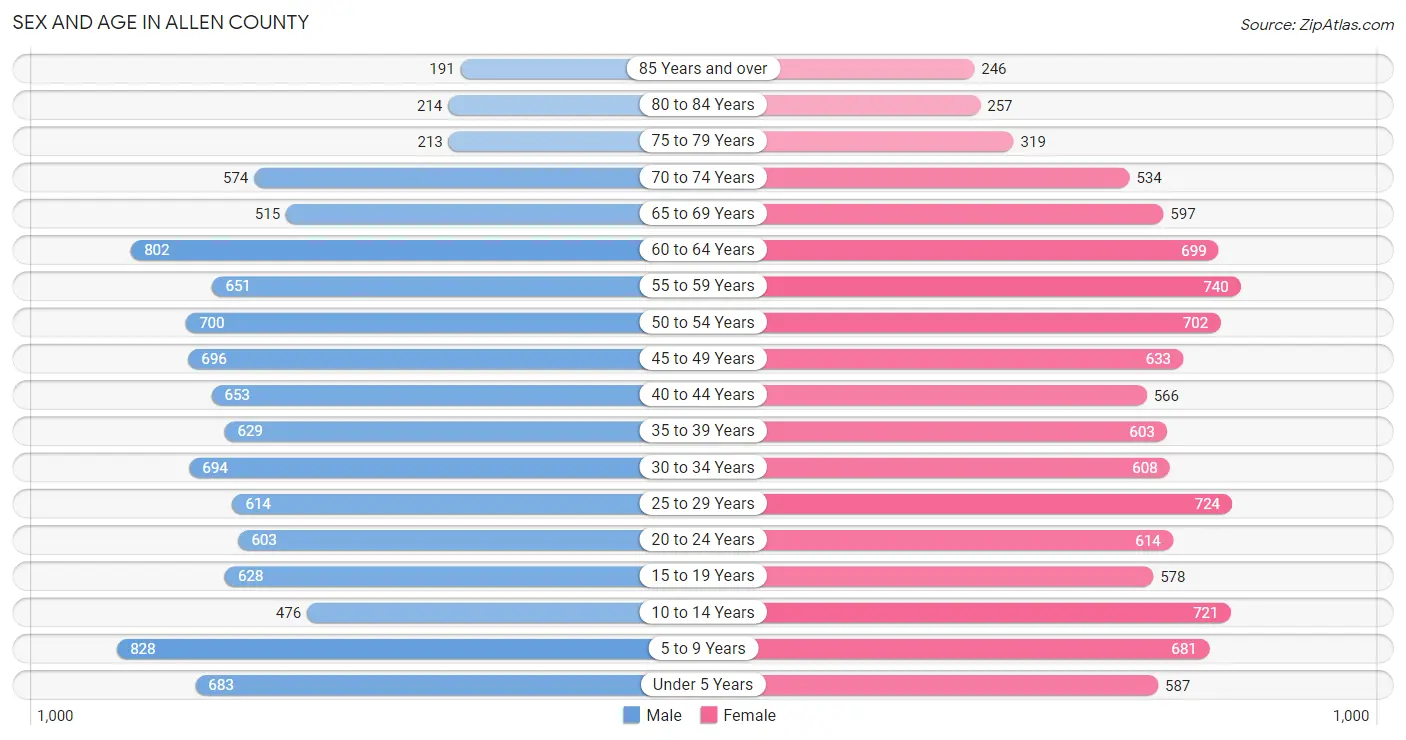
| Age Bracket | Male | Female |
| Under 5 Years | 683 (6.6%) | 587 (5.6%) |
| 5 to 9 Years | 828 (8.0%) | 681 (6.5%) |
| 10 to 14 Years | 476 (4.6%) | 721 (6.9%) |
| 15 to 19 Years | 628 (6.1%) | 578 (5.6%) |
| 20 to 24 Years | 603 (5.8%) | 614 (5.9%) |
| 25 to 29 Years | 614 (5.9%) | 724 (7.0%) |
| 30 to 34 Years | 694 (6.7%) | 608 (5.8%) |
| 35 to 39 Years | 629 (6.1%) | 603 (5.8%) |
| 40 to 44 Years | 653 (6.3%) | 566 (5.4%) |
| 45 to 49 Years | 696 (6.7%) | 633 (6.1%) |
| 50 to 54 Years | 700 (6.8%) | 702 (6.7%) |
| 55 to 59 Years | 651 (6.3%) | 740 (7.1%) |
| 60 to 64 Years | 802 (7.7%) | 699 (6.7%) |
| 65 to 69 Years | 515 (5.0%) | 597 (5.7%) |
| 70 to 74 Years | 574 (5.5%) | 534 (5.1%) |
| 75 to 79 Years | 213 (2.1%) | 319 (3.1%) |
| 80 to 84 Years | 214 (2.1%) | 257 (2.5%) |
| 85 Years and over | 191 (1.8%) | 246 (2.4%) |
| Total | 10,364 (100.0%) | 10,409 (100.0%) |
Families and Households in Allen County
Median Family Size in Allen County
The median family size in Allen County is 3.13 persons per family, with married-couple families (4,077 | 72.7%) accounting for the largest median family size of 3.2 persons per family. On the other hand, single male/father families (690 | 12.3%) represent the smallest median family size with 2.81 persons per family.
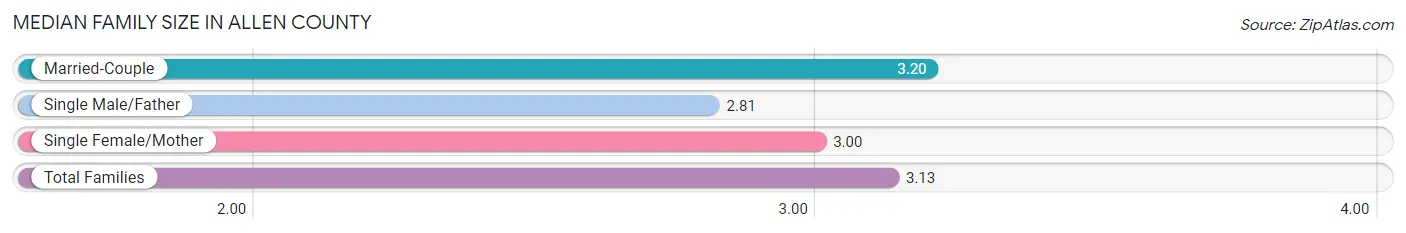
| Family Type | # Families | Family Size |
| Married-Couple | 4,077 (72.7%) | 3.20 |
| Single Male/Father | 690 (12.3%) | 2.81 |
| Single Female/Mother | 839 (15.0%) | 3.00 |
| Total Families | 5,606 (100.0%) | 3.13 |
Median Household Size in Allen County
The median household size in Allen County is 2.63 persons per household, with married-couple households (4,077 | 52.2%) accounting for the largest median household size of 3.23 persons per household. non-family households (2,210 | 28.3%) represent the smallest median household size with 1.20 persons per household.
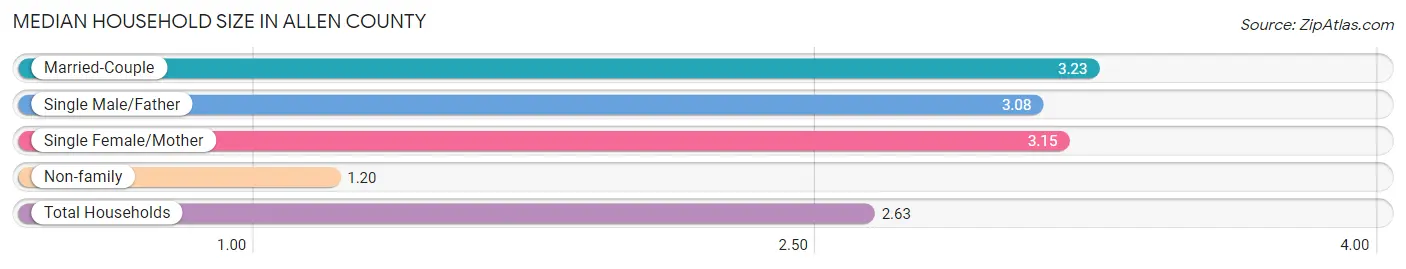
| Household Type | # Households | Household Size |
| Married-Couple | 4,077 (52.2%) | 3.23 |
| Single Male/Father | 690 (8.8%) | 3.08 |
| Single Female/Mother | 839 (10.7%) | 3.15 |
| Non-family | 2,210 (28.3%) | 1.20 |
| Total Households | 7,816 (100.0%) | 2.63 |
Household Size by Marriage Status in Allen County
Out of a total of 7,816 households in Allen County, 5,606 (71.7%) are family households, while 2,210 (28.3%) are nonfamily households. The most numerous type of family households are 2-person households, comprising 2,417, and the most common type of nonfamily households are 1-person households, comprising 1,931.
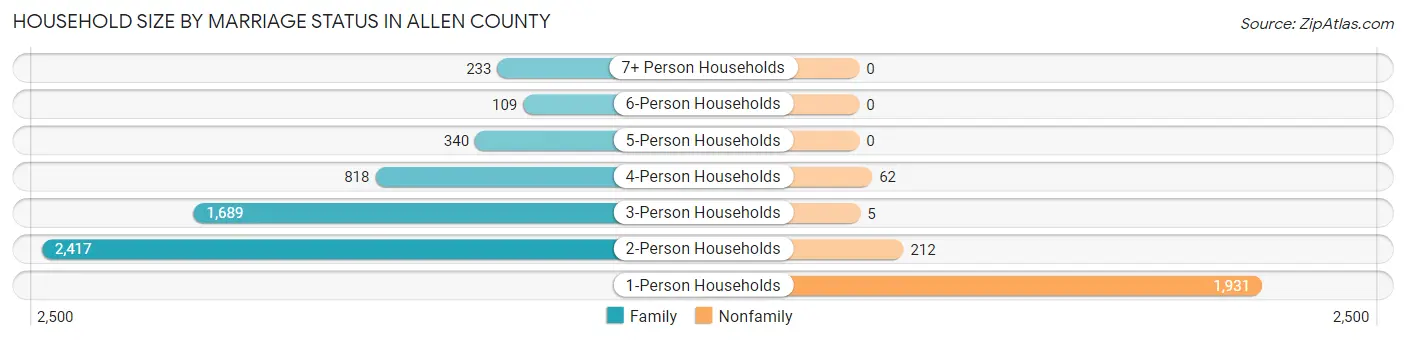
| Household Size | Family Households | Nonfamily Households |
| 1-Person Households | - | 1,931 (24.7%) |
| 2-Person Households | 2,417 (30.9%) | 212 (2.7%) |
| 3-Person Households | 1,689 (21.6%) | 5 (0.1%) |
| 4-Person Households | 818 (10.5%) | 62 (0.8%) |
| 5-Person Households | 340 (4.3%) | 0 (0.0%) |
| 6-Person Households | 109 (1.4%) | 0 (0.0%) |
| 7+ Person Households | 233 (3.0%) | 0 (0.0%) |
| Total | 5,606 (71.7%) | 2,210 (28.3%) |
Female Fertility in Allen County
Fertility by Age in Allen County
Average fertility rate in Allen County is 67.0 births per 1,000 women. Women in the age bracket of 20 to 34 years have the highest fertility rate with 90.0 births per 1,000 women. Women in the age bracket of 20 to 34 years acount for 58.1% of all women with births.
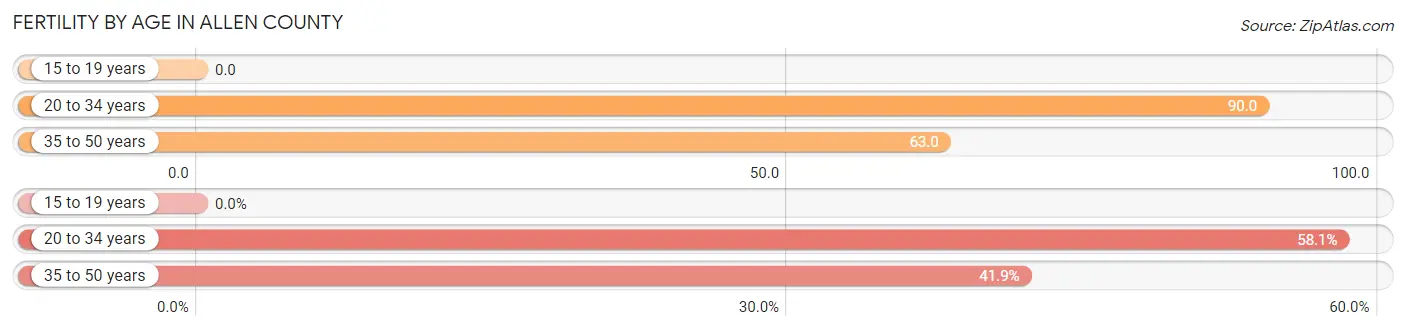
| Age Bracket | Women with Births | Births / 1,000 Women |
| 15 to 19 years | 0 (0.0%) | 0.0 |
| 20 to 34 years | 176 (58.1%) | 90.0 |
| 35 to 50 years | 127 (41.9%) | 63.0 |
| Total | 303 (100.0%) | 67.0 |
Fertility by Age by Marriage Status in Allen County
71.9% of women with births (303) in Allen County are married. The highest percentage of unmarried women with births falls into 20 to 34 years age bracket with 48.3% of them unmarried at the time of birth, while the lowest percentage of unmarried women with births belong to 35 to 50 years age bracket with 0.0% of them unmarried.
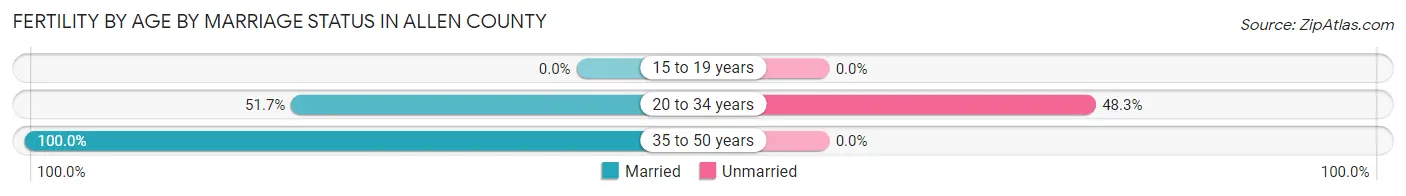
| Age Bracket | Married | Unmarried |
| 15 to 19 years | 0 (0.0%) | 0 (0.0%) |
| 20 to 34 years | 91 (51.7%) | 85 (48.3%) |
| 35 to 50 years | 127 (100.0%) | 0 (0.0%) |
| Total | 218 (72.0%) | 85 (28.1%) |
Fertility by Education in Allen County
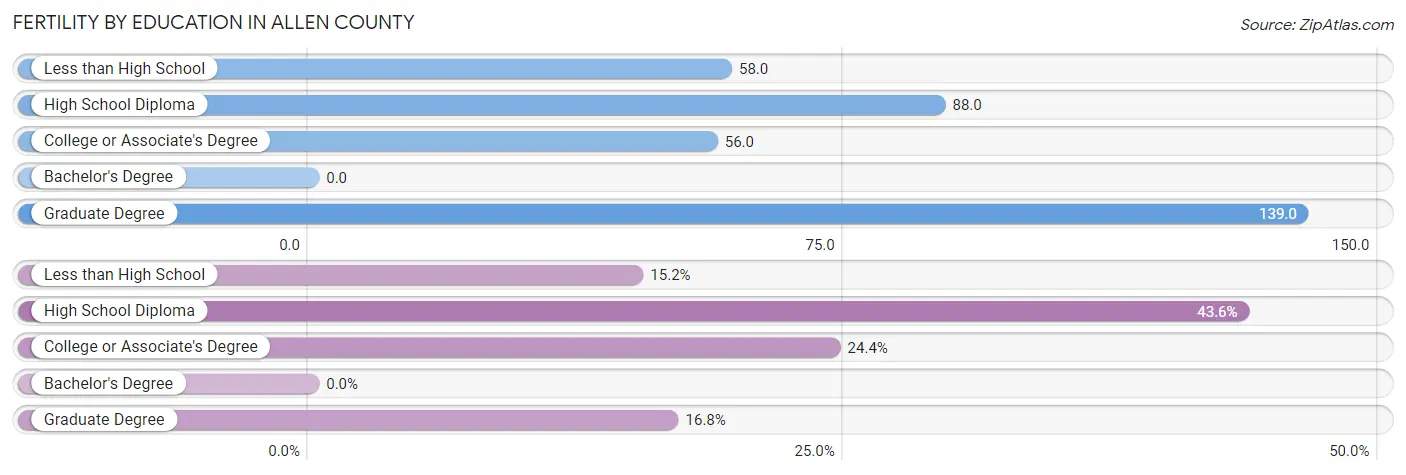
| Educational Attainment | Women with Births | Births / 1,000 Women |
| Less than High School | 46 (15.2%) | 58.0 |
| High School Diploma | 132 (43.6%) | 88.0 |
| College or Associate's Degree | 74 (24.4%) | 56.0 |
| Bachelor's Degree | 0 (0.0%) | 0.0 |
| Graduate Degree | 51 (16.8%) | 139.0 |
| Total | 303 (100.0%) | 67.0 |
Fertility by Education by Marriage Status in Allen County
28.1% of women with births in Allen County are unmarried. Women with the educational attainment of graduate degree are most likely to be married with 100.0% of them married at childbirth, while women with the educational attainment of college or associate's degree are least likely to be married with 66.2% of them unmarried at childbirth.
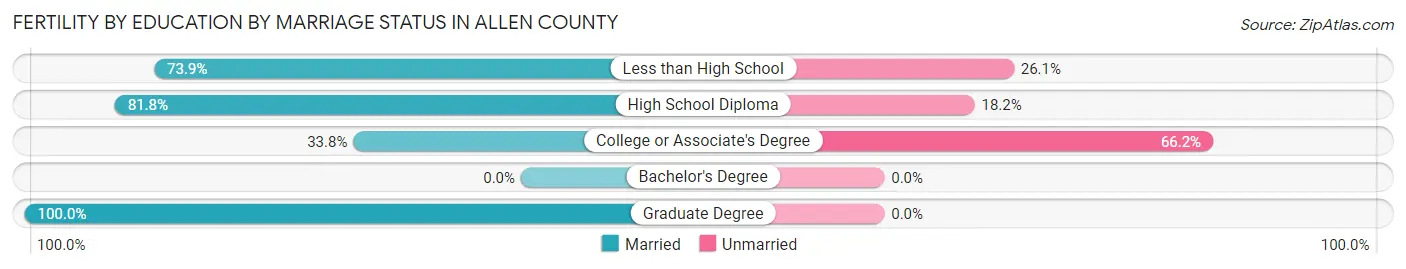
| Educational Attainment | Married | Unmarried |
| Less than High School | 34 (73.9%) | 12 (26.1%) |
| High School Diploma | 108 (81.8%) | 24 (18.2%) |
| College or Associate's Degree | 25 (33.8%) | 49 (66.2%) |
| Bachelor's Degree | 0 (0.0%) | 0 (0.0%) |
| Graduate Degree | 51 (100.0%) | 0 (0.0%) |
| Total | 218 (72.0%) | 85 (28.1%) |
Employment Characteristics in Allen County
Employment by Class of Employer in Allen County
Among the 8,711 employed individuals in Allen County, private company employees (5,919 | 67.9%), self-employed (not incorporated) (721 | 8.3%), and local government employees (707 | 8.1%) make up the most common classes of employment.
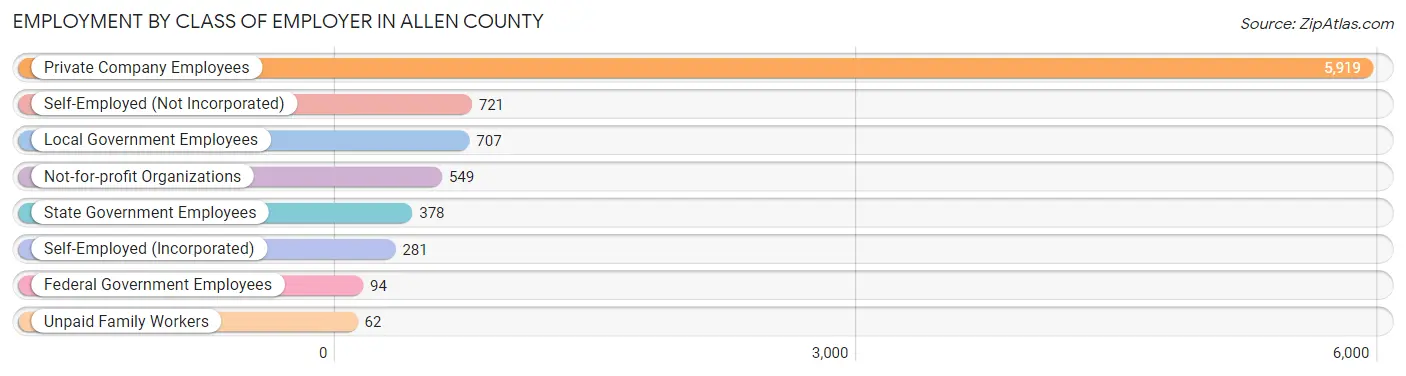
| Employer Class | # Employees | % Employees |
| Private Company Employees | 5,919 | 67.9% |
| Self-Employed (Incorporated) | 281 | 3.2% |
| Self-Employed (Not Incorporated) | 721 | 8.3% |
| Not-for-profit Organizations | 549 | 6.3% |
| Local Government Employees | 707 | 8.1% |
| State Government Employees | 378 | 4.3% |
| Federal Government Employees | 94 | 1.1% |
| Unpaid Family Workers | 62 | 0.7% |
| Total | 8,711 | 100.0% |
Employment Status by Age in Allen County
According to the labor force statistics for Allen County, out of the total population over 16 years of age (16,412), 58.6% or 9,617 individuals are in the labor force, with 7.3% or 702 of them unemployed. The age group with the highest labor force participation rate is 25 to 29 years, with 86.2% or 1,153 individuals in the labor force. Within the labor force, the 35 to 44 years age range has the highest percentage of unemployed individuals, with 14.5% or 292 of them being unemployed.
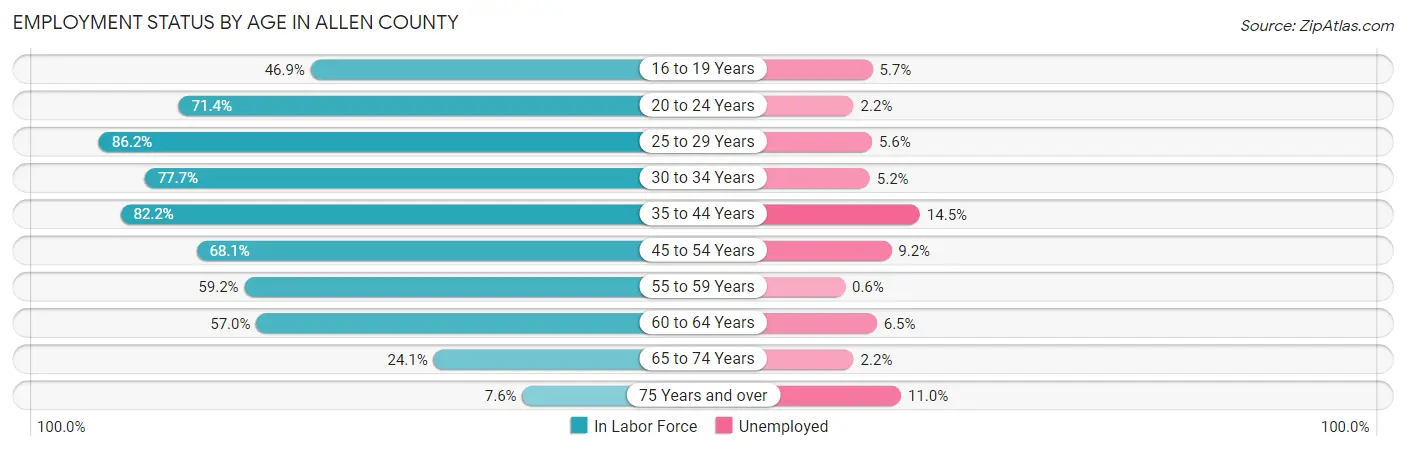
| Age Bracket | In Labor Force | Unemployed |
| 16 to 19 Years | 385 (46.9%) | 22 (5.7%) |
| 20 to 24 Years | 869 (71.4%) | 19 (2.2%) |
| 25 to 29 Years | 1,153 (86.2%) | 65 (5.6%) |
| 30 to 34 Years | 1,012 (77.7%) | 53 (5.2%) |
| 35 to 44 Years | 2,015 (82.2%) | 292 (14.5%) |
| 45 to 54 Years | 1,860 (68.1%) | 171 (9.2%) |
| 55 to 59 Years | 823 (59.2%) | 5 (0.6%) |
| 60 to 64 Years | 856 (57.0%) | 56 (6.5%) |
| 65 to 74 Years | 535 (24.1%) | 12 (2.2%) |
| 75 Years and over | 109 (7.6%) | 12 (11.0%) |
| Total | 9,617 (58.6%) | 702 (7.3%) |
Employment Status by Educational Attainment in Allen County
According to labor force statistics for Allen County, 72.0% of individuals (7,714) out of the total population between 25 and 64 years of age (10,714) are in the labor force, with 8.3% or 640 of them being unemployed. The group with the highest labor force participation rate are those with the educational attainment of bachelor's degree or higher, with 87.0% or 1,710 individuals in the labor force. Within the labor force, individuals with college / associate degree education have the highest percentage of unemployment, with 14.8% or 387 of them being unemployed.
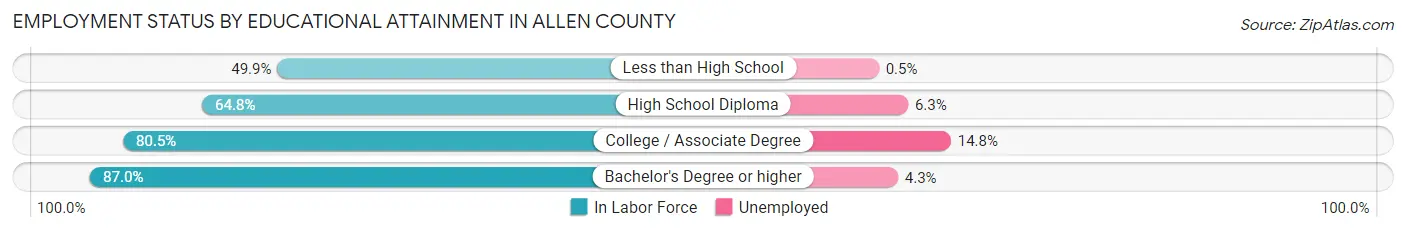
| Educational Attainment | In Labor Force | Unemployed |
| Less than High School | 582 (49.9%) | 6 (0.5%) |
| High School Diploma | 2,808 (64.8%) | 273 (6.3%) |
| College / Associate Degree | 2,615 (80.5%) | 481 (14.8%) |
| Bachelor's Degree or higher | 1,710 (87.0%) | 84 (4.3%) |
| Total | 7,714 (72.0%) | 889 (8.3%) |
Employment Occupations by Sex in Allen County
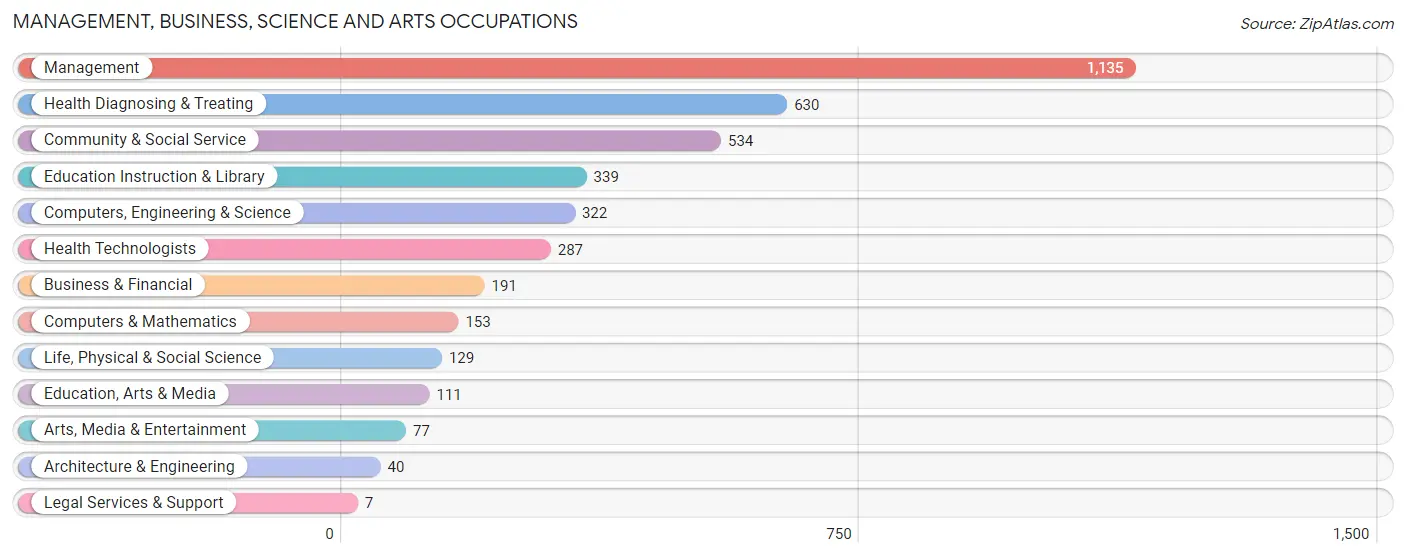
Management, Business, Science and Arts Occupations
The most common Management, Business, Science and Arts occupations in Allen County are Management (1,135 | 12.8%), Health Diagnosing & Treating (630 | 7.1%), Community & Social Service (534 | 6.0%), Education Instruction & Library (339 | 3.8%), and Computers, Engineering & Science (322 | 3.6%).
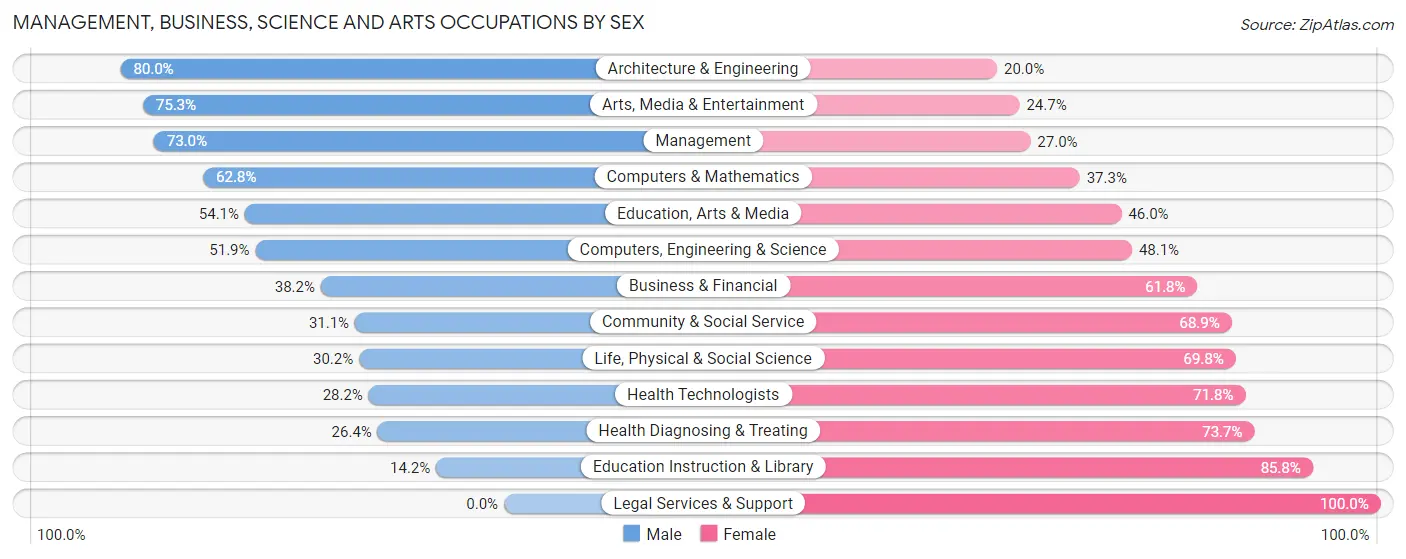
Management, Business, Science and Arts Occupations by Sex
Within the Management, Business, Science and Arts occupations in Allen County, the most male-oriented occupations are Architecture & Engineering (80.0%), Arts, Media & Entertainment (75.3%), and Management (73.0%), while the most female-oriented occupations are Legal Services & Support (100.0%), Education Instruction & Library (85.8%), and Health Diagnosing & Treating (73.7%).
| Occupation | Male | Female |
| Management | 829 (73.0%) | 306 (27.0%) |
| Business & Financial | 73 (38.2%) | 118 (61.8%) |
| Computers, Engineering & Science | 167 (51.9%) | 155 (48.1%) |
| Computers & Mathematics | 96 (62.7%) | 57 (37.2%) |
| Architecture & Engineering | 32 (80.0%) | 8 (20.0%) |
| Life, Physical & Social Science | 39 (30.2%) | 90 (69.8%) |
| Community & Social Service | 166 (31.1%) | 368 (68.9%) |
| Education, Arts & Media | 60 (54.0%) | 51 (46.0%) |
| Legal Services & Support | 0 (0.0%) | 7 (100.0%) |
| Education Instruction & Library | 48 (14.2%) | 291 (85.8%) |
| Arts, Media & Entertainment | 58 (75.3%) | 19 (24.7%) |
| Health Diagnosing & Treating | 166 (26.4%) | 464 (73.7%) |
| Health Technologists | 81 (28.2%) | 206 (71.8%) |
| Total (Category) | 1,401 (49.8%) | 1,411 (50.2%) |
| Total (Overall) | 4,740 (53.3%) | 4,150 (46.7%) |
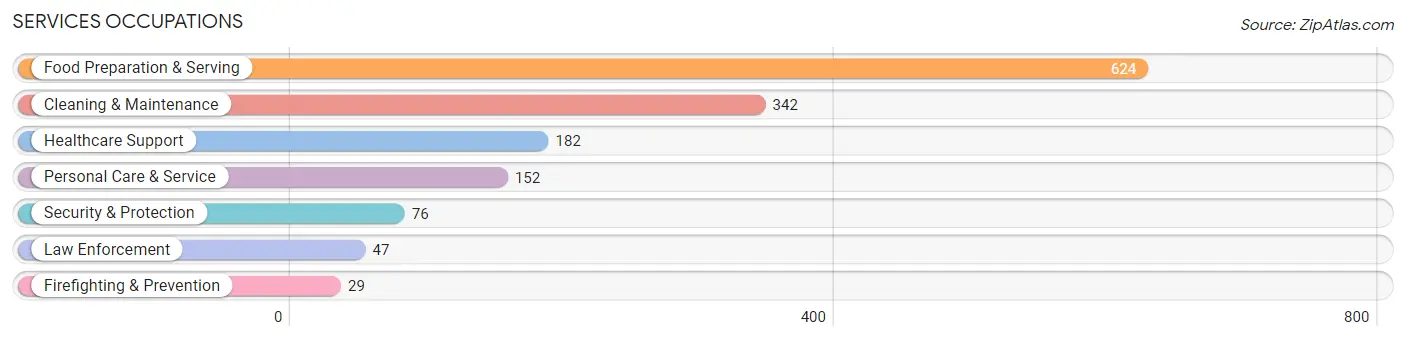
Services Occupations
The most common Services occupations in Allen County are Food Preparation & Serving (624 | 7.0%), Cleaning & Maintenance (342 | 3.8%), Healthcare Support (182 | 2.1%), Personal Care & Service (152 | 1.7%), and Security & Protection (76 | 0.9%).
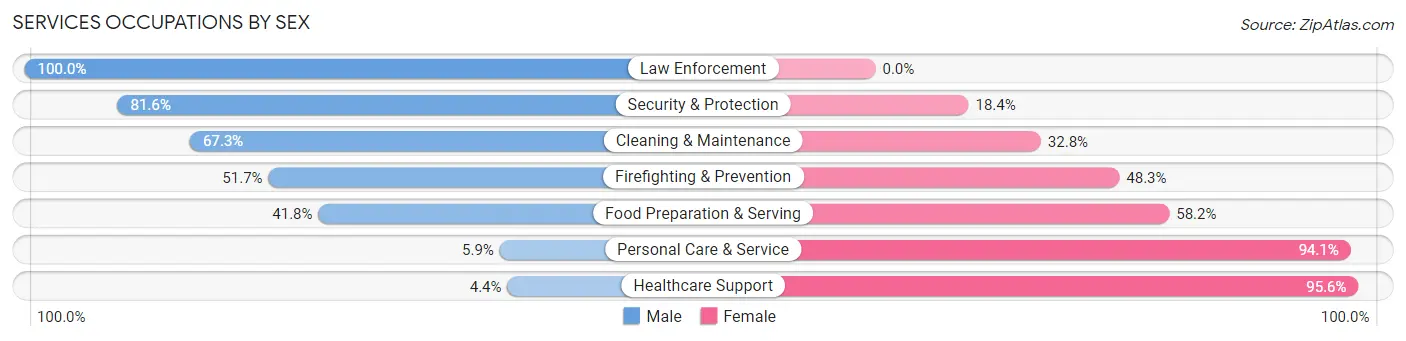
Services Occupations by Sex
Within the Services occupations in Allen County, the most male-oriented occupations are Law Enforcement (100.0%), Security & Protection (81.6%), and Cleaning & Maintenance (67.2%), while the most female-oriented occupations are Healthcare Support (95.6%), Personal Care & Service (94.1%), and Food Preparation & Serving (58.2%).
| Occupation | Male | Female |
| Healthcare Support | 8 (4.4%) | 174 (95.6%) |
| Security & Protection | 62 (81.6%) | 14 (18.4%) |
| Firefighting & Prevention | 15 (51.7%) | 14 (48.3%) |
| Law Enforcement | 47 (100.0%) | 0 (0.0%) |
| Food Preparation & Serving | 261 (41.8%) | 363 (58.2%) |
| Cleaning & Maintenance | 230 (67.2%) | 112 (32.8%) |
| Personal Care & Service | 9 (5.9%) | 143 (94.1%) |
| Total (Category) | 570 (41.4%) | 806 (58.6%) |
| Total (Overall) | 4,740 (53.3%) | 4,150 (46.7%) |
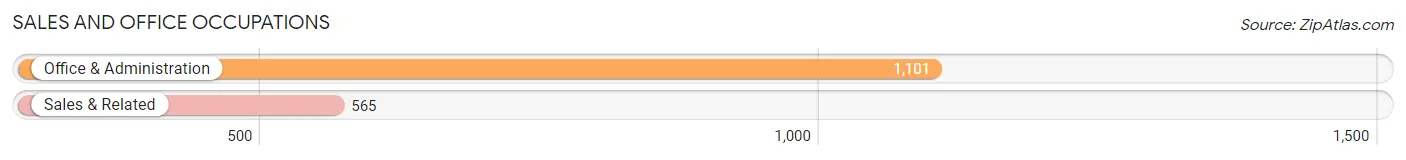
Sales and Office Occupations
The most common Sales and Office occupations in Allen County are Office & Administration (1,101 | 12.4%), and Sales & Related (565 | 6.4%).
Sales and Office Occupations by Sex
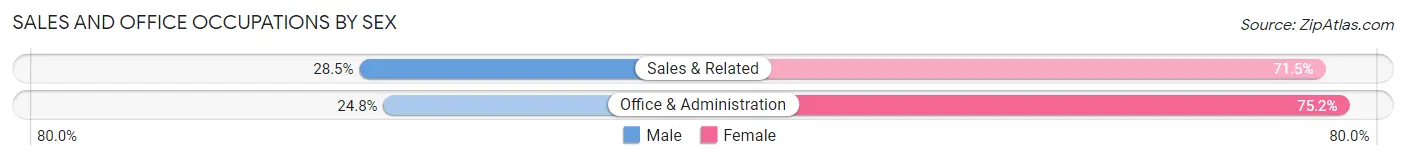
| Occupation | Male | Female |
| Sales & Related | 161 (28.5%) | 404 (71.5%) |
| Office & Administration | 273 (24.8%) | 828 (75.2%) |
| Total (Category) | 434 (26.1%) | 1,232 (74.0%) |
| Total (Overall) | 4,740 (53.3%) | 4,150 (46.7%) |
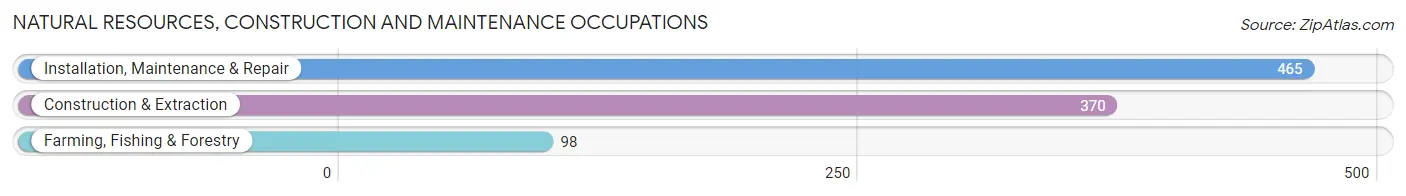
Natural Resources, Construction and Maintenance Occupations
The most common Natural Resources, Construction and Maintenance occupations in Allen County are Installation, Maintenance & Repair (465 | 5.2%), Construction & Extraction (370 | 4.2%), and Farming, Fishing & Forestry (98 | 1.1%).
Natural Resources, Construction and Maintenance Occupations by Sex
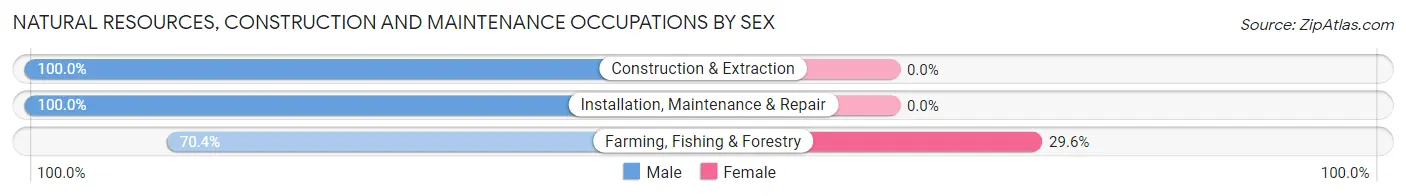
| Occupation | Male | Female |
| Farming, Fishing & Forestry | 69 (70.4%) | 29 (29.6%) |
| Construction & Extraction | 370 (100.0%) | 0 (0.0%) |
| Installation, Maintenance & Repair | 465 (100.0%) | 0 (0.0%) |
| Total (Category) | 904 (96.9%) | 29 (3.1%) |
| Total (Overall) | 4,740 (53.3%) | 4,150 (46.7%) |
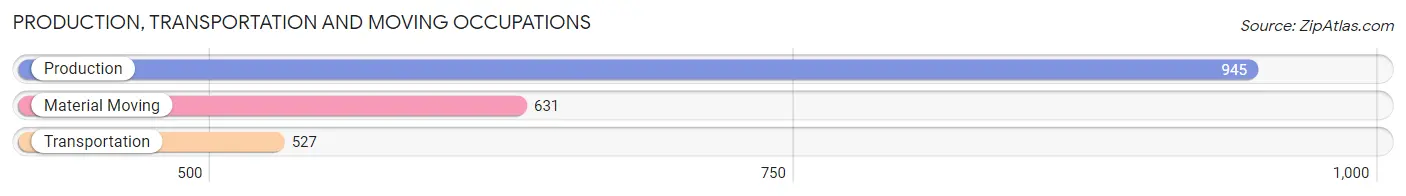
Production, Transportation and Moving Occupations
The most common Production, Transportation and Moving occupations in Allen County are Production (945 | 10.6%), Material Moving (631 | 7.1%), and Transportation (527 | 5.9%).
Production, Transportation and Moving Occupations by Sex
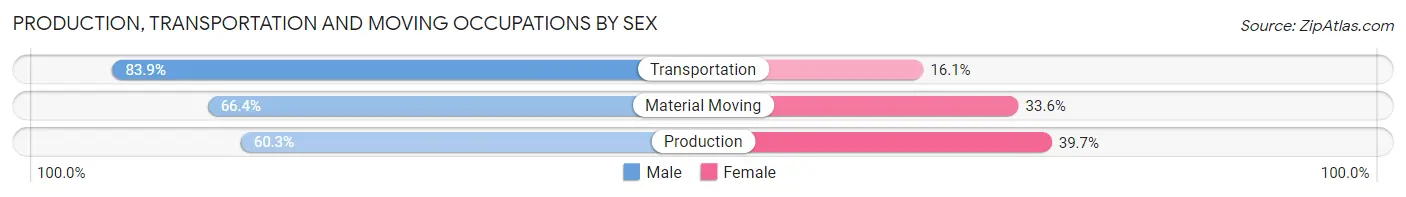
| Occupation | Male | Female |
| Production | 570 (60.3%) | 375 (39.7%) |
| Transportation | 442 (83.9%) | 85 (16.1%) |
| Material Moving | 419 (66.4%) | 212 (33.6%) |
| Total (Category) | 1,431 (68.0%) | 672 (32.0%) |
| Total (Overall) | 4,740 (53.3%) | 4,150 (46.7%) |
Employment Industries by Sex in Allen County
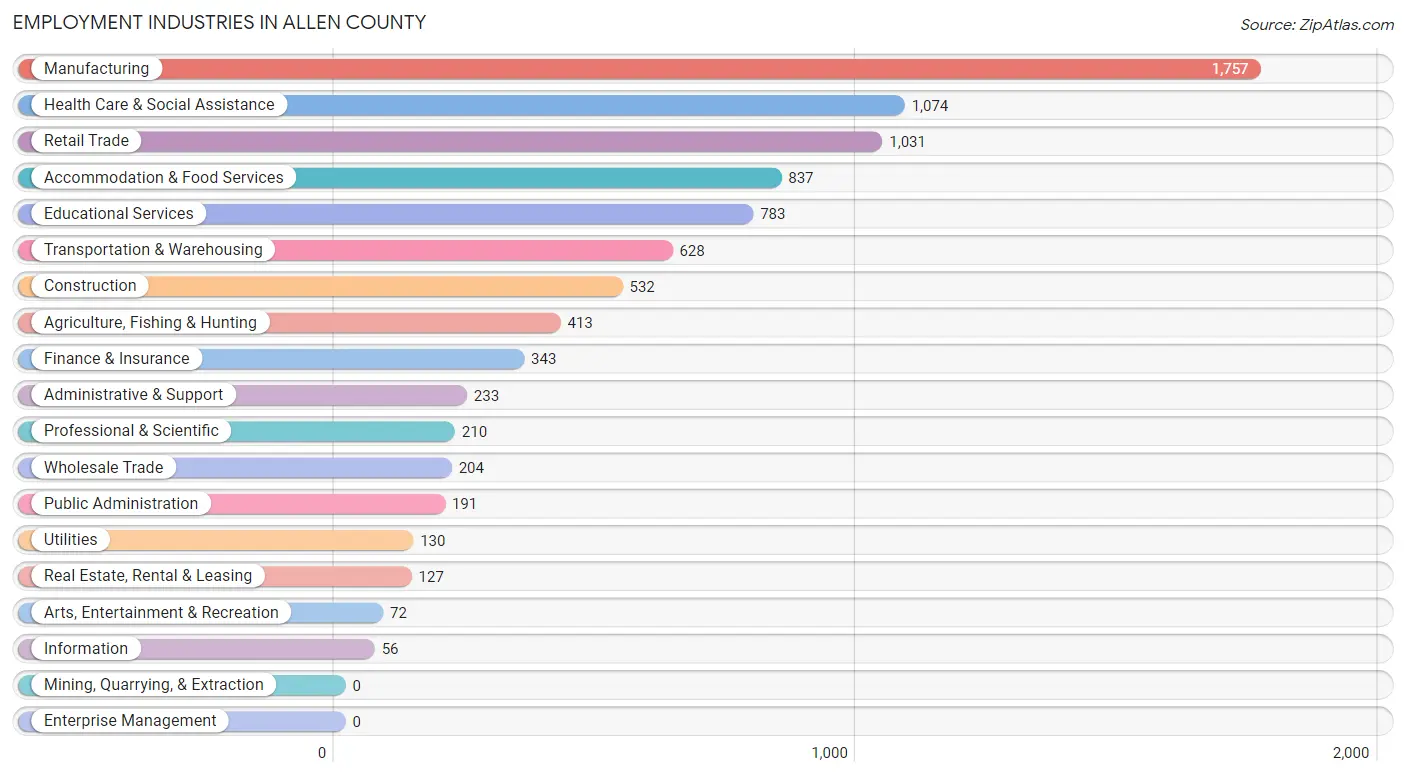
Employment Industries in Allen County
The major employment industries in Allen County include Manufacturing (1,757 | 19.8%), Health Care & Social Assistance (1,074 | 12.1%), Retail Trade (1,031 | 11.6%), Accommodation & Food Services (837 | 9.4%), and Educational Services (783 | 8.8%).
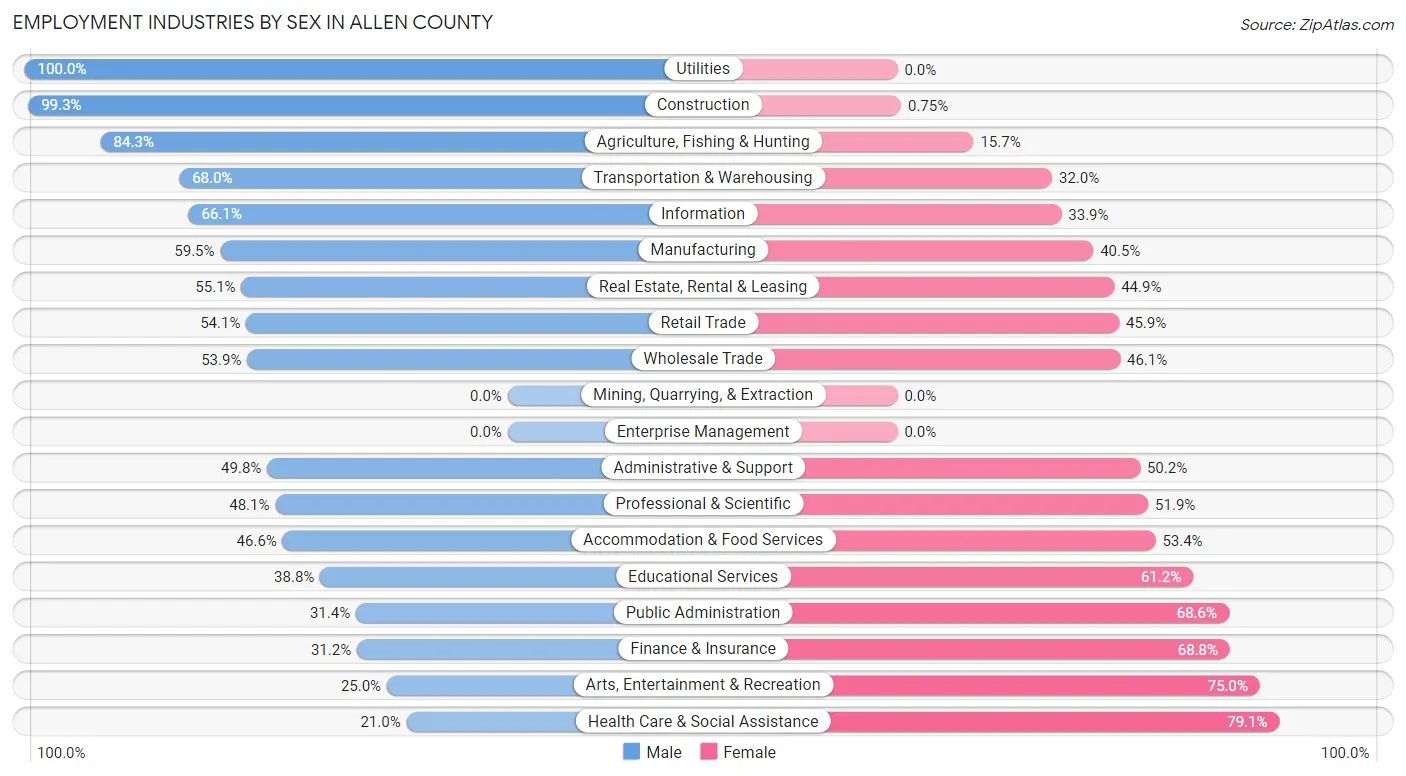
Employment Industries by Sex in Allen County
The Allen County industries that see more men than women are Utilities (100.0%), Construction (99.3%), and Agriculture, Fishing & Hunting (84.3%), whereas the industries that tend to have a higher number of women are Health Care & Social Assistance (79.0%), Arts, Entertainment & Recreation (75.0%), and Finance & Insurance (68.8%).
| Industry | Male | Female |
| Agriculture, Fishing & Hunting | 348 (84.3%) | 65 (15.7%) |
| Mining, Quarrying, & Extraction | 0 (0.0%) | 0 (0.0%) |
| Construction | 528 (99.3%) | 4 (0.7%) |
| Manufacturing | 1,045 (59.5%) | 712 (40.5%) |
| Wholesale Trade | 110 (53.9%) | 94 (46.1%) |
| Retail Trade | 558 (54.1%) | 473 (45.9%) |
| Transportation & Warehousing | 427 (68.0%) | 201 (32.0%) |
| Utilities | 130 (100.0%) | 0 (0.0%) |
| Information | 37 (66.1%) | 19 (33.9%) |
| Finance & Insurance | 107 (31.2%) | 236 (68.8%) |
| Real Estate, Rental & Leasing | 70 (55.1%) | 57 (44.9%) |
| Professional & Scientific | 101 (48.1%) | 109 (51.9%) |
| Enterprise Management | 0 (0.0%) | 0 (0.0%) |
| Administrative & Support | 116 (49.8%) | 117 (50.2%) |
| Educational Services | 304 (38.8%) | 479 (61.2%) |
| Health Care & Social Assistance | 225 (20.9%) | 849 (79.0%) |
| Arts, Entertainment & Recreation | 18 (25.0%) | 54 (75.0%) |
| Accommodation & Food Services | 390 (46.6%) | 447 (53.4%) |
| Public Administration | 60 (31.4%) | 131 (68.6%) |
| Total | 4,740 (53.3%) | 4,150 (46.7%) |
Education in Allen County
School Enrollment in Allen County
The most common levels of schooling among the 4,256 students in Allen County are elementary school (1,317 | 30.9%), middle school (1,031 | 24.2%), and high school (876 | 20.6%).
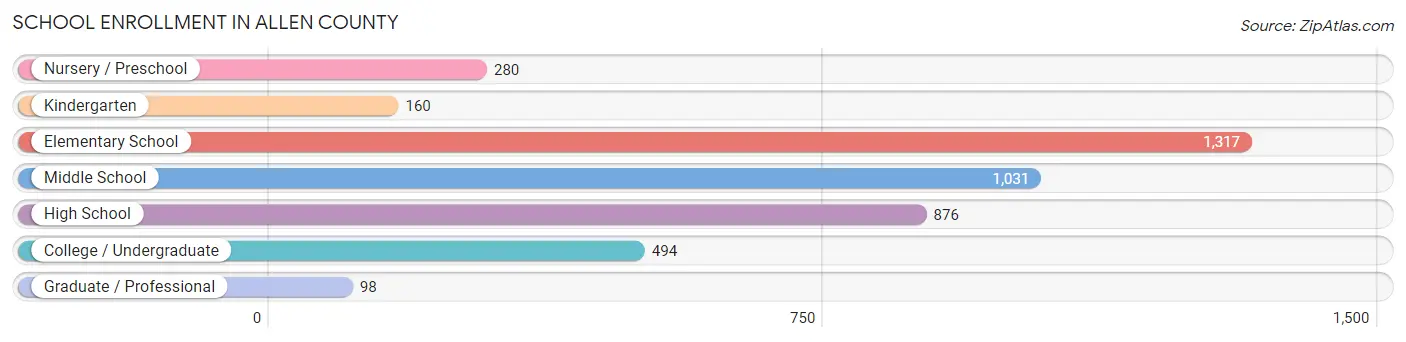
| School Level | # Students | % Students |
| Nursery / Preschool | 280 | 6.6% |
| Kindergarten | 160 | 3.8% |
| Elementary School | 1,317 | 30.9% |
| Middle School | 1,031 | 24.2% |
| High School | 876 | 20.6% |
| College / Undergraduate | 494 | 11.6% |
| Graduate / Professional | 98 | 2.3% |
| Total | 4,256 | 100.0% |
School Enrollment by Age by Funding Source in Allen County
Out of a total of 4,256 students who are enrolled in schools in Allen County, 958 (22.5%) attend a private institution, while the remaining 3,298 (77.5%) are enrolled in public schools. The age group of 3 to 4 year olds has the highest likelihood of being enrolled in private schools, with 81 (52.9% in the age bracket) enrolled. Conversely, the age group of 10 to 14 year olds has the lowest likelihood of being enrolled in a private school, with 1,047 (89.2% in the age bracket) attending a public institution.
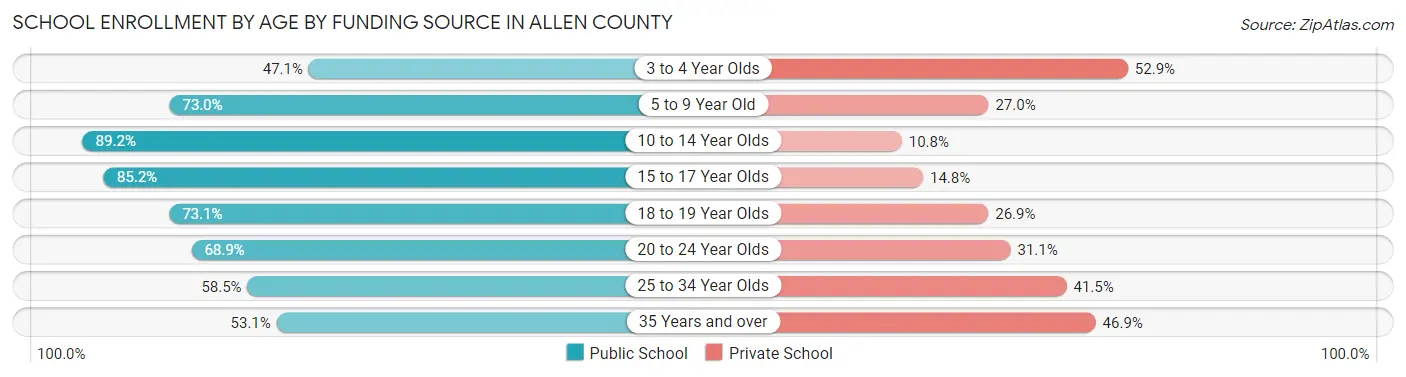
| Age Bracket | Public School | Private School |
| 3 to 4 Year Olds | 72 (47.1%) | 81 (52.9%) |
| 5 to 9 Year Old | 1,059 (73.0%) | 391 (27.0%) |
| 10 to 14 Year Olds | 1,047 (89.2%) | 127 (10.8%) |
| 15 to 17 Year Olds | 663 (85.2%) | 115 (14.8%) |
| 18 to 19 Year Olds | 141 (73.1%) | 52 (26.9%) |
| 20 to 24 Year Olds | 173 (68.9%) | 78 (31.1%) |
| 25 to 34 Year Olds | 93 (58.5%) | 66 (41.5%) |
| 35 Years and over | 52 (53.1%) | 46 (46.9%) |
| Total | 3,298 (77.5%) | 958 (22.5%) |
Educational Attainment by Field of Study in Allen County
Education (636 | 21.3%), science & technology (455 | 15.3%), business (377 | 12.6%), bio, nature & agricultural (293 | 9.8%), and psychology (232 | 7.8%) are the most common fields of study among 2,982 individuals in Allen County who have obtained a bachelor's degree or higher.
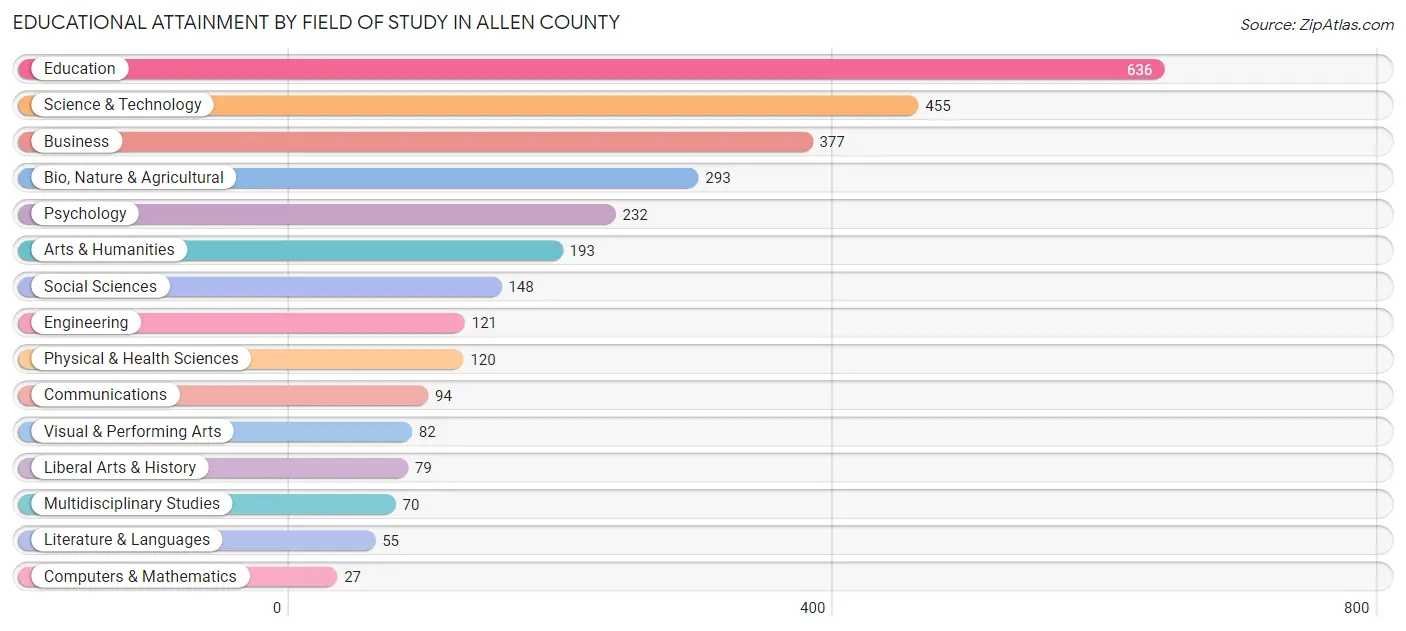
| Field of Study | # Graduates | % Graduates |
| Computers & Mathematics | 27 | 0.9% |
| Bio, Nature & Agricultural | 293 | 9.8% |
| Physical & Health Sciences | 120 | 4.0% |
| Psychology | 232 | 7.8% |
| Social Sciences | 148 | 5.0% |
| Engineering | 121 | 4.1% |
| Multidisciplinary Studies | 70 | 2.4% |
| Science & Technology | 455 | 15.3% |
| Business | 377 | 12.6% |
| Education | 636 | 21.3% |
| Literature & Languages | 55 | 1.8% |
| Liberal Arts & History | 79 | 2.6% |
| Visual & Performing Arts | 82 | 2.8% |
| Communications | 94 | 3.2% |
| Arts & Humanities | 193 | 6.5% |
| Total | 2,982 | 100.0% |
Transportation & Commute in Allen County
Vehicle Availability by Sex in Allen County
The most prevalent vehicle ownership categories in Allen County are males with 2 vehicles (1,750, accounting for 37.7%) and females with 2 vehicles (1,420, making up 43.1%).
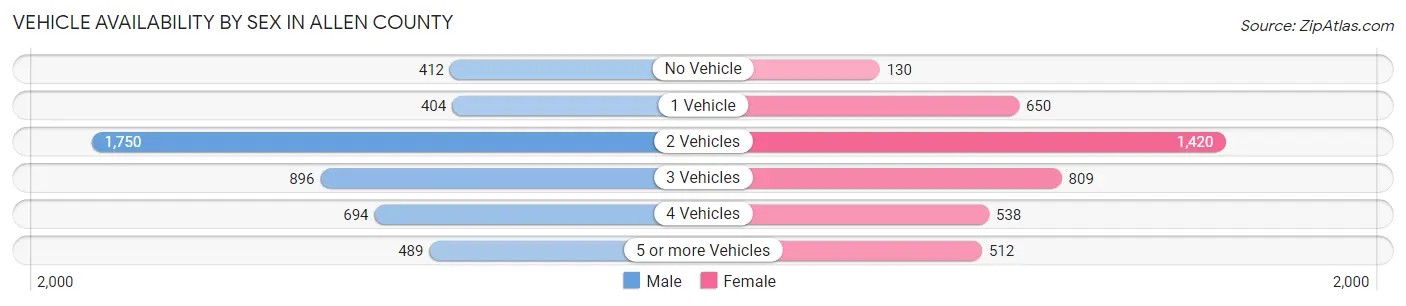
| Vehicles Available | Male | Female |
| No Vehicle | 412 (8.9%) | 130 (3.2%) |
| 1 Vehicle | 404 (8.7%) | 650 (16.0%) |
| 2 Vehicles | 1,750 (37.7%) | 1,420 (35.0%) |
| 3 Vehicles | 896 (19.3%) | 809 (19.9%) |
| 4 Vehicles | 694 (14.9%) | 538 (13.3%) |
| 5 or more Vehicles | 489 (10.5%) | 512 (12.6%) |
| Total | 4,645 (100.0%) | 4,059 (100.0%) |
Commute Time in Allen County
The most frequently occuring commute durations in Allen County are 5 to 9 minutes (1,123 commuters, 14.1%), 15 to 19 minutes (988 commuters, 12.4%), and 30 to 34 minutes (933 commuters, 11.7%).
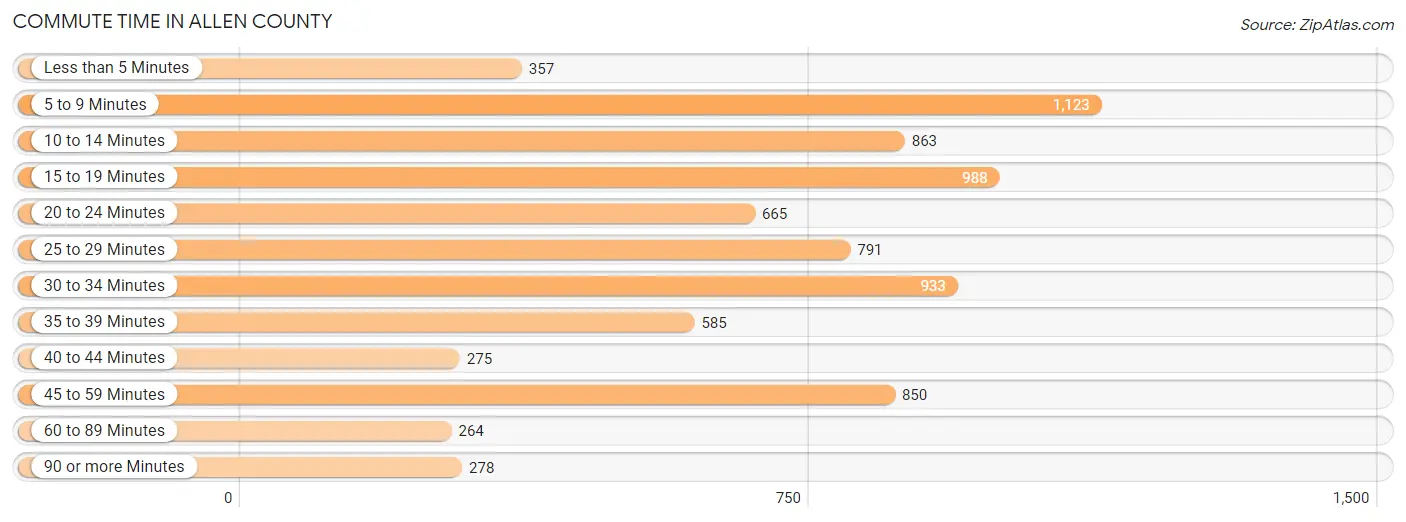
| Commute Time | # Commuters | % Commuters |
| Less than 5 Minutes | 357 | 4.5% |
| 5 to 9 Minutes | 1,123 | 14.1% |
| 10 to 14 Minutes | 863 | 10.8% |
| 15 to 19 Minutes | 988 | 12.4% |
| 20 to 24 Minutes | 665 | 8.3% |
| 25 to 29 Minutes | 791 | 9.9% |
| 30 to 34 Minutes | 933 | 11.7% |
| 35 to 39 Minutes | 585 | 7.3% |
| 40 to 44 Minutes | 275 | 3.5% |
| 45 to 59 Minutes | 850 | 10.7% |
| 60 to 89 Minutes | 264 | 3.3% |
| 90 or more Minutes | 278 | 3.5% |
Commute Time by Sex in Allen County
The most common commute times in Allen County are 30 to 34 minutes (706 commuters, 16.4%) for males and 5 to 9 minutes (612 commuters, 16.6%) for females.
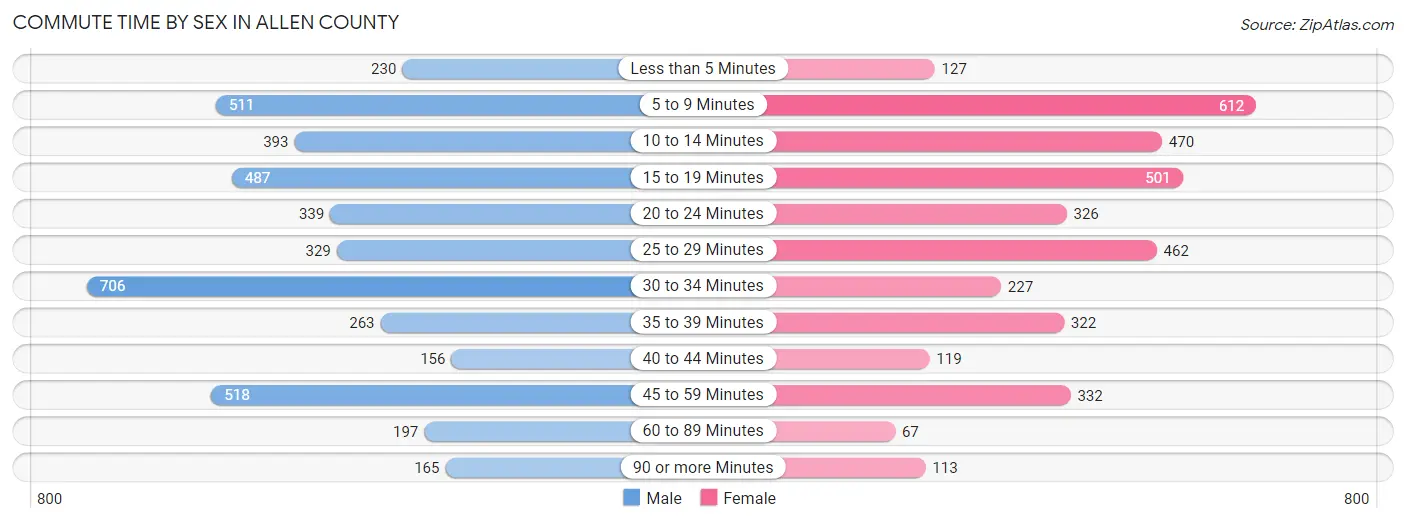
| Commute Time | Male | Female |
| Less than 5 Minutes | 230 (5.4%) | 127 (3.5%) |
| 5 to 9 Minutes | 511 (11.9%) | 612 (16.6%) |
| 10 to 14 Minutes | 393 (9.1%) | 470 (12.8%) |
| 15 to 19 Minutes | 487 (11.3%) | 501 (13.6%) |
| 20 to 24 Minutes | 339 (7.9%) | 326 (8.9%) |
| 25 to 29 Minutes | 329 (7.7%) | 462 (12.6%) |
| 30 to 34 Minutes | 706 (16.4%) | 227 (6.2%) |
| 35 to 39 Minutes | 263 (6.1%) | 322 (8.7%) |
| 40 to 44 Minutes | 156 (3.6%) | 119 (3.2%) |
| 45 to 59 Minutes | 518 (12.1%) | 332 (9.0%) |
| 60 to 89 Minutes | 197 (4.6%) | 67 (1.8%) |
| 90 or more Minutes | 165 (3.8%) | 113 (3.1%) |
Time of Departure to Work by Sex in Allen County
The most frequent times of departure to work in Allen County are 6:00 AM to 6:29 AM (752, 17.5%) for males and 7:00 AM to 7:29 AM (557, 15.1%) for females.
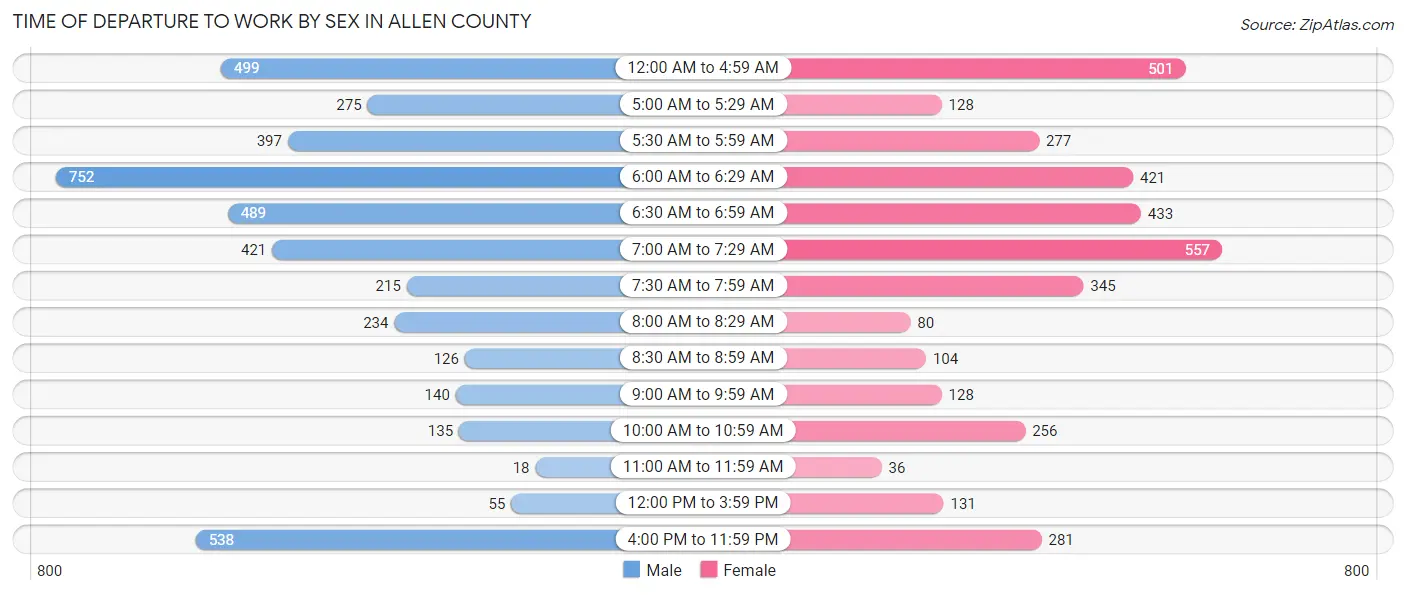
| Time of Departure | Male | Female |
| 12:00 AM to 4:59 AM | 499 (11.6%) | 501 (13.6%) |
| 5:00 AM to 5:29 AM | 275 (6.4%) | 128 (3.5%) |
| 5:30 AM to 5:59 AM | 397 (9.2%) | 277 (7.5%) |
| 6:00 AM to 6:29 AM | 752 (17.5%) | 421 (11.5%) |
| 6:30 AM to 6:59 AM | 489 (11.4%) | 433 (11.8%) |
| 7:00 AM to 7:29 AM | 421 (9.8%) | 557 (15.1%) |
| 7:30 AM to 7:59 AM | 215 (5.0%) | 345 (9.4%) |
| 8:00 AM to 8:29 AM | 234 (5.4%) | 80 (2.2%) |
| 8:30 AM to 8:59 AM | 126 (2.9%) | 104 (2.8%) |
| 9:00 AM to 9:59 AM | 140 (3.3%) | 128 (3.5%) |
| 10:00 AM to 10:59 AM | 135 (3.1%) | 256 (7.0%) |
| 11:00 AM to 11:59 AM | 18 (0.4%) | 36 (1.0%) |
| 12:00 PM to 3:59 PM | 55 (1.3%) | 131 (3.6%) |
| 4:00 PM to 11:59 PM | 538 (12.5%) | 281 (7.6%) |
| Total | 4,294 (100.0%) | 3,678 (100.0%) |
Housing Occupancy in Allen County
Occupancy by Ownership in Allen County
Of the total 7,816 dwellings in Allen County, owner-occupied units account for 6,014 (76.9%), while renter-occupied units make up 1,802 (23.1%).
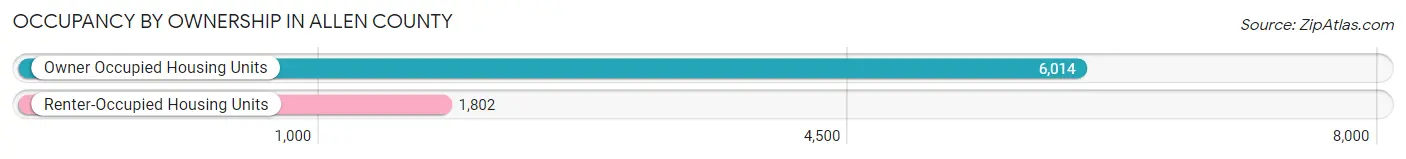
| Occupancy | # Housing Units | % Housing Units |
| Owner Occupied Housing Units | 6,014 | 76.9% |
| Renter-Occupied Housing Units | 1,802 | 23.1% |
| Total Occupied Housing Units | 7,816 | 100.0% |
Occupancy by Household Size in Allen County
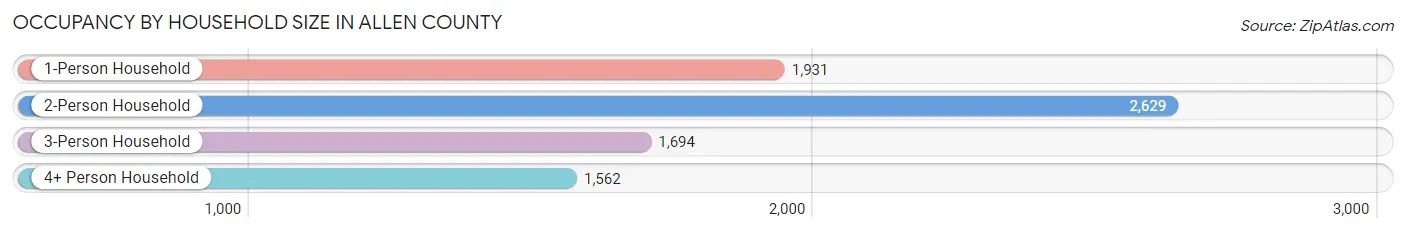
| Household Size | # Housing Units | % Housing Units |
| 1-Person Household | 1,931 | 24.7% |
| 2-Person Household | 2,629 | 33.6% |
| 3-Person Household | 1,694 | 21.7% |
| 4+ Person Household | 1,562 | 20.0% |
| Total Housing Units | 7,816 | 100.0% |
Occupancy by Ownership by Household Size in Allen County
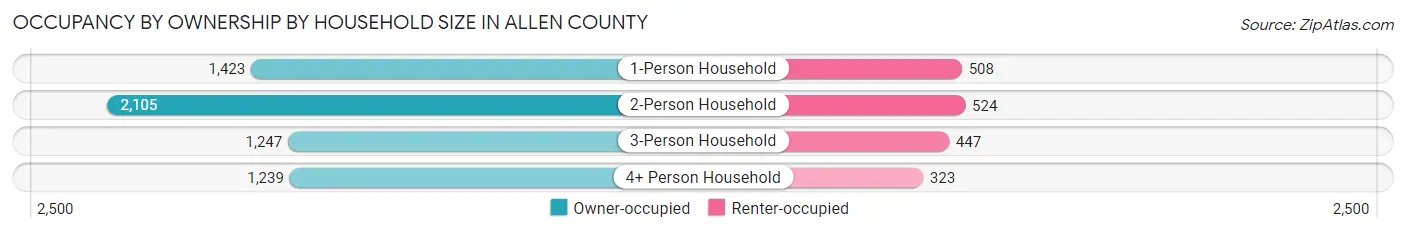
| Household Size | Owner-occupied | Renter-occupied |
| 1-Person Household | 1,423 (73.7%) | 508 (26.3%) |
| 2-Person Household | 2,105 (80.1%) | 524 (19.9%) |
| 3-Person Household | 1,247 (73.6%) | 447 (26.4%) |
| 4+ Person Household | 1,239 (79.3%) | 323 (20.7%) |
| Total Housing Units | 6,014 (76.9%) | 1,802 (23.1%) |
Occupancy by Educational Attainment in Allen County
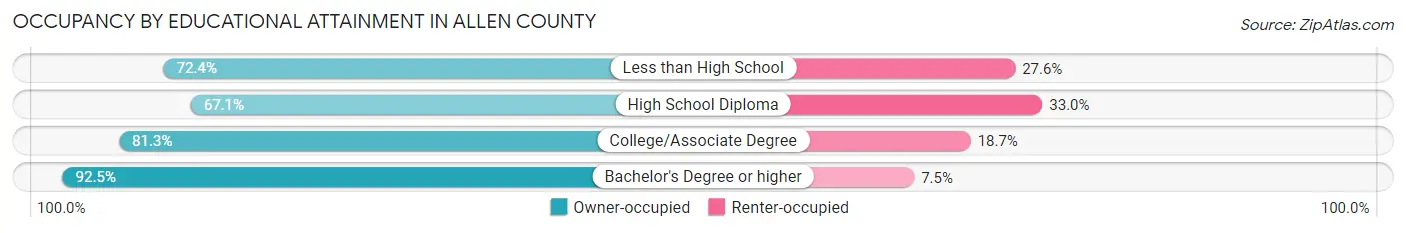
| Household Size | Owner-occupied | Renter-occupied |
| Less than High School | 749 (72.4%) | 285 (27.6%) |
| High School Diploma | 1,911 (67.0%) | 939 (33.0%) |
| College/Associate Degree | 2,042 (81.3%) | 471 (18.7%) |
| Bachelor's Degree or higher | 1,312 (92.5%) | 107 (7.5%) |
Occupancy by Age of Householder in Allen County
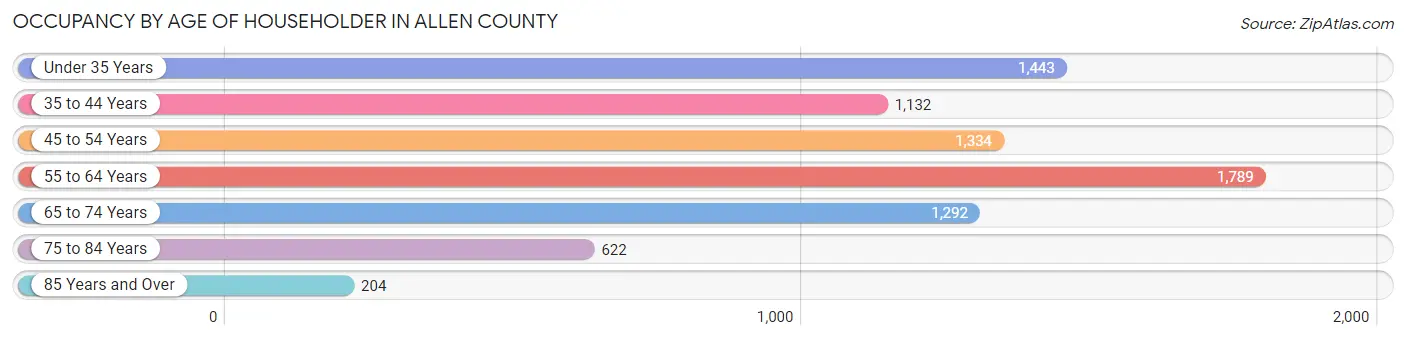
| Age Bracket | # Households | % Households |
| Under 35 Years | 1,443 | 18.5% |
| 35 to 44 Years | 1,132 | 14.5% |
| 45 to 54 Years | 1,334 | 17.1% |
| 55 to 64 Years | 1,789 | 22.9% |
| 65 to 74 Years | 1,292 | 16.5% |
| 75 to 84 Years | 622 | 8.0% |
| 85 Years and Over | 204 | 2.6% |
| Total | 7,816 | 100.0% |
Housing Finances in Allen County
Median Income by Occupancy in Allen County
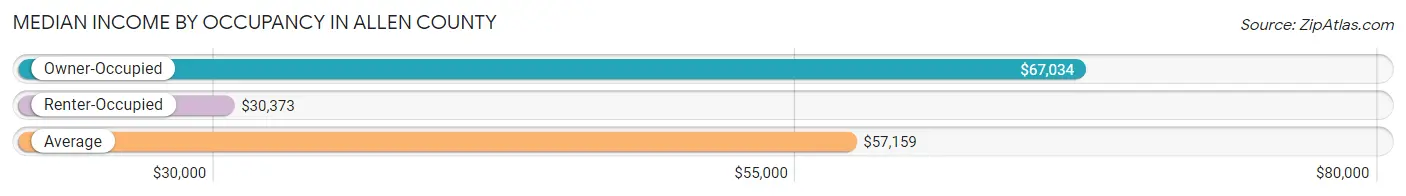
| Occupancy Type | # Households | Median Income |
| Owner-Occupied | 6,014 (76.9%) | $67,034 |
| Renter-Occupied | 1,802 (23.1%) | $30,373 |
| Average | 7,816 (100.0%) | $57,159 |
Occupancy by Householder Income Bracket in Allen County
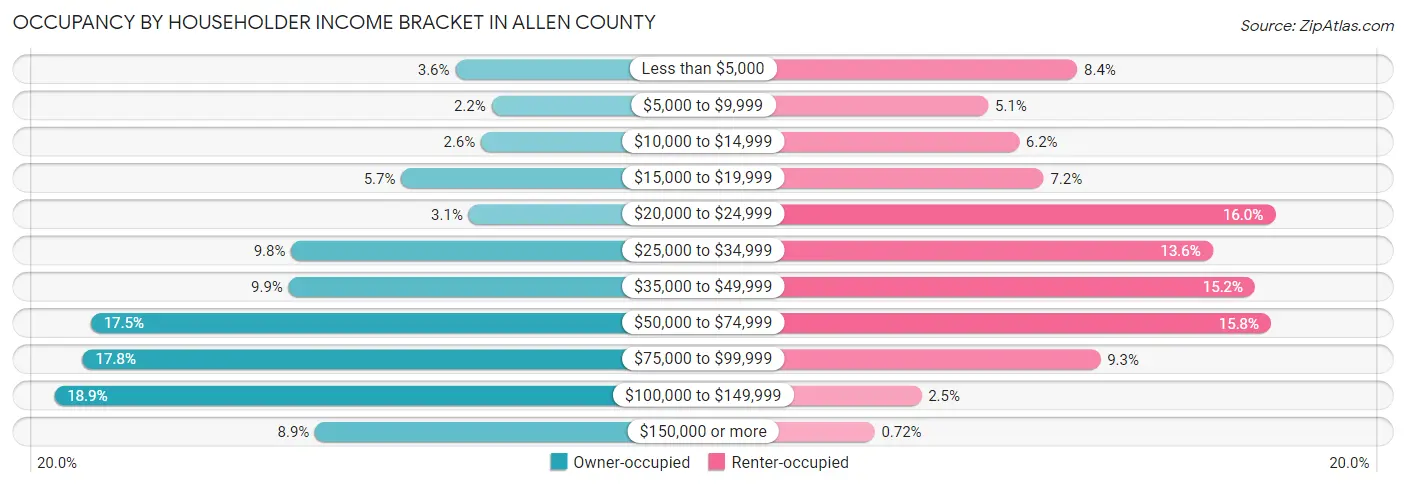
| Income Bracket | Owner-occupied | Renter-occupied |
| Less than $5,000 | 216 (3.6%) | 152 (8.4%) |
| $5,000 to $9,999 | 133 (2.2%) | 91 (5.1%) |
| $10,000 to $14,999 | 157 (2.6%) | 112 (6.2%) |
| $15,000 to $19,999 | 340 (5.7%) | 129 (7.2%) |
| $20,000 to $24,999 | 185 (3.1%) | 288 (16.0%) |
| $25,000 to $34,999 | 592 (9.8%) | 245 (13.6%) |
| $35,000 to $49,999 | 598 (9.9%) | 274 (15.2%) |
| $50,000 to $74,999 | 1,051 (17.5%) | 285 (15.8%) |
| $75,000 to $99,999 | 1,070 (17.8%) | 168 (9.3%) |
| $100,000 to $149,999 | 1,135 (18.9%) | 45 (2.5%) |
| $150,000 or more | 537 (8.9%) | 13 (0.7%) |
| Total | 6,014 (100.0%) | 1,802 (100.0%) |
Monthly Housing Cost Tiers in Allen County
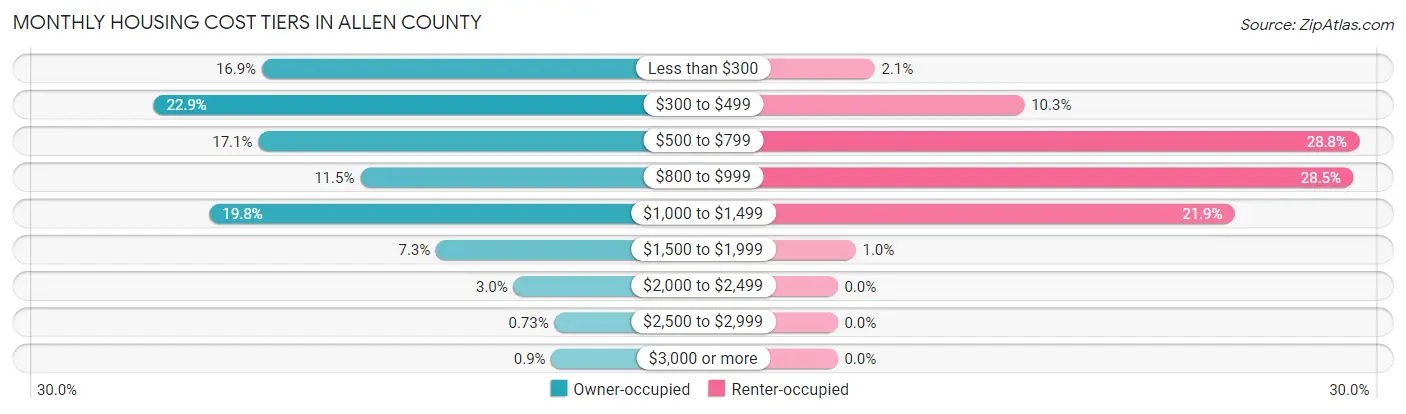
| Monthly Cost | Owner-occupied | Renter-occupied |
| Less than $300 | 1,016 (16.9%) | 37 (2.1%) |
| $300 to $499 | 1,376 (22.9%) | 186 (10.3%) |
| $500 to $799 | 1,028 (17.1%) | 519 (28.8%) |
| $800 to $999 | 689 (11.5%) | 513 (28.5%) |
| $1,000 to $1,499 | 1,190 (19.8%) | 395 (21.9%) |
| $1,500 to $1,999 | 437 (7.3%) | 18 (1.0%) |
| $2,000 to $2,499 | 180 (3.0%) | 0 (0.0%) |
| $2,500 to $2,999 | 44 (0.7%) | 0 (0.0%) |
| $3,000 or more | 54 (0.9%) | 0 (0.0%) |
| Total | 6,014 (100.0%) | 1,802 (100.0%) |
Physical Housing Characteristics in Allen County
Housing Structures in Allen County
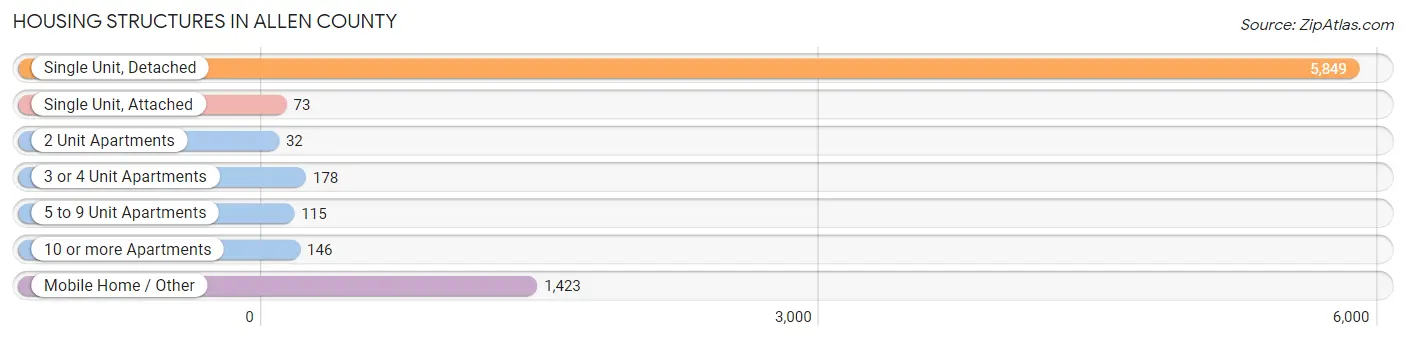
| Structure Type | # Housing Units | % Housing Units |
| Single Unit, Detached | 5,849 | 74.8% |
| Single Unit, Attached | 73 | 0.9% |
| 2 Unit Apartments | 32 | 0.4% |
| 3 or 4 Unit Apartments | 178 | 2.3% |
| 5 to 9 Unit Apartments | 115 | 1.5% |
| 10 or more Apartments | 146 | 1.9% |
| Mobile Home / Other | 1,423 | 18.2% |
| Total | 7,816 | 100.0% |
Housing Structures by Occupancy in Allen County
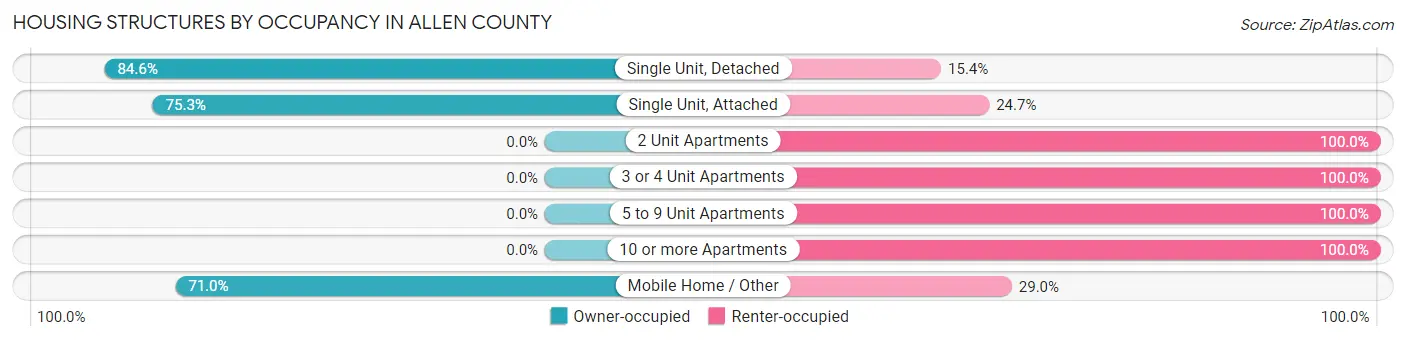
| Structure Type | Owner-occupied | Renter-occupied |
| Single Unit, Detached | 4,949 (84.6%) | 900 (15.4%) |
| Single Unit, Attached | 55 (75.3%) | 18 (24.7%) |
| 2 Unit Apartments | 0 (0.0%) | 32 (100.0%) |
| 3 or 4 Unit Apartments | 0 (0.0%) | 178 (100.0%) |
| 5 to 9 Unit Apartments | 0 (0.0%) | 115 (100.0%) |
| 10 or more Apartments | 0 (0.0%) | 146 (100.0%) |
| Mobile Home / Other | 1,010 (71.0%) | 413 (29.0%) |
| Total | 6,014 (76.9%) | 1,802 (23.1%) |
Housing Structures by Number of Rooms in Allen County
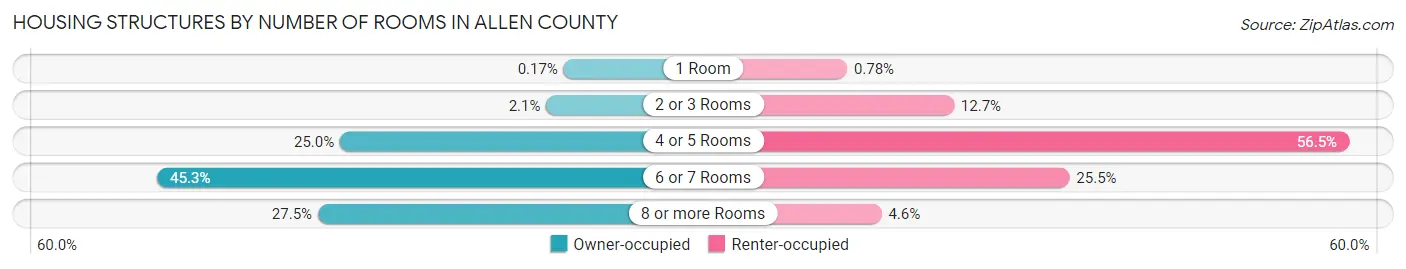
| Number of Rooms | Owner-occupied | Renter-occupied |
| 1 Room | 10 (0.2%) | 14 (0.8%) |
| 2 or 3 Rooms | 126 (2.1%) | 228 (12.7%) |
| 4 or 5 Rooms | 1,503 (25.0%) | 1,018 (56.5%) |
| 6 or 7 Rooms | 2,724 (45.3%) | 459 (25.5%) |
| 8 or more Rooms | 1,651 (27.5%) | 83 (4.6%) |
| Total | 6,014 (100.0%) | 1,802 (100.0%) |
Housing Structure by Heating Type in Allen County
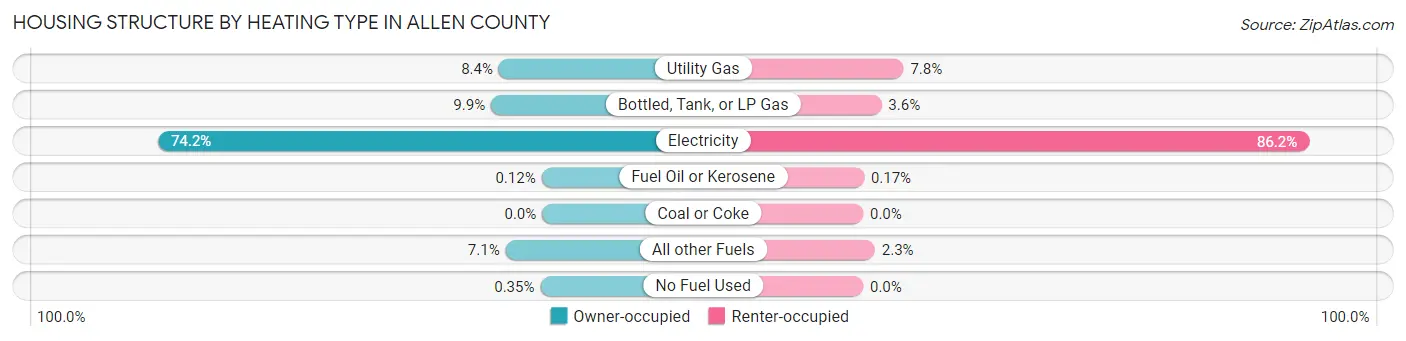
| Heating Type | Owner-occupied | Renter-occupied |
| Utility Gas | 503 (8.4%) | 141 (7.8%) |
| Bottled, Tank, or LP Gas | 594 (9.9%) | 64 (3.5%) |
| Electricity | 4,464 (74.2%) | 1,553 (86.2%) |
| Fuel Oil or Kerosene | 7 (0.1%) | 3 (0.2%) |
| Coal or Coke | 0 (0.0%) | 0 (0.0%) |
| All other Fuels | 425 (7.1%) | 41 (2.3%) |
| No Fuel Used | 21 (0.4%) | 0 (0.0%) |
| Total | 6,014 (100.0%) | 1,802 (100.0%) |
Household Vehicle Usage in Allen County
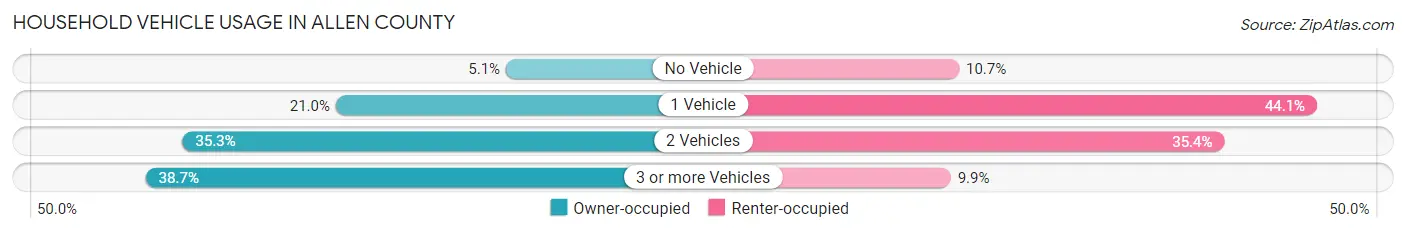
| Vehicles per Household | Owner-occupied | Renter-occupied |
| No Vehicle | 305 (5.1%) | 192 (10.6%) |
| 1 Vehicle | 1,260 (20.9%) | 794 (44.1%) |
| 2 Vehicles | 2,121 (35.3%) | 638 (35.4%) |
| 3 or more Vehicles | 2,328 (38.7%) | 178 (9.9%) |
| Total | 6,014 (100.0%) | 1,802 (100.0%) |
Real Estate & Mortgages in Allen County
Real Estate and Mortgage Overview in Allen County
| Characteristic | Without Mortgage | With Mortgage |
| Housing Units | 3,129 | 2,885 |
| Median Property Value | $154,000 | $168,100 |
| Median Household Income | $49,767 | $336 |
| Monthly Housing Costs | $386 | $54 |
| Real Estate Taxes | $797 | $88 |
Property Value by Mortgage Status in Allen County
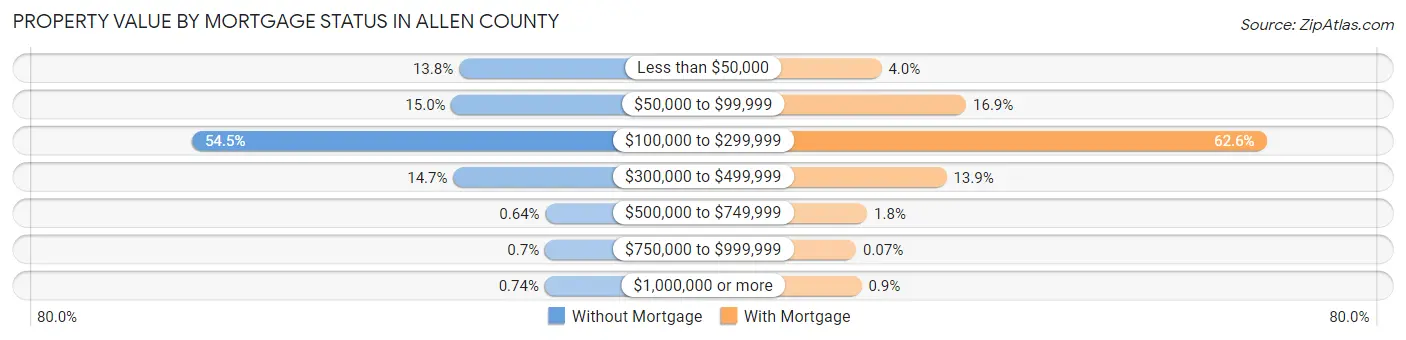
| Property Value | Without Mortgage | With Mortgage |
| Less than $50,000 | 432 (13.8%) | 114 (4.0%) |
| $50,000 to $99,999 | 468 (15.0%) | 486 (16.9%) |
| $100,000 to $299,999 | 1,705 (54.5%) | 1,806 (62.6%) |
| $300,000 to $499,999 | 459 (14.7%) | 400 (13.9%) |
| $500,000 to $749,999 | 20 (0.6%) | 51 (1.8%) |
| $750,000 to $999,999 | 22 (0.7%) | 2 (0.1%) |
| $1,000,000 or more | 23 (0.7%) | 26 (0.9%) |
| Total | 3,129 (100.0%) | 2,885 (100.0%) |
Household Income by Mortgage Status in Allen County
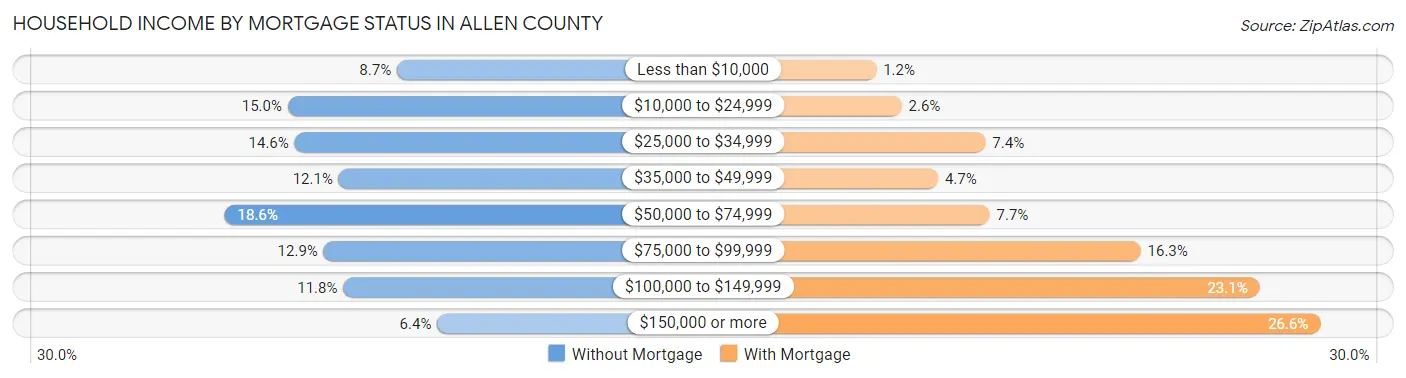
| Household Income | Without Mortgage | With Mortgage |
| Less than $10,000 | 273 (8.7%) | 34 (1.2%) |
| $10,000 to $24,999 | 468 (15.0%) | 76 (2.6%) |
| $25,000 to $34,999 | 456 (14.6%) | 214 (7.4%) |
| $35,000 to $49,999 | 377 (12.0%) | 136 (4.7%) |
| $50,000 to $74,999 | 581 (18.6%) | 221 (7.7%) |
| $75,000 to $99,999 | 404 (12.9%) | 470 (16.3%) |
| $100,000 to $149,999 | 369 (11.8%) | 666 (23.1%) |
| $150,000 or more | 201 (6.4%) | 766 (26.6%) |
| Total | 3,129 (100.0%) | 2,885 (100.0%) |
Property Value to Household Income Ratio in Allen County
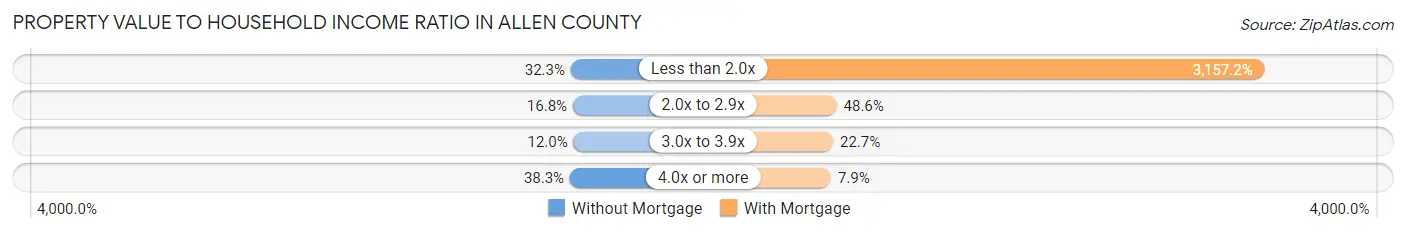
| Value-to-Income Ratio | Without Mortgage | With Mortgage |
| Less than 2.0x | 1,010 (32.3%) | 91,086 (3,157.2%) |
| 2.0x to 2.9x | 524 (16.8%) | 1,401 (48.6%) |
| 3.0x to 3.9x | 375 (12.0%) | 655 (22.7%) |
| 4.0x or more | 1,198 (38.3%) | 228 (7.9%) |
| Total | 3,129 (100.0%) | 2,885 (100.0%) |
Real Estate Taxes by Mortgage Status in Allen County
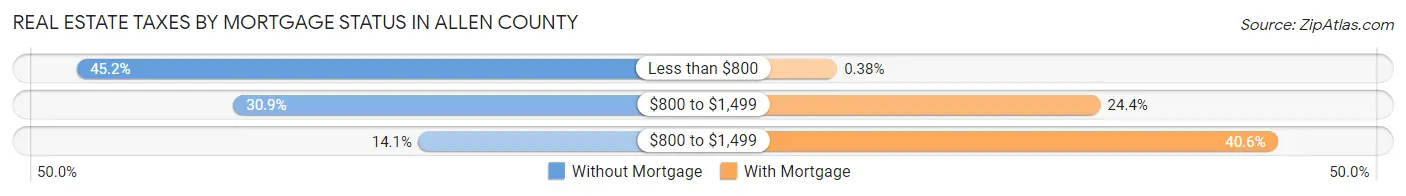
| Property Taxes | Without Mortgage | With Mortgage |
| Less than $800 | 1,414 (45.2%) | 11 (0.4%) |
| $800 to $1,499 | 968 (30.9%) | 705 (24.4%) |
| $800 to $1,499 | 441 (14.1%) | 1,171 (40.6%) |
| Total | 3,129 (100.0%) | 2,885 (100.0%) |
Health & Disability in Allen County
Health Insurance Coverage by Age in Allen County
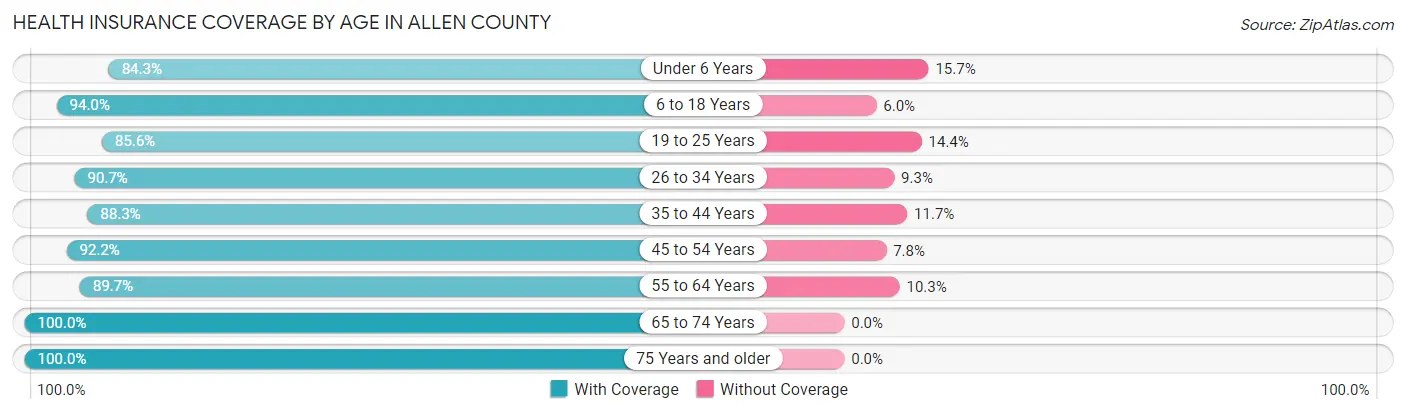
| Age Bracket | With Coverage | Without Coverage |
| Under 6 Years | 1,278 (84.3%) | 238 (15.7%) |
| 6 to 18 Years | 3,268 (94.0%) | 208 (6.0%) |
| 19 to 25 Years | 1,347 (85.6%) | 227 (14.4%) |
| 26 to 34 Years | 2,214 (90.7%) | 227 (9.3%) |
| 35 to 44 Years | 2,146 (88.3%) | 285 (11.7%) |
| 45 to 54 Years | 2,479 (92.2%) | 210 (7.8%) |
| 55 to 64 Years | 2,578 (89.7%) | 296 (10.3%) |
| 65 to 74 Years | 2,188 (100.0%) | 0 (0.0%) |
| 75 Years and older | 1,390 (100.0%) | 0 (0.0%) |
| Total | 18,888 (91.8%) | 1,691 (8.2%) |
Health Insurance Coverage by Citizenship Status in Allen County
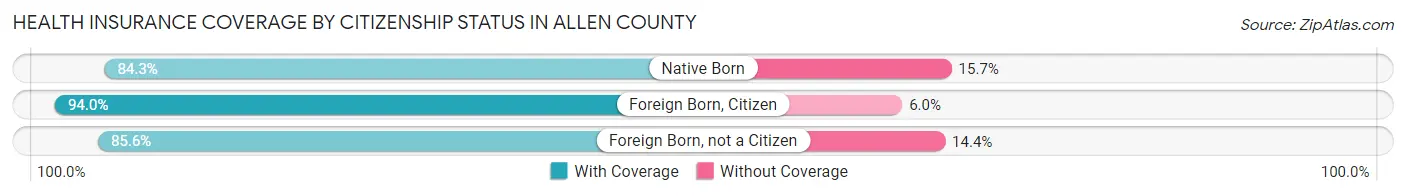
| Citizenship Status | With Coverage | Without Coverage |
| Native Born | 1,278 (84.3%) | 238 (15.7%) |
| Foreign Born, Citizen | 3,268 (94.0%) | 208 (6.0%) |
| Foreign Born, not a Citizen | 1,347 (85.6%) | 227 (14.4%) |
Health Insurance Coverage by Household Income in Allen County
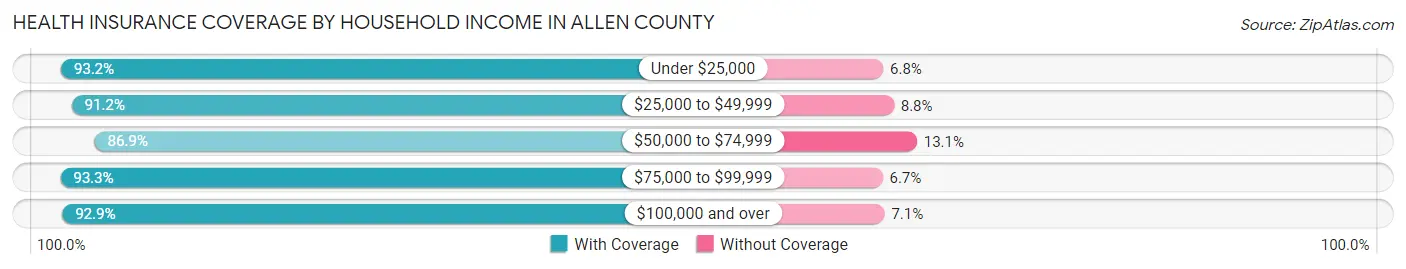
| Household Income | With Coverage | Without Coverage |
| Under $25,000 | 3,374 (93.2%) | 246 (6.8%) |
| $25,000 to $49,999 | 3,151 (91.2%) | 304 (8.8%) |
| $50,000 to $74,999 | 2,897 (86.9%) | 437 (13.1%) |
| $75,000 to $99,999 | 3,195 (93.3%) | 229 (6.7%) |
| $100,000 and over | 6,250 (92.9%) | 475 (7.1%) |
Public vs Private Health Insurance Coverage by Age in Allen County
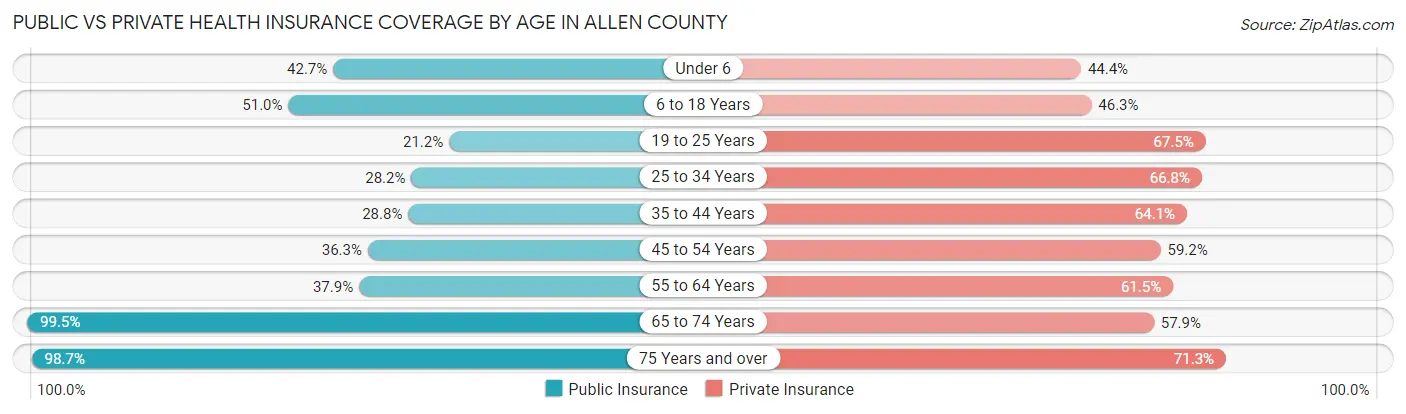
| Age Bracket | Public Insurance | Private Insurance |
| Under 6 | 648 (42.7%) | 673 (44.4%) |
| 6 to 18 Years | 1,774 (51.0%) | 1,610 (46.3%) |
| 19 to 25 Years | 334 (21.2%) | 1,063 (67.5%) |
| 25 to 34 Years | 689 (28.2%) | 1,631 (66.8%) |
| 35 to 44 Years | 700 (28.8%) | 1,557 (64.0%) |
| 45 to 54 Years | 976 (36.3%) | 1,591 (59.2%) |
| 55 to 64 Years | 1,090 (37.9%) | 1,767 (61.5%) |
| 65 to 74 Years | 2,178 (99.5%) | 1,267 (57.9%) |
| 75 Years and over | 1,372 (98.7%) | 991 (71.3%) |
| Total | 9,761 (47.4%) | 12,150 (59.0%) |
Disability Status by Sex by Age in Allen County
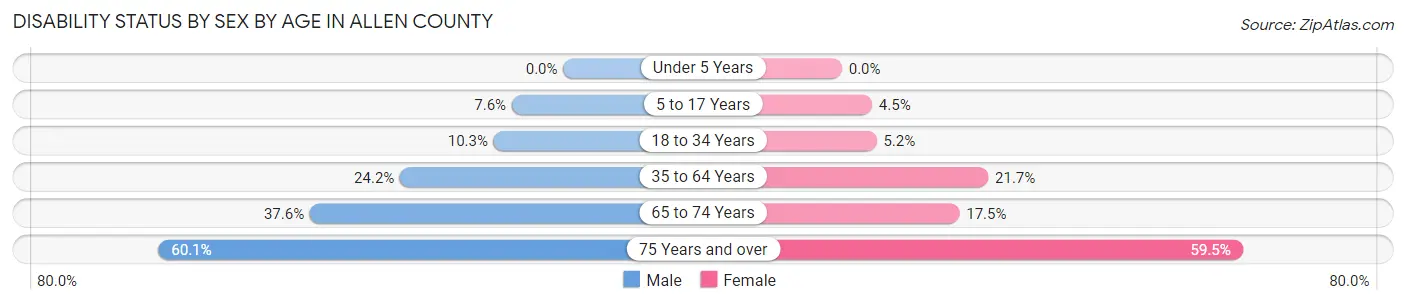
| Age Bracket | Male | Female |
| Under 5 Years | 0 (0.0%) | 0 (0.0%) |
| 5 to 17 Years | 131 (7.6%) | 80 (4.5%) |
| 18 to 34 Years | 217 (10.3%) | 110 (5.1%) |
| 35 to 64 Years | 987 (24.2%) | 852 (21.7%) |
| 65 to 74 Years | 407 (37.6%) | 193 (17.4%) |
| 75 Years and over | 368 (60.1%) | 463 (59.5%) |
Disability Class by Sex by Age in Allen County
Disability Class: Hearing Difficulty
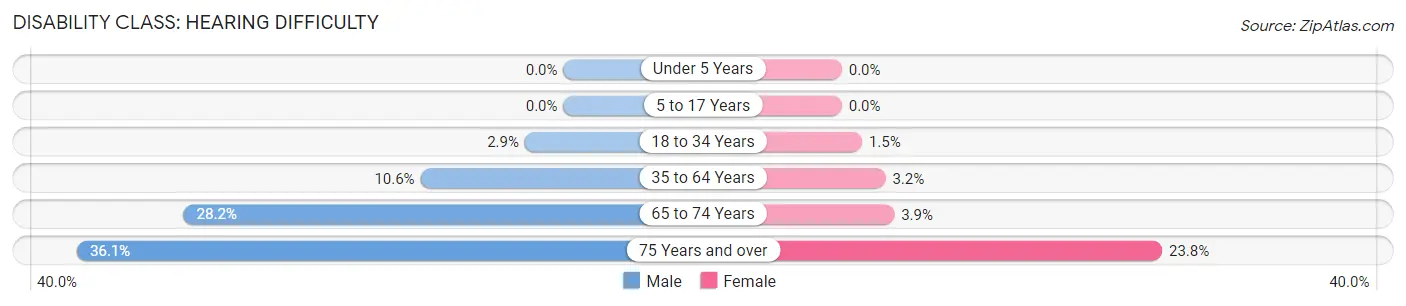
| Age Bracket | Male | Female |
| Under 5 Years | 0 (0.0%) | 0 (0.0%) |
| 5 to 17 Years | 0 (0.0%) | 0 (0.0%) |
| 18 to 34 Years | 60 (2.9%) | 32 (1.5%) |
| 35 to 64 Years | 432 (10.6%) | 127 (3.2%) |
| 65 to 74 Years | 305 (28.2%) | 43 (3.9%) |
| 75 Years and over | 221 (36.1%) | 185 (23.8%) |
Disability Class: Vision Difficulty
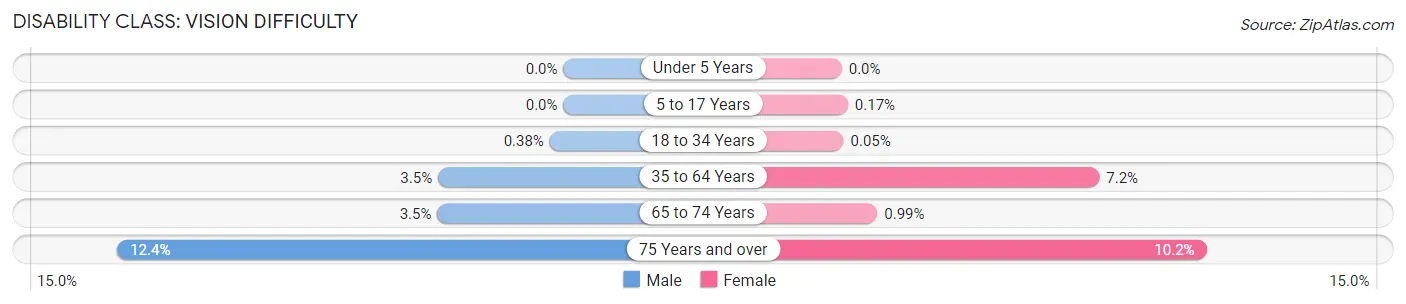
| Age Bracket | Male | Female |
| Under 5 Years | 0 (0.0%) | 0 (0.0%) |
| 5 to 17 Years | 0 (0.0%) | 3 (0.2%) |
| 18 to 34 Years | 8 (0.4%) | 1 (0.1%) |
| 35 to 64 Years | 142 (3.5%) | 281 (7.2%) |
| 65 to 74 Years | 38 (3.5%) | 11 (1.0%) |
| 75 Years and over | 76 (12.4%) | 79 (10.2%) |
Disability Class: Cognitive Difficulty
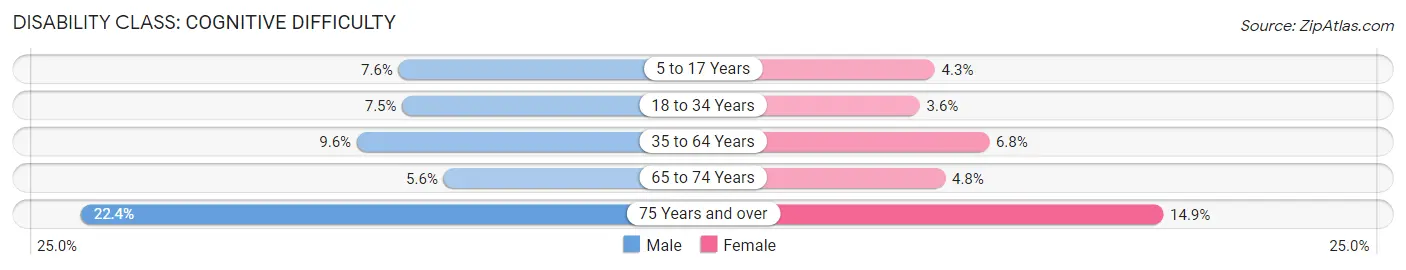
| Age Bracket | Male | Female |
| 5 to 17 Years | 131 (7.6%) | 77 (4.3%) |
| 18 to 34 Years | 157 (7.5%) | 77 (3.6%) |
| 35 to 64 Years | 390 (9.6%) | 268 (6.8%) |
| 65 to 74 Years | 60 (5.6%) | 53 (4.8%) |
| 75 Years and over | 137 (22.4%) | 116 (14.9%) |
Disability Class: Ambulatory Difficulty
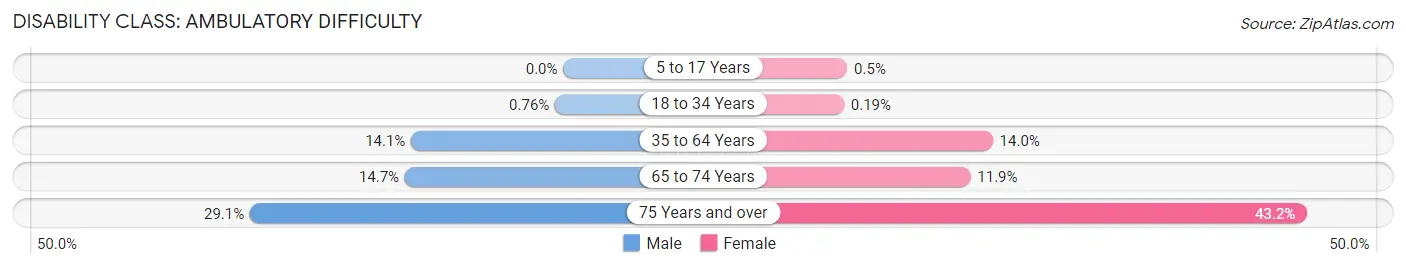
| Age Bracket | Male | Female |
| 5 to 17 Years | 0 (0.0%) | 9 (0.5%) |
| 18 to 34 Years | 16 (0.8%) | 4 (0.2%) |
| 35 to 64 Years | 575 (14.1%) | 549 (14.0%) |
| 65 to 74 Years | 159 (14.7%) | 132 (11.9%) |
| 75 Years and over | 178 (29.1%) | 336 (43.2%) |
Disability Class: Self-Care Difficulty
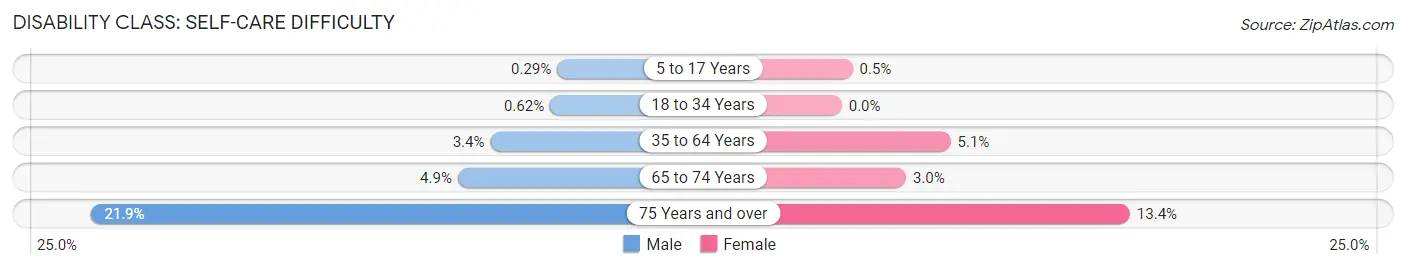
| Age Bracket | Male | Female |
| 5 to 17 Years | 5 (0.3%) | 9 (0.5%) |
| 18 to 34 Years | 13 (0.6%) | 0 (0.0%) |
| 35 to 64 Years | 138 (3.4%) | 198 (5.1%) |
| 65 to 74 Years | 53 (4.9%) | 33 (3.0%) |
| 75 Years and over | 134 (21.9%) | 104 (13.4%) |
Technology Access in Allen County
Computing Device Access in Allen County
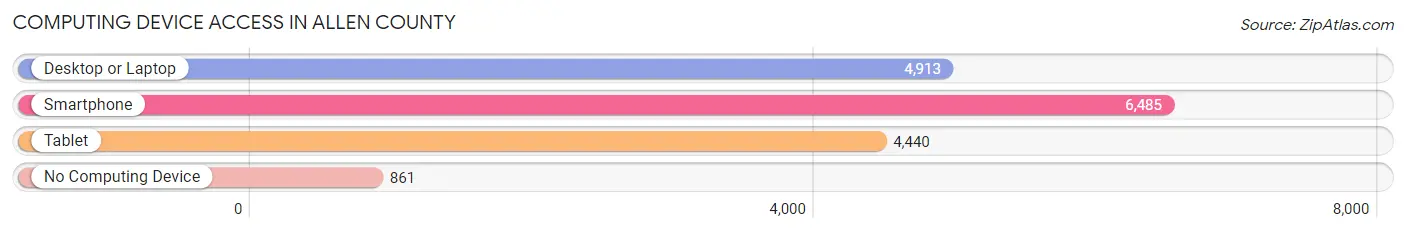
| Device Type | # Households | % Households |
| Desktop or Laptop | 4,913 | 62.9% |
| Smartphone | 6,485 | 83.0% |
| Tablet | 4,440 | 56.8% |
| No Computing Device | 861 | 11.0% |
| Total | 7,816 | 100.0% |
Internet Access in Allen County
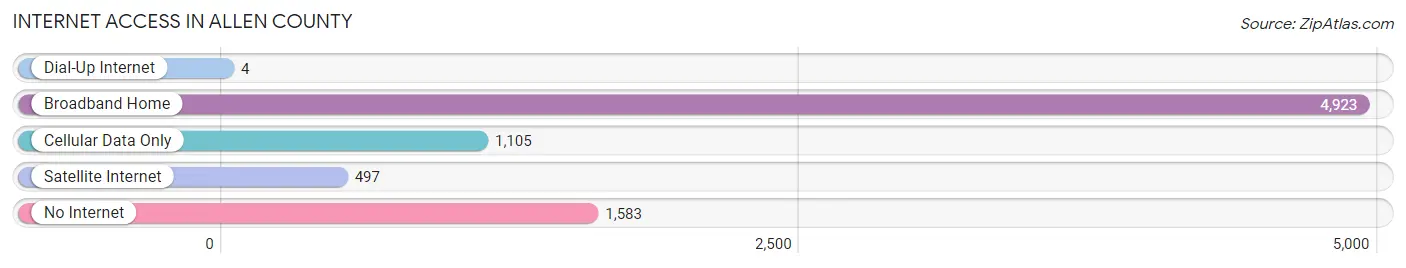
| Internet Type | # Households | % Households |
| Dial-Up Internet | 4 | 0.1% |
| Broadband Home | 4,923 | 63.0% |
| Cellular Data Only | 1,105 | 14.1% |
| Satellite Internet | 497 | 6.4% |
| No Internet | 1,583 | 20.3% |
| Total | 7,816 | 100.0% |
Allen County Summary
Allen County is located in the south-central region of Kentucky, and is part of the Barren River Area Development District. The county was established in 1815 and is named after Colonel John Allen, a Revolutionary War hero. The county seat is Scottsville, and the county has a total area of 441 square miles, of which 439 square miles is land and 2 square miles is water. As of the 2010 census, the population was 19,956.
Geography
Allen County is located in the Pennyroyal Plateau region of Kentucky, and is bordered by Simpson County to the north, Warren County to the east, Barren County to the south, and Monroe County to the west. The county is mostly flat, with some rolling hills in the northern and western parts. The Barren River runs through the county, and there are several small creeks and streams. The county is mostly rural, with some small towns and villages scattered throughout.
Economy
Agriculture is the main economic activity in Allen County. The county is home to several large farms, and the main crops grown are corn, soybeans, wheat, and hay. Livestock production is also important, with cattle, hogs, and poultry being the main animals raised. Manufacturing is also an important part of the economy, with several factories located in the county. The main industries are furniture manufacturing, food processing, and metal fabrication.
Demographics
As of the 2010 census, the population of Allen County was 19,956, with a population density of 45 people per square mile. The racial makeup of the county was 95.3% White, 2.3% African American, 0.3% Native American, 0.2% Asian, 0.1% Pacific Islander, 0.7% from other races, and 1.1% from two or more races. Hispanic or Latino of any race were 1.7% of the population.
The median income for a household in the county was $35,945, and the median income for a family was $43,945. The per capita income for the county was $17,945. About 15.3% of the population was below the poverty line.
Education
Allen County is served by the Allen County Schools district, which consists of seven elementary schools, two middle schools, and one high school. The county also has several private schools, including Allen County Christian Academy and Allen County Christian Academy. The county is also home to several higher education institutions, including Western Kentucky University, Kentucky State University, and Lindsey Wilson College.
Conclusion
Allen County is a rural county located in south-central Kentucky. The county is mostly agricultural, with some manufacturing and other industries. The population is mostly white, with a small percentage of African Americans, Native Americans, and other races. The county is served by the Allen County Schools district, and there are several higher education institutions in the county.
Common Questions
What is Per Capita Income in Allen County?
Per Capita income in Allen County is $28,307.
What is the Median Family Income in Allen County?
Median Family Income in Allen County is $72,441.
What is the Median Household income in Allen County?
Median Household Income in Allen County is $57,159.
What is Income or Wage Gap in Allen County?
Income or Wage Gap in Allen County is 28.4%.
Women in Allen County earn 71.6 cents for every dollar earned by a man.
What is Family Income Deficit in Allen County?
Family Income Deficit in Allen County is $11,516.
Families that are below poverty line in Allen County earn $11,516 less on average than the poverty threshold level.
What is Inequality or Gini Index in Allen County?
Inequality or Gini Index in Allen County is 0.44.
What is the Total Population of Allen County?
Total Population of Allen County is 20,773.
What is the Total Male Population of Allen County?
Total Male Population of Allen County is 10,364.
What is the Total Female Population of Allen County?
Total Female Population of Allen County is 10,409.
What is the Ratio of Males per 100 Females in Allen County?
There are 99.57 Males per 100 Females in Allen County.
What is the Ratio of Females per 100 Males in Allen County?
There are 100.43 Females per 100 Males in Allen County.
What is the Median Population Age in Allen County?
Median Population Age in Allen County is 40.5 Years.
What is the Average Family Size in Allen County
Average Family Size in Allen County is 3.1 People.
What is the Average Household Size in Allen County
Average Household Size in Allen County is 2.6 People.
How Large is the Labor Force in Allen County?
There are 9,617 People in the Labor Forcein in Allen County.
What is the Percentage of People in the Labor Force in Allen County?
58.6% of People are in the Labor Force in Allen County.
What is the Unemployment Rate in Allen County?
Unemployment Rate in Allen County is 7.3%.