Thai vs Immigrants from Colombia Self-Care Disability

COMPARE

Thai
Race
Ancestry
AfghanAfricanAlaska NativeAlaskan AthabascanAlbanianAleutAlsatianAmericanApacheArabArapahoArgentineanArmenianAssyrian/Chaldean/SyriacAustralianAustrianBahamianBangladeshiBarbadianBasqueBelgianBelizeanBermudanBhutaneseBlackfeetBolivianBrazilianBritishBritish West IndianBulgarianBurmeseCajunCambodianCanadianCape VerdeanCarpatho RusynCelticCentral AmericanCentral American IndianCherokeeCheyenneChickasawChileanChineseChippewaChoctawColombianColvilleComancheCosta RicanCreeCreekCroatianCrowCubanCypriotCzechCzechoslovakianDanishDelawareDominicanDutchDutch West IndianEastern EuropeanEcuadorianEgyptianEnglishEstonianEthiopianEuropeanFijianFilipinoFinnishFrenchFrench American IndianFrench CanadianGermanGerman RussianGhanaianGreekGuamanian/ChamorroGuatemalanGuyaneseHaitianHmongHonduranHopiHoumaHungarianIcelanderIndian (Asian)IndonesianInupiatIranianIraqiIrishIroquoisIsraeliItalianJamaicanJapaneseJordanianKenyanKiowaKoreanLaotianLatvianLebaneseLiberianLithuanianLumbeeLuxembourgerMacedonianMalaysianMalteseMarshalleseMenomineeMexicanMexican American IndianMongolianMoroccanNative HawaiianNavajoNepaleseNew ZealanderNicaraguanNigerianNorthern EuropeanNorwegianOkinawanOsageOttawaPaiutePakistaniPalestinianPanamanianParaguayanPennsylvania GermanPeruvianPimaPolishPortuguesePotawatomiPuebloPuerto RicanPuget Sound SalishRomanianRussianSalvadoranSamoanScandinavianScotch-IrishScottishSeminoleSenegaleseSerbianShoshoneSierra LeoneanSiouxSlavicSlovakSloveneSomaliSouth AfricanSouth AmericanSouth American IndianSoviet UnionSpaniardSpanishSpanish AmericanSpanish American IndianSri LankanSubsaharan AfricanSudaneseSwedishSwissSyrianTaiwaneseThaiTlingit-HaidaTohono O'OdhamTonganTrinidadian and TobagonianTsimshianTurkishU.S. Virgin IslanderUgandanUkrainianUruguayanUteVenezuelanVietnameseWelshWest IndianYakamaYaquiYugoslavianYumanYup'ikZimbabwean
Immigration
NonimmigrantsImmigrantsAfghanistanAfricaAlbaniaArgentinaArmeniaAsiaAustraliaAustriaBahamasBangladeshBarbadosBelarusBelgiumBelizeBoliviaBosnia and HerzegovinaBrazilBulgariaBurma/MyanmarCabo VerdeCambodiaCameroonCanadaCaribbeanCentral AmericaChileChinaCongoCosta RicaCroatiaCubaCzechoslovakiaDenmarkDominicaDominican RepublicEastern AfricaEastern AsiaEastern EuropeEcuadorEgyptEl SalvadorEnglandEritreaEthiopiaEuropeFijiFranceGermanyGhanaGreeceGrenadaGuatemalaGuyanaHaitiHondurasHong KongHungaryIndiaIndonesiaIranIraqIrelandIsraelItalyJamaicaJapanJordanKazakhstanKenyaKoreaKuwaitLaosLatin AmericaLatviaLebanonLiberiaLithuaniaMalaysiaMexicoMicronesiaMiddle AfricaMoldovaMoroccoNepalNetherlandsNicaraguaNigeriaNorth AmericaNorth MacedoniaNorthern AfricaNorthern EuropeNorwayOceaniaPakistanPanamaPeruPhilippinesPolandPortugalRomaniaRussiaSaudi ArabiaScotlandSenegalSerbiaSierra LeoneSingaporeSomaliaSouth AfricaSouth AmericaSouth Central AsiaSouth Eastern AsiaSouthern EuropeSpainSri LankaSt. Vincent and the GrenadinesSudanSwedenSwitzerlandSyriaTaiwanThailandTrinidad and TobagoTurkeyUgandaUkraineUruguayUzbekistanVenezuelaVietnamWest IndiesWestern AfricaWestern AsiaWestern EuropeYemenZaireZimbabweAzores
Immigrants from Colombia
Race
Ancestry
AfghanAfricanAlaska NativeAlaskan AthabascanAlbanianAleutAlsatianAmericanApacheArabArapahoArgentineanArmenianAssyrian/Chaldean/SyriacAustralianAustrianBahamianBangladeshiBarbadianBasqueBelgianBelizeanBermudanBhutaneseBlackfeetBolivianBrazilianBritishBritish West IndianBulgarianBurmeseCajunCambodianCanadianCape VerdeanCarpatho RusynCelticCentral AmericanCentral American IndianCherokeeCheyenneChickasawChileanChineseChippewaChoctawColombianColvilleComancheCosta RicanCreeCreekCroatianCrowCubanCypriotCzechCzechoslovakianDanishDelawareDominicanDutchDutch West IndianEastern EuropeanEcuadorianEgyptianEnglishEstonianEthiopianEuropeanFijianFilipinoFinnishFrenchFrench American IndianFrench CanadianGermanGerman RussianGhanaianGreekGuamanian/ChamorroGuatemalanGuyaneseHaitianHmongHonduranHopiHoumaHungarianIcelanderIndian (Asian)IndonesianInupiatIranianIraqiIrishIroquoisIsraeliItalianJamaicanJapaneseJordanianKenyanKiowaKoreanLaotianLatvianLebaneseLiberianLithuanianLumbeeLuxembourgerMacedonianMalaysianMalteseMarshalleseMenomineeMexicanMexican American IndianMongolianMoroccanNative HawaiianNavajoNepaleseNew ZealanderNicaraguanNigerianNorthern EuropeanNorwegianOkinawanOsageOttawaPaiutePakistaniPalestinianPanamanianParaguayanPennsylvania GermanPeruvianPimaPolishPortuguesePotawatomiPuebloPuerto RicanPuget Sound SalishRomanianRussianSalvadoranSamoanScandinavianScotch-IrishScottishSeminoleSenegaleseSerbianShoshoneSierra LeoneanSiouxSlavicSlovakSloveneSomaliSouth AfricanSouth AmericanSouth American IndianSoviet UnionSpaniardSpanishSpanish AmericanSpanish American IndianSri LankanSubsaharan AfricanSudaneseSwedishSwissSyrianTaiwaneseTlingit-HaidaTohono O'OdhamTonganTrinidadian and TobagonianTsimshianTurkishU.S. Virgin IslanderUgandanUkrainianUruguayanUteVenezuelanVietnameseWelshWest IndianYakamaYaquiYugoslavianYumanYup'ikZimbabwean
Immigration
NonimmigrantsImmigrantsAfghanistanAfricaAlbaniaArgentinaArmeniaAsiaAustraliaAustriaBahamasBangladeshBarbadosBelarusBelgiumBelizeBoliviaBosnia and HerzegovinaBrazilBulgariaBurma/MyanmarCabo VerdeCambodiaCameroonCanadaCaribbeanCentral AmericaChileChinaColombiaCongoCosta RicaCroatiaCubaCzechoslovakiaDenmarkDominicaDominican RepublicEastern AfricaEastern AsiaEastern EuropeEcuadorEgyptEl SalvadorEnglandEritreaEthiopiaEuropeFijiFranceGermanyGhanaGreeceGrenadaGuatemalaGuyanaHaitiHondurasHong KongHungaryIndiaIndonesiaIranIraqIrelandIsraelItalyJamaicaJapanJordanKazakhstanKenyaKoreaKuwaitLaosLatin AmericaLatviaLebanonLiberiaLithuaniaMalaysiaMexicoMicronesiaMiddle AfricaMoldovaMoroccoNepalNetherlandsNicaraguaNigeriaNorth AmericaNorth MacedoniaNorthern AfricaNorthern EuropeNorwayOceaniaPakistanPanamaPeruPhilippinesPolandPortugalRomaniaRussiaSaudi ArabiaScotlandSenegalSerbiaSierra LeoneSingaporeSomaliaSouth AfricaSouth AmericaSouth Central AsiaSouth Eastern AsiaSouthern EuropeSpainSri LankaSt. Vincent and the GrenadinesSudanSwedenSwitzerlandSyriaTaiwanThailandTrinidad and TobagoTurkeyUgandaUkraineUruguayUzbekistanVenezuelaVietnamWest IndiesWestern AfricaWestern AsiaWestern EuropeYemenZaireZimbabweAzores
Self-Care Disability
Income
Poverty
Unemployment
Labor Participation
Family Structure
Vehicle Availability
Education Level
Disability

Self-Care Disability Comparison

Thais

Immigrants from Colombia

Exceptional
Excellent
2.1%
SELF-CARE DISABILITY
100.0/ 100
METRIC RATING
3rd/ 347
METRIC RANK
2.4%
SELF-CARE DISABILITY
88.5/ 100
METRIC RATING
133rd/ 347
METRIC RANK

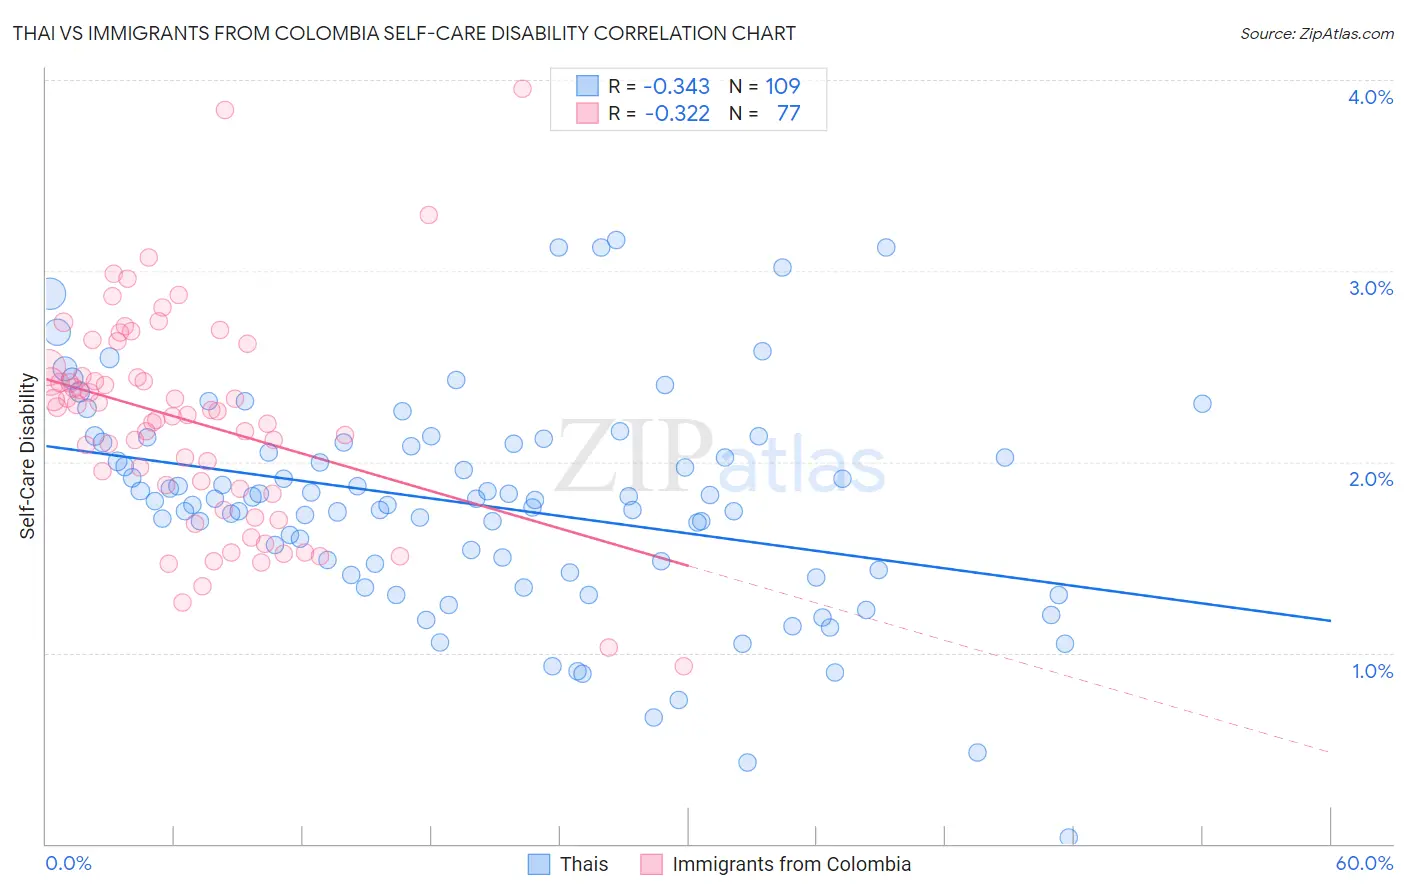
Thai vs Immigrants from Colombia Self-Care Disability Correlation Chart

The statistical analysis conducted on geographies consisting of 474,998,821 people shows a mild negative correlation between the proportion of Thais and percentage of population with self-care disability in the United States with a correlation coefficient (R) of -0.343 and weighted average of 2.1%. Similarly, the statistical analysis conducted on geographies consisting of 378,342,946 people shows a mild negative correlation between the proportion of Immigrants from Colombia and percentage of population with self-care disability in the United States with a correlation coefficient (R) of -0.322 and weighted average of 2.4%, a difference of 15.6%.
Thai vs Immigrants from Colombia Self-Care Disability

Self-Care Disability Correlation Summary

MeasurementThaiImmigrants from Colombia
Minimum0.030%0.93%
Maximum3.2%4.0%
Range3.1%3.0%
Mean1.8%2.2%
Median1.8%2.3%
Interquartile 25% (IQ1)1.4%1.8%
Interquartile 75% (IQ3)2.1%2.5%
Interquartile Range (IQR)0.67%0.62%
Standard Deviation (Sample)0.57%0.56%
Standard Deviation (Population)0.57%0.56%

Similar Demographics by Self-Care Disability

Demographics Similar to Thais by Self-Care Disability

In terms of self-care disability, the demographic groups most similar to Thais are Immigrants from Singapore (2.1%, a difference of 2.3%), Immigrants from India (2.0%, a difference of 3.0%), Zimbabwean (2.2%, a difference of 3.3%), Filipino (2.2%, a difference of 3.6%), and Immigrants from Bolivia (2.2%, a difference of 3.8%).
DemographicsRating | RankSelf-Care Disability
Yup'ik
100.0
/100
|
#1
Exceptional
1.9%
Immigrants | India
100.0
/100
|
#2
Exceptional
2.0%
Thais
100.0
/100
|
#3
Exceptional
2.1%
Immigrants | Singapore
100.0
/100
|
#4
Exceptional
2.1%
Zimbabweans
100.0
/100
|
#5
Exceptional
2.2%
Filipinos
100.0
/100
|
#6
Exceptional
2.2%
Immigrants | Bolivia
100.0
/100
|
#7
Exceptional
2.2%
Bolivians
100.0
/100
|
#8
Exceptional
2.2%
Immigrants | Nepal
100.0
/100
|
#9
Exceptional
2.2%
Sudanese
100.0
/100
|
#10
Exceptional
2.2%
Immigrants | South Central Asia
100.0
/100
|
#11
Exceptional
2.2%
Immigrants | Ethiopia
100.0
/100
|
#12
Exceptional
2.2%
Ethiopians
100.0
/100
|
#13
Exceptional
2.2%
Luxembourgers
100.0
/100
|
#14
Exceptional
2.2%
Okinawans
100.0
/100
|
#15
Exceptional
2.2%

Demographics Similar to Immigrants from Colombia by Self-Care Disability

In terms of self-care disability, the demographic groups most similar to Immigrants from Colombia are Immigrants from South America (2.4%, a difference of 0.030%), Polish (2.4%, a difference of 0.040%), Russian (2.4%, a difference of 0.040%), Immigrants from Austria (2.4%, a difference of 0.060%), and Immigrants from Romania (2.4%, a difference of 0.090%).
DemographicsRating | RankSelf-Care Disability
Hmong
89.9
/100
|
#126
Excellent
2.4%
Colombians
89.7
/100
|
#127
Excellent
2.4%
Immigrants | Hungary
89.6
/100
|
#128
Excellent
2.4%
Immigrants | Romania
89.3
/100
|
#129
Excellent
2.4%
Immigrants | Austria
89.0
/100
|
#130
Excellent
2.4%
Poles
88.9
/100
|
#131
Excellent
2.4%
Immigrants | South America
88.8
/100
|
#132
Excellent
2.4%
Immigrants | Colombia
88.5
/100
|
#133
Excellent
2.4%
Russians
88.2
/100
|
#134
Excellent
2.4%
Laotians
87.8
/100
|
#135
Excellent
2.4%
South American Indians
87.2
/100
|
#136
Excellent
2.4%
Austrians
87.0
/100
|
#137
Excellent
2.4%
Immigrants | Croatia
86.6
/100
|
#138
Excellent
2.4%
Sri Lankans
86.6
/100
|
#139
Excellent
2.4%
Immigrants | Uruguay
85.4
/100
|
#140
Excellent
2.4%