Thai vs Cypriot Self-Care Disability
COMPARE
Thai
Cypriot
Self-Care Disability
Self-Care Disability Comparison
Thais
Cypriots
2.1%
SELF-CARE DISABILITY
100.0/ 100
METRIC RATING
3rd/ 347
METRIC RANK
2.2%
SELF-CARE DISABILITY
100.0/ 100
METRIC RATING
24th/ 347
METRIC RANK
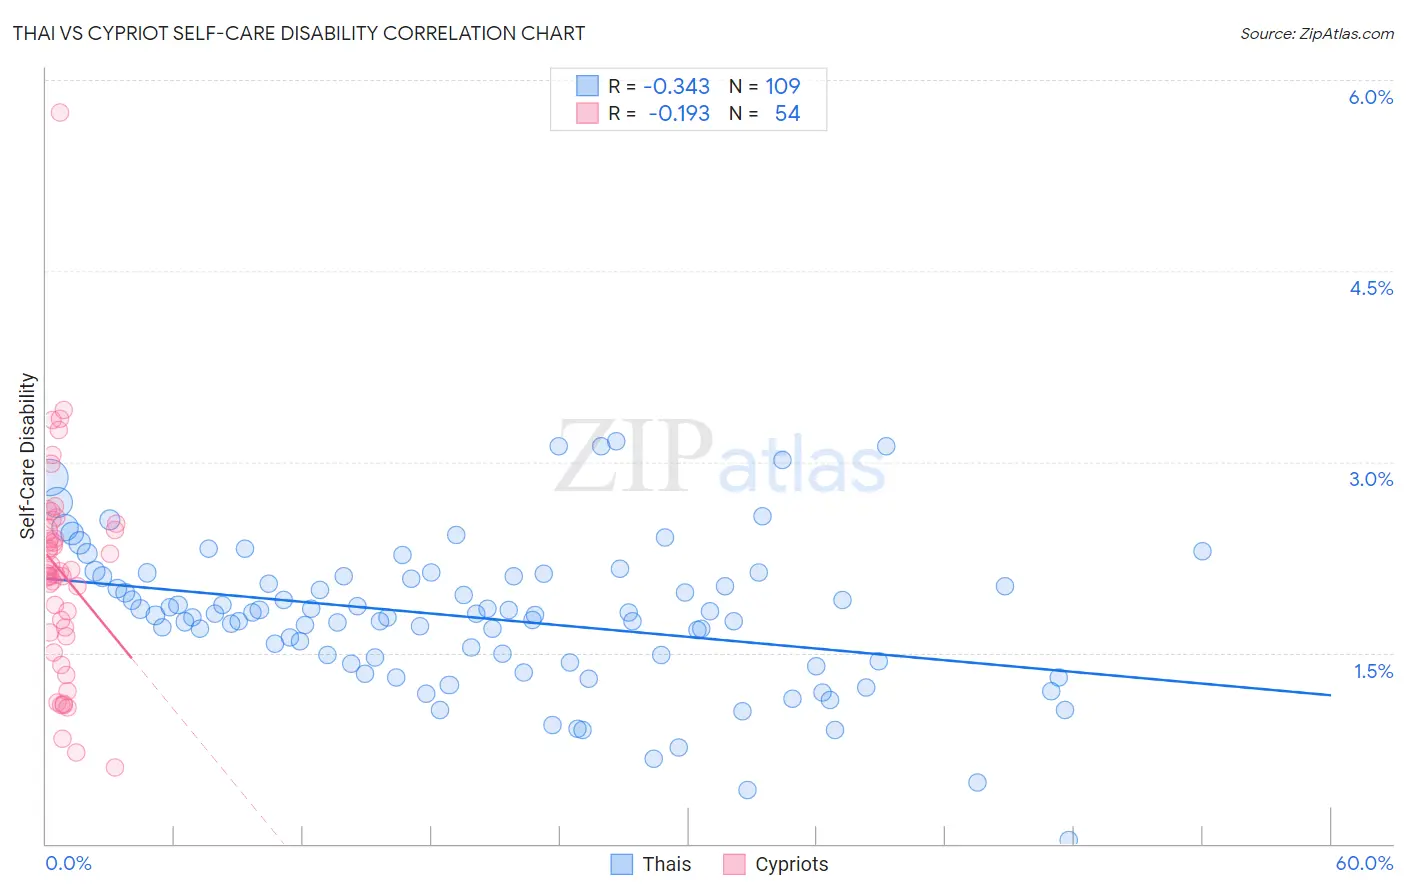
Thai vs Cypriot Self-Care Disability Correlation Chart
The statistical analysis conducted on geographies consisting of 474,998,821 people shows a mild negative correlation between the proportion of Thais and percentage of population with self-care disability in the United States with a correlation coefficient (R) of -0.343 and weighted average of 2.1%. Similarly, the statistical analysis conducted on geographies consisting of 61,833,470 people shows a poor negative correlation between the proportion of Cypriots and percentage of population with self-care disability in the United States with a correlation coefficient (R) of -0.193 and weighted average of 2.2%, a difference of 7.6%.
Self-Care Disability Correlation Summary
| Measurement | Thai | Cypriot |
| Minimum | 0.030% | 0.60% |
| Maximum | 3.2% | 5.7% |
| Range | 3.1% | 5.1% |
| Mean | 1.8% | 2.1% |
| Median | 1.8% | 2.1% |
| Interquartile 25% (IQ1) | 1.4% | 1.7% |
| Interquartile 75% (IQ3) | 2.1% | 2.5% |
| Interquartile Range (IQR) | 0.67% | 0.80% |
| Standard Deviation (Sample) | 0.57% | 0.84% |
| Standard Deviation (Population) | 0.57% | 0.83% |
Similar Demographics by Self-Care Disability
Demographics Similar to Thais by Self-Care Disability
In terms of self-care disability, the demographic groups most similar to Thais are Immigrants from Singapore (2.1%, a difference of 2.3%), Immigrants from India (2.0%, a difference of 3.0%), Zimbabwean (2.2%, a difference of 3.3%), Filipino (2.2%, a difference of 3.6%), and Immigrants from Bolivia (2.2%, a difference of 3.8%).
| Demographics | Rating | Rank | Self-Care Disability |
| Yup'ik | 100.0 /100 | #1 | Exceptional 1.9% |
| Immigrants | India | 100.0 /100 | #2 | Exceptional 2.0% |
| Thais | 100.0 /100 | #3 | Exceptional 2.1% |
| Immigrants | Singapore | 100.0 /100 | #4 | Exceptional 2.1% |
| Zimbabweans | 100.0 /100 | #5 | Exceptional 2.2% |
| Filipinos | 100.0 /100 | #6 | Exceptional 2.2% |
| Immigrants | Bolivia | 100.0 /100 | #7 | Exceptional 2.2% |
| Bolivians | 100.0 /100 | #8 | Exceptional 2.2% |
| Immigrants | Nepal | 100.0 /100 | #9 | Exceptional 2.2% |
| Sudanese | 100.0 /100 | #10 | Exceptional 2.2% |
| Immigrants | South Central Asia | 100.0 /100 | #11 | Exceptional 2.2% |
| Immigrants | Ethiopia | 100.0 /100 | #12 | Exceptional 2.2% |
| Ethiopians | 100.0 /100 | #13 | Exceptional 2.2% |
| Luxembourgers | 100.0 /100 | #14 | Exceptional 2.2% |
| Okinawans | 100.0 /100 | #15 | Exceptional 2.2% |
Demographics Similar to Cypriots by Self-Care Disability
In terms of self-care disability, the demographic groups most similar to Cypriots are Turkish (2.2%, a difference of 0.11%), Immigrants from Sri Lanka (2.2%, a difference of 0.18%), Venezuelan (2.2%, a difference of 0.19%), Cambodian (2.2%, a difference of 0.30%), and Inupiat (2.2%, a difference of 0.35%).
| Demographics | Rating | Rank | Self-Care Disability |
| Immigrants | Saudi Arabia | 100.0 /100 | #17 | Exceptional 2.2% |
| Immigrants | Taiwan | 100.0 /100 | #18 | Exceptional 2.2% |
| Immigrants | Eritrea | 100.0 /100 | #19 | Exceptional 2.2% |
| Tongans | 100.0 /100 | #20 | Exceptional 2.2% |
| Bulgarians | 100.0 /100 | #21 | Exceptional 2.2% |
| Immigrants | Venezuela | 100.0 /100 | #22 | Exceptional 2.2% |
| Cambodians | 100.0 /100 | #23 | Exceptional 2.2% |
| Cypriots | 100.0 /100 | #24 | Exceptional 2.2% |
| Turks | 100.0 /100 | #25 | Exceptional 2.2% |
| Immigrants | Sri Lanka | 99.9 /100 | #26 | Exceptional 2.2% |
| Venezuelans | 99.9 /100 | #27 | Exceptional 2.2% |
| Inupiat | 99.9 /100 | #28 | Exceptional 2.2% |
| Immigrants | Zimbabwe | 99.9 /100 | #29 | Exceptional 2.3% |
| Paraguayans | 99.9 /100 | #30 | Exceptional 2.3% |
| Danes | 99.9 /100 | #31 | Exceptional 2.3% |