Moroccan vs Croatian Self-Care Disability
COMPARE
Moroccan
Croatian
Self-Care Disability
Self-Care Disability Comparison
Moroccans
Croatians
2.5%
SELF-CARE DISABILITY
22.9/ 100
METRIC RATING
191st/ 347
METRIC RANK
2.4%
SELF-CARE DISABILITY
95.0/ 100
METRIC RATING
102nd/ 347
METRIC RANK
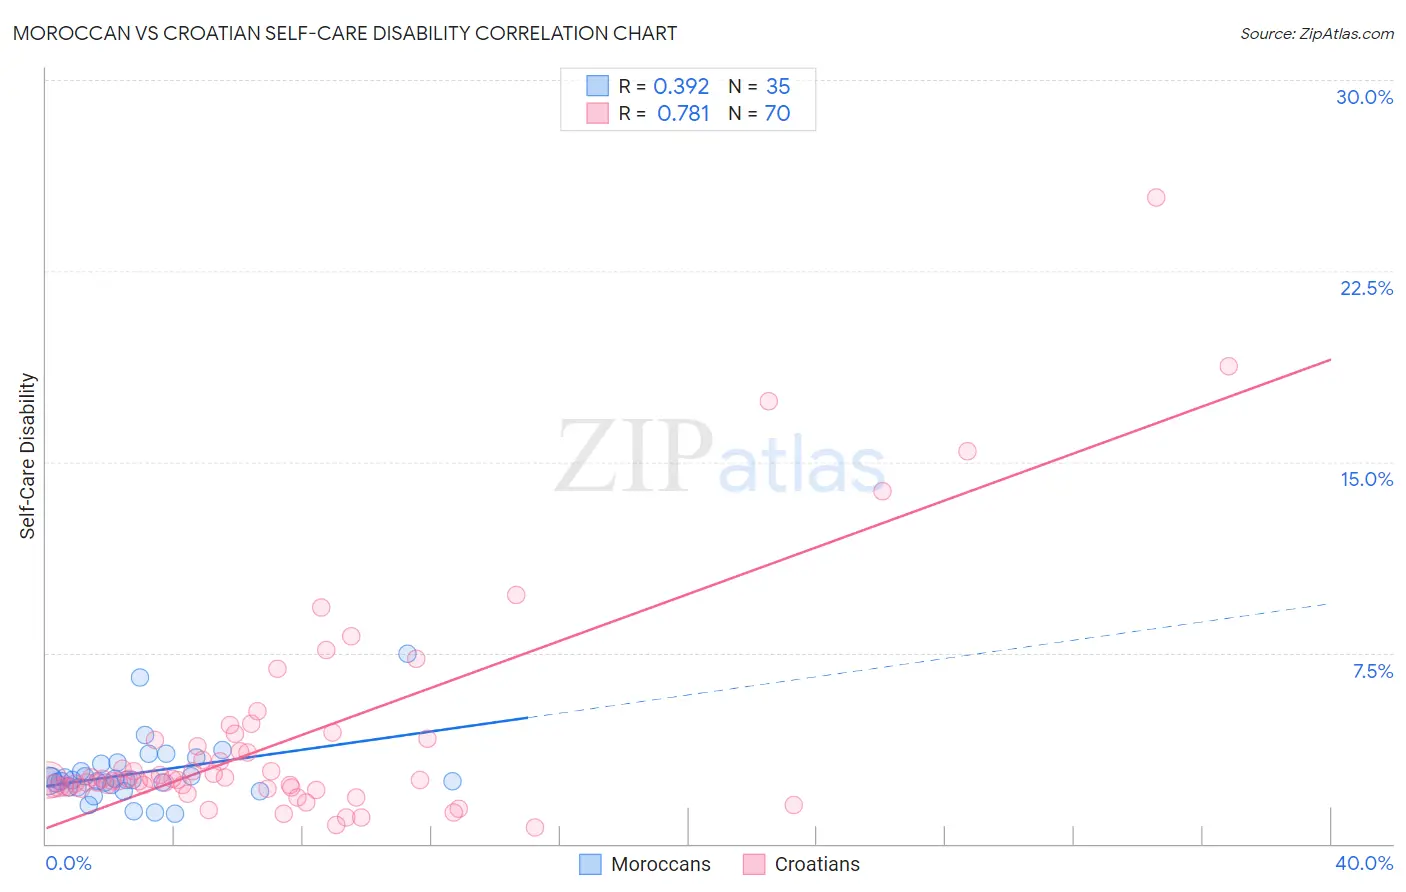
Moroccan vs Croatian Self-Care Disability Correlation Chart
The statistical analysis conducted on geographies consisting of 201,730,975 people shows a mild positive correlation between the proportion of Moroccans and percentage of population with self-care disability in the United States with a correlation coefficient (R) of 0.392 and weighted average of 2.5%. Similarly, the statistical analysis conducted on geographies consisting of 375,273,101 people shows a strong positive correlation between the proportion of Croatians and percentage of population with self-care disability in the United States with a correlation coefficient (R) of 0.781 and weighted average of 2.4%, a difference of 5.1%.
Self-Care Disability Correlation Summary
| Measurement | Moroccan | Croatian |
| Minimum | 1.2% | 0.62% |
| Maximum | 7.5% | 25.4% |
| Range | 6.3% | 24.8% |
| Mean | 2.8% | 4.1% |
| Median | 2.5% | 2.5% |
| Interquartile 25% (IQ1) | 2.2% | 2.2% |
| Interquartile 75% (IQ3) | 3.1% | 4.1% |
| Interquartile Range (IQR) | 0.89% | 1.9% |
| Standard Deviation (Sample) | 1.3% | 4.5% |
| Standard Deviation (Population) | 1.2% | 4.4% |
Similar Demographics by Self-Care Disability
Demographics Similar to Moroccans by Self-Care Disability
In terms of self-care disability, the demographic groups most similar to Moroccans are Soviet Union (2.5%, a difference of 0.050%), Sioux (2.5%, a difference of 0.11%), Ukrainian (2.5%, a difference of 0.11%), Immigrants from Eastern Europe (2.5%, a difference of 0.32%), and Immigrants from Oceania (2.5%, a difference of 0.33%).
| Demographics | Rating | Rank | Self-Care Disability |
| Yugoslavians | 36.1 /100 | #184 | Fair 2.5% |
| Slavs | 34.3 /100 | #185 | Fair 2.5% |
| Immigrants | El Salvador | 33.0 /100 | #186 | Fair 2.5% |
| Irish | 28.7 /100 | #187 | Fair 2.5% |
| Immigrants | Oceania | 28.3 /100 | #188 | Fair 2.5% |
| Immigrants | Eastern Europe | 28.0 /100 | #189 | Fair 2.5% |
| Sioux | 24.6 /100 | #190 | Fair 2.5% |
| Moroccans | 22.9 /100 | #191 | Fair 2.5% |
| Soviet Union | 22.2 /100 | #192 | Fair 2.5% |
| Ukrainians | 21.4 /100 | #193 | Fair 2.5% |
| Immigrants | Germany | 17.9 /100 | #194 | Poor 2.5% |
| Immigrants | Southern Europe | 15.6 /100 | #195 | Poor 2.5% |
| Koreans | 15.5 /100 | #196 | Poor 2.5% |
| Crow | 15.2 /100 | #197 | Poor 2.5% |
| Immigrants | Immigrants | 15.0 /100 | #198 | Poor 2.5% |
Demographics Similar to Croatians by Self-Care Disability
In terms of self-care disability, the demographic groups most similar to Croatians are Alsatian (2.4%, a difference of 0.030%), Bhutanese (2.4%, a difference of 0.13%), Carpatho Rusyn (2.4%, a difference of 0.17%), Immigrants from Scotland (2.4%, a difference of 0.18%), and Immigrants from Indonesia (2.4%, a difference of 0.18%).
| Demographics | Rating | Rank | Self-Care Disability |
| Immigrants | Asia | 96.9 /100 | #95 | Exceptional 2.4% |
| Immigrants | Chile | 96.7 /100 | #96 | Exceptional 2.4% |
| Swiss | 96.6 /100 | #97 | Exceptional 2.4% |
| Immigrants | Poland | 96.4 /100 | #98 | Exceptional 2.4% |
| Immigrants | Israel | 96.1 /100 | #99 | Exceptional 2.4% |
| Europeans | 95.8 /100 | #100 | Exceptional 2.4% |
| Immigrants | Scotland | 95.7 /100 | #101 | Exceptional 2.4% |
| Croatians | 95.0 /100 | #102 | Exceptional 2.4% |
| Alsatians | 94.9 /100 | #103 | Exceptional 2.4% |
| Bhutanese | 94.5 /100 | #104 | Exceptional 2.4% |
| Carpatho Rusyns | 94.4 /100 | #105 | Exceptional 2.4% |
| Immigrants | Indonesia | 94.3 /100 | #106 | Exceptional 2.4% |
| British | 94.3 /100 | #107 | Exceptional 2.4% |
| Greeks | 94.1 /100 | #108 | Exceptional 2.4% |
| Slovenes | 94.1 /100 | #109 | Exceptional 2.4% |