Immigrants from Trinidad and Tobago vs Haitian Self-Care Disability
COMPARE
Immigrants from Trinidad and Tobago
Haitian
Self-Care Disability
Self-Care Disability Comparison
Immigrants from Trinidad and Tobago
Haitians
2.7%
SELF-CARE DISABILITY
0.1/ 100
METRIC RATING
275th/ 347
METRIC RANK
2.6%
SELF-CARE DISABILITY
0.3/ 100
METRIC RATING
254th/ 347
METRIC RANK
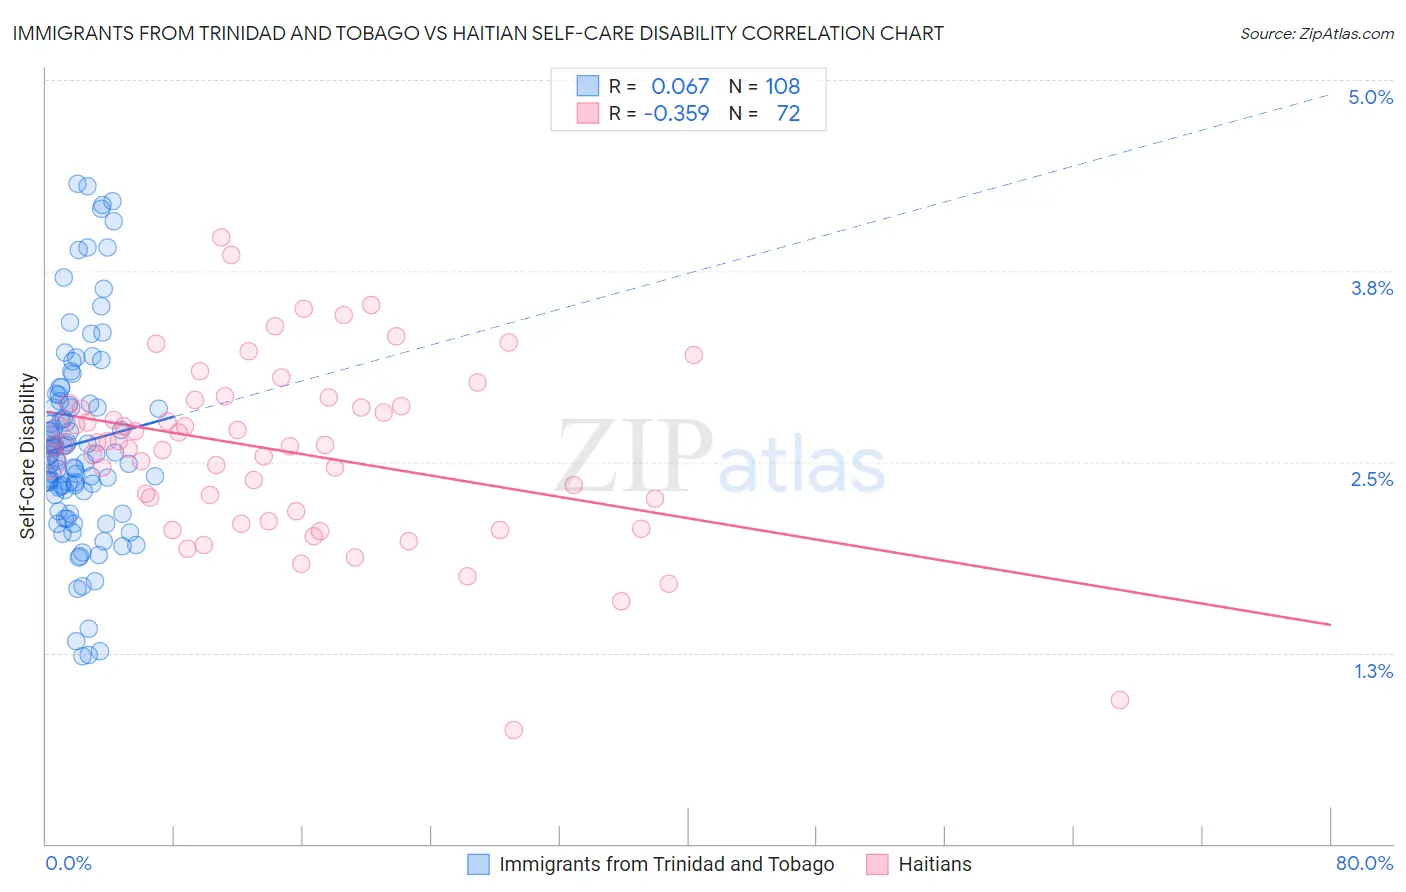
Immigrants from Trinidad and Tobago vs Haitian Self-Care Disability Correlation Chart
The statistical analysis conducted on geographies consisting of 223,419,964 people shows a slight positive correlation between the proportion of Immigrants from Trinidad and Tobago and percentage of population with self-care disability in the United States with a correlation coefficient (R) of 0.067 and weighted average of 2.7%. Similarly, the statistical analysis conducted on geographies consisting of 287,578,373 people shows a mild negative correlation between the proportion of Haitians and percentage of population with self-care disability in the United States with a correlation coefficient (R) of -0.359 and weighted average of 2.6%, a difference of 1.7%.
Self-Care Disability Correlation Summary
| Measurement | Immigrants from Trinidad and Tobago | Haitian |
| Minimum | 1.2% | 0.75% |
| Maximum | 4.3% | 4.0% |
| Range | 3.1% | 3.2% |
| Mean | 2.6% | 2.6% |
| Median | 2.6% | 2.6% |
| Interquartile 25% (IQ1) | 2.3% | 2.2% |
| Interquartile 75% (IQ3) | 2.9% | 2.9% |
| Interquartile Range (IQR) | 0.59% | 0.65% |
| Standard Deviation (Sample) | 0.66% | 0.58% |
| Standard Deviation (Population) | 0.66% | 0.58% |
Similar Demographics by Self-Care Disability
Demographics Similar to Immigrants from Trinidad and Tobago by Self-Care Disability
In terms of self-care disability, the demographic groups most similar to Immigrants from Trinidad and Tobago are Yakama (2.7%, a difference of 0.0%), Mexican (2.7%, a difference of 0.060%), Japanese (2.7%, a difference of 0.13%), Immigrants from Ukraine (2.7%, a difference of 0.19%), and Immigrants from Laos (2.7%, a difference of 0.20%).
| Demographics | Rating | Rank | Self-Care Disability |
| Immigrants | Mexico | 0.1 /100 | #268 | Tragic 2.7% |
| U.S. Virgin Islanders | 0.1 /100 | #269 | Tragic 2.7% |
| Immigrants | Micronesia | 0.1 /100 | #270 | Tragic 2.7% |
| Trinidadians and Tobagonians | 0.1 /100 | #271 | Tragic 2.7% |
| Immigrants | Laos | 0.1 /100 | #272 | Tragic 2.7% |
| Mexicans | 0.1 /100 | #273 | Tragic 2.7% |
| Yakama | 0.1 /100 | #274 | Tragic 2.7% |
| Immigrants | Trinidad and Tobago | 0.1 /100 | #275 | Tragic 2.7% |
| Japanese | 0.1 /100 | #276 | Tragic 2.7% |
| Immigrants | Ukraine | 0.1 /100 | #277 | Tragic 2.7% |
| Ottawa | 0.1 /100 | #278 | Tragic 2.7% |
| Iroquois | 0.1 /100 | #279 | Tragic 2.7% |
| Hispanics or Latinos | 0.1 /100 | #280 | Tragic 2.7% |
| Immigrants | Iraq | 0.0 /100 | #281 | Tragic 2.7% |
| Apache | 0.0 /100 | #282 | Tragic 2.7% |
Demographics Similar to Haitians by Self-Care Disability
In terms of self-care disability, the demographic groups most similar to Haitians are Immigrants from Haiti (2.6%, a difference of 0.020%), Tsimshian (2.6%, a difference of 0.040%), Immigrants from Central America (2.6%, a difference of 0.060%), Immigrants from Bangladesh (2.6%, a difference of 0.10%), and Immigrants from Liberia (2.6%, a difference of 0.17%).
| Demographics | Rating | Rank | Self-Care Disability |
| Immigrants | Albania | 0.6 /100 | #247 | Tragic 2.6% |
| Nicaraguans | 0.6 /100 | #248 | Tragic 2.6% |
| Mexican American Indians | 0.5 /100 | #249 | Tragic 2.6% |
| Portuguese | 0.4 /100 | #250 | Tragic 2.6% |
| Immigrants | Liberia | 0.4 /100 | #251 | Tragic 2.6% |
| Immigrants | Bangladesh | 0.4 /100 | #252 | Tragic 2.6% |
| Immigrants | Haiti | 0.3 /100 | #253 | Tragic 2.6% |
| Haitians | 0.3 /100 | #254 | Tragic 2.6% |
| Tsimshian | 0.3 /100 | #255 | Tragic 2.6% |
| Immigrants | Central America | 0.3 /100 | #256 | Tragic 2.6% |
| Potawatomi | 0.3 /100 | #257 | Tragic 2.6% |
| Immigrants | Nonimmigrants | 0.3 /100 | #258 | Tragic 2.6% |
| Immigrants | Belarus | 0.2 /100 | #259 | Tragic 2.6% |
| Chippewa | 0.2 /100 | #260 | Tragic 2.6% |
| Arapaho | 0.2 /100 | #261 | Tragic 2.6% |