Immigrants from Trinidad and Tobago vs Immigrants from Switzerland Self-Care Disability
COMPARE
Immigrants from Trinidad and Tobago
Immigrants from Switzerland
Self-Care Disability
Self-Care Disability Comparison
Immigrants from Trinidad and Tobago
Immigrants from Switzerland
2.7%
SELF-CARE DISABILITY
0.1/ 100
METRIC RATING
275th/ 347
METRIC RANK
2.3%
SELF-CARE DISABILITY
99.1/ 100
METRIC RATING
74th/ 347
METRIC RANK
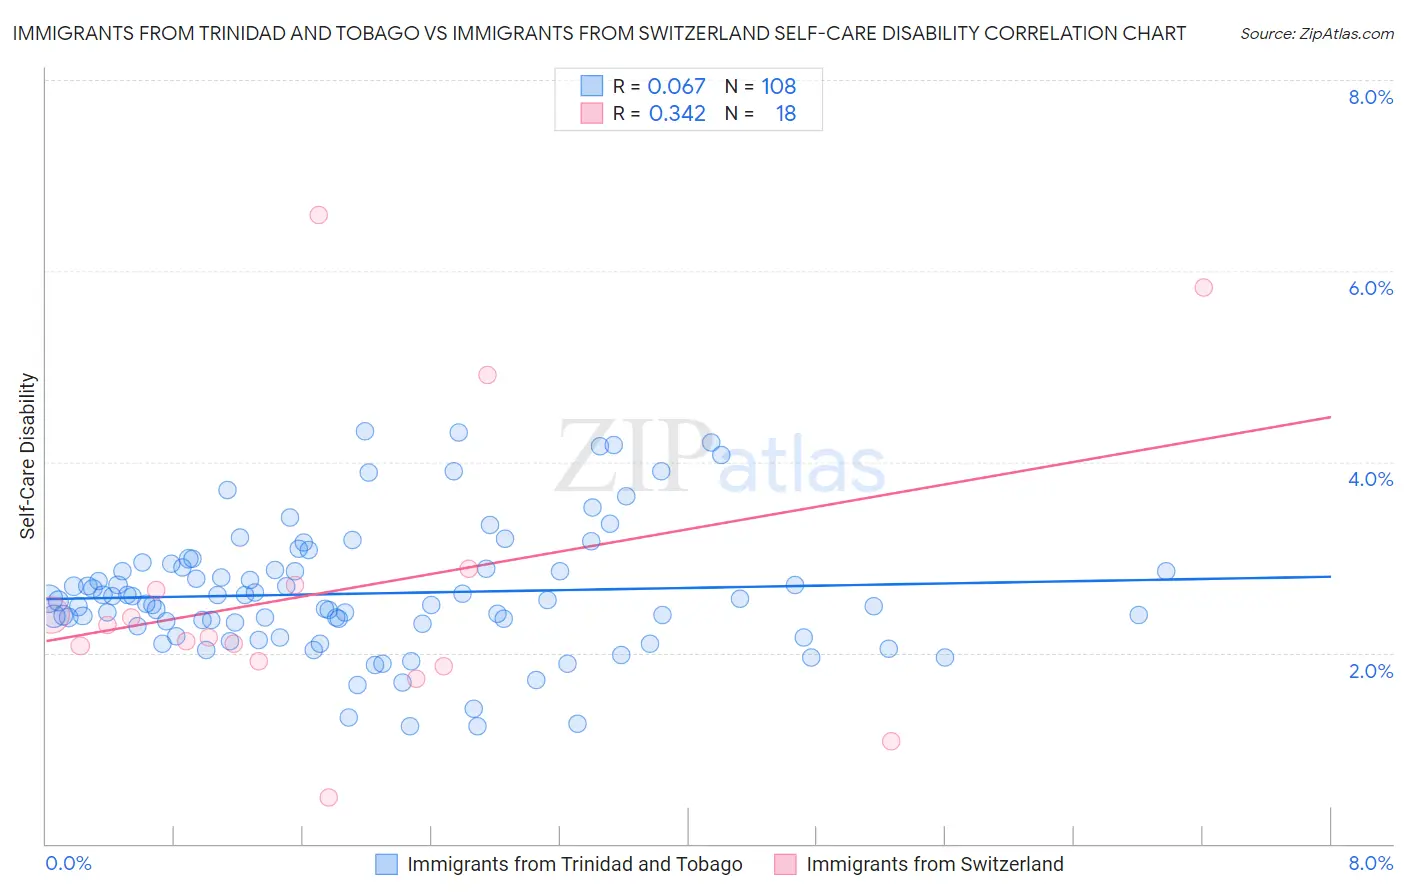
Immigrants from Trinidad and Tobago vs Immigrants from Switzerland Self-Care Disability Correlation Chart
The statistical analysis conducted on geographies consisting of 223,419,964 people shows a slight positive correlation between the proportion of Immigrants from Trinidad and Tobago and percentage of population with self-care disability in the United States with a correlation coefficient (R) of 0.067 and weighted average of 2.7%. Similarly, the statistical analysis conducted on geographies consisting of 148,009,249 people shows a mild positive correlation between the proportion of Immigrants from Switzerland and percentage of population with self-care disability in the United States with a correlation coefficient (R) of 0.342 and weighted average of 2.3%, a difference of 15.0%.
Self-Care Disability Correlation Summary
| Measurement | Immigrants from Trinidad and Tobago | Immigrants from Switzerland |
| Minimum | 1.2% | 0.48% |
| Maximum | 4.3% | 6.6% |
| Range | 3.1% | 6.1% |
| Mean | 2.6% | 2.7% |
| Median | 2.6% | 2.2% |
| Interquartile 25% (IQ1) | 2.3% | 1.9% |
| Interquartile 75% (IQ3) | 2.9% | 2.7% |
| Interquartile Range (IQR) | 0.59% | 0.81% |
| Standard Deviation (Sample) | 0.66% | 1.6% |
| Standard Deviation (Population) | 0.66% | 1.5% |
Similar Demographics by Self-Care Disability
Demographics Similar to Immigrants from Trinidad and Tobago by Self-Care Disability
In terms of self-care disability, the demographic groups most similar to Immigrants from Trinidad and Tobago are Yakama (2.7%, a difference of 0.0%), Mexican (2.7%, a difference of 0.060%), Japanese (2.7%, a difference of 0.13%), Immigrants from Ukraine (2.7%, a difference of 0.19%), and Immigrants from Laos (2.7%, a difference of 0.20%).
| Demographics | Rating | Rank | Self-Care Disability |
| Immigrants | Mexico | 0.1 /100 | #268 | Tragic 2.7% |
| U.S. Virgin Islanders | 0.1 /100 | #269 | Tragic 2.7% |
| Immigrants | Micronesia | 0.1 /100 | #270 | Tragic 2.7% |
| Trinidadians and Tobagonians | 0.1 /100 | #271 | Tragic 2.7% |
| Immigrants | Laos | 0.1 /100 | #272 | Tragic 2.7% |
| Mexicans | 0.1 /100 | #273 | Tragic 2.7% |
| Yakama | 0.1 /100 | #274 | Tragic 2.7% |
| Immigrants | Trinidad and Tobago | 0.1 /100 | #275 | Tragic 2.7% |
| Japanese | 0.1 /100 | #276 | Tragic 2.7% |
| Immigrants | Ukraine | 0.1 /100 | #277 | Tragic 2.7% |
| Ottawa | 0.1 /100 | #278 | Tragic 2.7% |
| Iroquois | 0.1 /100 | #279 | Tragic 2.7% |
| Hispanics or Latinos | 0.1 /100 | #280 | Tragic 2.7% |
| Immigrants | Iraq | 0.0 /100 | #281 | Tragic 2.7% |
| Apache | 0.0 /100 | #282 | Tragic 2.7% |
Demographics Similar to Immigrants from Switzerland by Self-Care Disability
In terms of self-care disability, the demographic groups most similar to Immigrants from Switzerland are Immigrants from Netherlands (2.3%, a difference of 0.040%), Immigrants from China (2.3%, a difference of 0.050%), Immigrants from Egypt (2.3%, a difference of 0.060%), Eastern European (2.3%, a difference of 0.090%), and Asian (2.3%, a difference of 0.12%).
| Demographics | Rating | Rank | Self-Care Disability |
| South Africans | 99.3 /100 | #67 | Exceptional 2.3% |
| Immigrants | Zaire | 99.2 /100 | #68 | Exceptional 2.3% |
| Immigrants | Norway | 99.2 /100 | #69 | Exceptional 2.3% |
| Immigrants | Northern Europe | 99.2 /100 | #70 | Exceptional 2.3% |
| Asians | 99.2 /100 | #71 | Exceptional 2.3% |
| Eastern Europeans | 99.2 /100 | #72 | Exceptional 2.3% |
| Immigrants | Egypt | 99.1 /100 | #73 | Exceptional 2.3% |
| Immigrants | Switzerland | 99.1 /100 | #74 | Exceptional 2.3% |
| Immigrants | Netherlands | 99.1 /100 | #75 | Exceptional 2.3% |
| Immigrants | China | 99.1 /100 | #76 | Exceptional 2.3% |
| Immigrants | Middle Africa | 99.0 /100 | #77 | Exceptional 2.3% |
| Immigrants | Ireland | 99.0 /100 | #78 | Exceptional 2.3% |
| Immigrants | Kenya | 99.0 /100 | #79 | Exceptional 2.3% |
| Chileans | 98.8 /100 | #80 | Exceptional 2.3% |
| Ugandans | 98.8 /100 | #81 | Exceptional 2.3% |