Immigrants from Trinidad and Tobago vs Central American Self-Care Disability
COMPARE
Immigrants from Trinidad and Tobago
Central American
Self-Care Disability
Self-Care Disability Comparison
Immigrants from Trinidad and Tobago
Central Americans
2.7%
SELF-CARE DISABILITY
0.1/ 100
METRIC RATING
275th/ 347
METRIC RANK
2.5%
SELF-CARE DISABILITY
8.7/ 100
METRIC RATING
208th/ 347
METRIC RANK
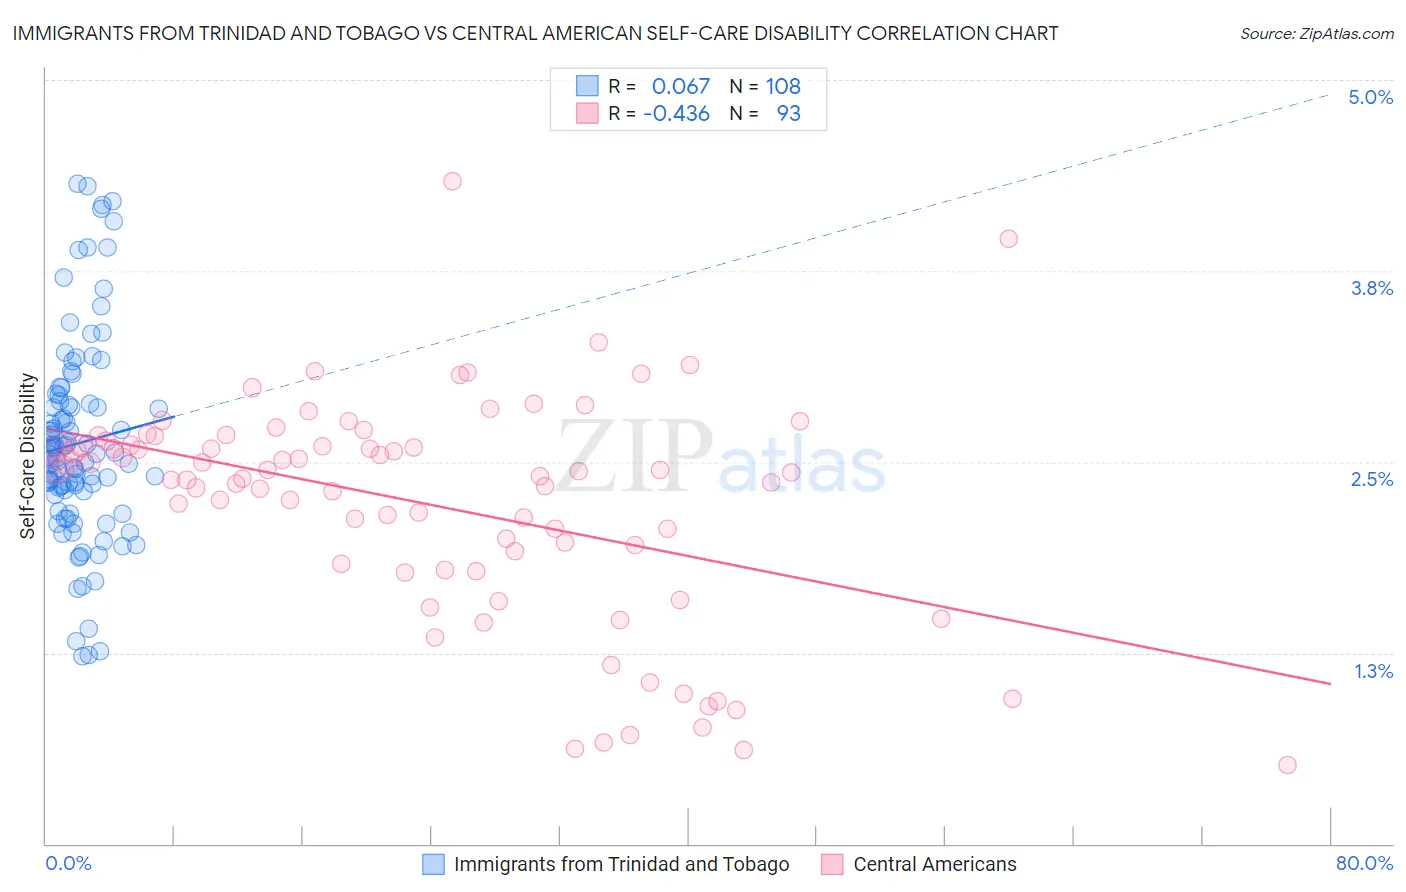
Immigrants from Trinidad and Tobago vs Central American Self-Care Disability Correlation Chart
The statistical analysis conducted on geographies consisting of 223,419,964 people shows a slight positive correlation between the proportion of Immigrants from Trinidad and Tobago and percentage of population with self-care disability in the United States with a correlation coefficient (R) of 0.067 and weighted average of 2.7%. Similarly, the statistical analysis conducted on geographies consisting of 503,524,295 people shows a moderate negative correlation between the proportion of Central Americans and percentage of population with self-care disability in the United States with a correlation coefficient (R) of -0.436 and weighted average of 2.5%, a difference of 5.6%.
Self-Care Disability Correlation Summary
| Measurement | Immigrants from Trinidad and Tobago | Central American |
| Minimum | 1.2% | 0.52% |
| Maximum | 4.3% | 4.3% |
| Range | 3.1% | 3.8% |
| Mean | 2.6% | 2.2% |
| Median | 2.6% | 2.4% |
| Interquartile 25% (IQ1) | 2.3% | 1.8% |
| Interquartile 75% (IQ3) | 2.9% | 2.6% |
| Interquartile Range (IQR) | 0.59% | 0.81% |
| Standard Deviation (Sample) | 0.66% | 0.74% |
| Standard Deviation (Population) | 0.66% | 0.73% |
Similar Demographics by Self-Care Disability
Demographics Similar to Immigrants from Trinidad and Tobago by Self-Care Disability
In terms of self-care disability, the demographic groups most similar to Immigrants from Trinidad and Tobago are Yakama (2.7%, a difference of 0.0%), Mexican (2.7%, a difference of 0.060%), Japanese (2.7%, a difference of 0.13%), Immigrants from Ukraine (2.7%, a difference of 0.19%), and Immigrants from Laos (2.7%, a difference of 0.20%).
| Demographics | Rating | Rank | Self-Care Disability |
| Immigrants | Mexico | 0.1 /100 | #268 | Tragic 2.7% |
| U.S. Virgin Islanders | 0.1 /100 | #269 | Tragic 2.7% |
| Immigrants | Micronesia | 0.1 /100 | #270 | Tragic 2.7% |
| Trinidadians and Tobagonians | 0.1 /100 | #271 | Tragic 2.7% |
| Immigrants | Laos | 0.1 /100 | #272 | Tragic 2.7% |
| Mexicans | 0.1 /100 | #273 | Tragic 2.7% |
| Yakama | 0.1 /100 | #274 | Tragic 2.7% |
| Immigrants | Trinidad and Tobago | 0.1 /100 | #275 | Tragic 2.7% |
| Japanese | 0.1 /100 | #276 | Tragic 2.7% |
| Immigrants | Ukraine | 0.1 /100 | #277 | Tragic 2.7% |
| Ottawa | 0.1 /100 | #278 | Tragic 2.7% |
| Iroquois | 0.1 /100 | #279 | Tragic 2.7% |
| Hispanics or Latinos | 0.1 /100 | #280 | Tragic 2.7% |
| Immigrants | Iraq | 0.0 /100 | #281 | Tragic 2.7% |
| Apache | 0.0 /100 | #282 | Tragic 2.7% |
Demographics Similar to Central Americans by Self-Care Disability
In terms of self-care disability, the demographic groups most similar to Central Americans are Malaysian (2.5%, a difference of 0.15%), French (2.5%, a difference of 0.16%), Alaskan Athabascan (2.5%, a difference of 0.23%), Immigrants from Russia (2.5%, a difference of 0.31%), and Panamanian (2.5%, a difference of 0.38%).
| Demographics | Rating | Rank | Self-Care Disability |
| Immigrants | South Eastern Asia | 12.9 /100 | #201 | Poor 2.5% |
| Slovaks | 12.6 /100 | #202 | Poor 2.5% |
| Immigrants | Lebanon | 12.4 /100 | #203 | Poor 2.5% |
| Immigrants | Bahamas | 11.9 /100 | #204 | Poor 2.5% |
| Immigrants | Russia | 11.0 /100 | #205 | Poor 2.5% |
| Alaskan Athabascans | 10.4 /100 | #206 | Poor 2.5% |
| French | 9.9 /100 | #207 | Tragic 2.5% |
| Central Americans | 8.7 /100 | #208 | Tragic 2.5% |
| Malaysians | 7.7 /100 | #209 | Tragic 2.5% |
| Panamanians | 6.4 /100 | #210 | Tragic 2.5% |
| Native Hawaiians | 5.1 /100 | #211 | Tragic 2.6% |
| Samoans | 5.1 /100 | #212 | Tragic 2.6% |
| Ecuadorians | 4.7 /100 | #213 | Tragic 2.6% |
| Immigrants | Honduras | 4.7 /100 | #214 | Tragic 2.6% |
| Immigrants | Thailand | 4.5 /100 | #215 | Tragic 2.6% |