British vs Chickasaw Self-Care Disability
COMPARE
British
Chickasaw
Self-Care Disability
Self-Care Disability Comparison
British
Chickasaw
2.4%
SELF-CARE DISABILITY
94.3/ 100
METRIC RATING
107th/ 347
METRIC RANK
2.9%
SELF-CARE DISABILITY
0.0/ 100
METRIC RATING
320th/ 347
METRIC RANK
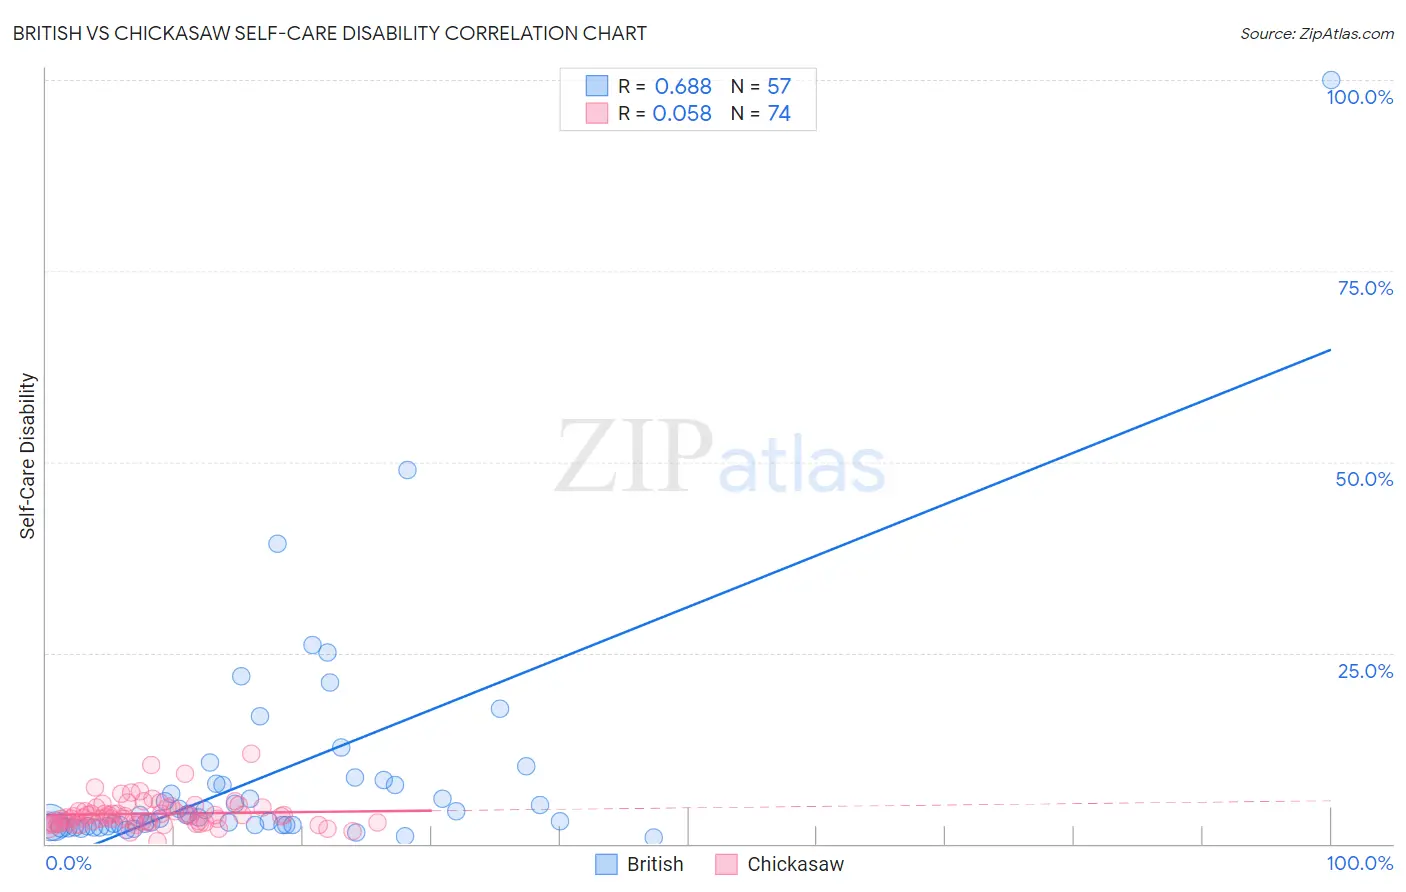
British vs Chickasaw Self-Care Disability Correlation Chart
The statistical analysis conducted on geographies consisting of 530,052,811 people shows a significant positive correlation between the proportion of British and percentage of population with self-care disability in the United States with a correlation coefficient (R) of 0.688 and weighted average of 2.4%. Similarly, the statistical analysis conducted on geographies consisting of 147,605,375 people shows a slight positive correlation between the proportion of Chickasaw and percentage of population with self-care disability in the United States with a correlation coefficient (R) of 0.058 and weighted average of 2.9%, a difference of 19.9%.
Self-Care Disability Correlation Summary
| Measurement | British | Chickasaw |
| Minimum | 0.87% | 0.38% |
| Maximum | 100.0% | 11.8% |
| Range | 99.1% | 11.4% |
| Mean | 9.0% | 3.9% |
| Median | 3.7% | 3.5% |
| Interquartile 25% (IQ1) | 2.4% | 2.7% |
| Interquartile 75% (IQ3) | 8.0% | 4.7% |
| Interquartile Range (IQR) | 5.6% | 2.0% |
| Standard Deviation (Sample) | 15.4% | 1.9% |
| Standard Deviation (Population) | 15.3% | 1.9% |
Similar Demographics by Self-Care Disability
Demographics Similar to British by Self-Care Disability
In terms of self-care disability, the demographic groups most similar to British are Immigrants from Indonesia (2.4%, a difference of 0.010%), Carpatho Rusyn (2.4%, a difference of 0.020%), Greek (2.4%, a difference of 0.030%), Slovene (2.4%, a difference of 0.040%), and Bhutanese (2.4%, a difference of 0.050%).
| Demographics | Rating | Rank | Self-Care Disability |
| Europeans | 95.8 /100 | #100 | Exceptional 2.4% |
| Immigrants | Scotland | 95.7 /100 | #101 | Exceptional 2.4% |
| Croatians | 95.0 /100 | #102 | Exceptional 2.4% |
| Alsatians | 94.9 /100 | #103 | Exceptional 2.4% |
| Bhutanese | 94.5 /100 | #104 | Exceptional 2.4% |
| Carpatho Rusyns | 94.4 /100 | #105 | Exceptional 2.4% |
| Immigrants | Indonesia | 94.3 /100 | #106 | Exceptional 2.4% |
| British | 94.3 /100 | #107 | Exceptional 2.4% |
| Greeks | 94.1 /100 | #108 | Exceptional 2.4% |
| Slovenes | 94.1 /100 | #109 | Exceptional 2.4% |
| Immigrants | Africa | 93.7 /100 | #110 | Exceptional 2.4% |
| Serbians | 93.6 /100 | #111 | Exceptional 2.4% |
| Scandinavians | 93.5 /100 | #112 | Exceptional 2.4% |
| South Americans | 93.2 /100 | #113 | Exceptional 2.4% |
| Immigrants | North Macedonia | 93.1 /100 | #114 | Exceptional 2.4% |
Demographics Similar to Chickasaw by Self-Care Disability
In terms of self-care disability, the demographic groups most similar to Chickasaw are Navajo (2.9%, a difference of 0.15%), Spanish American Indian (2.9%, a difference of 0.22%), Assyrian/Chaldean/Syriac (2.8%, a difference of 0.37%), Immigrants from Dominica (2.8%, a difference of 0.38%), and Comanche (2.9%, a difference of 0.47%).
| Demographics | Rating | Rank | Self-Care Disability |
| Spanish Americans | 0.0 /100 | #313 | Tragic 2.8% |
| Creek | 0.0 /100 | #314 | Tragic 2.8% |
| Immigrants | Cuba | 0.0 /100 | #315 | Tragic 2.8% |
| Menominee | 0.0 /100 | #316 | Tragic 2.8% |
| Immigrants | Dominica | 0.0 /100 | #317 | Tragic 2.8% |
| Assyrians/Chaldeans/Syriacs | 0.0 /100 | #318 | Tragic 2.8% |
| Spanish American Indians | 0.0 /100 | #319 | Tragic 2.9% |
| Chickasaw | 0.0 /100 | #320 | Tragic 2.9% |
| Navajo | 0.0 /100 | #321 | Tragic 2.9% |
| Comanche | 0.0 /100 | #322 | Tragic 2.9% |
| Seminole | 0.0 /100 | #323 | Tragic 2.9% |
| Cherokee | 0.0 /100 | #324 | Tragic 2.9% |
| Immigrants | Uzbekistan | 0.0 /100 | #325 | Tragic 2.9% |
| Paiute | 0.0 /100 | #326 | Tragic 2.9% |
| Blacks/African Americans | 0.0 /100 | #327 | Tragic 2.9% |