British vs Bermudan Self-Care Disability
COMPARE
British
Bermudan
Self-Care Disability
Self-Care Disability Comparison
British
Bermudans
2.4%
SELF-CARE DISABILITY
94.3/ 100
METRIC RATING
107th/ 347
METRIC RANK
2.6%
SELF-CARE DISABILITY
1.9/ 100
METRIC RATING
236th/ 347
METRIC RANK
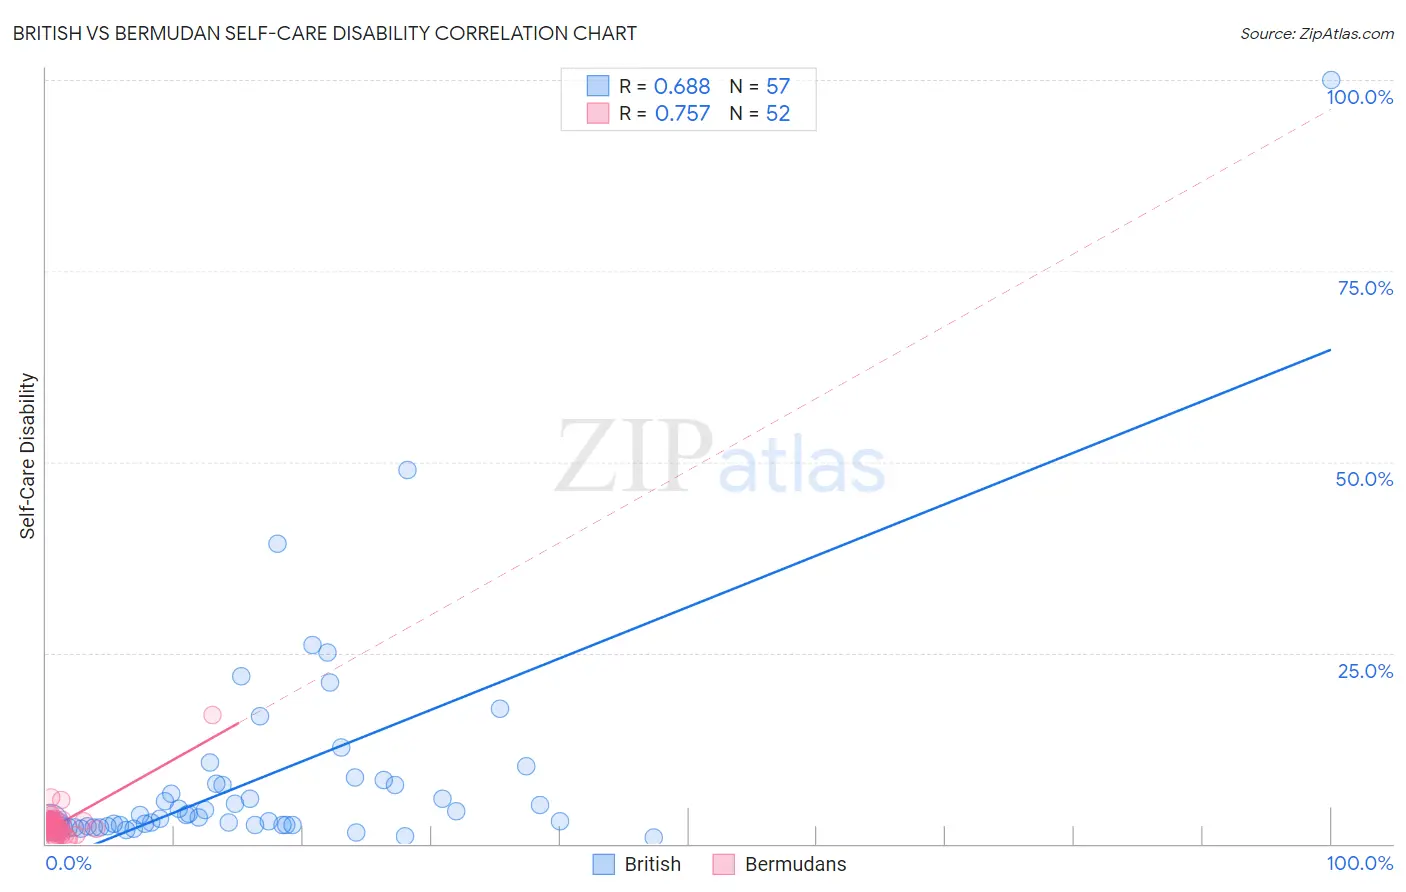
British vs Bermudan Self-Care Disability Correlation Chart
The statistical analysis conducted on geographies consisting of 530,052,811 people shows a significant positive correlation between the proportion of British and percentage of population with self-care disability in the United States with a correlation coefficient (R) of 0.688 and weighted average of 2.4%. Similarly, the statistical analysis conducted on geographies consisting of 55,721,549 people shows a strong positive correlation between the proportion of Bermudans and percentage of population with self-care disability in the United States with a correlation coefficient (R) of 0.757 and weighted average of 2.6%, a difference of 8.3%.
Self-Care Disability Correlation Summary
| Measurement | British | Bermudan |
| Minimum | 0.87% | 0.52% |
| Maximum | 100.0% | 16.9% |
| Range | 99.1% | 16.3% |
| Mean | 9.0% | 2.6% |
| Median | 3.7% | 2.3% |
| Interquartile 25% (IQ1) | 2.4% | 1.5% |
| Interquartile 75% (IQ3) | 8.0% | 2.9% |
| Interquartile Range (IQR) | 5.6% | 1.4% |
| Standard Deviation (Sample) | 15.4% | 2.3% |
| Standard Deviation (Population) | 15.3% | 2.3% |
Similar Demographics by Self-Care Disability
Demographics Similar to British by Self-Care Disability
In terms of self-care disability, the demographic groups most similar to British are Immigrants from Indonesia (2.4%, a difference of 0.010%), Carpatho Rusyn (2.4%, a difference of 0.020%), Greek (2.4%, a difference of 0.030%), Slovene (2.4%, a difference of 0.040%), and Bhutanese (2.4%, a difference of 0.050%).
| Demographics | Rating | Rank | Self-Care Disability |
| Europeans | 95.8 /100 | #100 | Exceptional 2.4% |
| Immigrants | Scotland | 95.7 /100 | #101 | Exceptional 2.4% |
| Croatians | 95.0 /100 | #102 | Exceptional 2.4% |
| Alsatians | 94.9 /100 | #103 | Exceptional 2.4% |
| Bhutanese | 94.5 /100 | #104 | Exceptional 2.4% |
| Carpatho Rusyns | 94.4 /100 | #105 | Exceptional 2.4% |
| Immigrants | Indonesia | 94.3 /100 | #106 | Exceptional 2.4% |
| British | 94.3 /100 | #107 | Exceptional 2.4% |
| Greeks | 94.1 /100 | #108 | Exceptional 2.4% |
| Slovenes | 94.1 /100 | #109 | Exceptional 2.4% |
| Immigrants | Africa | 93.7 /100 | #110 | Exceptional 2.4% |
| Serbians | 93.6 /100 | #111 | Exceptional 2.4% |
| Scandinavians | 93.5 /100 | #112 | Exceptional 2.4% |
| South Americans | 93.2 /100 | #113 | Exceptional 2.4% |
| Immigrants | North Macedonia | 93.1 /100 | #114 | Exceptional 2.4% |
Demographics Similar to Bermudans by Self-Care Disability
In terms of self-care disability, the demographic groups most similar to Bermudans are Bahamian (2.6%, a difference of 0.070%), Vietnamese (2.6%, a difference of 0.10%), Liberian (2.6%, a difference of 0.11%), Albanian (2.6%, a difference of 0.15%), and Immigrants from Guatemala (2.6%, a difference of 0.18%).
| Demographics | Rating | Rank | Self-Care Disability |
| Guamanians/Chamorros | 2.5 /100 | #229 | Tragic 2.6% |
| Immigrants | Ecuador | 2.5 /100 | #230 | Tragic 2.6% |
| Immigrants | Guatemala | 2.2 /100 | #231 | Tragic 2.6% |
| Albanians | 2.2 /100 | #232 | Tragic 2.6% |
| Liberians | 2.1 /100 | #233 | Tragic 2.6% |
| Vietnamese | 2.1 /100 | #234 | Tragic 2.6% |
| Bahamians | 2.0 /100 | #235 | Tragic 2.6% |
| Bermudans | 1.9 /100 | #236 | Tragic 2.6% |
| Immigrants | Senegal | 1.6 /100 | #237 | Tragic 2.6% |
| Senegalese | 1.3 /100 | #238 | Tragic 2.6% |
| Immigrants | Panama | 1.2 /100 | #239 | Tragic 2.6% |
| Marshallese | 1.2 /100 | #240 | Tragic 2.6% |
| Immigrants | Syria | 1.0 /100 | #241 | Tragic 2.6% |
| Spanish | 0.8 /100 | #242 | Tragic 2.6% |
| Hawaiians | 0.8 /100 | #243 | Tragic 2.6% |