Sulphur Springs, AR Map & Demographics
Sulphur Springs Map
Sulphur Springs Overview
$33,472
PER CAPITA INCOME
$51,422
AVG FAMILY INCOME
$32,275
AVG HOUSEHOLD INCOME
17.6%
WAGE / INCOME GAP [ % ]
82.4¢/ $1
WAGE / INCOME GAP [ $ ]
$14,162
FAMILY INCOME DEFICIT
0.61
INEQUALITY / GINI INDEX
1,119
TOTAL POPULATION
546
MALE POPULATION
573
FEMALE POPULATION
95.29
MALES / 100 FEMALES
104.95
FEMALES / 100 MALES
37.3
MEDIAN AGE
3.0
AVG FAMILY SIZE
2.5
AVG HOUSEHOLD SIZE
400
LABOR FORCE [ PEOPLE ]
44.8%
PERCENT IN LABOR FORCE
Sulphur Springs Zip Codes
Sulphur Springs Area Codes
Income in Sulphur Springs
Income Overview in Sulphur Springs
Per Capita Income in Sulphur Springs is $33,472, while median incomes of families and households are $51,422 and $32,275 respectively.
| Characteristic | Number | Measure |
| Per Capita Income | 1,119 | $33,472 |
| Median Family Income | 314 | $51,422 |
| Mean Family Income | 314 | $87,103 |
| Median Household Income | 455 | $32,275 |
| Mean Household Income | 455 | $71,112 |
| Income Deficit | 314 | $14,162 |
| Wage / Income Gap (%) | 1,119 | 17.59% |
| Wage / Income Gap ($) | 1,119 | 82.41¢ per $1 |
| Gini / Inequality Index | 1,119 | 0.61 |
Earnings by Sex in Sulphur Springs
Average Earnings in Sulphur Springs are $36,174, $36,212 for men and $29,844 for women, a difference of 17.6%.
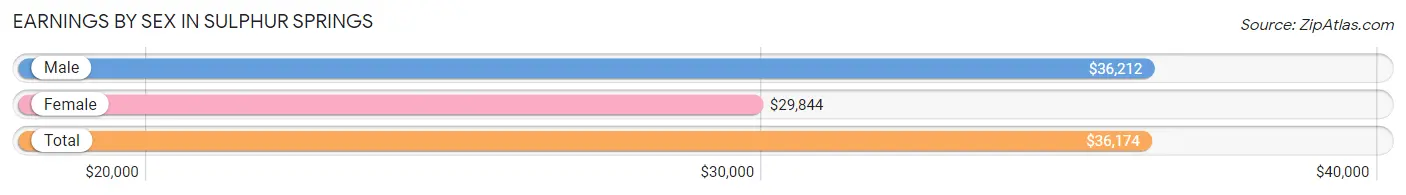
| Sex | Number | Average Earnings |
| Male | 227 (51.8%) | $36,212 |
| Female | 211 (48.2%) | $29,844 |
| Total | 438 (100.0%) | $36,174 |
Earnings by Sex by Income Bracket in Sulphur Springs
The most common earnings brackets in Sulphur Springs are $25,000 to $29,999 for men (68 | 30.0%) and $20,000 to $22,499 for women (51 | 24.2%).
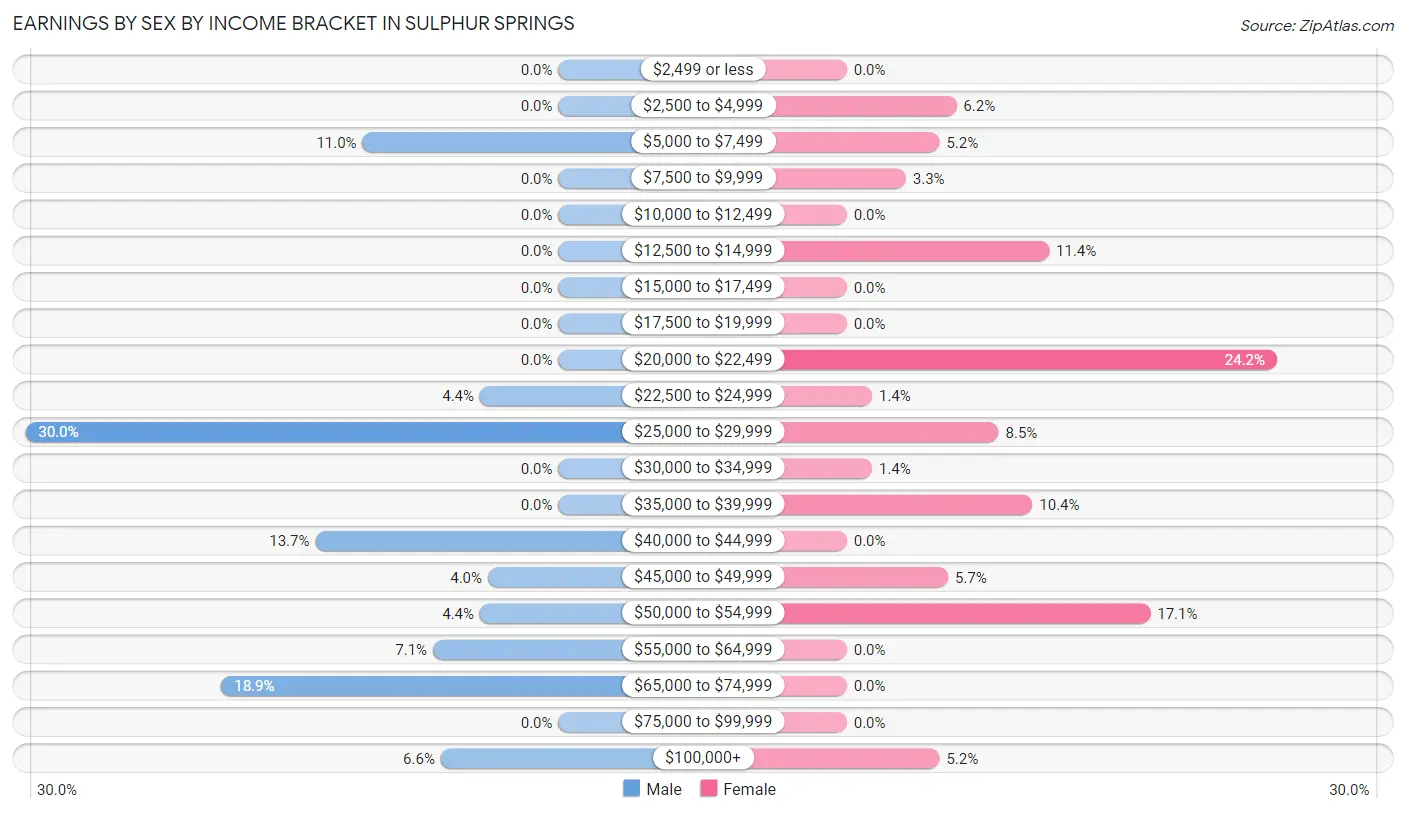
| Income | Male | Female |
| $2,499 or less | 0 (0.0%) | 0 (0.0%) |
| $2,500 to $4,999 | 0 (0.0%) | 13 (6.2%) |
| $5,000 to $7,499 | 25 (11.0%) | 11 (5.2%) |
| $7,500 to $9,999 | 0 (0.0%) | 7 (3.3%) |
| $10,000 to $12,499 | 0 (0.0%) | 0 (0.0%) |
| $12,500 to $14,999 | 0 (0.0%) | 24 (11.4%) |
| $15,000 to $17,499 | 0 (0.0%) | 0 (0.0%) |
| $17,500 to $19,999 | 0 (0.0%) | 0 (0.0%) |
| $20,000 to $22,499 | 0 (0.0%) | 51 (24.2%) |
| $22,500 to $24,999 | 10 (4.4%) | 3 (1.4%) |
| $25,000 to $29,999 | 68 (30.0%) | 18 (8.5%) |
| $30,000 to $34,999 | 0 (0.0%) | 3 (1.4%) |
| $35,000 to $39,999 | 0 (0.0%) | 22 (10.4%) |
| $40,000 to $44,999 | 31 (13.7%) | 0 (0.0%) |
| $45,000 to $49,999 | 9 (4.0%) | 12 (5.7%) |
| $50,000 to $54,999 | 10 (4.4%) | 36 (17.1%) |
| $55,000 to $64,999 | 16 (7.0%) | 0 (0.0%) |
| $65,000 to $74,999 | 43 (18.9%) | 0 (0.0%) |
| $75,000 to $99,999 | 0 (0.0%) | 0 (0.0%) |
| $100,000+ | 15 (6.6%) | 11 (5.2%) |
| Total | 227 (100.0%) | 211 (100.0%) |
Earnings by Sex by Educational Attainment in Sulphur Springs
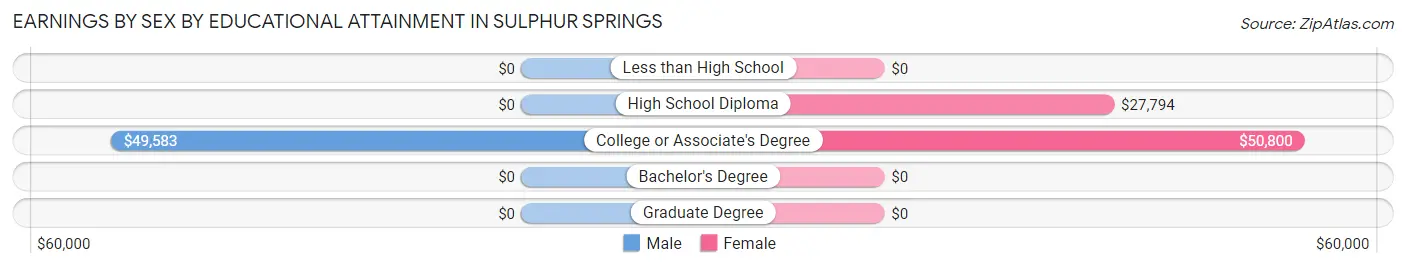
| Educational Attainment | Male Income | Female Income |
| Less than High School | - | - |
| High School Diploma | - | - |
| College or Associate's Degree | $49,583 | $50,800 |
| Bachelor's Degree | - | - |
| Graduate Degree | - | - |
| Total | $41,691 | $0 |
Family Income in Sulphur Springs
Family Income Brackets in Sulphur Springs
According to the Sulphur Springs family income data, there are 77 families falling into the $50,000 to $74,999 income range, which is the most common income bracket and makes up 24.5% of all families.
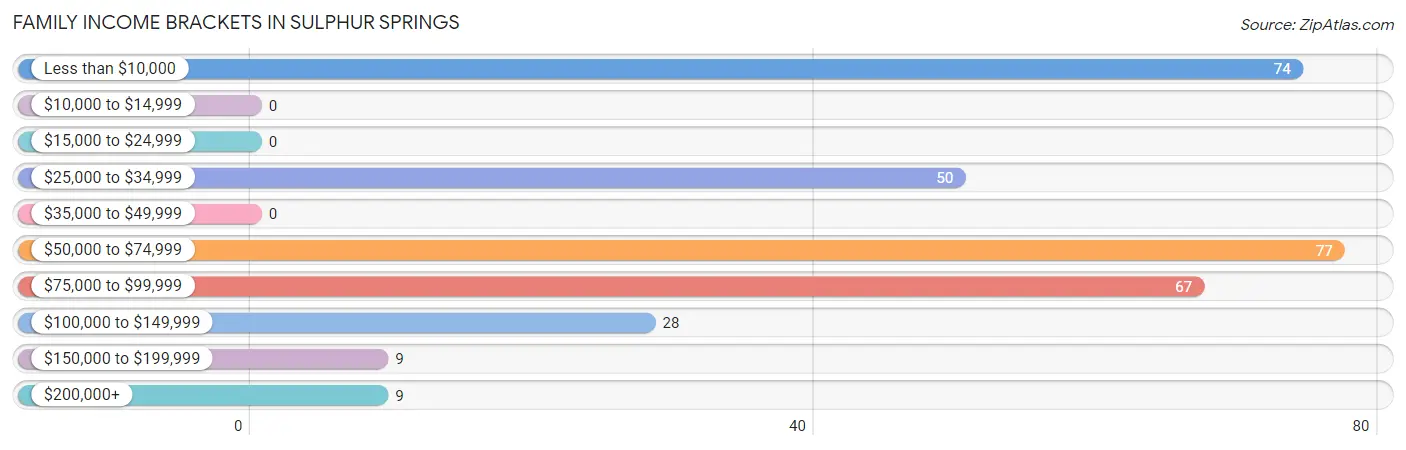
| Income Bracket | # Families | % Families |
| Less than $10,000 | 74 | 23.6% |
| $10,000 to $14,999 | 0 | 0.0% |
| $15,000 to $24,999 | 0 | 0.0% |
| $25,000 to $34,999 | 50 | 15.9% |
| $35,000 to $49,999 | 0 | 0.0% |
| $50,000 to $74,999 | 77 | 24.5% |
| $75,000 to $99,999 | 67 | 21.3% |
| $100,000 to $149,999 | 28 | 8.9% |
| $150,000 to $199,999 | 9 | 2.9% |
| $200,000+ | 9 | 2.9% |
Family Income by Famaliy Size in Sulphur Springs
2-person families (148 | 47.1%) account for the highest median family income in Sulphur Springs with $51,364 per family, while 2-person families (148 | 47.1%) have the highest median income of $25,682 per family member.
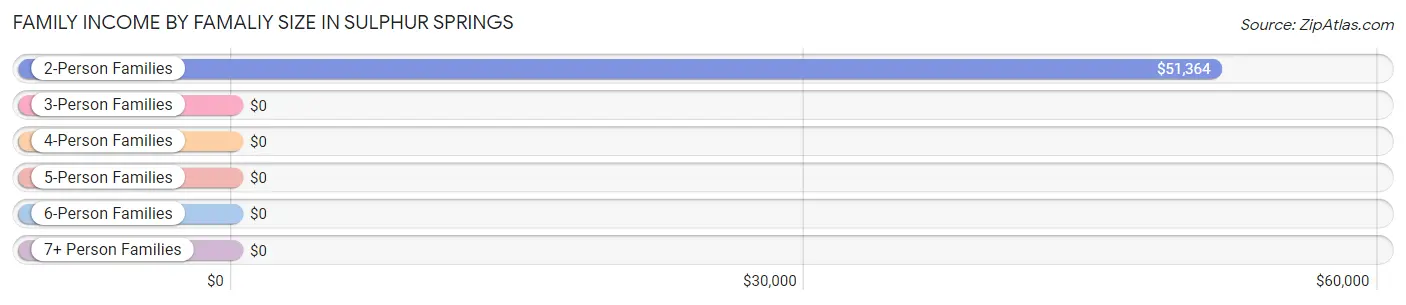
| Income Bracket | # Families | Median Income |
| 2-Person Families | 148 (47.1%) | $51,364 |
| 3-Person Families | 126 (40.1%) | $0 |
| 4-Person Families | 24 (7.6%) | $0 |
| 5-Person Families | 0 (0.0%) | $0 |
| 6-Person Families | 16 (5.1%) | $0 |
| 7+ Person Families | 0 (0.0%) | $0 |
| Total | 314 (100.0%) | $51,422 |
Family Income by Number of Earners in Sulphur Springs
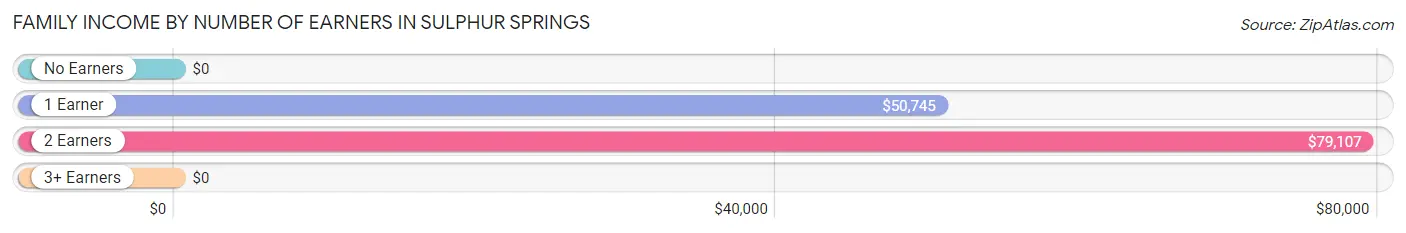
| Number of Earners | # Families | Median Income |
| No Earners | 121 (38.5%) | $0 |
| 1 Earner | 113 (36.0%) | $50,745 |
| 2 Earners | 56 (17.8%) | $79,107 |
| 3+ Earners | 24 (7.6%) | $0 |
| Total | 314 (100.0%) | $51,422 |
Household Income in Sulphur Springs
Household Income Brackets in Sulphur Springs
With 114 households falling in the category, the $25,000 to $34,999 income range is the most frequent in Sulphur Springs, accounting for 25.1% of all households.
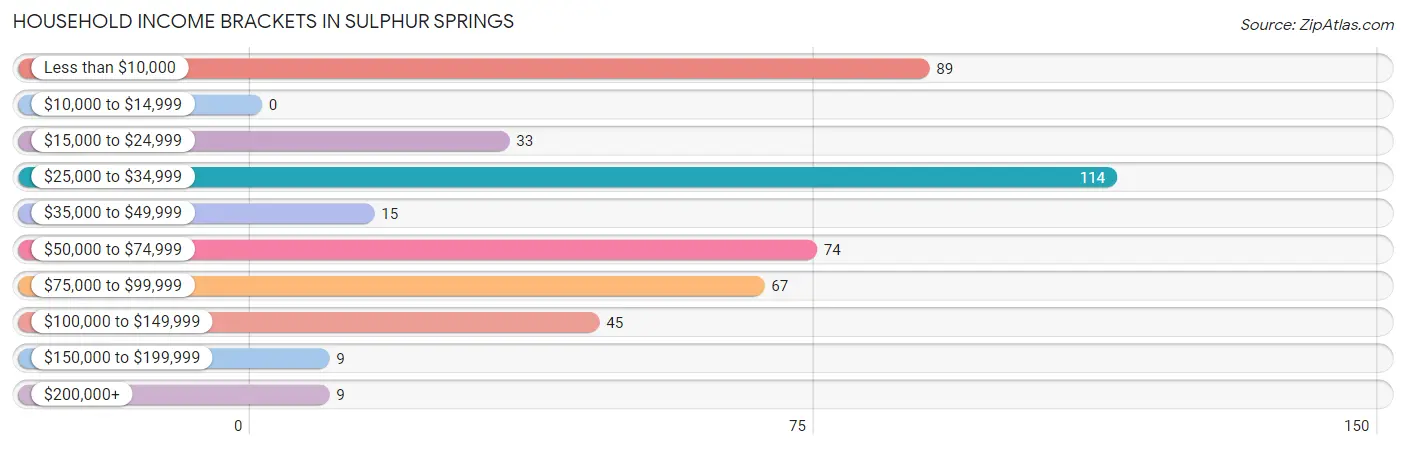
| Income Bracket | # Households | % Households |
| Less than $10,000 | 89 | 19.6% |
| $10,000 to $14,999 | 0 | 0.0% |
| $15,000 to $24,999 | 33 | 7.3% |
| $25,000 to $34,999 | 114 | 25.1% |
| $35,000 to $49,999 | 15 | 3.3% |
| $50,000 to $74,999 | 74 | 16.3% |
| $75,000 to $99,999 | 67 | 14.7% |
| $100,000 to $149,999 | 45 | 9.9% |
| $150,000 to $199,999 | 9 | 2.0% |
| $200,000+ | 9 | 2.0% |
Household Income by Householder Age in Sulphur Springs
| Income Bracket | # Households | Median Income |
| 15 to 24 Years | 8 (1.8%) | $0 |
| 25 to 44 Years | 147 (32.3%) | $0 |
| 45 to 64 Years | 132 (29.0%) | $0 |
| 65+ Years | 168 (36.9%) | $0 |
| Total | 455 (100.0%) | $32,275 |
Poverty in Sulphur Springs
Income Below Poverty by Sex and Age in Sulphur Springs
With 15.2% poverty level for males and 16.6% for females among the residents of Sulphur Springs, 75 year old and over males and under 5 year old females are the most vulnerable to poverty, with 23 males (60.5%) and 28 females (100.0%) in their respective age groups living below the poverty level.
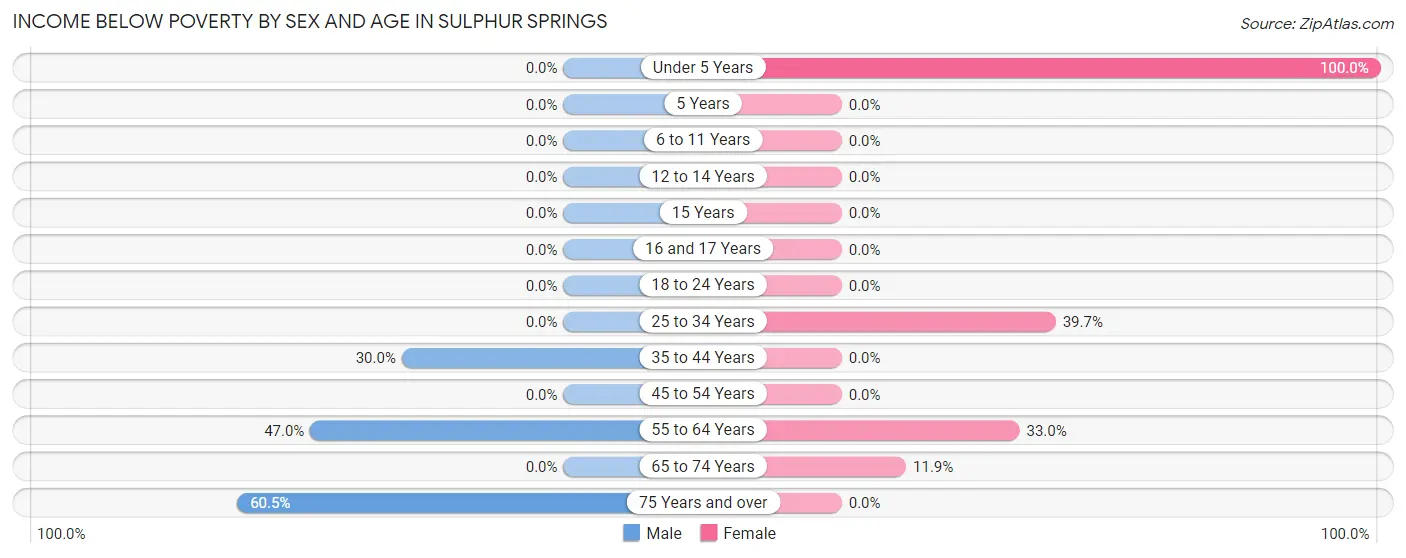
| Age Bracket | Male | Female |
| Under 5 Years | 0 (0.0%) | 28 (100.0%) |
| 5 Years | 0 (0.0%) | 0 (0.0%) |
| 6 to 11 Years | 0 (0.0%) | 0 (0.0%) |
| 12 to 14 Years | 0 (0.0%) | 0 (0.0%) |
| 15 Years | 0 (0.0%) | 0 (0.0%) |
| 16 and 17 Years | 0 (0.0%) | 0 (0.0%) |
| 18 to 24 Years | 0 (0.0%) | 0 (0.0%) |
| 25 to 34 Years | 0 (0.0%) | 27 (39.7%) |
| 35 to 44 Years | 21 (30.0%) | 0 (0.0%) |
| 45 to 54 Years | 0 (0.0%) | 0 (0.0%) |
| 55 to 64 Years | 39 (47.0%) | 32 (33.0%) |
| 65 to 74 Years | 0 (0.0%) | 8 (11.9%) |
| 75 Years and over | 23 (60.5%) | 0 (0.0%) |
| Total | 83 (15.2%) | 95 (16.6%) |
Income Above Poverty by Sex and Age in Sulphur Springs
According to the poverty statistics in Sulphur Springs, males aged under 5 years and females aged 6 to 11 years are the age groups that are most secure financially, with 100.0% of males and 100.0% of females in these age groups living above the poverty line.
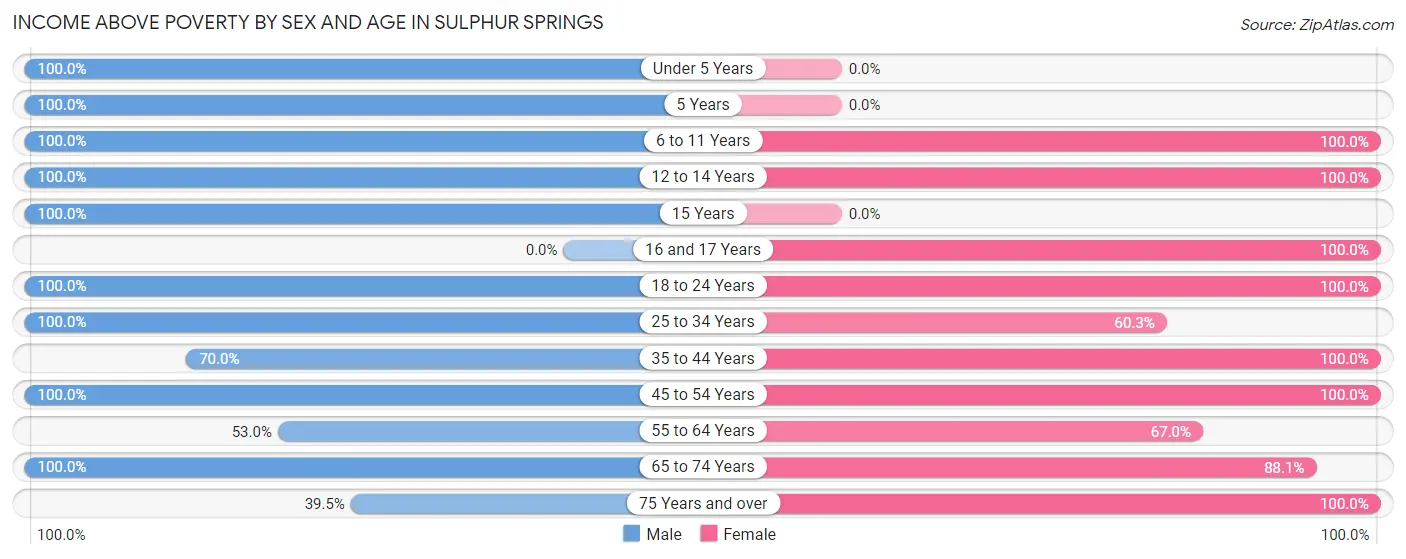
| Age Bracket | Male | Female |
| Under 5 Years | 34 (100.0%) | 0 (0.0%) |
| 5 Years | 33 (100.0%) | 0 (0.0%) |
| 6 to 11 Years | 53 (100.0%) | 18 (100.0%) |
| 12 to 14 Years | 21 (100.0%) | 30 (100.0%) |
| 15 Years | 10 (100.0%) | 0 (0.0%) |
| 16 and 17 Years | 0 (0.0%) | 22 (100.0%) |
| 18 to 24 Years | 14 (100.0%) | 60 (100.0%) |
| 25 to 34 Years | 95 (100.0%) | 41 (60.3%) |
| 35 to 44 Years | 49 (70.0%) | 64 (100.0%) |
| 45 to 54 Years | 9 (100.0%) | 28 (100.0%) |
| 55 to 64 Years | 44 (53.0%) | 65 (67.0%) |
| 65 to 74 Years | 86 (100.0%) | 59 (88.1%) |
| 75 Years and over | 15 (39.5%) | 91 (100.0%) |
| Total | 463 (84.8%) | 478 (83.4%) |
Income Below Poverty Among Married-Couple Families in Sulphur Springs
The poverty statistics for married-couple families in Sulphur Springs show that 26.5% or 74 of the total 279 families live below the poverty line. Families with 1 or 2 children have the highest poverty rate of 28.1%, comprising of 27 families. On the other hand, families with 3 or 4 children have the lowest poverty rate of 0.0%, which includes 0 families.
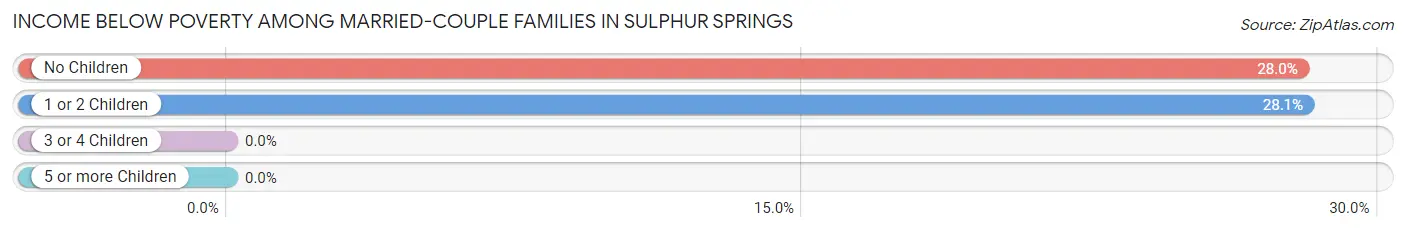
| Children | Above Poverty | Below Poverty |
| No Children | 121 (72.0%) | 47 (28.0%) |
| 1 or 2 Children | 69 (71.9%) | 27 (28.1%) |
| 3 or 4 Children | 15 (100.0%) | 0 (0.0%) |
| 5 or more Children | 0 (0.0%) | 0 (0.0%) |
| Total | 205 (73.5%) | 74 (26.5%) |
Income Below Poverty Among Single-Parent Households in Sulphur Springs
| Children | Single Father | Single Mother |
| No Children | 0 (0.0%) | 0 (0.0%) |
| 1 or 2 Children | 0 (0.0%) | 0 (0.0%) |
| 3 or 4 Children | 0 (0.0%) | 0 (0.0%) |
| 5 or more Children | 0 (0.0%) | 0 (0.0%) |
| Total | 0 (0.0%) | 0 (0.0%) |
Income Below Poverty Among Married-Couple vs Single-Parent Households in Sulphur Springs
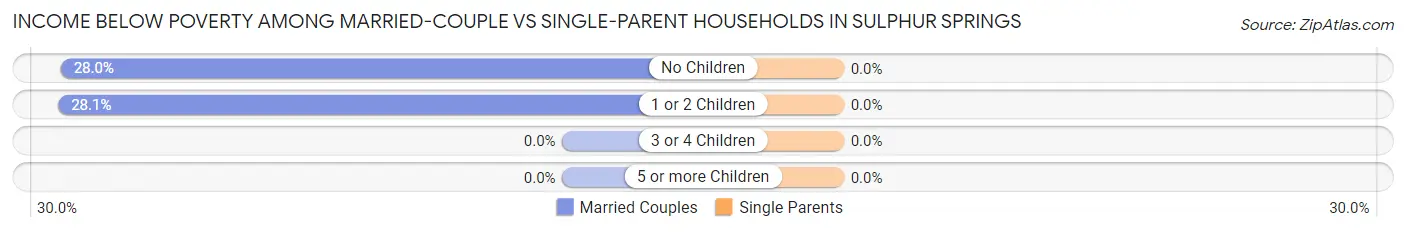
| Children | Married-Couple Families | Single-Parent Households |
| No Children | 47 (28.0%) | 0 (0.0%) |
| 1 or 2 Children | 27 (28.1%) | 0 (0.0%) |
| 3 or 4 Children | 0 (0.0%) | 0 (0.0%) |
| 5 or more Children | 0 (0.0%) | 0 (0.0%) |
| Total | 74 (26.5%) | 0 (0.0%) |
Race in Sulphur Springs
The most populous races in Sulphur Springs are White / Caucasian (937 | 83.7%), Black / African American (182 | 16.3%), and Hispanic or Latino (9 | 0.8%).
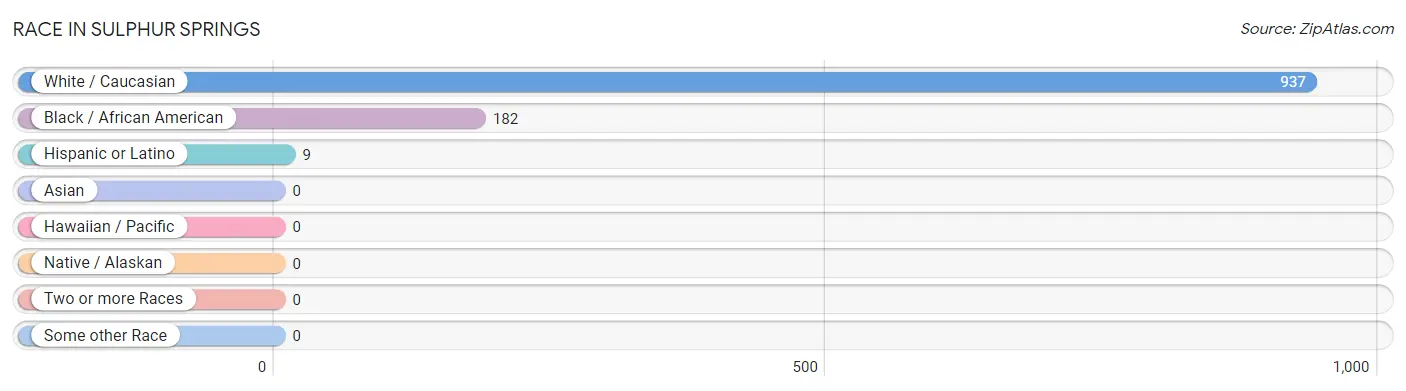
| Race | # Population | % Population |
| Asian | 0 | 0.0% |
| Black / African American | 182 | 16.3% |
| Hawaiian / Pacific | 0 | 0.0% |
| Hispanic or Latino | 9 | 0.8% |
| Native / Alaskan | 0 | 0.0% |
| White / Caucasian | 937 | 83.7% |
| Two or more Races | 0 | 0.0% |
| Some other Race | 0 | 0.0% |
| Total | 1,119 | 100.0% |
Ancestry in Sulphur Springs
The most populous ancestries reported in Sulphur Springs are English (305 | 27.3%), Irish (123 | 11.0%), American (82 | 7.3%), European (31 | 2.8%), and German (26 | 2.3%), together accounting for 50.7% of all Sulphur Springs residents.
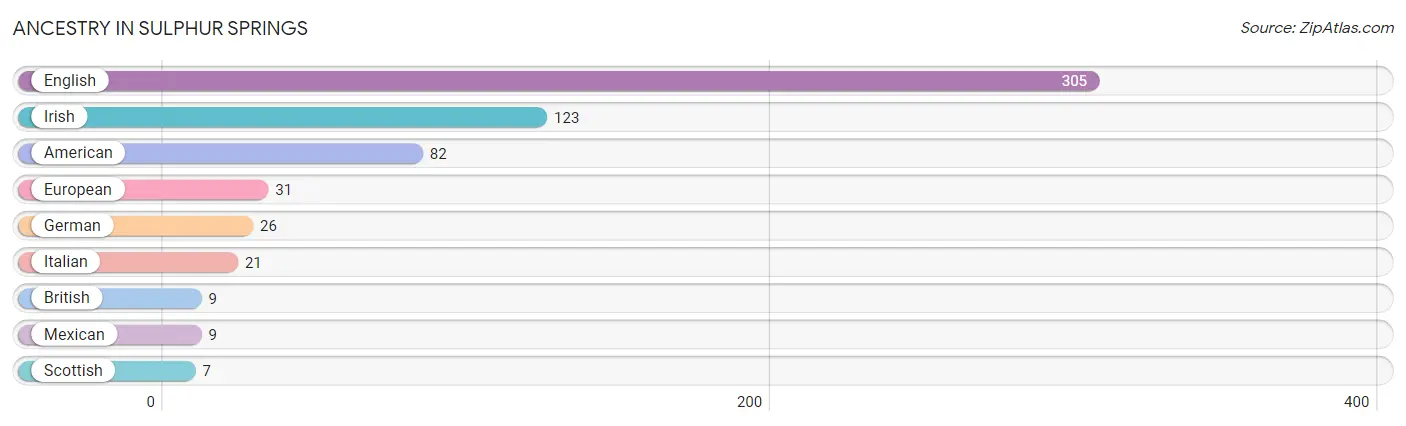
| Ancestry | # Population | % Population |
| American | 82 | 7.3% |
| British | 9 | 0.8% |
| English | 305 | 27.3% |
| European | 31 | 2.8% |
| German | 26 | 2.3% |
| Irish | 123 | 11.0% |
| Italian | 21 | 1.9% |
| Mexican | 9 | 0.8% |
| Scottish | 7 | 0.6% | View All 9 Rows |
Immigrants in Sulphur Springs

| Immigration Origin | # Population | % Population | View All 0 Rows |
Sex and Age in Sulphur Springs
Sex and Age in Sulphur Springs
The most populous age groups in Sulphur Springs are 25 to 29 Years (95 | 17.4%) for men and 80 to 84 Years (83 | 14.5%) for women.
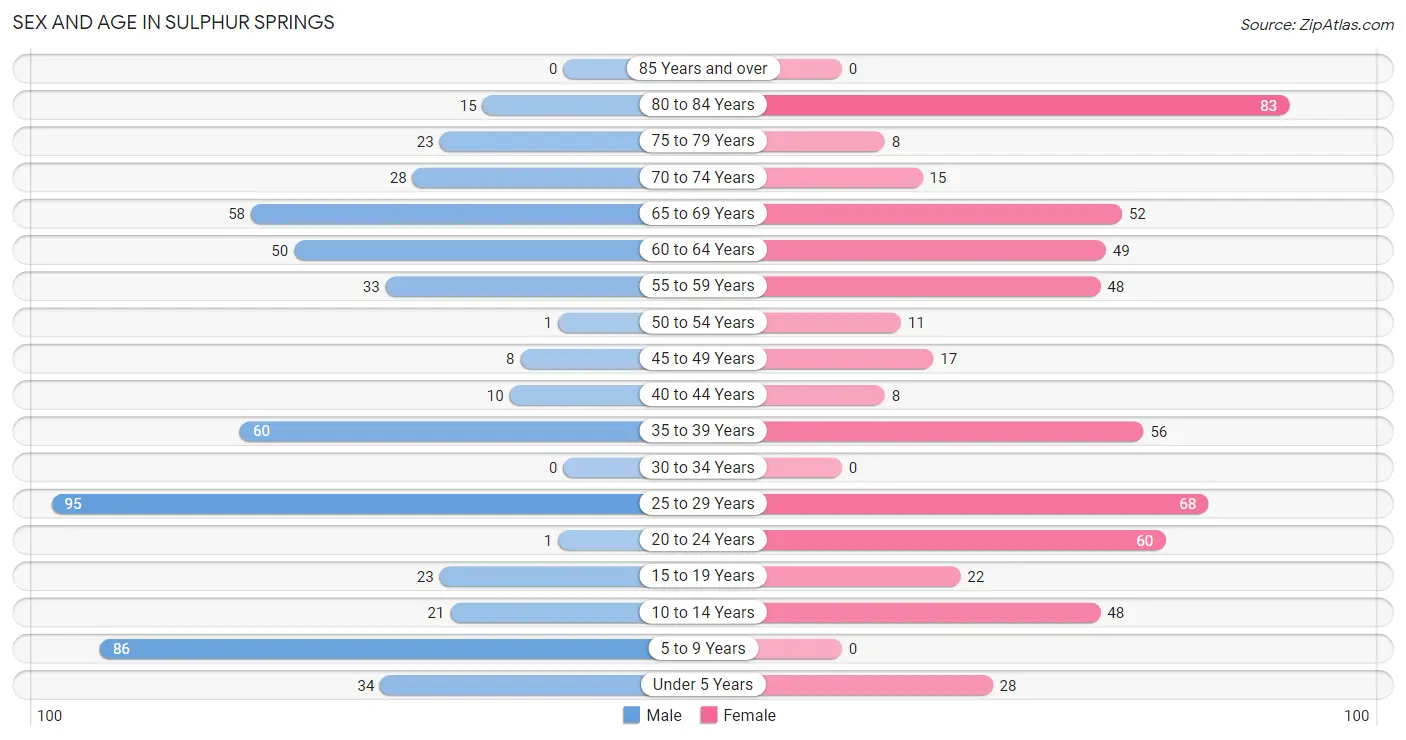
| Age Bracket | Male | Female |
| Under 5 Years | 34 (6.2%) | 28 (4.9%) |
| 5 to 9 Years | 86 (15.8%) | 0 (0.0%) |
| 10 to 14 Years | 21 (3.8%) | 48 (8.4%) |
| 15 to 19 Years | 23 (4.2%) | 22 (3.8%) |
| 20 to 24 Years | 1 (0.2%) | 60 (10.5%) |
| 25 to 29 Years | 95 (17.4%) | 68 (11.9%) |
| 30 to 34 Years | 0 (0.0%) | 0 (0.0%) |
| 35 to 39 Years | 60 (11.0%) | 56 (9.8%) |
| 40 to 44 Years | 10 (1.8%) | 8 (1.4%) |
| 45 to 49 Years | 8 (1.5%) | 17 (3.0%) |
| 50 to 54 Years | 1 (0.2%) | 11 (1.9%) |
| 55 to 59 Years | 33 (6.0%) | 48 (8.4%) |
| 60 to 64 Years | 50 (9.2%) | 49 (8.6%) |
| 65 to 69 Years | 58 (10.6%) | 52 (9.1%) |
| 70 to 74 Years | 28 (5.1%) | 15 (2.6%) |
| 75 to 79 Years | 23 (4.2%) | 8 (1.4%) |
| 80 to 84 Years | 15 (2.8%) | 83 (14.5%) |
| 85 Years and over | 0 (0.0%) | 0 (0.0%) |
| Total | 546 (100.0%) | 573 (100.0%) |
Families and Households in Sulphur Springs
Median Family Size in Sulphur Springs
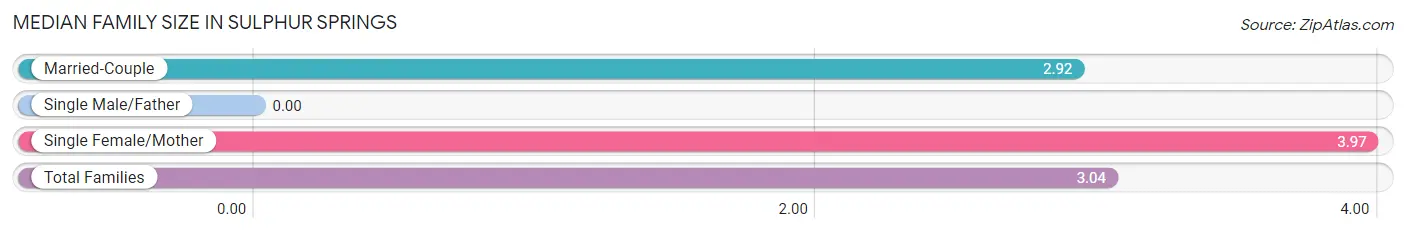
| Family Type | # Families | Family Size |
| Married-Couple | 279 (88.8%) | 2.92 |
| Single Male/Father | 0 (0.0%) | - |
| Single Female/Mother | 35 (11.2%) | 3.97 |
| Total Families | 314 (100.0%) | 3.04 |
Median Household Size in Sulphur Springs
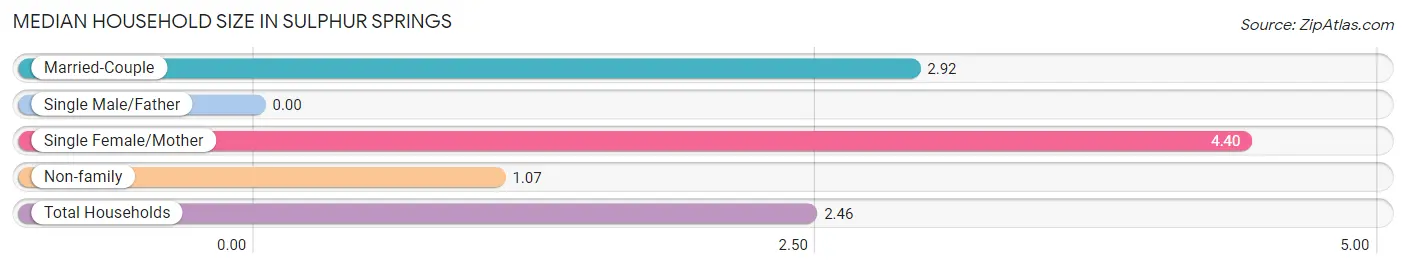
| Household Type | # Households | Household Size |
| Married-Couple | 279 (61.3%) | 2.92 |
| Single Male/Father | 0 (0.0%) | - |
| Single Female/Mother | 35 (7.7%) | 4.40 |
| Non-family | 141 (31.0%) | 1.07 |
| Total Households | 455 (100.0%) | 2.46 |
Household Size by Marriage Status in Sulphur Springs
Out of a total of 455 households in Sulphur Springs, 314 (69.0%) are family households, while 141 (31.0%) are nonfamily households. The most numerous type of family households are 2-person households, comprising 148, and the most common type of nonfamily households are 1-person households, comprising 134.
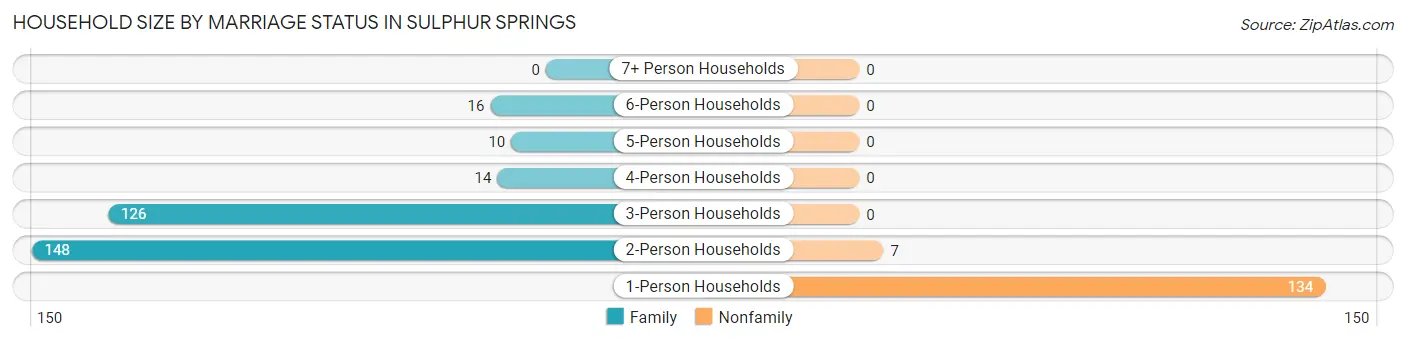
| Household Size | Family Households | Nonfamily Households |
| 1-Person Households | - | 134 (29.4%) |
| 2-Person Households | 148 (32.5%) | 7 (1.5%) |
| 3-Person Households | 126 (27.7%) | 0 (0.0%) |
| 4-Person Households | 14 (3.1%) | 0 (0.0%) |
| 5-Person Households | 10 (2.2%) | 0 (0.0%) |
| 6-Person Households | 16 (3.5%) | 0 (0.0%) |
| 7+ Person Households | 0 (0.0%) | 0 (0.0%) |
| Total | 314 (69.0%) | 141 (31.0%) |
Female Fertility in Sulphur Springs
Fertility by Age in Sulphur Springs
Average fertility rate in Sulphur Springs is 61.0 births per 1,000 women. Women in the age bracket of 20 to 34 years have the highest fertility rate with 109.0 births per 1,000 women. Women in the age bracket of 20 to 34 years acount for 100.0% of all women with births.
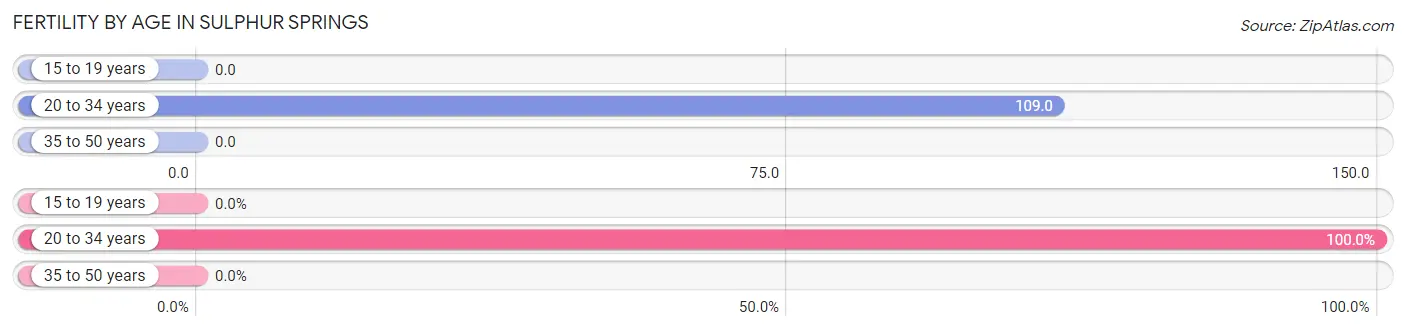
| Age Bracket | Women with Births | Births / 1,000 Women |
| 15 to 19 years | 0 (0.0%) | 0.0 |
| 20 to 34 years | 14 (100.0%) | 109.0 |
| 35 to 50 years | 0 (0.0%) | 0.0 |
| Total | 14 (100.0%) | 61.0 |
Fertility by Age by Marriage Status in Sulphur Springs
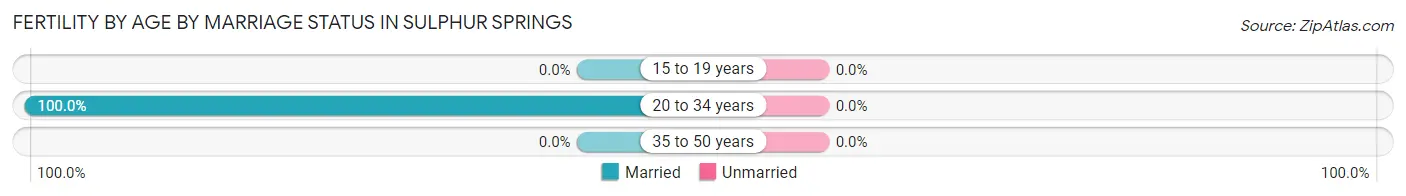
| Age Bracket | Married | Unmarried |
| 15 to 19 years | 0 (0.0%) | 0 (0.0%) |
| 20 to 34 years | 14 (100.0%) | 0 (0.0%) |
| 35 to 50 years | 0 (0.0%) | 0 (0.0%) |
| Total | 14 (100.0%) | 0 (0.0%) |
Fertility by Education in Sulphur Springs
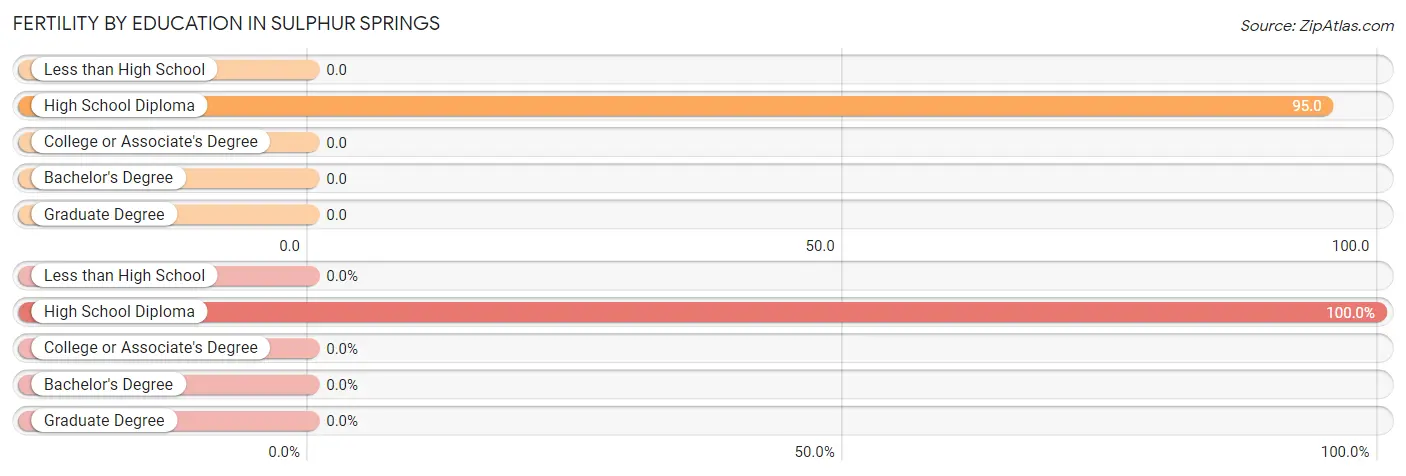
| Educational Attainment | Women with Births | Births / 1,000 Women |
| Less than High School | 0 (0.0%) | 0.0 |
| High School Diploma | 14 (100.0%) | 95.0 |
| College or Associate's Degree | 0 (0.0%) | 0.0 |
| Bachelor's Degree | 0 (0.0%) | 0.0 |
| Graduate Degree | 0 (0.0%) | 0.0 |
| Total | 14 (100.0%) | 61.0 |
Fertility by Education by Marriage Status in Sulphur Springs
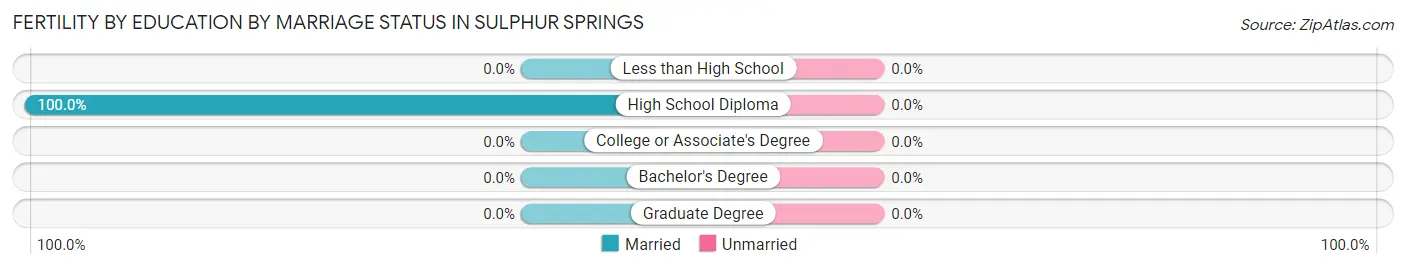
| Educational Attainment | Married | Unmarried |
| Less than High School | 0 (0.0%) | 0 (0.0%) |
| High School Diploma | 14 (100.0%) | 0 (0.0%) |
| College or Associate's Degree | 0 (0.0%) | 0 (0.0%) |
| Bachelor's Degree | 0 (0.0%) | 0 (0.0%) |
| Graduate Degree | 0 (0.0%) | 0 (0.0%) |
| Total | 14 (100.0%) | 0 (0.0%) |
Employment Characteristics in Sulphur Springs
Employment by Class of Employer in Sulphur Springs
Among the 400 employed individuals in Sulphur Springs, private company employees (288 | 72.0%), self-employed (incorporated) (32 | 8.0%), and self-employed (not incorporated) (28 | 7.0%) make up the most common classes of employment.
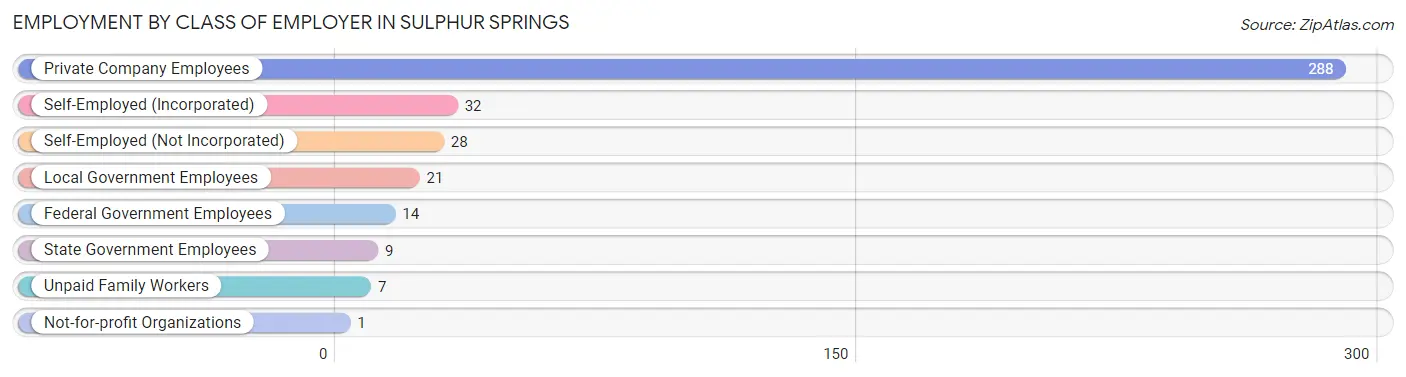
| Employer Class | # Employees | % Employees |
| Private Company Employees | 288 | 72.0% |
| Self-Employed (Incorporated) | 32 | 8.0% |
| Self-Employed (Not Incorporated) | 28 | 7.0% |
| Not-for-profit Organizations | 1 | 0.3% |
| Local Government Employees | 21 | 5.2% |
| State Government Employees | 9 | 2.2% |
| Federal Government Employees | 14 | 3.5% |
| Unpaid Family Workers | 7 | 1.8% |
| Total | 400 | 100.0% |
Employment Status by Age in Sulphur Springs
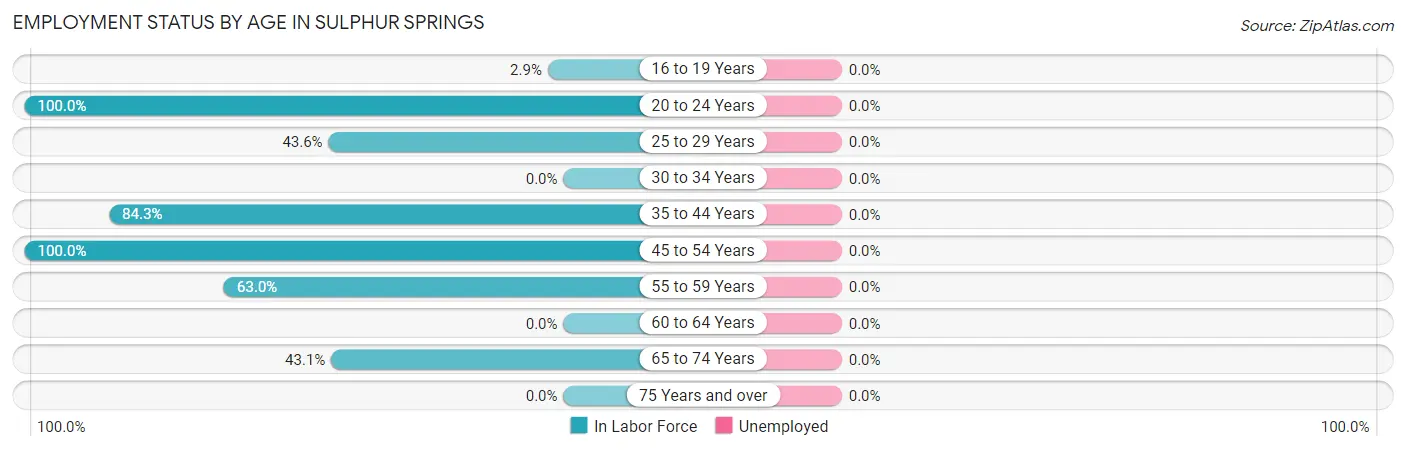
| Age Bracket | In Labor Force | Unemployed |
| 16 to 19 Years | 1 (2.9%) | 0 (0.0%) |
| 20 to 24 Years | 61 (100.0%) | 0 (0.0%) |
| 25 to 29 Years | 71 (43.6%) | 0 (0.0%) |
| 30 to 34 Years | 0 (0.0%) | 0 (0.0%) |
| 35 to 44 Years | 113 (84.3%) | 0 (0.0%) |
| 45 to 54 Years | 37 (100.0%) | 0 (0.0%) |
| 55 to 59 Years | 51 (63.0%) | 0 (0.0%) |
| 60 to 64 Years | 0 (0.0%) | 0 (0.0%) |
| 65 to 74 Years | 66 (43.1%) | 0 (0.0%) |
| 75 Years and over | 0 (0.0%) | 0 (0.0%) |
| Total | 400 (44.8%) | 0 (0.0%) |
Employment Status by Educational Attainment in Sulphur Springs
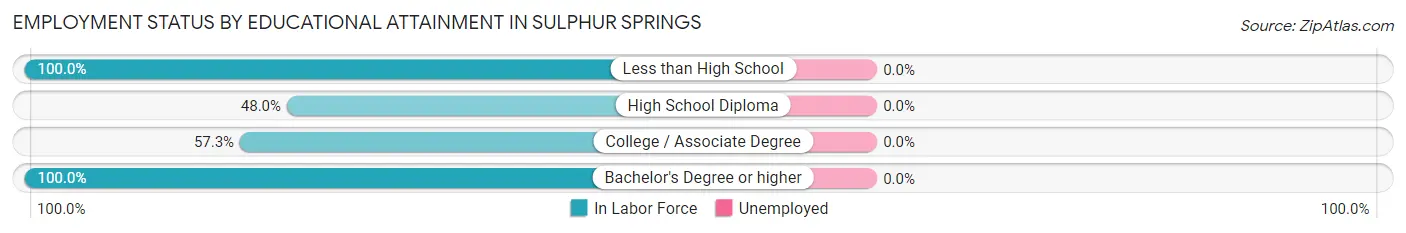
| Educational Attainment | In Labor Force | Unemployed |
| Less than High School | 17 (100.0%) | 0 (0.0%) |
| High School Diploma | 156 (48.0%) | 0 (0.0%) |
| College / Associate Degree | 98 (57.3%) | 0 (0.0%) |
| Bachelor's Degree or higher | 1 (100.0%) | 0 (0.0%) |
| Total | 272 (52.9%) | 0 (0.0%) |
Employment Occupations by Sex in Sulphur Springs
Management, Business, Science and Arts Occupations
The most common Management, Business, Science and Arts occupations in Sulphur Springs are Community & Social Service (43 | 10.7%), Education Instruction & Library (20 | 5.0%), Arts, Media & Entertainment (19 | 4.8%), Computers, Engineering & Science (9 | 2.2%), and Computers & Mathematics (9 | 2.2%).
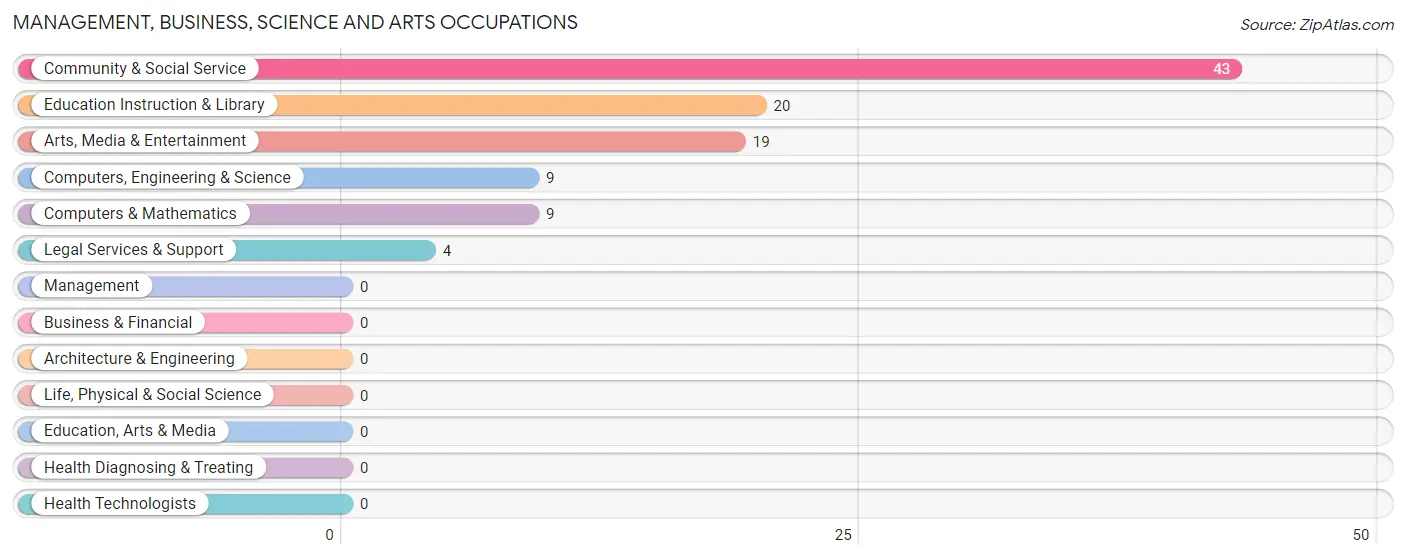
Management, Business, Science and Arts Occupations by Sex
Within the Management, Business, Science and Arts occupations in Sulphur Springs, the most male-oriented occupations are Computers, Engineering & Science (100.0%), Computers & Mathematics (100.0%), and Arts, Media & Entertainment (52.6%), while the most female-oriented occupations are Legal Services & Support (100.0%), Education Instruction & Library (100.0%), and Community & Social Service (76.7%).
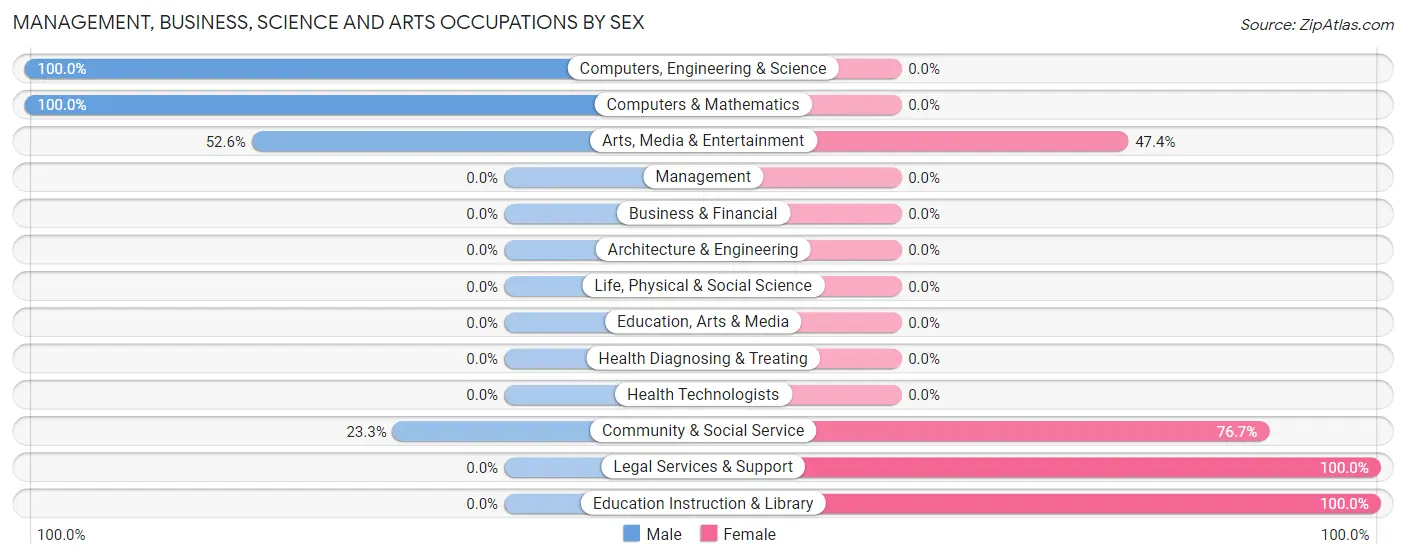
| Occupation | Male | Female |
| Management | 0 (0.0%) | 0 (0.0%) |
| Business & Financial | 0 (0.0%) | 0 (0.0%) |
| Computers, Engineering & Science | 9 (100.0%) | 0 (0.0%) |
| Computers & Mathematics | 9 (100.0%) | 0 (0.0%) |
| Architecture & Engineering | 0 (0.0%) | 0 (0.0%) |
| Life, Physical & Social Science | 0 (0.0%) | 0 (0.0%) |
| Community & Social Service | 10 (23.3%) | 33 (76.7%) |
| Education, Arts & Media | 0 (0.0%) | 0 (0.0%) |
| Legal Services & Support | 0 (0.0%) | 4 (100.0%) |
| Education Instruction & Library | 0 (0.0%) | 20 (100.0%) |
| Arts, Media & Entertainment | 10 (52.6%) | 9 (47.4%) |
| Health Diagnosing & Treating | 0 (0.0%) | 0 (0.0%) |
| Health Technologists | 0 (0.0%) | 0 (0.0%) |
| Total (Category) | 19 (36.5%) | 33 (63.5%) |
| Total (Overall) | 202 (50.5%) | 198 (49.5%) |
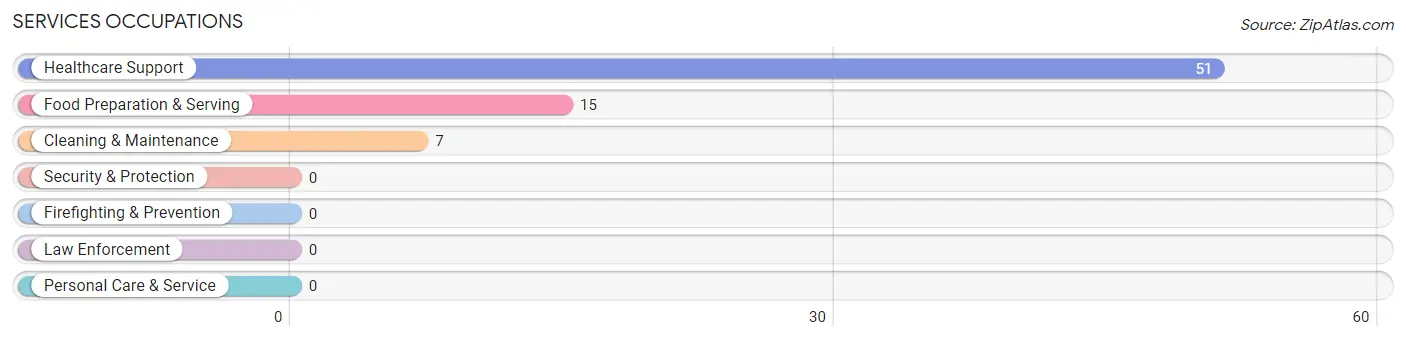
Services Occupations
The most common Services occupations in Sulphur Springs are Healthcare Support (51 | 12.8%), Food Preparation & Serving (15 | 3.7%), and Cleaning & Maintenance (7 | 1.8%).
Services Occupations by Sex
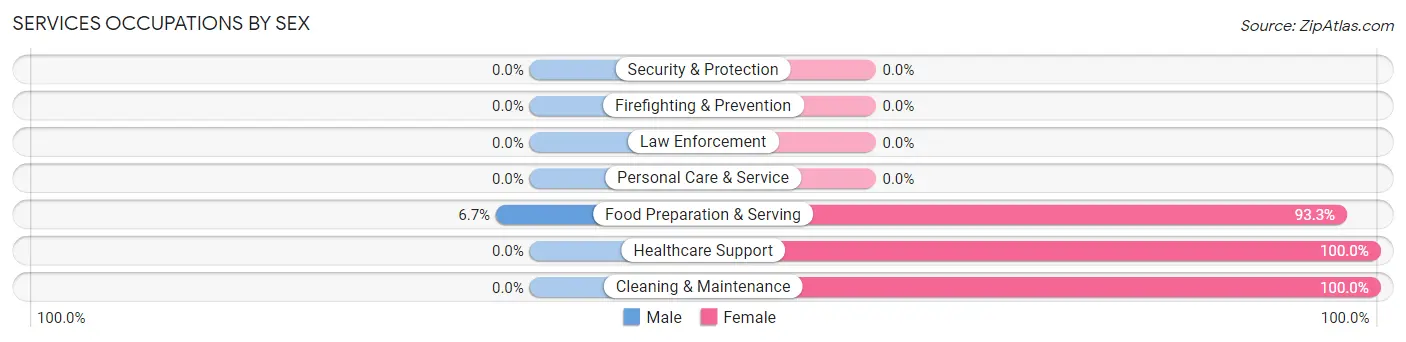
| Occupation | Male | Female |
| Healthcare Support | 0 (0.0%) | 51 (100.0%) |
| Security & Protection | 0 (0.0%) | 0 (0.0%) |
| Firefighting & Prevention | 0 (0.0%) | 0 (0.0%) |
| Law Enforcement | 0 (0.0%) | 0 (0.0%) |
| Food Preparation & Serving | 1 (6.7%) | 14 (93.3%) |
| Cleaning & Maintenance | 0 (0.0%) | 7 (100.0%) |
| Personal Care & Service | 0 (0.0%) | 0 (0.0%) |
| Total (Category) | 1 (1.4%) | 72 (98.6%) |
| Total (Overall) | 202 (50.5%) | 198 (49.5%) |
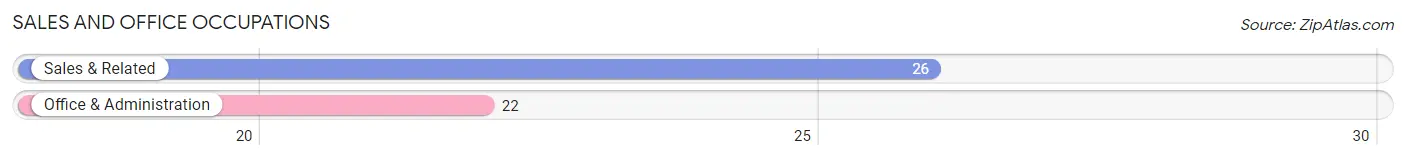
Sales and Office Occupations
The most common Sales and Office occupations in Sulphur Springs are Sales & Related (26 | 6.5%), and Office & Administration (22 | 5.5%).
Sales and Office Occupations by Sex
| Occupation | Male | Female |
| Sales & Related | 0 (0.0%) | 26 (100.0%) |
| Office & Administration | 0 (0.0%) | 22 (100.0%) |
| Total (Category) | 0 (0.0%) | 48 (100.0%) |
| Total (Overall) | 202 (50.5%) | 198 (49.5%) |
Natural Resources, Construction and Maintenance Occupations
The most common Natural Resources, Construction and Maintenance occupations in Sulphur Springs are Installation, Maintenance & Repair (64 | 16.0%), and Construction & Extraction (9 | 2.2%).
Natural Resources, Construction and Maintenance Occupations by Sex
| Occupation | Male | Female |
| Farming, Fishing & Forestry | 0 (0.0%) | 0 (0.0%) |
| Construction & Extraction | 9 (100.0%) | 0 (0.0%) |
| Installation, Maintenance & Repair | 64 (100.0%) | 0 (0.0%) |
| Total (Category) | 73 (100.0%) | 0 (0.0%) |
| Total (Overall) | 202 (50.5%) | 198 (49.5%) |
Production, Transportation and Moving Occupations
The most common Production, Transportation and Moving occupations in Sulphur Springs are Production (76 | 19.0%), Material Moving (61 | 15.2%), and Transportation (17 | 4.3%).
Production, Transportation and Moving Occupations by Sex
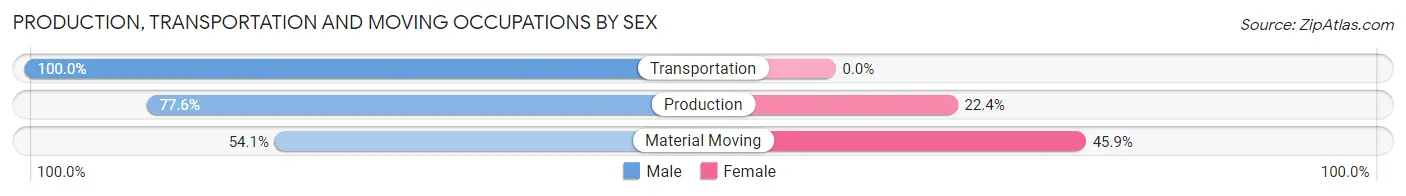
| Occupation | Male | Female |
| Production | 59 (77.6%) | 17 (22.4%) |
| Transportation | 17 (100.0%) | 0 (0.0%) |
| Material Moving | 33 (54.1%) | 28 (45.9%) |
| Total (Category) | 109 (70.8%) | 45 (29.2%) |
| Total (Overall) | 202 (50.5%) | 198 (49.5%) |
Employment Industries by Sex in Sulphur Springs
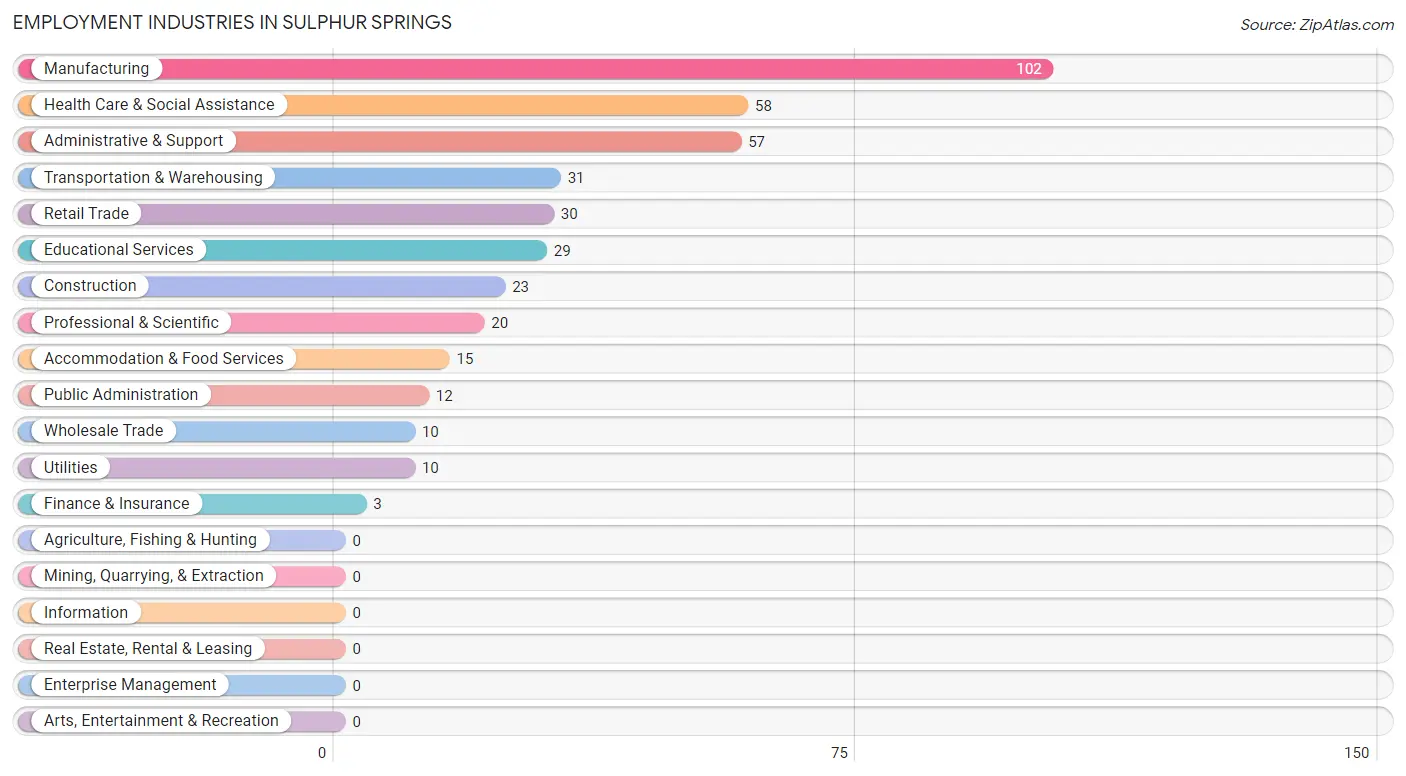
Employment Industries in Sulphur Springs
The major employment industries in Sulphur Springs include Manufacturing (102 | 25.5%), Health Care & Social Assistance (58 | 14.5%), Administrative & Support (57 | 14.2%), Transportation & Warehousing (31 | 7.7%), and Retail Trade (30 | 7.5%).
Employment Industries by Sex in Sulphur Springs
The Sulphur Springs industries that see more men than women are Construction (100.0%), Wholesale Trade (100.0%), and Transportation & Warehousing (100.0%), whereas the industries that tend to have a higher number of women are Utilities (100.0%), Finance & Insurance (100.0%), and Health Care & Social Assistance (100.0%).
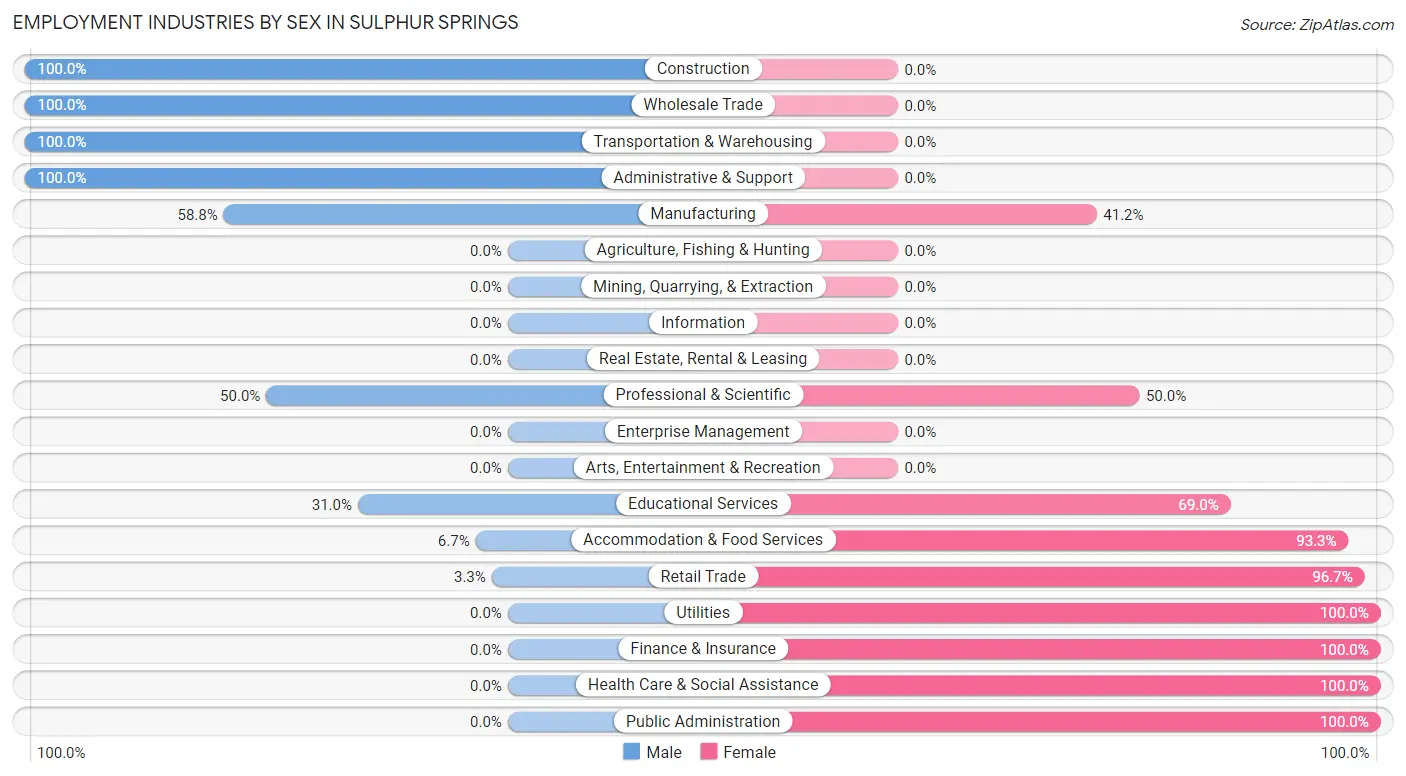
| Industry | Male | Female |
| Agriculture, Fishing & Hunting | 0 (0.0%) | 0 (0.0%) |
| Mining, Quarrying, & Extraction | 0 (0.0%) | 0 (0.0%) |
| Construction | 23 (100.0%) | 0 (0.0%) |
| Manufacturing | 60 (58.8%) | 42 (41.2%) |
| Wholesale Trade | 10 (100.0%) | 0 (0.0%) |
| Retail Trade | 1 (3.3%) | 29 (96.7%) |
| Transportation & Warehousing | 31 (100.0%) | 0 (0.0%) |
| Utilities | 0 (0.0%) | 10 (100.0%) |
| Information | 0 (0.0%) | 0 (0.0%) |
| Finance & Insurance | 0 (0.0%) | 3 (100.0%) |
| Real Estate, Rental & Leasing | 0 (0.0%) | 0 (0.0%) |
| Professional & Scientific | 10 (50.0%) | 10 (50.0%) |
| Enterprise Management | 0 (0.0%) | 0 (0.0%) |
| Administrative & Support | 57 (100.0%) | 0 (0.0%) |
| Educational Services | 9 (31.0%) | 20 (69.0%) |
| Health Care & Social Assistance | 0 (0.0%) | 58 (100.0%) |
| Arts, Entertainment & Recreation | 0 (0.0%) | 0 (0.0%) |
| Accommodation & Food Services | 1 (6.7%) | 14 (93.3%) |
| Public Administration | 0 (0.0%) | 12 (100.0%) |
| Total | 202 (50.5%) | 198 (49.5%) |
Education in Sulphur Springs
School Enrollment in Sulphur Springs
The most common levels of schooling among the 216 students in Sulphur Springs are elementary school (71 | 32.9%), middle school (51 | 23.6%), and nursery / preschool (33 | 15.3%).
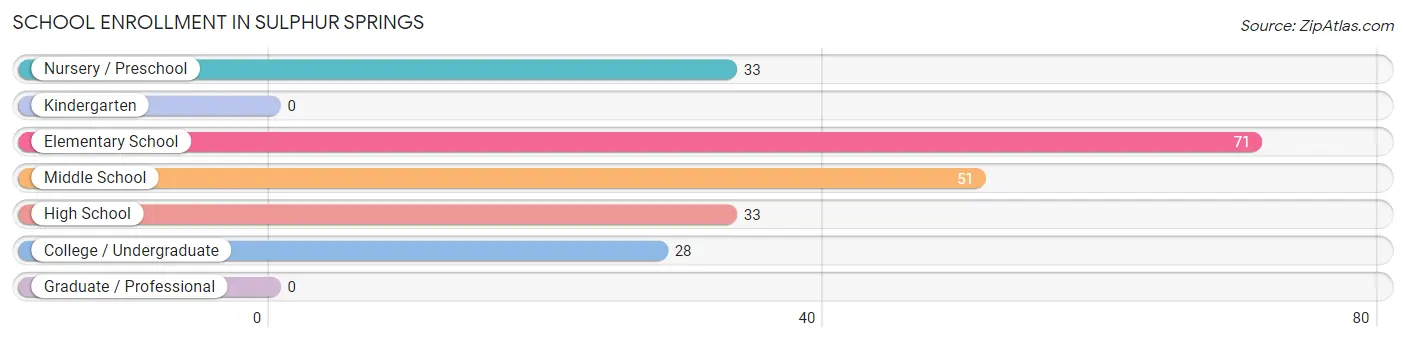
| School Level | # Students | % Students |
| Nursery / Preschool | 33 | 15.3% |
| Kindergarten | 0 | 0.0% |
| Elementary School | 71 | 32.9% |
| Middle School | 51 | 23.6% |
| High School | 33 | 15.3% |
| College / Undergraduate | 28 | 13.0% |
| Graduate / Professional | 0 | 0.0% |
| Total | 216 | 100.0% |
School Enrollment by Age by Funding Source in Sulphur Springs

| Age Bracket | Public School | Private School |
| 3 to 4 Year Olds | 0 (0.0%) | 0 (0.0%) |
| 5 to 9 Year Old | 86 (100.0%) | 0 (0.0%) |
| 10 to 14 Year Olds | 69 (100.0%) | 0 (0.0%) |
| 15 to 17 Year Olds | 32 (100.0%) | 0 (0.0%) |
| 18 to 19 Year Olds | 13 (100.0%) | 0 (0.0%) |
| 20 to 24 Year Olds | 16 (100.0%) | 0 (0.0%) |
| 25 to 34 Year Olds | 0 (0.0%) | 0 (0.0%) |
| 35 Years and over | 0 (0.0%) | 0 (0.0%) |
| Total | 216 (100.0%) | 0 (0.0%) |
Educational Attainment by Field of Study in Sulphur Springs
Education (22 | 52.4%), bio, nature & agricultural (18 | 42.9%), multidisciplinary studies (1 | 2.4%), and science & technology (1 | 2.4%) are the most common fields of study among 42 individuals in Sulphur Springs who have obtained a bachelor's degree or higher.
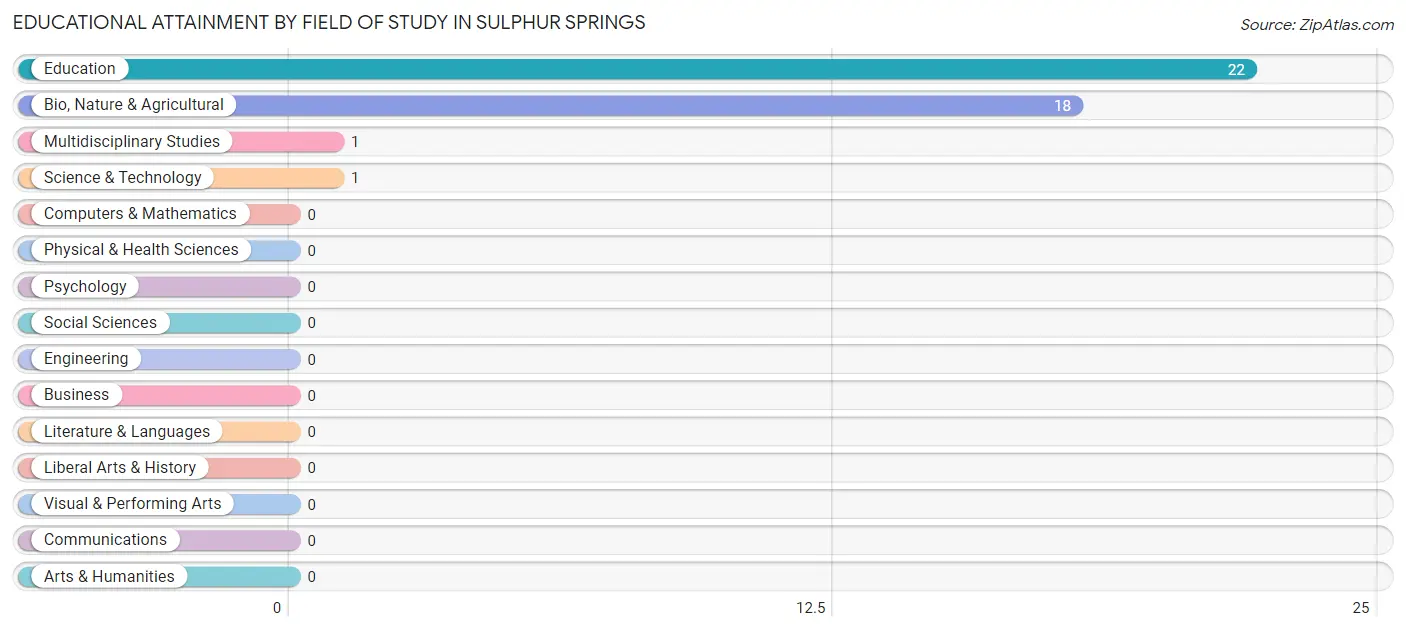
| Field of Study | # Graduates | % Graduates |
| Computers & Mathematics | 0 | 0.0% |
| Bio, Nature & Agricultural | 18 | 42.9% |
| Physical & Health Sciences | 0 | 0.0% |
| Psychology | 0 | 0.0% |
| Social Sciences | 0 | 0.0% |
| Engineering | 0 | 0.0% |
| Multidisciplinary Studies | 1 | 2.4% |
| Science & Technology | 1 | 2.4% |
| Business | 0 | 0.0% |
| Education | 22 | 52.4% |
| Literature & Languages | 0 | 0.0% |
| Liberal Arts & History | 0 | 0.0% |
| Visual & Performing Arts | 0 | 0.0% |
| Communications | 0 | 0.0% |
| Arts & Humanities | 0 | 0.0% |
| Total | 42 | 100.0% |
Transportation & Commute in Sulphur Springs
Vehicle Availability by Sex in Sulphur Springs
The most prevalent vehicle ownership categories in Sulphur Springs are males with 1 vehicle (67, accounting for 33.2%) and females with 1 vehicle (40, making up 33.8%).
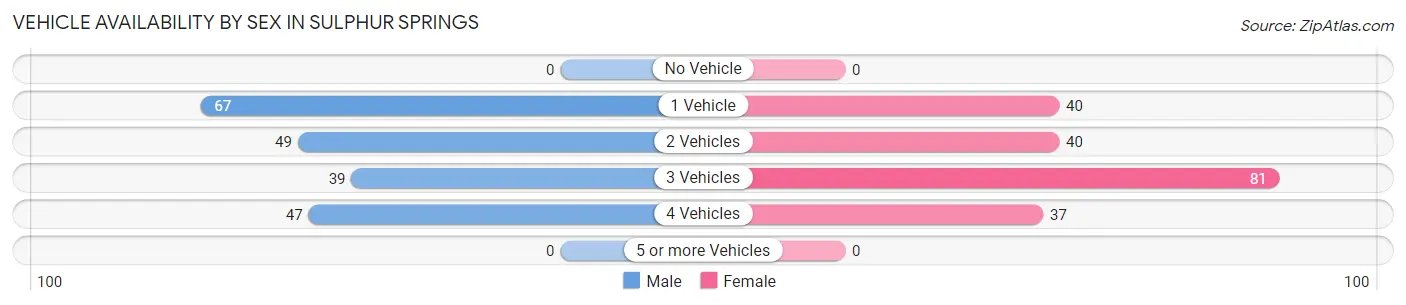
| Vehicles Available | Male | Female |
| No Vehicle | 0 (0.0%) | 0 (0.0%) |
| 1 Vehicle | 67 (33.2%) | 40 (20.2%) |
| 2 Vehicles | 49 (24.3%) | 40 (20.2%) |
| 3 Vehicles | 39 (19.3%) | 81 (40.9%) |
| 4 Vehicles | 47 (23.3%) | 37 (18.7%) |
| 5 or more Vehicles | 0 (0.0%) | 0 (0.0%) |
| Total | 202 (100.0%) | 198 (100.0%) |
Commute Time in Sulphur Springs
The most frequently occuring commute durations in Sulphur Springs are 15 to 19 minutes (125 commuters, 34.4%), 10 to 14 minutes (81 commuters, 22.3%), and 20 to 24 minutes (55 commuters, 15.1%).
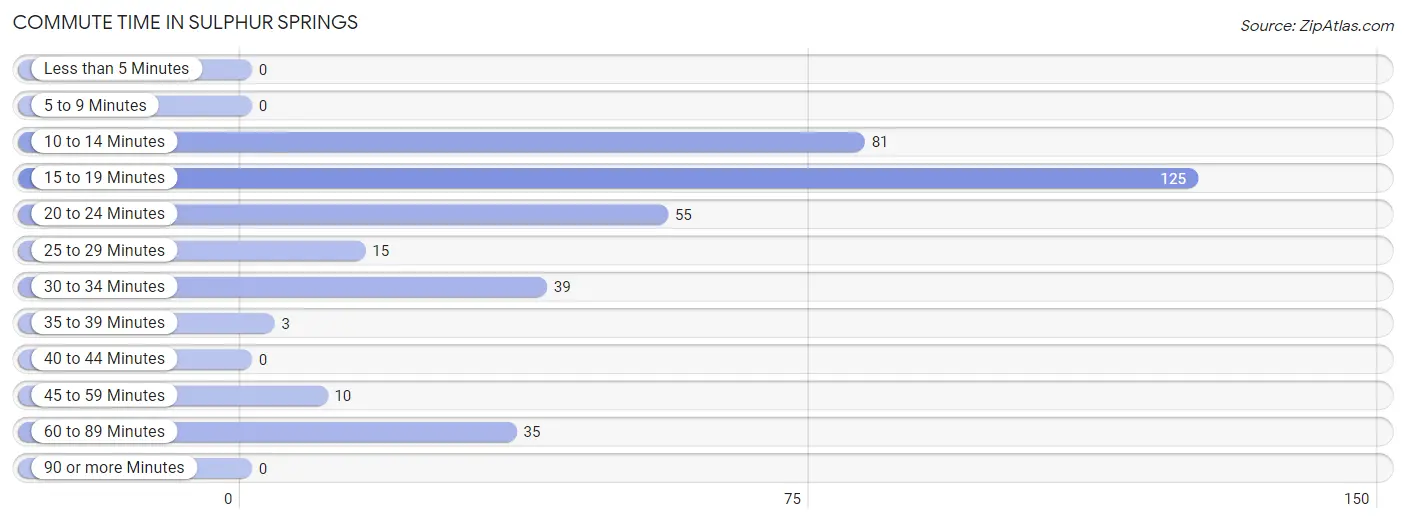
| Commute Time | # Commuters | % Commuters |
| Less than 5 Minutes | 0 | 0.0% |
| 5 to 9 Minutes | 0 | 0.0% |
| 10 to 14 Minutes | 81 | 22.3% |
| 15 to 19 Minutes | 125 | 34.4% |
| 20 to 24 Minutes | 55 | 15.1% |
| 25 to 29 Minutes | 15 | 4.1% |
| 30 to 34 Minutes | 39 | 10.7% |
| 35 to 39 Minutes | 3 | 0.8% |
| 40 to 44 Minutes | 0 | 0.0% |
| 45 to 59 Minutes | 10 | 2.8% |
| 60 to 89 Minutes | 35 | 9.6% |
| 90 or more Minutes | 0 | 0.0% |
Commute Time by Sex in Sulphur Springs
The most common commute times in Sulphur Springs are 15 to 19 minutes (111 commuters, 63.4%) for males and 10 to 14 minutes (72 commuters, 38.3%) for females.
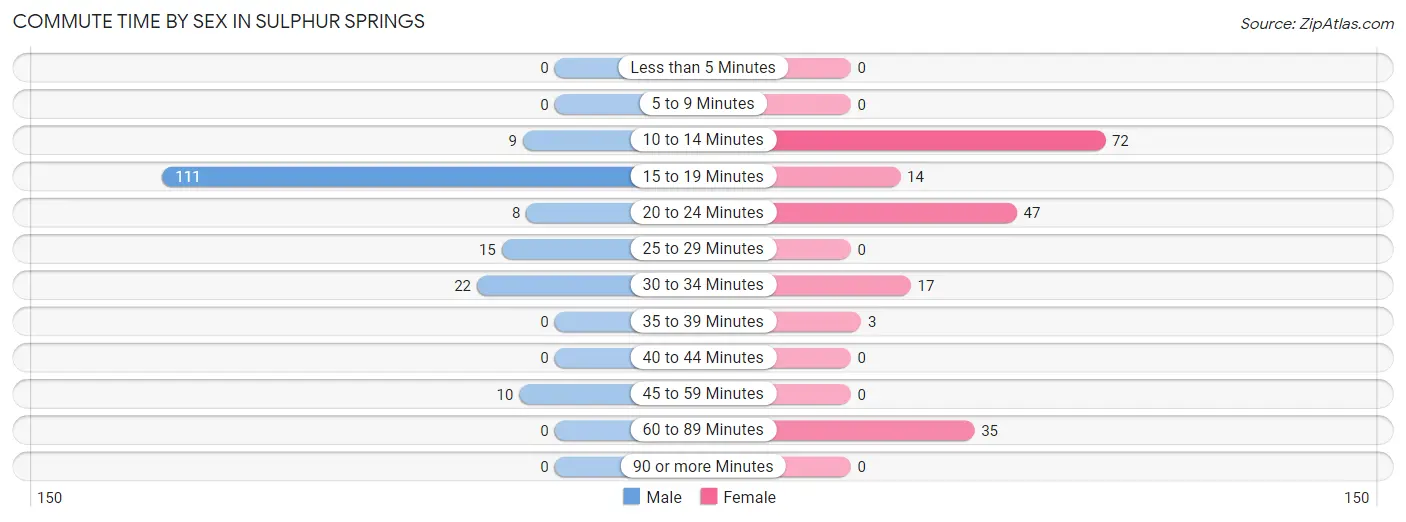
| Commute Time | Male | Female |
| Less than 5 Minutes | 0 (0.0%) | 0 (0.0%) |
| 5 to 9 Minutes | 0 (0.0%) | 0 (0.0%) |
| 10 to 14 Minutes | 9 (5.1%) | 72 (38.3%) |
| 15 to 19 Minutes | 111 (63.4%) | 14 (7.4%) |
| 20 to 24 Minutes | 8 (4.6%) | 47 (25.0%) |
| 25 to 29 Minutes | 15 (8.6%) | 0 (0.0%) |
| 30 to 34 Minutes | 22 (12.6%) | 17 (9.0%) |
| 35 to 39 Minutes | 0 (0.0%) | 3 (1.6%) |
| 40 to 44 Minutes | 0 (0.0%) | 0 (0.0%) |
| 45 to 59 Minutes | 10 (5.7%) | 0 (0.0%) |
| 60 to 89 Minutes | 0 (0.0%) | 35 (18.6%) |
| 90 or more Minutes | 0 (0.0%) | 0 (0.0%) |
Time of Departure to Work by Sex in Sulphur Springs
The most frequent times of departure to work in Sulphur Springs are 6:00 AM to 6:29 AM (115, 65.7%) for males and 7:00 AM to 7:29 AM (104, 55.3%) for females.
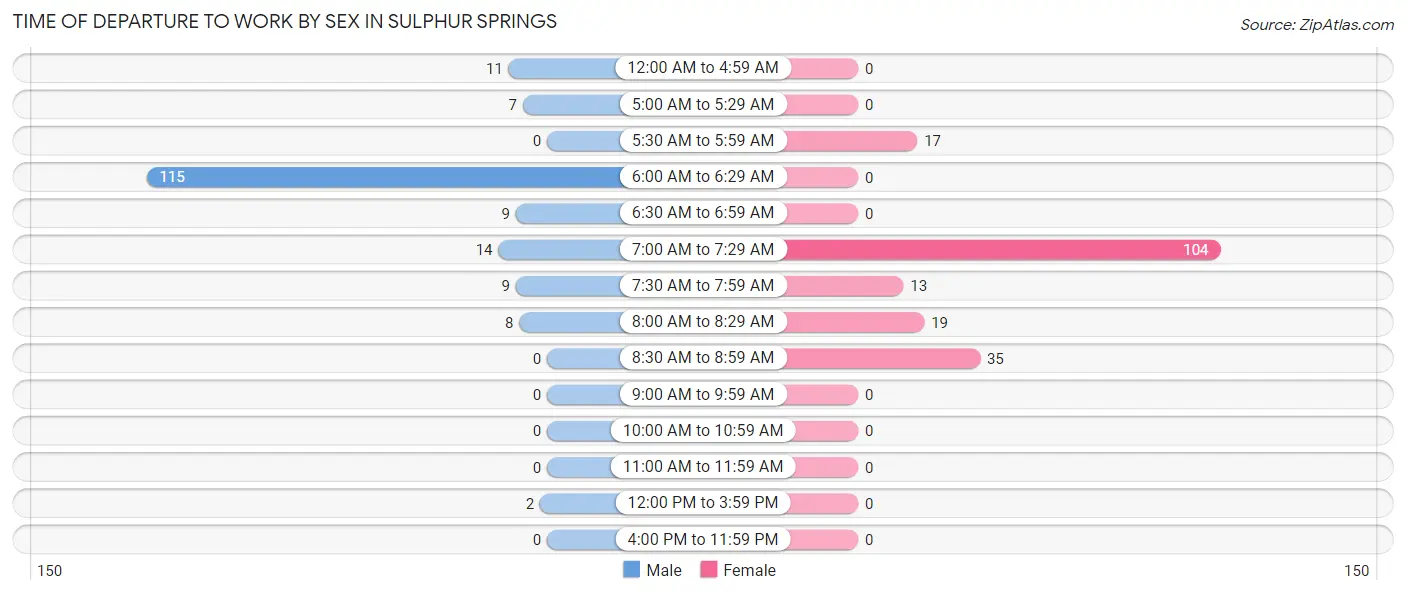
| Time of Departure | Male | Female |
| 12:00 AM to 4:59 AM | 11 (6.3%) | 0 (0.0%) |
| 5:00 AM to 5:29 AM | 7 (4.0%) | 0 (0.0%) |
| 5:30 AM to 5:59 AM | 0 (0.0%) | 17 (9.0%) |
| 6:00 AM to 6:29 AM | 115 (65.7%) | 0 (0.0%) |
| 6:30 AM to 6:59 AM | 9 (5.1%) | 0 (0.0%) |
| 7:00 AM to 7:29 AM | 14 (8.0%) | 104 (55.3%) |
| 7:30 AM to 7:59 AM | 9 (5.1%) | 13 (6.9%) |
| 8:00 AM to 8:29 AM | 8 (4.6%) | 19 (10.1%) |
| 8:30 AM to 8:59 AM | 0 (0.0%) | 35 (18.6%) |
| 9:00 AM to 9:59 AM | 0 (0.0%) | 0 (0.0%) |
| 10:00 AM to 10:59 AM | 0 (0.0%) | 0 (0.0%) |
| 11:00 AM to 11:59 AM | 0 (0.0%) | 0 (0.0%) |
| 12:00 PM to 3:59 PM | 2 (1.1%) | 0 (0.0%) |
| 4:00 PM to 11:59 PM | 0 (0.0%) | 0 (0.0%) |
| Total | 175 (100.0%) | 188 (100.0%) |
Housing Occupancy in Sulphur Springs
Occupancy by Ownership in Sulphur Springs
Of the total 193 dwellings in Sulphur Springs, owner-occupied units account for 120 (62.2%), while renter-occupied units make up 73 (37.8%).
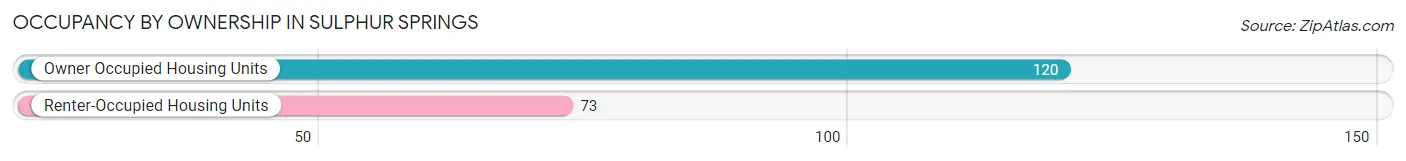
| Occupancy | # Housing Units | % Housing Units |
| Owner Occupied Housing Units | 120 | 62.2% |
| Renter-Occupied Housing Units | 73 | 37.8% |
| Total Occupied Housing Units | 193 | 100.0% |
Occupancy by Household Size in Sulphur Springs
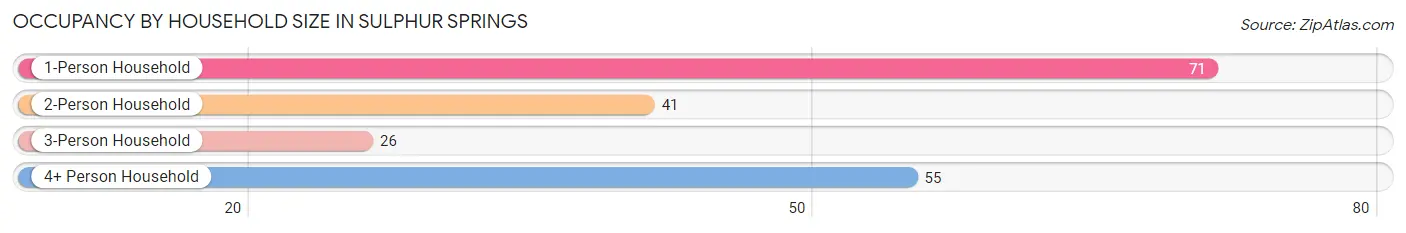
| Household Size | # Housing Units | % Housing Units |
| 1-Person Household | 71 | 36.8% |
| 2-Person Household | 41 | 21.2% |
| 3-Person Household | 26 | 13.5% |
| 4+ Person Household | 55 | 28.5% |
| Total Housing Units | 193 | 100.0% |
Occupancy by Ownership by Household Size in Sulphur Springs
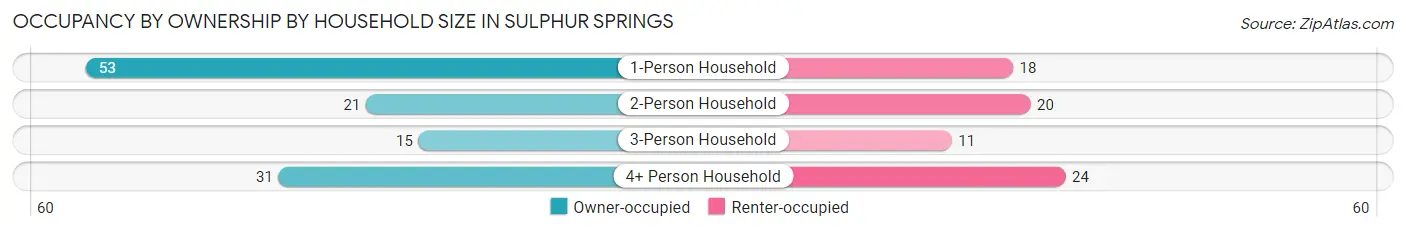
| Household Size | Owner-occupied | Renter-occupied |
| 1-Person Household | 53 (74.7%) | 18 (25.4%) |
| 2-Person Household | 21 (51.2%) | 20 (48.8%) |
| 3-Person Household | 15 (57.7%) | 11 (42.3%) |
| 4+ Person Household | 31 (56.4%) | 24 (43.6%) |
| Total Housing Units | 120 (62.2%) | 73 (37.8%) |
Occupancy by Educational Attainment in Sulphur Springs
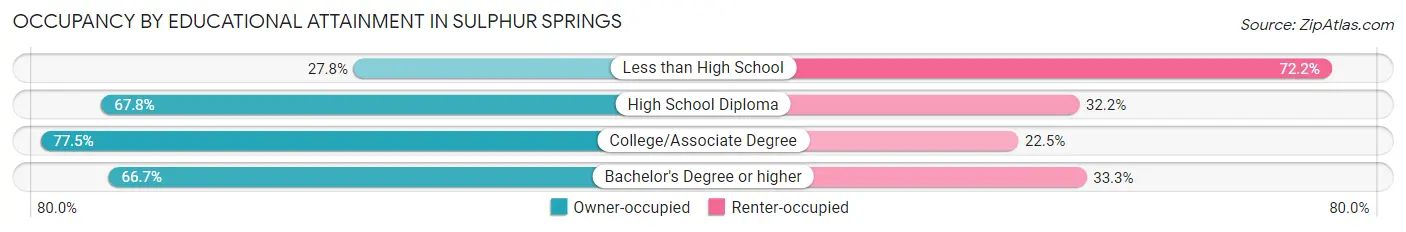
| Household Size | Owner-occupied | Renter-occupied |
| Less than High School | 10 (27.8%) | 26 (72.2%) |
| High School Diploma | 59 (67.8%) | 28 (32.2%) |
| College/Associate Degree | 31 (77.5%) | 9 (22.5%) |
| Bachelor's Degree or higher | 20 (66.7%) | 10 (33.3%) |
Occupancy by Age of Householder in Sulphur Springs
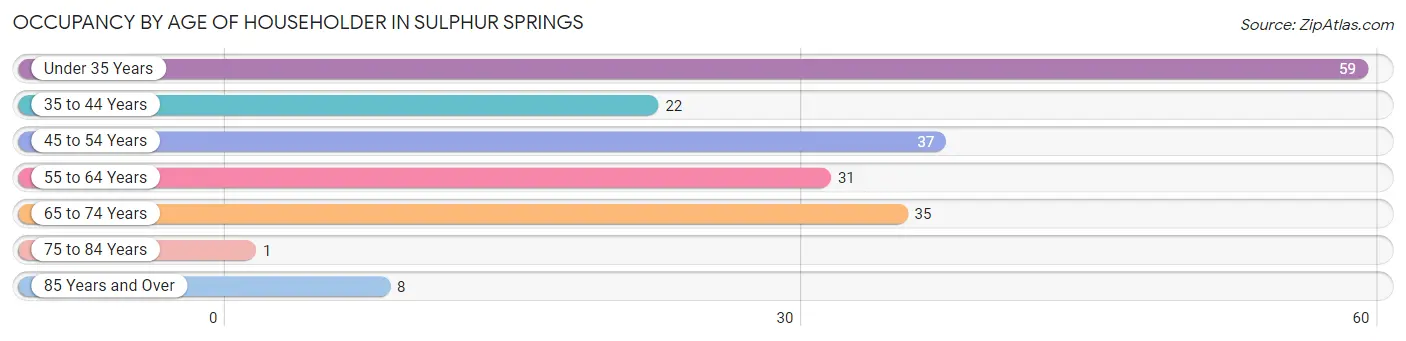
| Age Bracket | # Households | % Households |
| Under 35 Years | 59 | 30.6% |
| 35 to 44 Years | 22 | 11.4% |
| 45 to 54 Years | 37 | 19.2% |
| 55 to 64 Years | 31 | 16.1% |
| 65 to 74 Years | 35 | 18.1% |
| 75 to 84 Years | 1 | 0.5% |
| 85 Years and Over | 8 | 4.2% |
| Total | 193 | 100.0% |
Housing Finances in Sulphur Springs
Median Income by Occupancy in Sulphur Springs
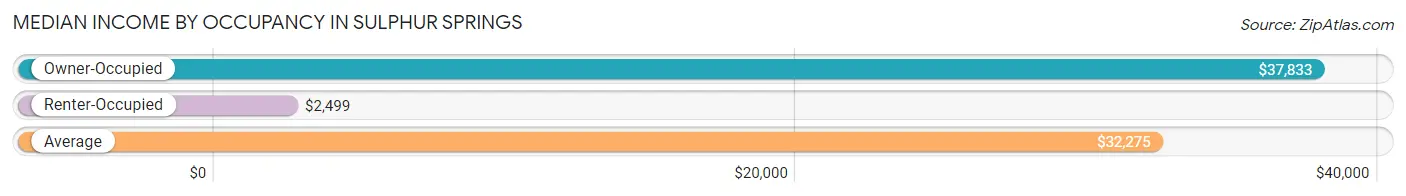
| Occupancy Type | # Households | Median Income |
| Owner-Occupied | 392 (86.2%) | $37,833 |
| Renter-Occupied | 63 (13.9%) | $2,499 |
| Average | 455 (100.0%) | $32,275 |
Occupancy by Householder Income Bracket in Sulphur Springs
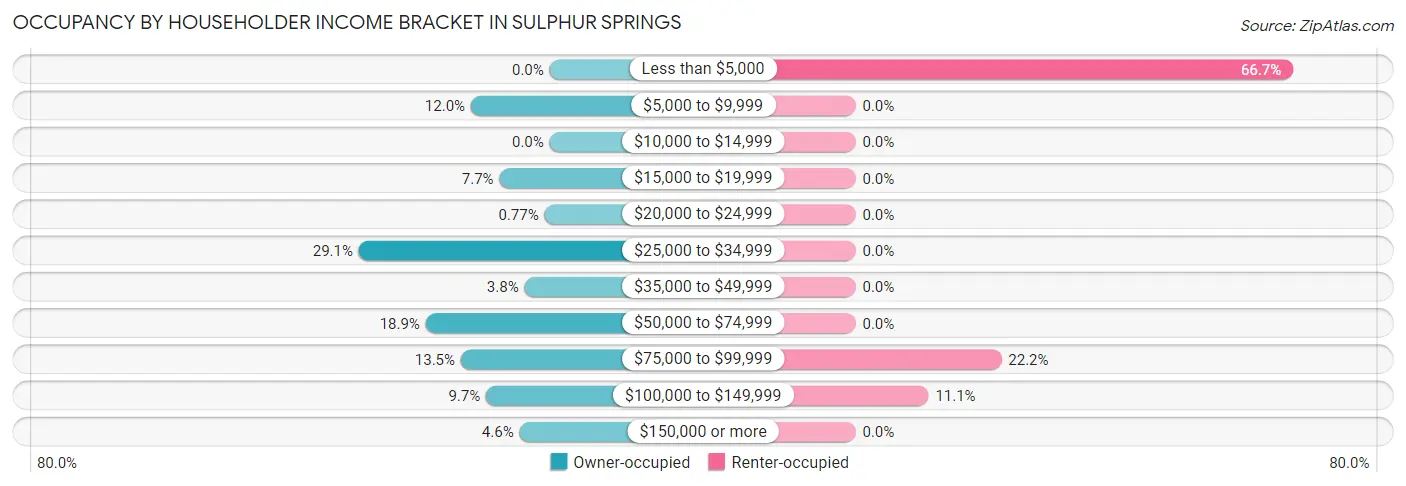
| Income Bracket | Owner-occupied | Renter-occupied |
| Less than $5,000 | 0 (0.0%) | 42 (66.7%) |
| $5,000 to $9,999 | 47 (12.0%) | 0 (0.0%) |
| $10,000 to $14,999 | 0 (0.0%) | 0 (0.0%) |
| $15,000 to $19,999 | 30 (7.6%) | 0 (0.0%) |
| $20,000 to $24,999 | 3 (0.8%) | 0 (0.0%) |
| $25,000 to $34,999 | 114 (29.1%) | 0 (0.0%) |
| $35,000 to $49,999 | 15 (3.8%) | 0 (0.0%) |
| $50,000 to $74,999 | 74 (18.9%) | 0 (0.0%) |
| $75,000 to $99,999 | 53 (13.5%) | 14 (22.2%) |
| $100,000 to $149,999 | 38 (9.7%) | 7 (11.1%) |
| $150,000 or more | 18 (4.6%) | 0 (0.0%) |
| Total | 392 (100.0%) | 63 (100.0%) |
Monthly Housing Cost Tiers in Sulphur Springs
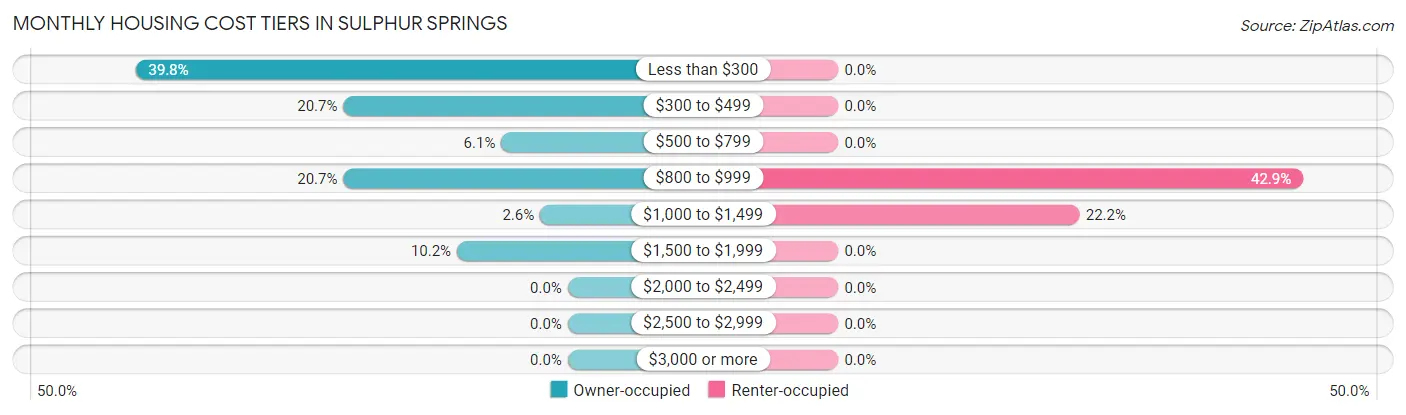
| Monthly Cost | Owner-occupied | Renter-occupied |
| Less than $300 | 156 (39.8%) | 0 (0.0%) |
| $300 to $499 | 81 (20.7%) | 0 (0.0%) |
| $500 to $799 | 24 (6.1%) | 0 (0.0%) |
| $800 to $999 | 81 (20.7%) | 27 (42.9%) |
| $1,000 to $1,499 | 10 (2.5%) | 14 (22.2%) |
| $1,500 to $1,999 | 40 (10.2%) | 0 (0.0%) |
| $2,000 to $2,499 | 0 (0.0%) | 0 (0.0%) |
| $2,500 to $2,999 | 0 (0.0%) | 0 (0.0%) |
| $3,000 or more | 0 (0.0%) | 0 (0.0%) |
| Total | 392 (100.0%) | 63 (100.0%) |
Physical Housing Characteristics in Sulphur Springs
Housing Structures in Sulphur Springs
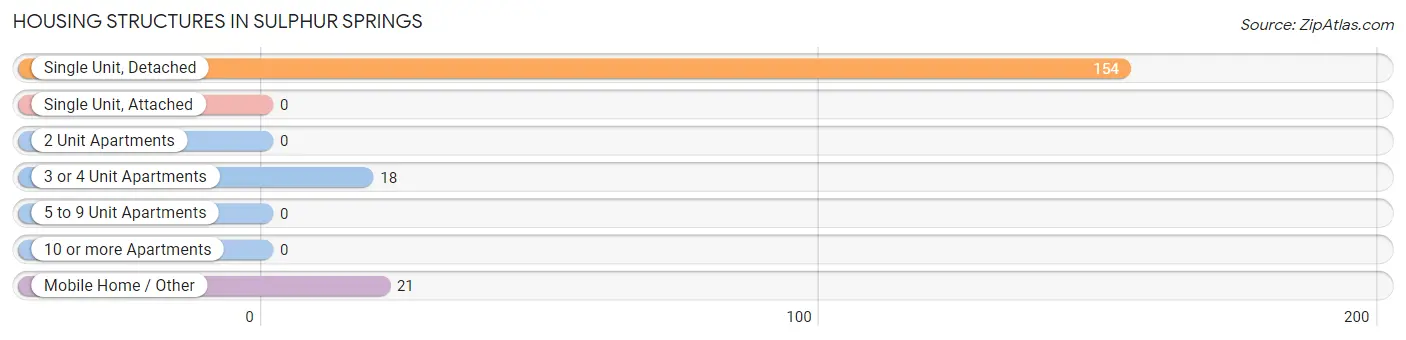
| Structure Type | # Housing Units | % Housing Units |
| Single Unit, Detached | 154 | 79.8% |
| Single Unit, Attached | 0 | 0.0% |
| 2 Unit Apartments | 0 | 0.0% |
| 3 or 4 Unit Apartments | 18 | 9.3% |
| 5 to 9 Unit Apartments | 0 | 0.0% |
| 10 or more Apartments | 0 | 0.0% |
| Mobile Home / Other | 21 | 10.9% |
| Total | 193 | 100.0% |
Housing Structures by Occupancy in Sulphur Springs
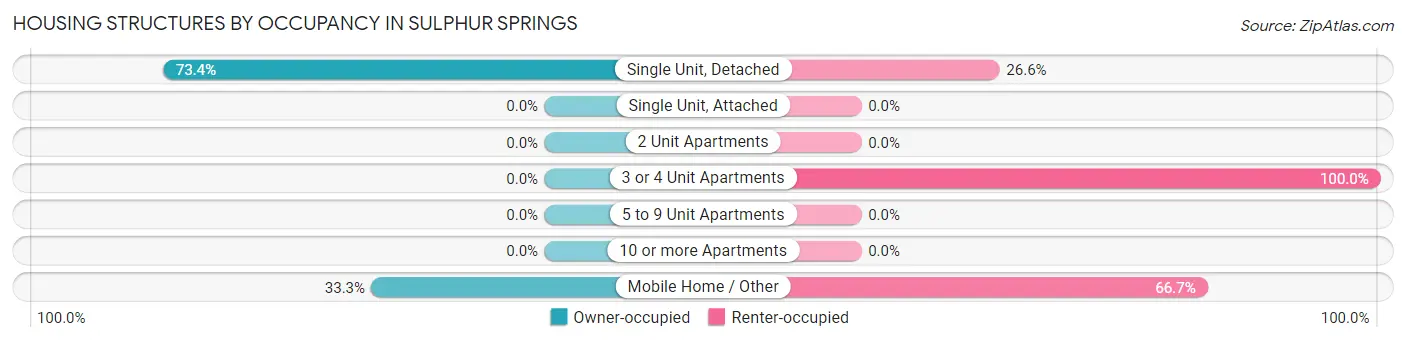
| Structure Type | Owner-occupied | Renter-occupied |
| Single Unit, Detached | 113 (73.4%) | 41 (26.6%) |
| Single Unit, Attached | 0 (0.0%) | 0 (0.0%) |
| 2 Unit Apartments | 0 (0.0%) | 0 (0.0%) |
| 3 or 4 Unit Apartments | 0 (0.0%) | 18 (100.0%) |
| 5 to 9 Unit Apartments | 0 (0.0%) | 0 (0.0%) |
| 10 or more Apartments | 0 (0.0%) | 0 (0.0%) |
| Mobile Home / Other | 7 (33.3%) | 14 (66.7%) |
| Total | 120 (62.2%) | 73 (37.8%) |
Housing Structures by Number of Rooms in Sulphur Springs
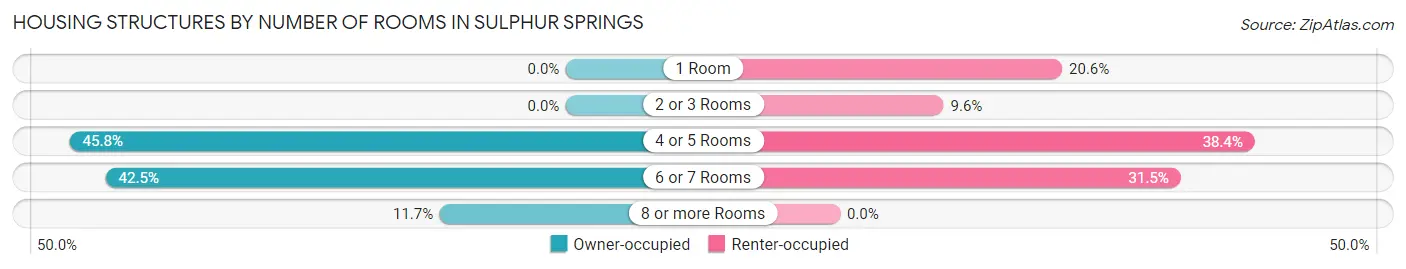
| Number of Rooms | Owner-occupied | Renter-occupied |
| 1 Room | 0 (0.0%) | 15 (20.5%) |
| 2 or 3 Rooms | 0 (0.0%) | 7 (9.6%) |
| 4 or 5 Rooms | 55 (45.8%) | 28 (38.4%) |
| 6 or 7 Rooms | 51 (42.5%) | 23 (31.5%) |
| 8 or more Rooms | 14 (11.7%) | 0 (0.0%) |
| Total | 120 (100.0%) | 73 (100.0%) |
Housing Structure by Heating Type in Sulphur Springs
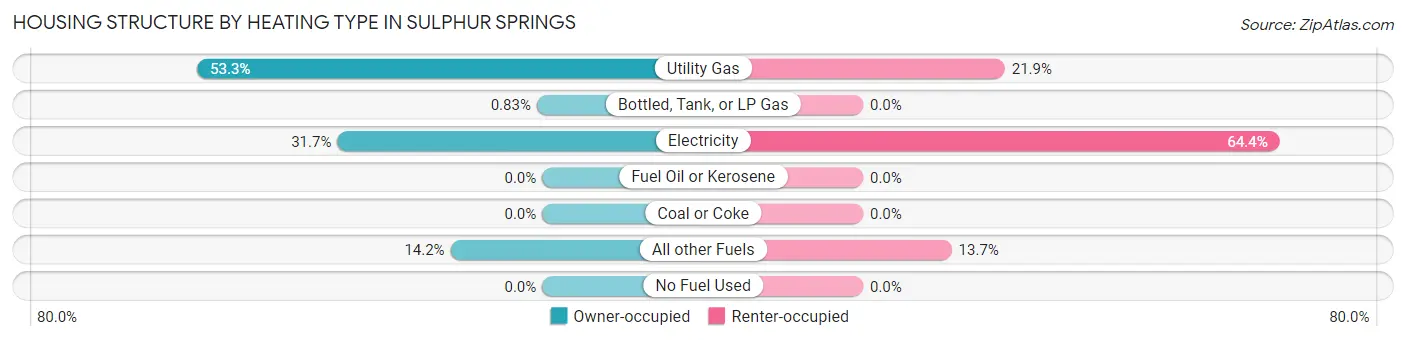
| Heating Type | Owner-occupied | Renter-occupied |
| Utility Gas | 64 (53.3%) | 16 (21.9%) |
| Bottled, Tank, or LP Gas | 1 (0.8%) | 0 (0.0%) |
| Electricity | 38 (31.7%) | 47 (64.4%) |
| Fuel Oil or Kerosene | 0 (0.0%) | 0 (0.0%) |
| Coal or Coke | 0 (0.0%) | 0 (0.0%) |
| All other Fuels | 17 (14.2%) | 10 (13.7%) |
| No Fuel Used | 0 (0.0%) | 0 (0.0%) |
| Total | 120 (100.0%) | 73 (100.0%) |
Household Vehicle Usage in Sulphur Springs
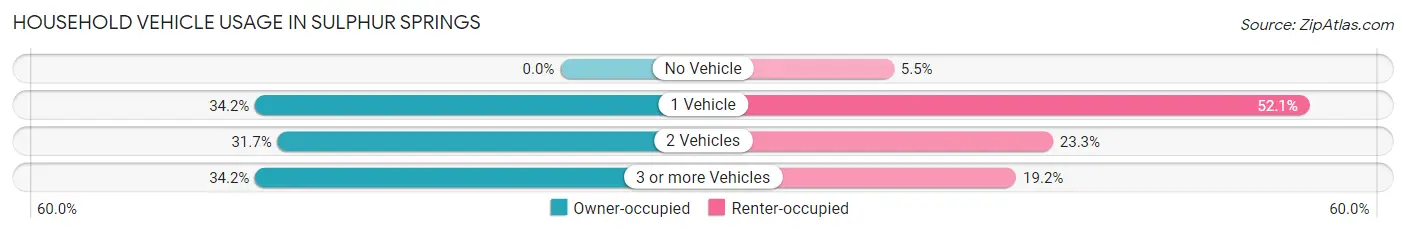
| Vehicles per Household | Owner-occupied | Renter-occupied |
| No Vehicle | 0 (0.0%) | 4 (5.5%) |
| 1 Vehicle | 41 (34.2%) | 38 (52.0%) |
| 2 Vehicles | 38 (31.7%) | 17 (23.3%) |
| 3 or more Vehicles | 41 (34.2%) | 14 (19.2%) |
| Total | 120 (100.0%) | 73 (100.0%) |
Real Estate & Mortgages in Sulphur Springs
Real Estate and Mortgage Overview in Sulphur Springs
| Characteristic | Without Mortgage | With Mortgage |
| Housing Units | 280 | 112 |
| Median Property Value | $107,700 | $131,800 |
| Median Household Income | $32,008 | $8 |
| Monthly Housing Costs | $293 | $0 |
| Real Estate Taxes | $678 | $0 |
Property Value by Mortgage Status in Sulphur Springs
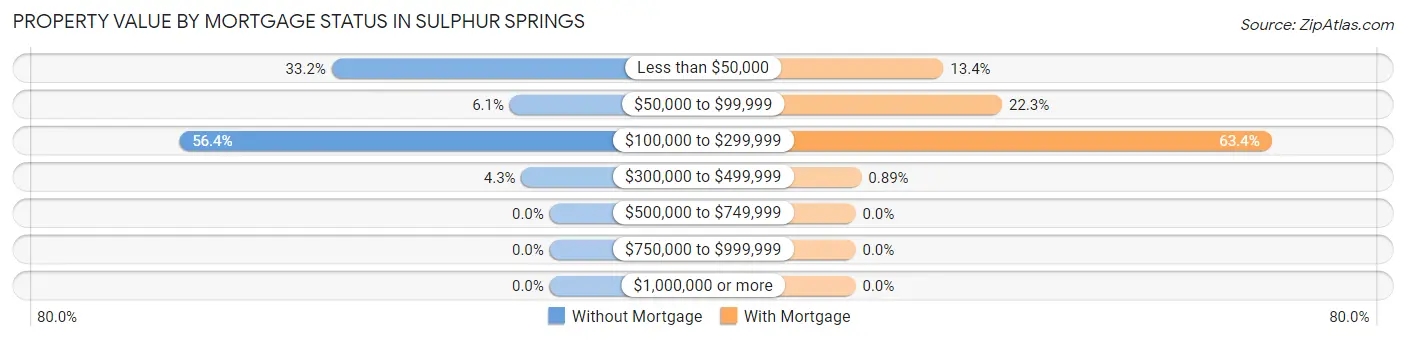
| Property Value | Without Mortgage | With Mortgage |
| Less than $50,000 | 93 (33.2%) | 15 (13.4%) |
| $50,000 to $99,999 | 17 (6.1%) | 25 (22.3%) |
| $100,000 to $299,999 | 158 (56.4%) | 71 (63.4%) |
| $300,000 to $499,999 | 12 (4.3%) | 1 (0.9%) |
| $500,000 to $749,999 | 0 (0.0%) | 0 (0.0%) |
| $750,000 to $999,999 | 0 (0.0%) | 0 (0.0%) |
| $1,000,000 or more | 0 (0.0%) | 0 (0.0%) |
| Total | 280 (100.0%) | 112 (100.0%) |
Household Income by Mortgage Status in Sulphur Springs
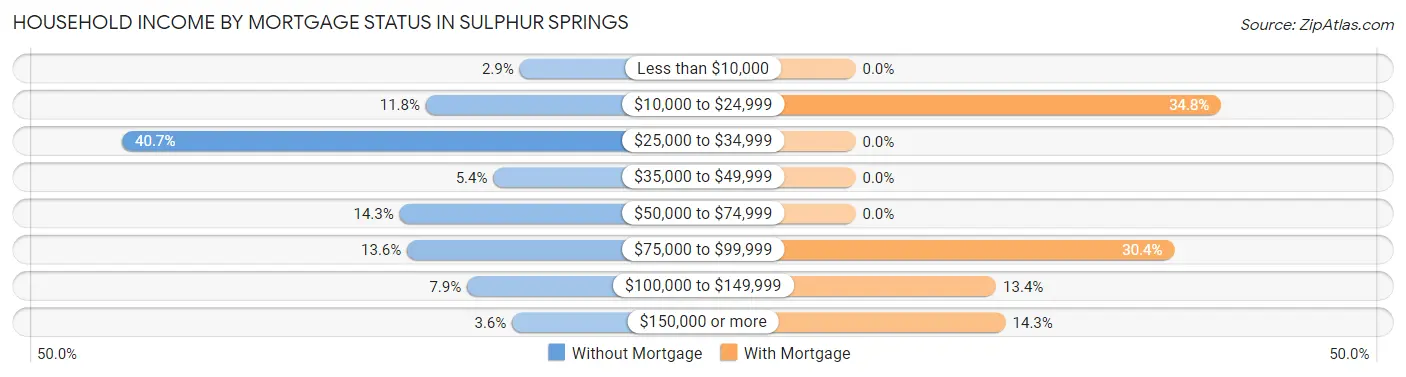
| Household Income | Without Mortgage | With Mortgage |
| Less than $10,000 | 8 (2.9%) | 0 (0.0%) |
| $10,000 to $24,999 | 33 (11.8%) | 39 (34.8%) |
| $25,000 to $34,999 | 114 (40.7%) | 0 (0.0%) |
| $35,000 to $49,999 | 15 (5.4%) | 0 (0.0%) |
| $50,000 to $74,999 | 40 (14.3%) | 0 (0.0%) |
| $75,000 to $99,999 | 38 (13.6%) | 34 (30.4%) |
| $100,000 to $149,999 | 22 (7.9%) | 15 (13.4%) |
| $150,000 or more | 10 (3.6%) | 16 (14.3%) |
| Total | 280 (100.0%) | 112 (100.0%) |
Property Value to Household Income Ratio in Sulphur Springs
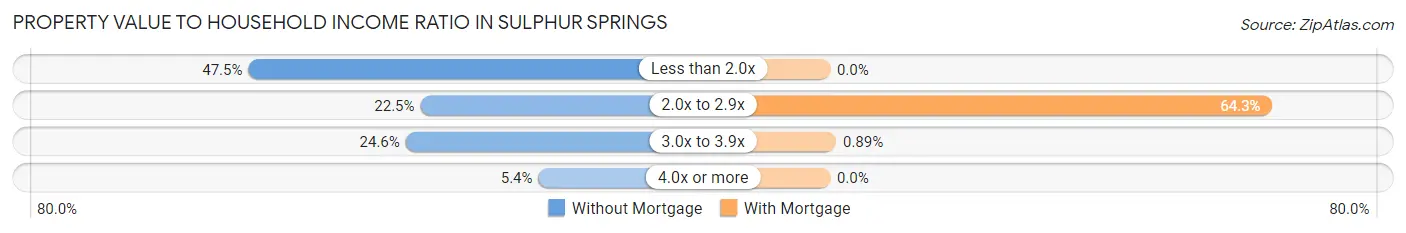
| Value-to-Income Ratio | Without Mortgage | With Mortgage |
| Less than 2.0x | 133 (47.5%) | 0 (0.0%) |
| 2.0x to 2.9x | 63 (22.5%) | 72 (64.3%) |
| 3.0x to 3.9x | 69 (24.6%) | 1 (0.9%) |
| 4.0x or more | 15 (5.4%) | 0 (0.0%) |
| Total | 280 (100.0%) | 112 (100.0%) |
Real Estate Taxes by Mortgage Status in Sulphur Springs
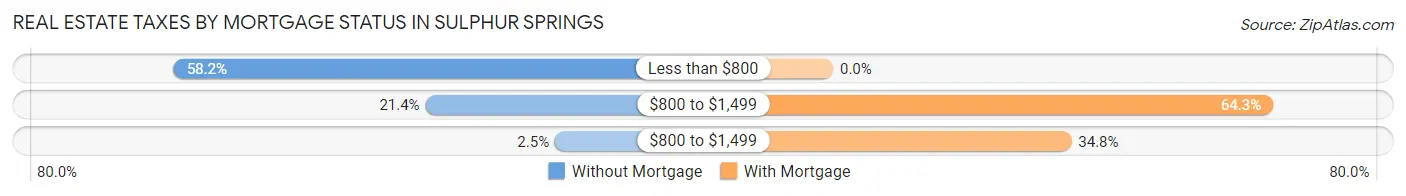
| Property Taxes | Without Mortgage | With Mortgage |
| Less than $800 | 163 (58.2%) | 0 (0.0%) |
| $800 to $1,499 | 60 (21.4%) | 72 (64.3%) |
| $800 to $1,499 | 7 (2.5%) | 39 (34.8%) |
| Total | 280 (100.0%) | 112 (100.0%) |
Health & Disability in Sulphur Springs
Health Insurance Coverage by Age in Sulphur Springs
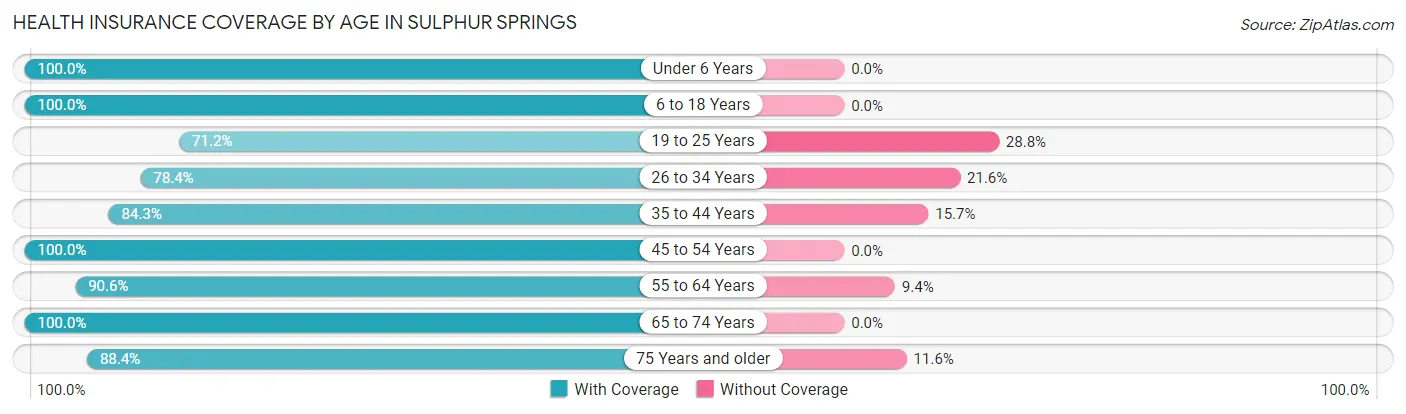
| Age Bracket | With Coverage | Without Coverage |
| Under 6 Years | 95 (100.0%) | 0 (0.0%) |
| 6 to 18 Years | 155 (100.0%) | 0 (0.0%) |
| 19 to 25 Years | 79 (71.2%) | 32 (28.8%) |
| 26 to 34 Years | 98 (78.4%) | 27 (21.6%) |
| 35 to 44 Years | 113 (84.3%) | 21 (15.7%) |
| 45 to 54 Years | 37 (100.0%) | 0 (0.0%) |
| 55 to 64 Years | 163 (90.6%) | 17 (9.4%) |
| 65 to 74 Years | 153 (100.0%) | 0 (0.0%) |
| 75 Years and older | 114 (88.4%) | 15 (11.6%) |
| Total | 1,007 (90.0%) | 112 (10.0%) |
Health Insurance Coverage by Citizenship Status in Sulphur Springs
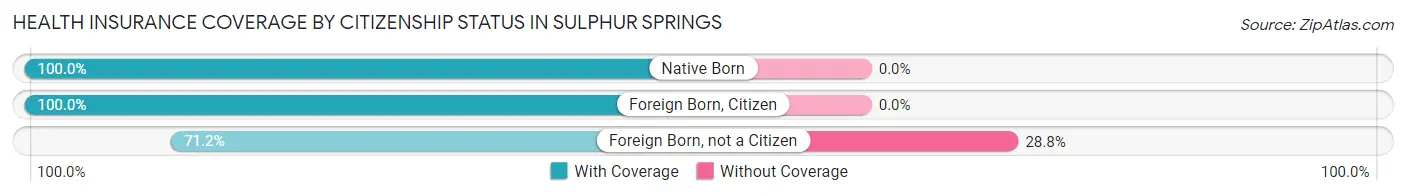
| Citizenship Status | With Coverage | Without Coverage |
| Native Born | 95 (100.0%) | 0 (0.0%) |
| Foreign Born, Citizen | 155 (100.0%) | 0 (0.0%) |
| Foreign Born, not a Citizen | 79 (71.2%) | 32 (28.8%) |
Health Insurance Coverage by Household Income in Sulphur Springs
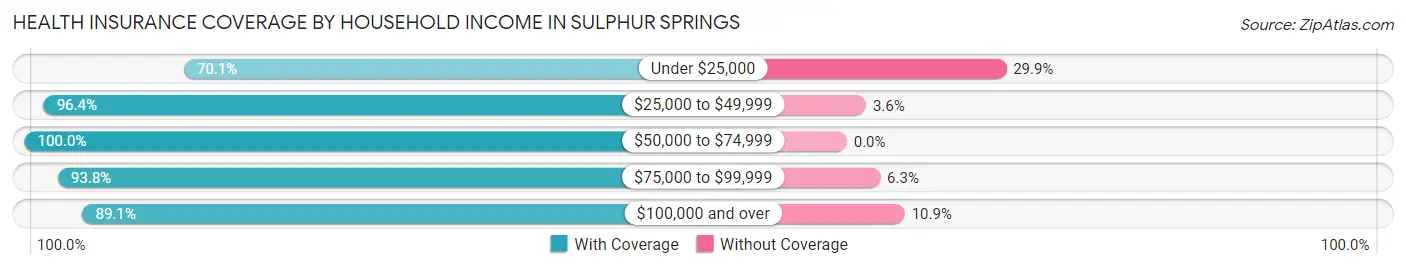
| Household Income | With Coverage | Without Coverage |
| Under $25,000 | 148 (70.1%) | 63 (29.9%) |
| $25,000 to $49,999 | 215 (96.4%) | 8 (3.6%) |
| $50,000 to $74,999 | 192 (100.0%) | 0 (0.0%) |
| $75,000 to $99,999 | 255 (93.8%) | 17 (6.2%) |
| $100,000 and over | 197 (89.1%) | 24 (10.9%) |
Public vs Private Health Insurance Coverage by Age in Sulphur Springs
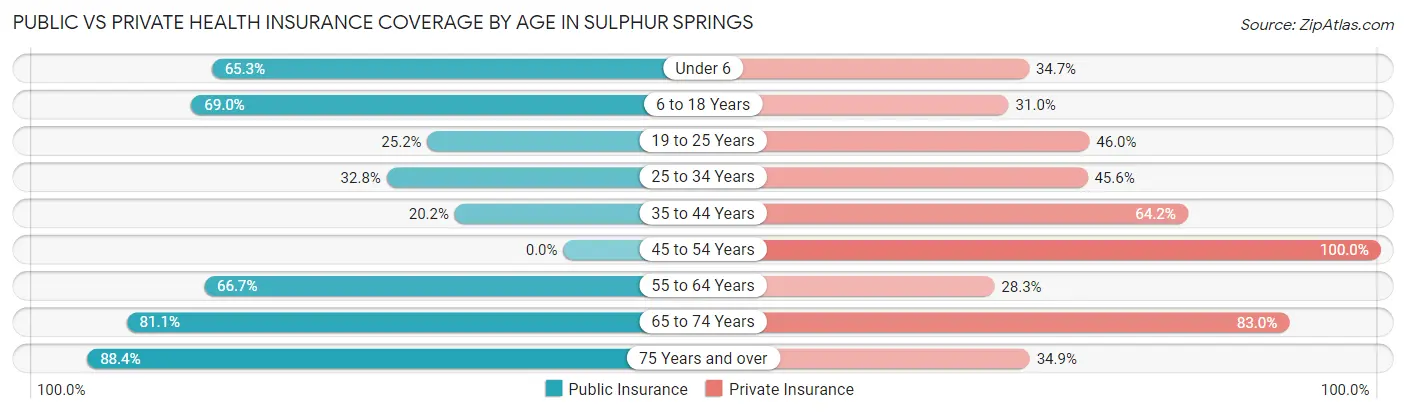
| Age Bracket | Public Insurance | Private Insurance |
| Under 6 | 62 (65.3%) | 33 (34.7%) |
| 6 to 18 Years | 107 (69.0%) | 48 (31.0%) |
| 19 to 25 Years | 28 (25.2%) | 51 (46.0%) |
| 25 to 34 Years | 41 (32.8%) | 57 (45.6%) |
| 35 to 44 Years | 27 (20.2%) | 86 (64.2%) |
| 45 to 54 Years | 0 (0.0%) | 37 (100.0%) |
| 55 to 64 Years | 120 (66.7%) | 51 (28.3%) |
| 65 to 74 Years | 124 (81.0%) | 127 (83.0%) |
| 75 Years and over | 114 (88.4%) | 45 (34.9%) |
| Total | 623 (55.7%) | 535 (47.8%) |
Disability Status by Sex by Age in Sulphur Springs
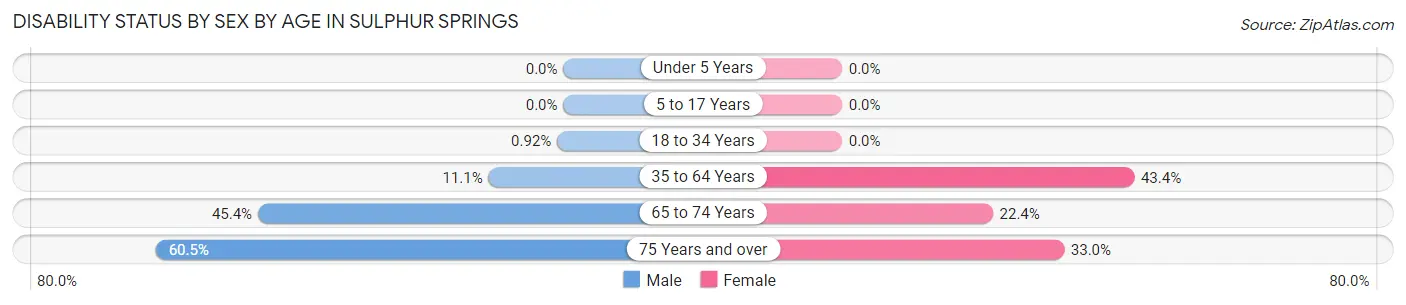
| Age Bracket | Male | Female |
| Under 5 Years | 0 (0.0%) | 0 (0.0%) |
| 5 to 17 Years | 0 (0.0%) | 0 (0.0%) |
| 18 to 34 Years | 1 (0.9%) | 0 (0.0%) |
| 35 to 64 Years | 18 (11.1%) | 82 (43.4%) |
| 65 to 74 Years | 39 (45.4%) | 15 (22.4%) |
| 75 Years and over | 23 (60.5%) | 30 (33.0%) |
Disability Class by Sex by Age in Sulphur Springs
Disability Class: Hearing Difficulty
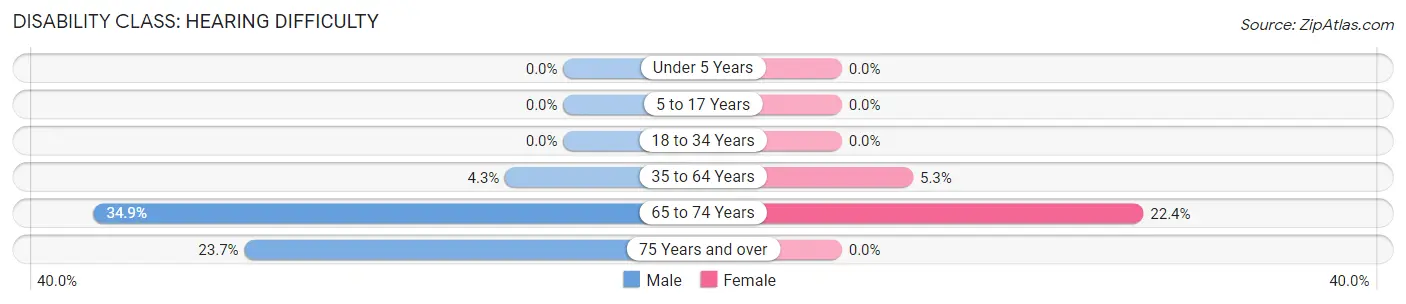
| Age Bracket | Male | Female |
| Under 5 Years | 0 (0.0%) | 0 (0.0%) |
| 5 to 17 Years | 0 (0.0%) | 0 (0.0%) |
| 18 to 34 Years | 0 (0.0%) | 0 (0.0%) |
| 35 to 64 Years | 7 (4.3%) | 10 (5.3%) |
| 65 to 74 Years | 30 (34.9%) | 15 (22.4%) |
| 75 Years and over | 9 (23.7%) | 0 (0.0%) |
Disability Class: Vision Difficulty
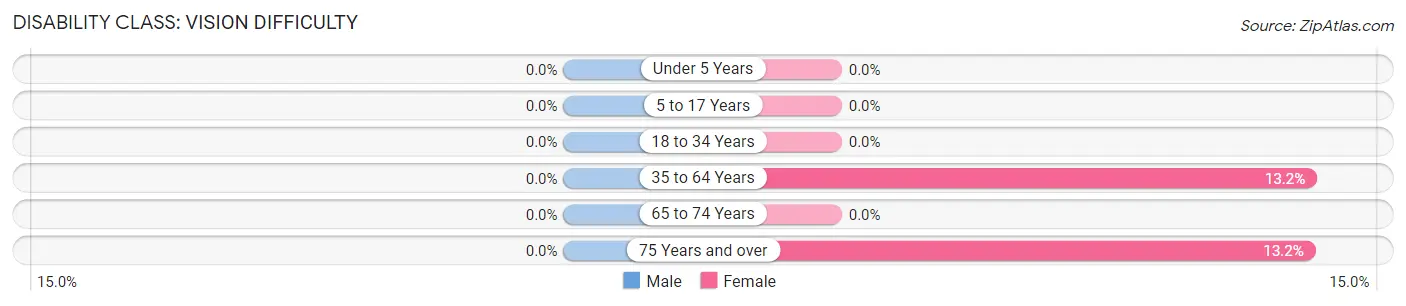
| Age Bracket | Male | Female |
| Under 5 Years | 0 (0.0%) | 0 (0.0%) |
| 5 to 17 Years | 0 (0.0%) | 0 (0.0%) |
| 18 to 34 Years | 0 (0.0%) | 0 (0.0%) |
| 35 to 64 Years | 0 (0.0%) | 25 (13.2%) |
| 65 to 74 Years | 0 (0.0%) | 0 (0.0%) |
| 75 Years and over | 0 (0.0%) | 12 (13.2%) |
Disability Class: Cognitive Difficulty
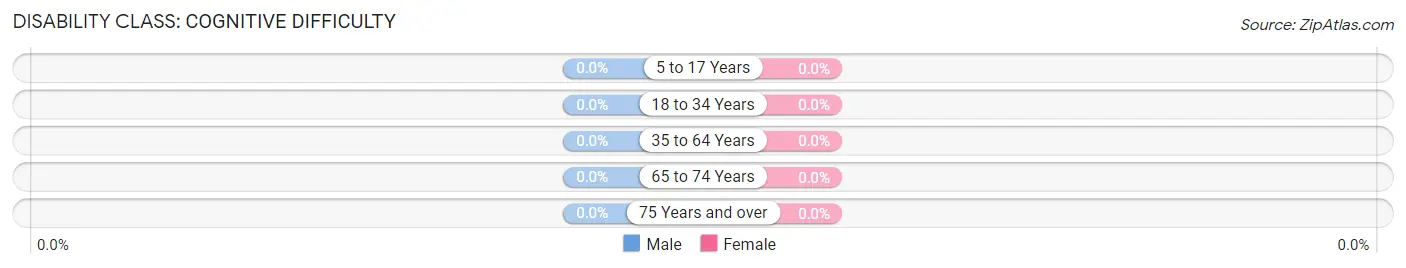
| Age Bracket | Male | Female |
| 5 to 17 Years | 0 (0.0%) | 0 (0.0%) |
| 18 to 34 Years | 0 (0.0%) | 0 (0.0%) |
| 35 to 64 Years | 0 (0.0%) | 0 (0.0%) |
| 65 to 74 Years | 0 (0.0%) | 0 (0.0%) |
| 75 Years and over | 0 (0.0%) | 0 (0.0%) |
Disability Class: Ambulatory Difficulty
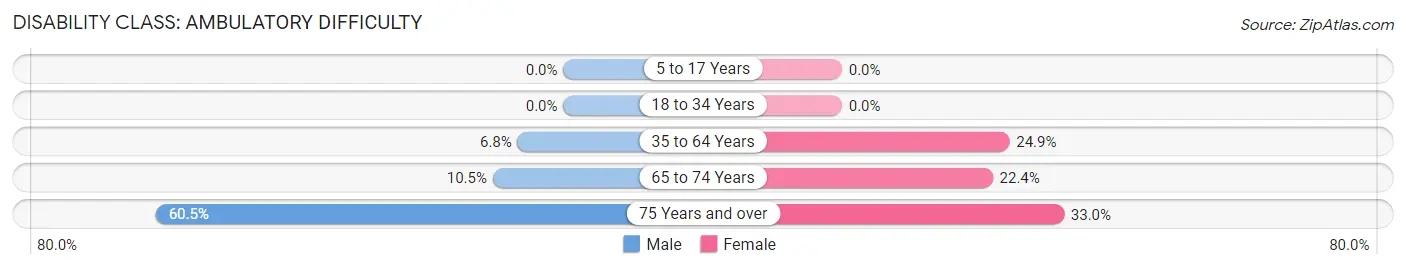
| Age Bracket | Male | Female |
| 5 to 17 Years | 0 (0.0%) | 0 (0.0%) |
| 18 to 34 Years | 0 (0.0%) | 0 (0.0%) |
| 35 to 64 Years | 11 (6.8%) | 47 (24.9%) |
| 65 to 74 Years | 9 (10.5%) | 15 (22.4%) |
| 75 Years and over | 23 (60.5%) | 30 (33.0%) |
Disability Class: Self-Care Difficulty
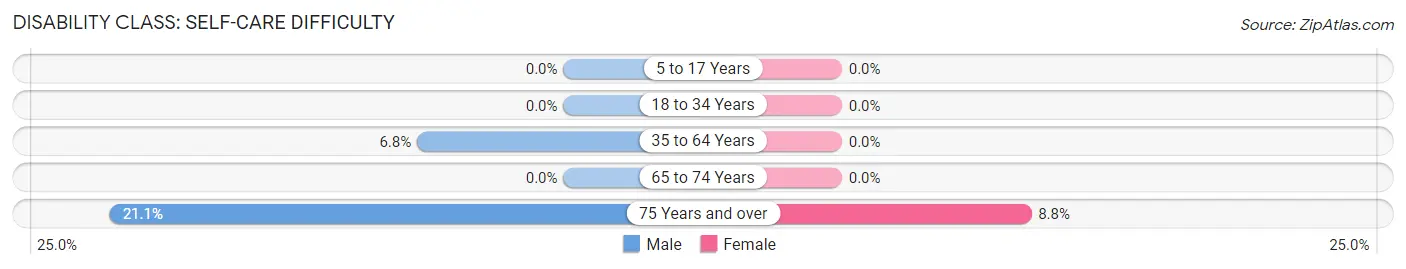
| Age Bracket | Male | Female |
| 5 to 17 Years | 0 (0.0%) | 0 (0.0%) |
| 18 to 34 Years | 0 (0.0%) | 0 (0.0%) |
| 35 to 64 Years | 11 (6.8%) | 0 (0.0%) |
| 65 to 74 Years | 0 (0.0%) | 0 (0.0%) |
| 75 Years and over | 8 (21.0%) | 8 (8.8%) |
Technology Access in Sulphur Springs
Computing Device Access in Sulphur Springs
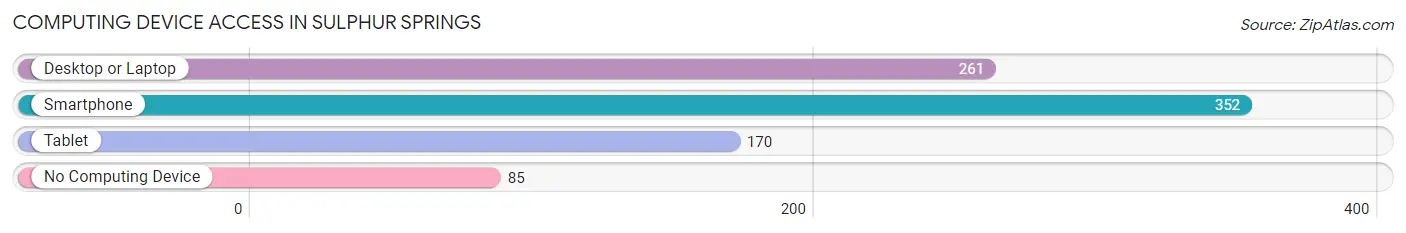
| Device Type | # Households | % Households |
| Desktop or Laptop | 261 | 57.4% |
| Smartphone | 352 | 77.4% |
| Tablet | 170 | 37.4% |
| No Computing Device | 85 | 18.7% |
| Total | 455 | 100.0% |
Internet Access in Sulphur Springs
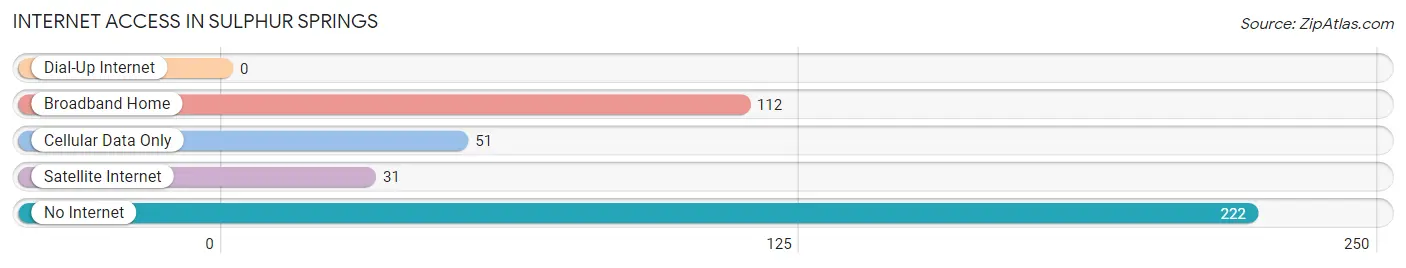
| Internet Type | # Households | % Households |
| Dial-Up Internet | 0 | 0.0% |
| Broadband Home | 112 | 24.6% |
| Cellular Data Only | 51 | 11.2% |
| Satellite Internet | 31 | 6.8% |
| No Internet | 222 | 48.8% |
| Total | 455 | 100.0% |
Sulphur Springs Summary
Sulphur Springs is a small town located in the Ozark Mountains of Arkansas. It is situated in the northwest corner of the state, near the Oklahoma border. The town was founded in 1883 and has a population of approximately 1,000 people.
History
Sulphur Springs was founded in 1883 by a group of settlers from Missouri. The town was named after the nearby Sulphur Springs, which were believed to have healing properties. The town quickly grew and by the early 1900s, it had become a popular tourist destination. The town was known for its mineral springs, which were believed to have healing properties.
In the early 1900s, the town was home to a number of businesses, including a hotel, a general store, a blacksmith shop, and a sawmill. The town also had a school, a post office, and a bank.
In the 1920s, the town began to decline as the popularity of the mineral springs began to wane. The Great Depression further exacerbated the decline of the town. In the 1940s, the town was almost completely abandoned.
In the 1950s, the town began to experience a resurgence. The town was revitalized by the construction of a new highway, which connected Sulphur Springs to the nearby towns of Fayetteville and Springdale. The town also experienced a population boom, as many people moved to the area to take advantage of the new highway.
Geography
Sulphur Springs is located in the northwest corner of Arkansas, near the Oklahoma border. The town is situated in the Ozark Mountains, which are known for their rugged terrain and lush forests. The town is located at the intersection of two major highways, US Highway 412 and Arkansas Highway 59.
The town is located in the White River Valley, which is known for its fertile soil and abundant wildlife. The White River runs through the town, providing a source of recreation for the locals.
Economy
Sulphur Springs is a small, rural town with a limited economy. The town is home to a number of small businesses, including a general store, a hardware store, and a few restaurants. The town also has a few small manufacturing businesses, which produce a variety of products, including furniture and clothing.
The town is also home to a number of farms, which produce a variety of crops, including corn, soybeans, and wheat. The town is also home to a number of small businesses, which provide services, such as auto repair, plumbing, and electrical work.
Demographics
As of the 2010 census, the population of Sulphur Springs was 1,000 people. The town is predominantly white, with a small minority population. The median household income is $35,000, and the median age is 40 years old. The town has a high rate of poverty, with nearly 30% of the population living below the poverty line.
Conclusion
Sulphur Springs is a small town located in the Ozark Mountains of Arkansas. The town was founded in 1883 and has a population of approximately 1,000 people. The town is known for its mineral springs, which were believed to have healing properties. The town has a limited economy, with a number of small businesses and farms. The town is predominantly white, with a small minority population. The median household income is $35,000, and the median age is 40 years old.
Common Questions
What is Per Capita Income in Sulphur Springs?
Per Capita income in Sulphur Springs is $33,472.
What is the Median Family Income in Sulphur Springs?
Median Family Income in Sulphur Springs is $51,422.
What is the Median Household income in Sulphur Springs?
Median Household Income in Sulphur Springs is $32,275.
What is Income or Wage Gap in Sulphur Springs?
Income or Wage Gap in Sulphur Springs is 17.6%.
Women in Sulphur Springs earn 82.4 cents for every dollar earned by a man.
What is Family Income Deficit in Sulphur Springs?
Family Income Deficit in Sulphur Springs is $14,162.
Families that are below poverty line in Sulphur Springs earn $14,162 less on average than the poverty threshold level.
What is Inequality or Gini Index in Sulphur Springs?
Inequality or Gini Index in Sulphur Springs is 0.61.
What is the Total Population of Sulphur Springs?
Total Population of Sulphur Springs is 1,119.
What is the Total Male Population of Sulphur Springs?
Total Male Population of Sulphur Springs is 546.
What is the Total Female Population of Sulphur Springs?
Total Female Population of Sulphur Springs is 573.
What is the Ratio of Males per 100 Females in Sulphur Springs?
There are 95.29 Males per 100 Females in Sulphur Springs.
What is the Ratio of Females per 100 Males in Sulphur Springs?
There are 104.95 Females per 100 Males in Sulphur Springs.
What is the Median Population Age in Sulphur Springs?
Median Population Age in Sulphur Springs is 37.3 Years.
What is the Average Family Size in Sulphur Springs
Average Family Size in Sulphur Springs is 3.0 People.
What is the Average Household Size in Sulphur Springs
Average Household Size in Sulphur Springs is 2.5 People.
How Large is the Labor Force in Sulphur Springs?
There are 400 People in the Labor Forcein in Sulphur Springs.
What is the Percentage of People in the Labor Force in Sulphur Springs?
44.8% of People are in the Labor Force in Sulphur Springs.