Piggott, AR Map & Demographics
Piggott Map
Piggott Overview
$24,537
PER CAPITA INCOME
$47,649
AVG FAMILY INCOME
$43,255
AVG HOUSEHOLD INCOME
31.6%
WAGE / INCOME GAP [ % ]
68.4¢/ $1
WAGE / INCOME GAP [ $ ]
0.44
INEQUALITY / GINI INDEX
3,610
TOTAL POPULATION
1,743
MALE POPULATION
1,867
FEMALE POPULATION
93.36
MALES / 100 FEMALES
107.11
FEMALES / 100 MALES
37.6
MEDIAN AGE
2.9
AVG FAMILY SIZE
2.4
AVG HOUSEHOLD SIZE
1,648
LABOR FORCE [ PEOPLE ]
61.4%
PERCENT IN LABOR FORCE
3.0%
UNEMPLOYMENT RATE
Piggott Zip Codes
Piggott Area Codes
Income in Piggott
Income Overview in Piggott
Per Capita Income in Piggott is $24,537, while median incomes of families and households are $47,649 and $43,255 respectively.
| Characteristic | Number | Measure |
| Per Capita Income | 3,610 | $24,537 |
| Median Family Income | 971 | $47,649 |
| Mean Family Income | 971 | $65,450 |
| Median Household Income | 1,459 | $43,255 |
| Mean Household Income | 1,459 | $57,814 |
| Income Deficit | 971 | $0 |
| Wage / Income Gap (%) | 3,610 | 31.63% |
| Wage / Income Gap ($) | 3,610 | 68.37¢ per $1 |
| Gini / Inequality Index | 3,610 | 0.44 |
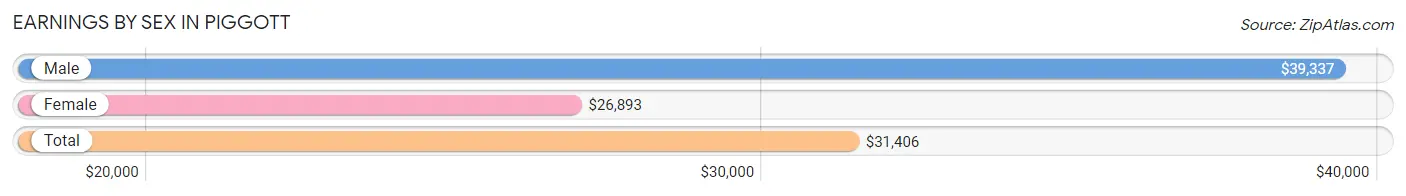
Earnings by Sex in Piggott
Average Earnings in Piggott are $31,406, $39,337 for men and $26,893 for women, a difference of 31.6%.
| Sex | Number | Average Earnings |
| Male | 830 (48.0%) | $39,337 |
| Female | 899 (52.0%) | $26,893 |
| Total | 1,729 (100.0%) | $31,406 |
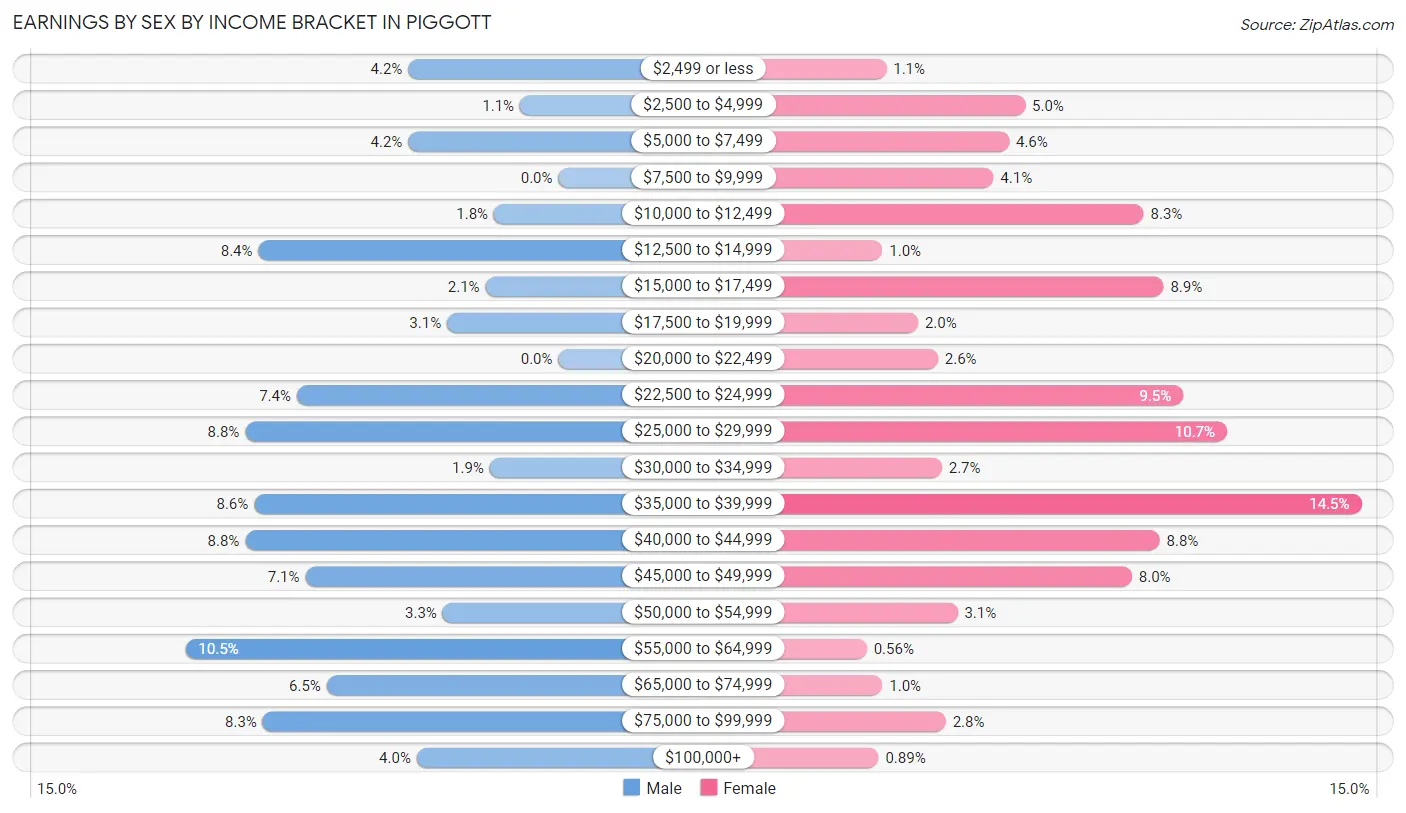
Earnings by Sex by Income Bracket in Piggott
The most common earnings brackets in Piggott are $55,000 to $64,999 for men (87 | 10.5%) and $35,000 to $39,999 for women (130 | 14.5%).
| Income | Male | Female |
| $2,499 or less | 35 (4.2%) | 10 (1.1%) |
| $2,500 to $4,999 | 9 (1.1%) | 45 (5.0%) |
| $5,000 to $7,499 | 35 (4.2%) | 41 (4.6%) |
| $7,500 to $9,999 | 0 (0.0%) | 37 (4.1%) |
| $10,000 to $12,499 | 15 (1.8%) | 75 (8.3%) |
| $12,500 to $14,999 | 70 (8.4%) | 9 (1.0%) |
| $15,000 to $17,499 | 17 (2.1%) | 80 (8.9%) |
| $17,500 to $19,999 | 26 (3.1%) | 18 (2.0%) |
| $20,000 to $22,499 | 0 (0.0%) | 23 (2.6%) |
| $22,500 to $24,999 | 61 (7.3%) | 85 (9.5%) |
| $25,000 to $29,999 | 73 (8.8%) | 96 (10.7%) |
| $30,000 to $34,999 | 16 (1.9%) | 24 (2.7%) |
| $35,000 to $39,999 | 71 (8.6%) | 130 (14.5%) |
| $40,000 to $44,999 | 73 (8.8%) | 79 (8.8%) |
| $45,000 to $49,999 | 59 (7.1%) | 72 (8.0%) |
| $50,000 to $54,999 | 27 (3.3%) | 28 (3.1%) |
| $55,000 to $64,999 | 87 (10.5%) | 5 (0.6%) |
| $65,000 to $74,999 | 54 (6.5%) | 9 (1.0%) |
| $75,000 to $99,999 | 69 (8.3%) | 25 (2.8%) |
| $100,000+ | 33 (4.0%) | 8 (0.9%) |
| Total | 830 (100.0%) | 899 (100.0%) |
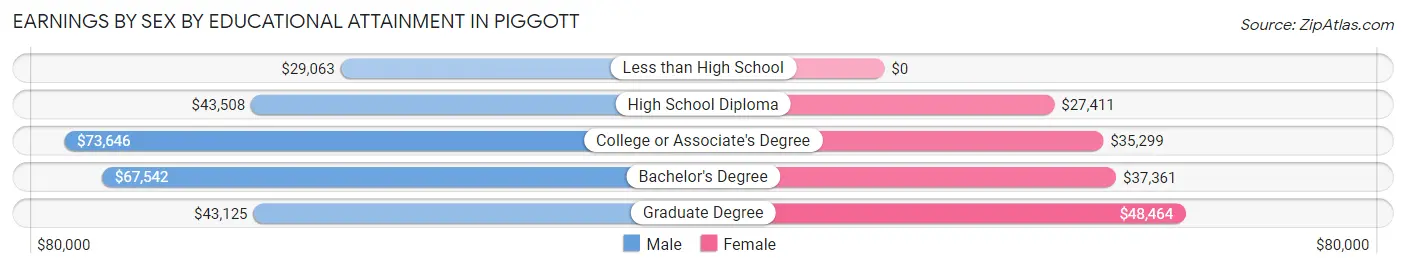
Earnings by Sex by Educational Attainment in Piggott
Average earnings in Piggott are $44,190 for men and $29,688 for women, a difference of 32.8%. Men with an educational attainment of college or associate's degree enjoy the highest average annual earnings of $73,646, while those with less than high school education earn the least with $29,063. Women with an educational attainment of graduate degree earn the most with the average annual earnings of $48,464, while those with high school diploma education have the smallest earnings of $27,411.
| Educational Attainment | Male Income | Female Income |
| Less than High School | $29,063 | $0 |
| High School Diploma | $43,508 | $27,411 |
| College or Associate's Degree | $73,646 | $35,299 |
| Bachelor's Degree | $67,542 | $37,361 |
| Graduate Degree | $43,125 | $48,464 |
| Total | $44,190 | $29,688 |
Family Income in Piggott
Family Income Brackets in Piggott
According to the Piggott family income data, there are 272 families falling into the $35,000 to $49,999 income range, which is the most common income bracket and makes up 28.0% of all families. Conversely, the $150,000 to $199,999 income bracket is the least frequent group with only 11 families (1.1%) belonging to this category.
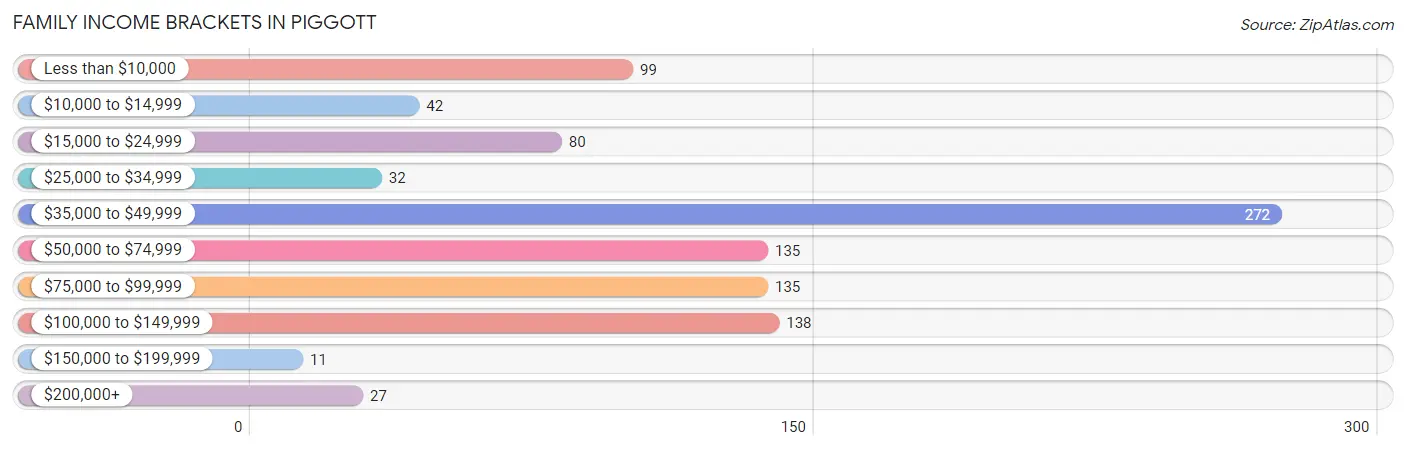
| Income Bracket | # Families | % Families |
| Less than $10,000 | 99 | 10.2% |
| $10,000 to $14,999 | 42 | 4.3% |
| $15,000 to $24,999 | 80 | 8.2% |
| $25,000 to $34,999 | 32 | 3.3% |
| $35,000 to $49,999 | 272 | 28.0% |
| $50,000 to $74,999 | 135 | 13.9% |
| $75,000 to $99,999 | 135 | 13.9% |
| $100,000 to $149,999 | 138 | 14.2% |
| $150,000 to $199,999 | 11 | 1.1% |
| $200,000+ | 27 | 2.8% |
Family Income by Famaliy Size in Piggott
2-person families (545 | 56.1%) account for the highest median family income in Piggott with $48,317 per family, while 2-person families (545 | 56.1%) have the highest median income of $24,158 per family member.
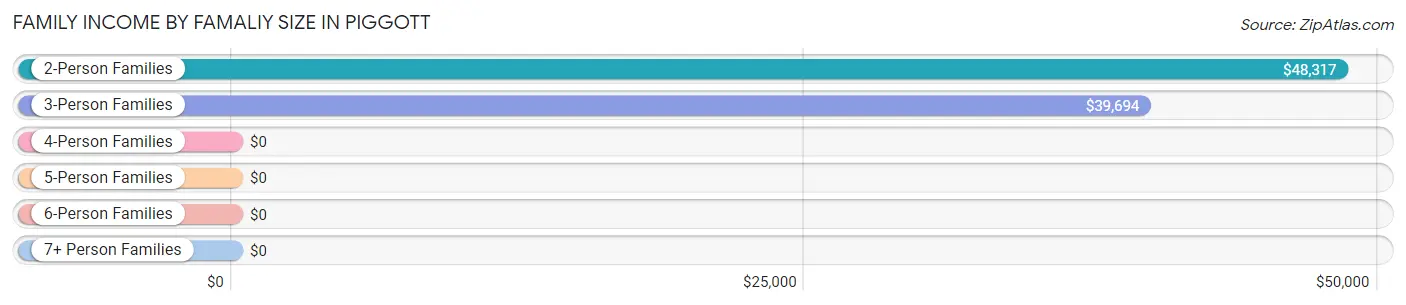
| Income Bracket | # Families | Median Income |
| 2-Person Families | 545 (56.1%) | $48,317 |
| 3-Person Families | 246 (25.3%) | $39,694 |
| 4-Person Families | 154 (15.9%) | $0 |
| 5-Person Families | 7 (0.7%) | $0 |
| 6-Person Families | 0 (0.0%) | $0 |
| 7+ Person Families | 19 (2.0%) | $0 |
| Total | 971 (100.0%) | $47,649 |
Family Income by Number of Earners in Piggott
The median family income in Piggott is $47,649, with families comprising 3+ earners (77) having the highest median family income of $94,271, while families with no earners (165) have the lowest median family income of $19,375, accounting for 7.9% and 17.0% of families, respectively.
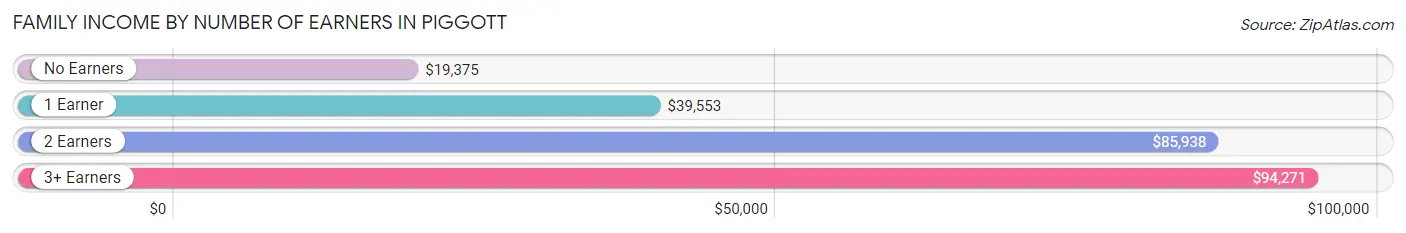
| Number of Earners | # Families | Median Income |
| No Earners | 165 (17.0%) | $19,375 |
| 1 Earner | 452 (46.6%) | $39,553 |
| 2 Earners | 277 (28.5%) | $85,938 |
| 3+ Earners | 77 (7.9%) | $94,271 |
| Total | 971 (100.0%) | $47,649 |
Household Income in Piggott
Household Income Brackets in Piggott
With 336 households falling in the category, the $35,000 to $49,999 income range is the most frequent in Piggott, accounting for 23.0% of all households. In contrast, only 12 households (0.8%) fall into the $150,000 to $199,999 income bracket, making it the least populous group.
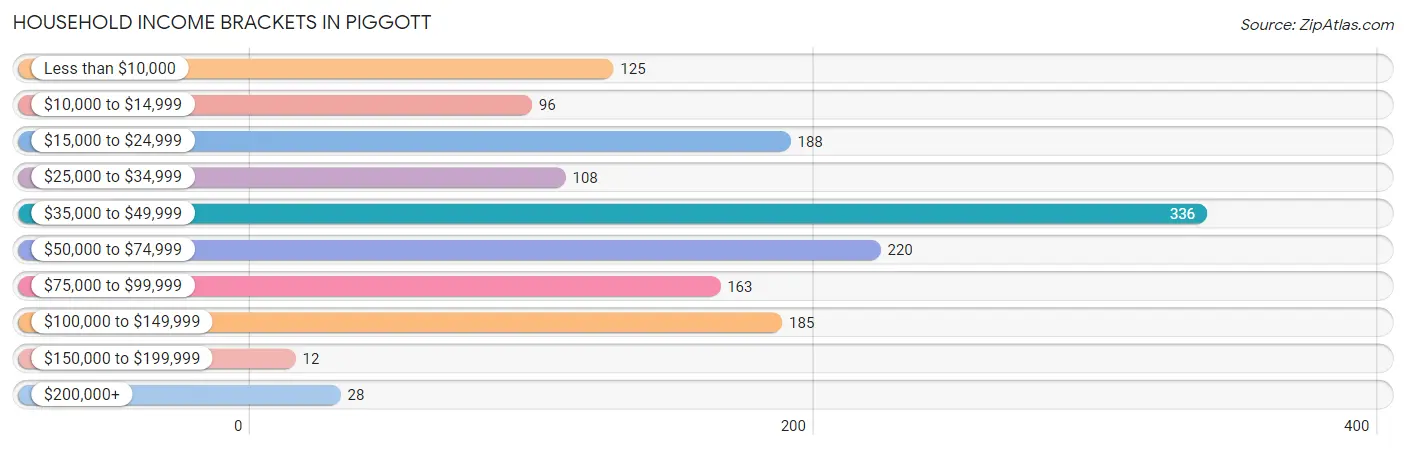
| Income Bracket | # Households | % Households |
| Less than $10,000 | 125 | 8.6% |
| $10,000 to $14,999 | 96 | 6.6% |
| $15,000 to $24,999 | 188 | 12.9% |
| $25,000 to $34,999 | 108 | 7.4% |
| $35,000 to $49,999 | 336 | 23.0% |
| $50,000 to $74,999 | 220 | 15.1% |
| $75,000 to $99,999 | 163 | 11.2% |
| $100,000 to $149,999 | 185 | 12.7% |
| $150,000 to $199,999 | 12 | 0.8% |
| $200,000+ | 28 | 1.9% |
Household Income by Householder Age in Piggott
The median household income in Piggott is $43,255, with the highest median household income of $50,667 found in the 45 to 64 years age bracket for the primary householder. A total of 420 households (28.8%) fall into this category. Meanwhile, the 65+ years age bracket for the primary householder has the lowest median household income of $36,290, with 546 households (37.4%) in this group.
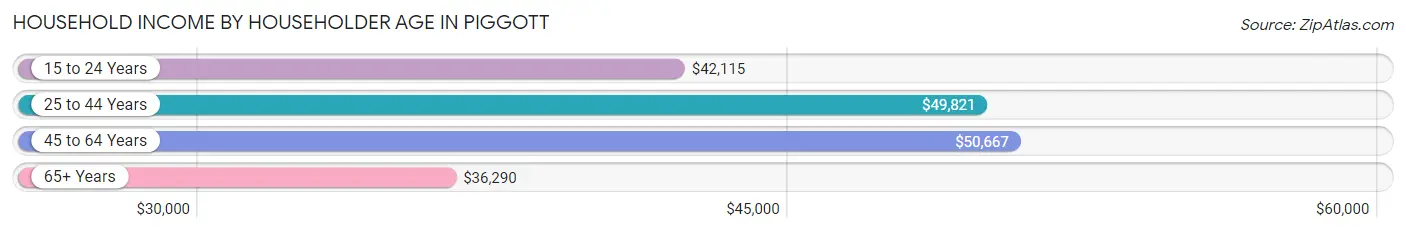
| Income Bracket | # Households | Median Income |
| 15 to 24 Years | 108 (7.4%) | $42,115 |
| 25 to 44 Years | 385 (26.4%) | $49,821 |
| 45 to 64 Years | 420 (28.8%) | $50,667 |
| 65+ Years | 546 (37.4%) | $36,290 |
| Total | 1,459 (100.0%) | $43,255 |
Poverty in Piggott
Income Below Poverty by Sex and Age in Piggott
With 21.2% poverty level for males and 28.2% for females among the residents of Piggott, 15 year old males and 15 year old females are the most vulnerable to poverty, with 33 males (100.0%) and 1 females (100.0%) in their respective age groups living below the poverty level.
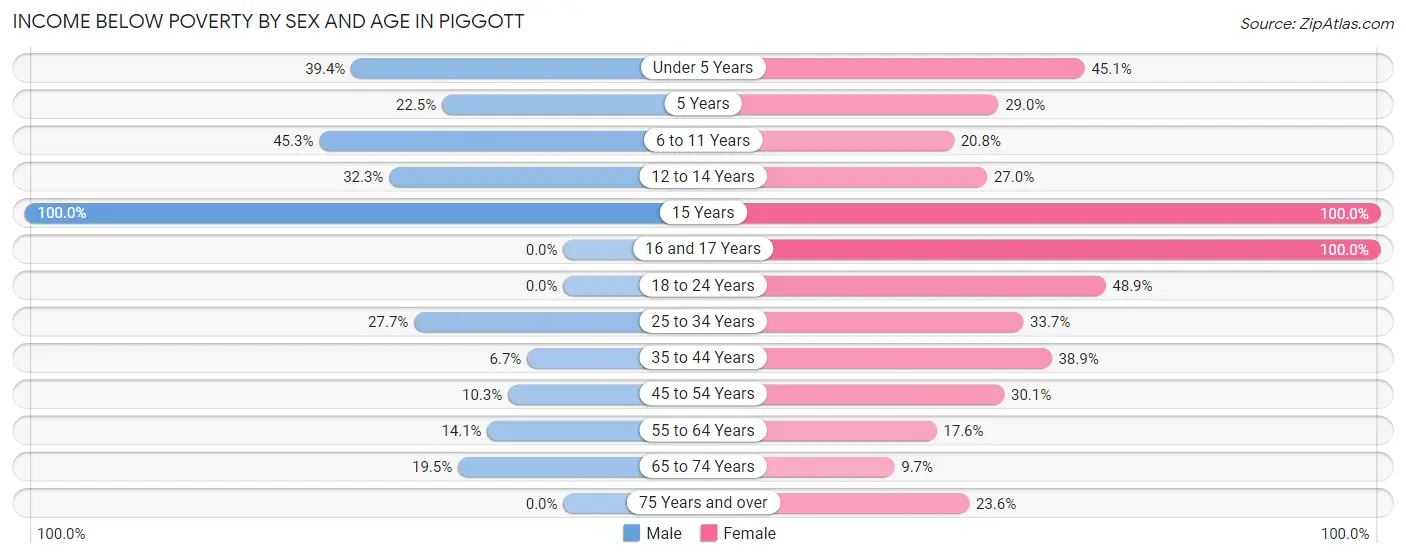
| Age Bracket | Male | Female |
| Under 5 Years | 76 (39.4%) | 41 (45.1%) |
| 5 Years | 9 (22.5%) | 18 (29.0%) |
| 6 to 11 Years | 58 (45.3%) | 16 (20.8%) |
| 12 to 14 Years | 43 (32.3%) | 38 (27.0%) |
| 15 Years | 33 (100.0%) | 1 (100.0%) |
| 16 and 17 Years | 0 (0.0%) | 8 (100.0%) |
| 18 to 24 Years | 0 (0.0%) | 91 (48.9%) |
| 25 to 34 Years | 54 (27.7%) | 70 (33.7%) |
| 35 to 44 Years | 8 (6.7%) | 65 (38.9%) |
| 45 to 54 Years | 16 (10.3%) | 25 (30.1%) |
| 55 to 64 Years | 31 (14.1%) | 63 (17.5%) |
| 65 to 74 Years | 33 (19.5%) | 19 (9.7%) |
| 75 Years and over | 0 (0.0%) | 55 (23.6%) |
| Total | 361 (21.2%) | 510 (28.2%) |
Income Above Poverty by Sex and Age in Piggott
According to the poverty statistics in Piggott, males aged 16 and 17 years and females aged 65 to 74 years are the age groups that are most secure financially, with 100.0% of males and 90.3% of females in these age groups living above the poverty line.
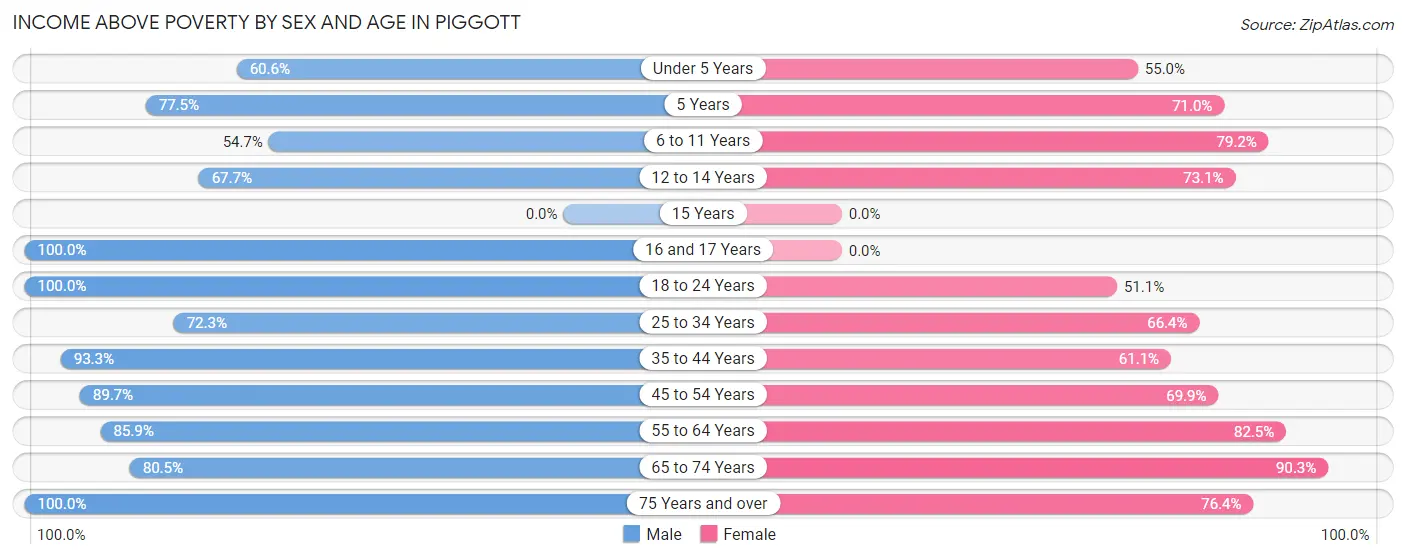
| Age Bracket | Male | Female |
| Under 5 Years | 117 (60.6%) | 50 (54.9%) |
| 5 Years | 31 (77.5%) | 44 (71.0%) |
| 6 to 11 Years | 70 (54.7%) | 61 (79.2%) |
| 12 to 14 Years | 90 (67.7%) | 103 (73.1%) |
| 15 Years | 0 (0.0%) | 0 (0.0%) |
| 16 and 17 Years | 32 (100.0%) | 0 (0.0%) |
| 18 to 24 Years | 162 (100.0%) | 95 (51.1%) |
| 25 to 34 Years | 141 (72.3%) | 138 (66.3%) |
| 35 to 44 Years | 111 (93.3%) | 102 (61.1%) |
| 45 to 54 Years | 140 (89.7%) | 58 (69.9%) |
| 55 to 64 Years | 189 (85.9%) | 296 (82.5%) |
| 65 to 74 Years | 136 (80.5%) | 176 (90.3%) |
| 75 Years and over | 121 (100.0%) | 178 (76.4%) |
| Total | 1,340 (78.8%) | 1,301 (71.8%) |
Income Below Poverty Among Married-Couple Families in Piggott
The poverty statistics for married-couple families in Piggott show that 7.3% or 41 of the total 560 families live below the poverty line. Families with 3 or 4 children have the highest poverty rate of 100.0%, comprising of 11 families. On the other hand, families with 5 or more children have the lowest poverty rate of 0.0%, which includes 0 families.
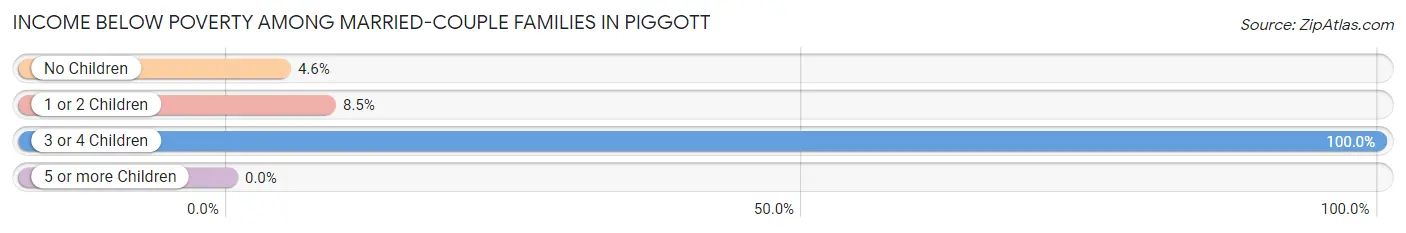
| Children | Above Poverty | Below Poverty |
| No Children | 393 (95.4%) | 19 (4.6%) |
| 1 or 2 Children | 118 (91.5%) | 11 (8.5%) |
| 3 or 4 Children | 0 (0.0%) | 11 (100.0%) |
| 5 or more Children | 8 (100.0%) | 0 (0.0%) |
| Total | 519 (92.7%) | 41 (7.3%) |
Income Below Poverty Among Single-Parent Households in Piggott
According to the poverty data in Piggott, 15.8% or 16 single-father households and 54.2% or 168 single-mother households are living below the poverty line. Among single-father households, those with no children have the highest poverty rate, with 8 households (100.0%) experiencing poverty. Likewise, among single-mother households, those with 3 or 4 children have the highest poverty rate, with 23 households (100.0%) falling below the poverty line.
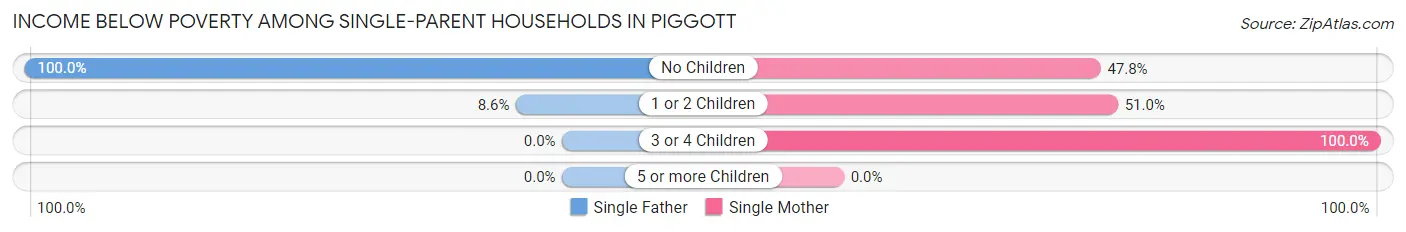
| Children | Single Father | Single Mother |
| No Children | 8 (100.0%) | 22 (47.8%) |
| 1 or 2 Children | 8 (8.6%) | 123 (51.0%) |
| 3 or 4 Children | 0 (0.0%) | 23 (100.0%) |
| 5 or more Children | 0 (0.0%) | 0 (0.0%) |
| Total | 16 (15.8%) | 168 (54.2%) |
Income Below Poverty Among Married-Couple vs Single-Parent Households in Piggott
The poverty data for Piggott shows that 41 of the married-couple family households (7.3%) and 184 of the single-parent households (44.8%) are living below the poverty level. Within the married-couple family households, those with 3 or 4 children have the highest poverty rate, with 11 households (100.0%) falling below the poverty line. Among the single-parent households, those with 3 or 4 children have the highest poverty rate, with 23 household (100.0%) living below poverty.
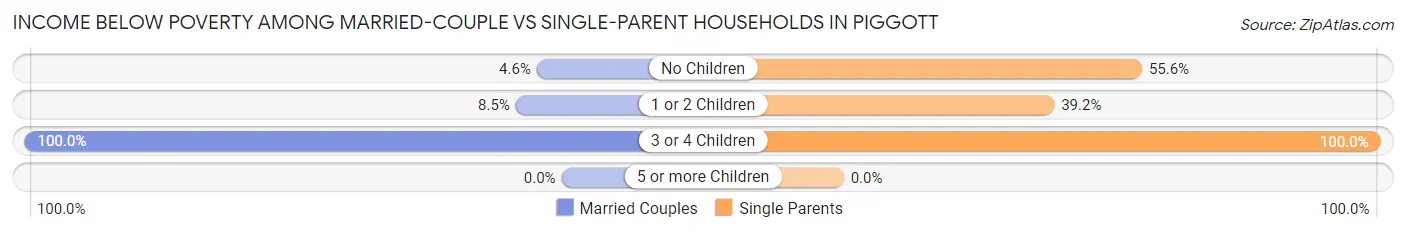
| Children | Married-Couple Families | Single-Parent Households |
| No Children | 19 (4.6%) | 30 (55.6%) |
| 1 or 2 Children | 11 (8.5%) | 131 (39.2%) |
| 3 or 4 Children | 11 (100.0%) | 23 (100.0%) |
| 5 or more Children | 0 (0.0%) | 0 (0.0%) |
| Total | 41 (7.3%) | 184 (44.8%) |
Race in Piggott
The most populous races in Piggott are White / Caucasian (3,508 | 97.2%), Two or more Races (67 | 1.9%), and Hispanic or Latino (32 | 0.9%).
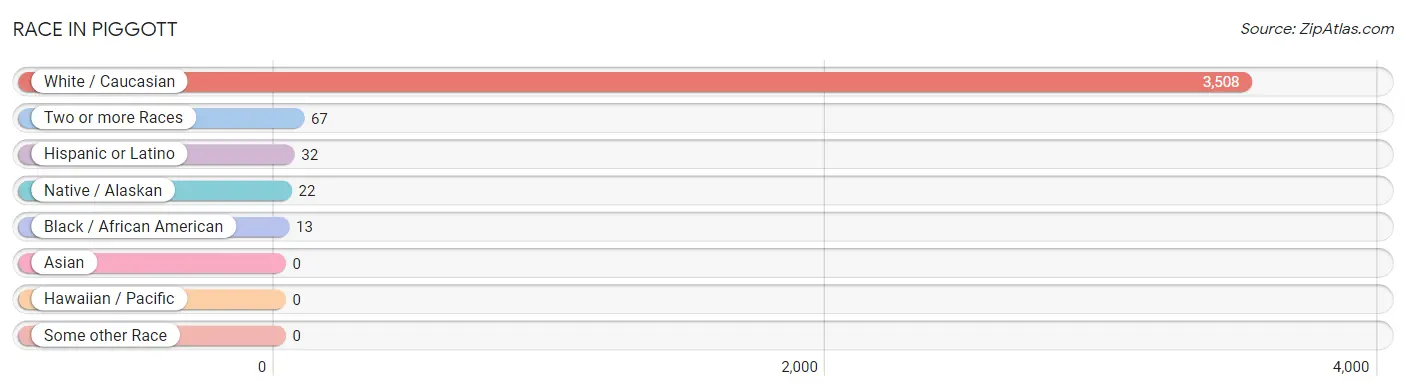
| Race | # Population | % Population |
| Asian | 0 | 0.0% |
| Black / African American | 13 | 0.4% |
| Hawaiian / Pacific | 0 | 0.0% |
| Hispanic or Latino | 32 | 0.9% |
| Native / Alaskan | 22 | 0.6% |
| White / Caucasian | 3,508 | 97.2% |
| Two or more Races | 67 | 1.9% |
| Some other Race | 0 | 0.0% |
| Total | 3,610 | 100.0% |
Ancestry in Piggott
The most populous ancestries reported in Piggott are American (570 | 15.8%), English (426 | 11.8%), German (400 | 11.1%), Irish (331 | 9.2%), and Scotch-Irish (48 | 1.3%), together accounting for 49.2% of all Piggott residents.
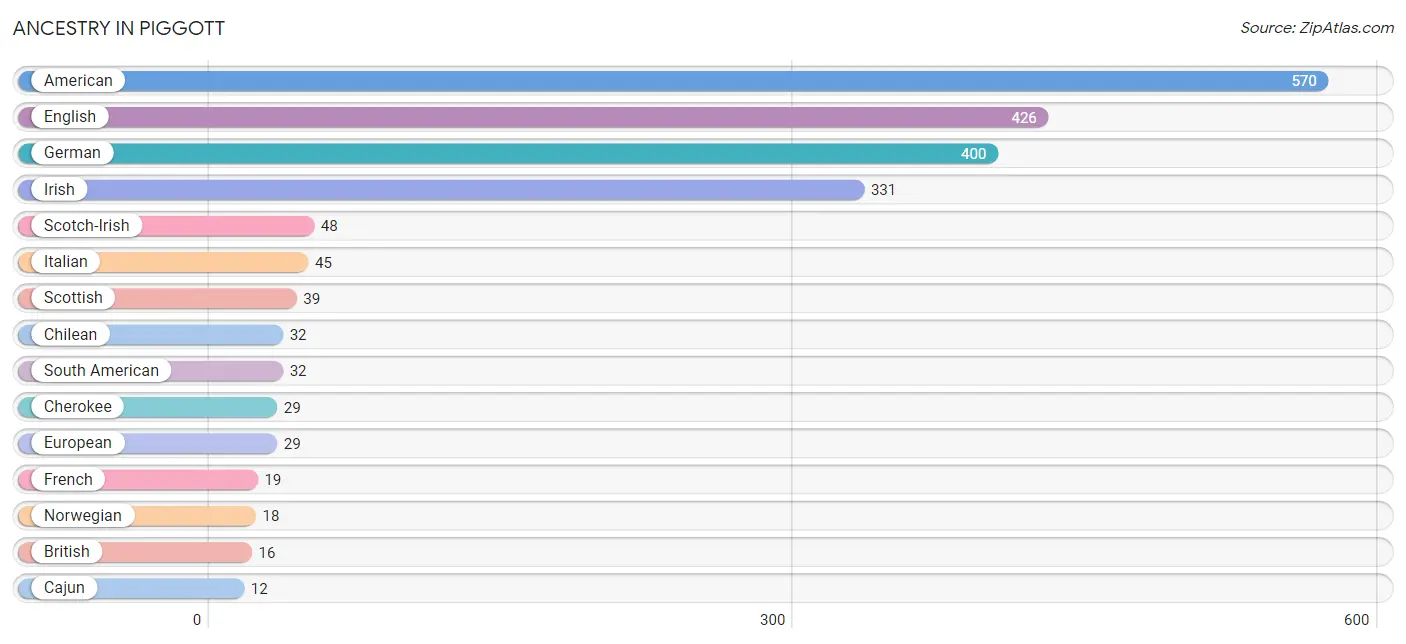
| Ancestry | # Population | % Population |
| American | 570 | 15.8% |
| Austrian | 5 | 0.1% |
| Blackfeet | 3 | 0.1% |
| British | 16 | 0.4% |
| Cajun | 12 | 0.3% |
| Cherokee | 29 | 0.8% |
| Chilean | 32 | 0.9% |
| English | 426 | 11.8% |
| European | 29 | 0.8% |
| French | 19 | 0.5% |
| German | 400 | 11.1% |
| Iranian | 9 | 0.3% |
| Irish | 331 | 9.2% |
| Italian | 45 | 1.3% |
| Norwegian | 18 | 0.5% |
| Romanian | 2 | 0.1% |
| Scandinavian | 2 | 0.1% |
| Scotch-Irish | 48 | 1.3% |
| Scottish | 39 | 1.1% |
| South American | 32 | 0.9% |
| Swiss | 11 | 0.3% | View All 21 Rows |
Immigrants in Piggott
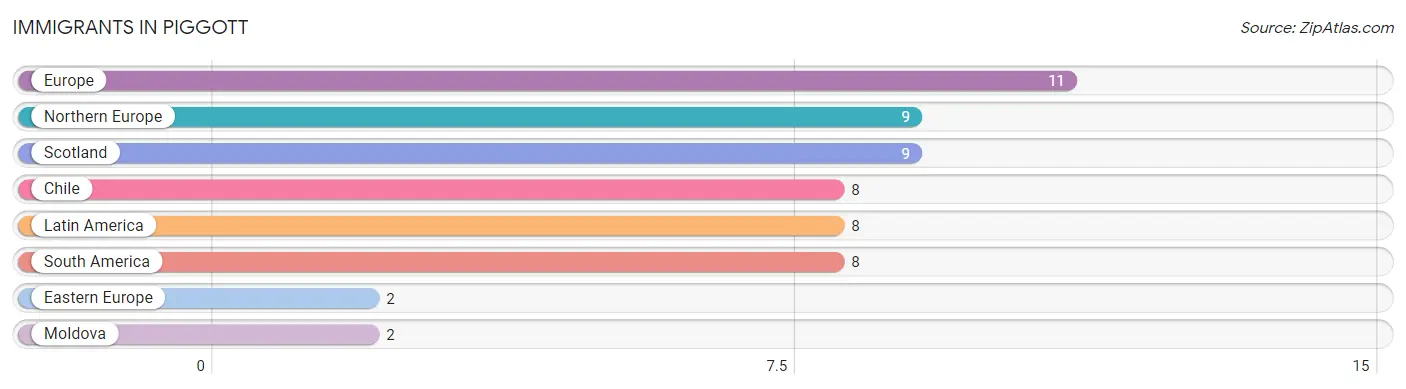
The most numerous immigrant groups reported in Piggott came from Europe (11 | 0.3%), Northern Europe (9 | 0.3%), Scotland (9 | 0.3%), Chile (8 | 0.2%), and Latin America (8 | 0.2%), together accounting for 1.2% of all Piggott residents.
| Immigration Origin | # Population | % Population |
| Chile | 8 | 0.2% |
| Eastern Europe | 2 | 0.1% |
| Europe | 11 | 0.3% |
| Latin America | 8 | 0.2% |
| Moldova | 2 | 0.1% |
| Northern Europe | 9 | 0.3% |
| Scotland | 9 | 0.3% |
| South America | 8 | 0.2% | View All 8 Rows |
Sex and Age in Piggott
Sex and Age in Piggott
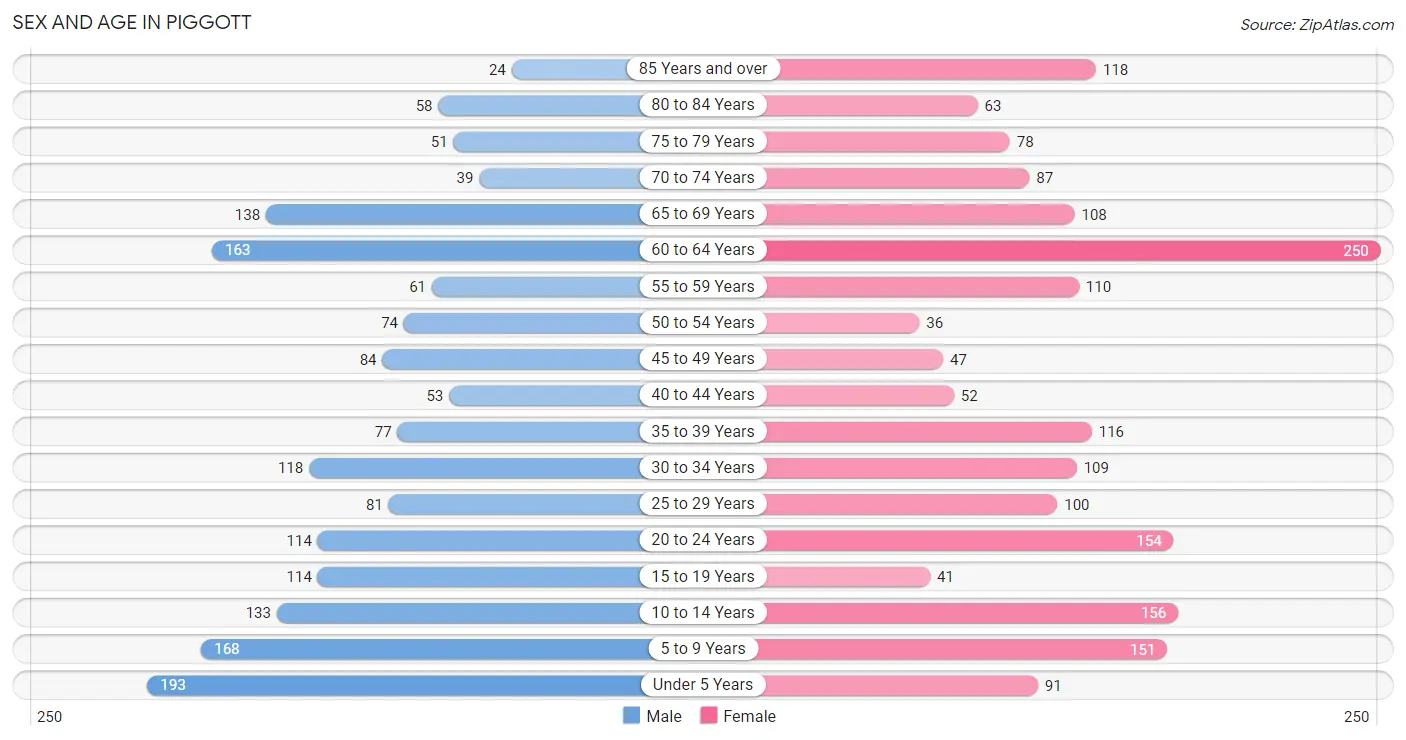
The most populous age groups in Piggott are Under 5 Years (193 | 11.1%) for men and 60 to 64 Years (250 | 13.4%) for women.
| Age Bracket | Male | Female |
| Under 5 Years | 193 (11.1%) | 91 (4.9%) |
| 5 to 9 Years | 168 (9.6%) | 151 (8.1%) |
| 10 to 14 Years | 133 (7.6%) | 156 (8.4%) |
| 15 to 19 Years | 114 (6.5%) | 41 (2.2%) |
| 20 to 24 Years | 114 (6.5%) | 154 (8.3%) |
| 25 to 29 Years | 81 (4.6%) | 100 (5.4%) |
| 30 to 34 Years | 118 (6.8%) | 109 (5.8%) |
| 35 to 39 Years | 77 (4.4%) | 116 (6.2%) |
| 40 to 44 Years | 53 (3.0%) | 52 (2.8%) |
| 45 to 49 Years | 84 (4.8%) | 47 (2.5%) |
| 50 to 54 Years | 74 (4.3%) | 36 (1.9%) |
| 55 to 59 Years | 61 (3.5%) | 110 (5.9%) |
| 60 to 64 Years | 163 (9.3%) | 250 (13.4%) |
| 65 to 69 Years | 138 (7.9%) | 108 (5.8%) |
| 70 to 74 Years | 39 (2.2%) | 87 (4.7%) |
| 75 to 79 Years | 51 (2.9%) | 78 (4.2%) |
| 80 to 84 Years | 58 (3.3%) | 63 (3.4%) |
| 85 Years and over | 24 (1.4%) | 118 (6.3%) |
| Total | 1,743 (100.0%) | 1,867 (100.0%) |
Families and Households in Piggott
Median Family Size in Piggott
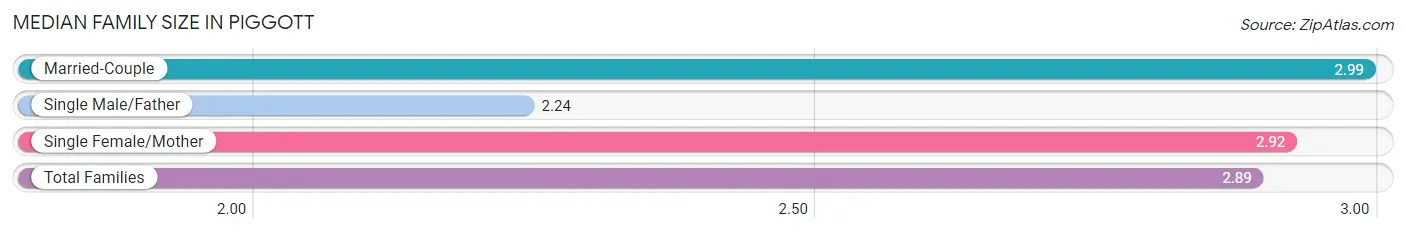
The median family size in Piggott is 2.89 persons per family, with married-couple families (560 | 57.7%) accounting for the largest median family size of 2.99 persons per family. On the other hand, single male/father families (101 | 10.4%) represent the smallest median family size with 2.24 persons per family.
| Family Type | # Families | Family Size |
| Married-Couple | 560 (57.7%) | 2.99 |
| Single Male/Father | 101 (10.4%) | 2.24 |
| Single Female/Mother | 310 (31.9%) | 2.92 |
| Total Families | 971 (100.0%) | 2.89 |
Median Household Size in Piggott
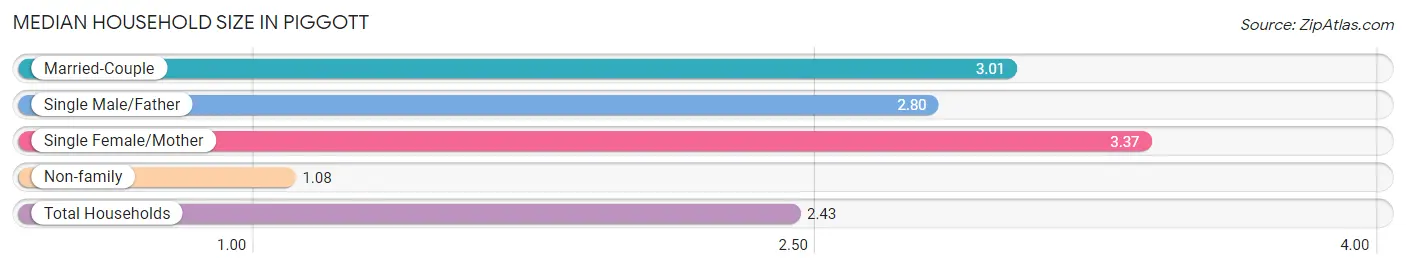
The median household size in Piggott is 2.43 persons per household, with single female/mother households (310 | 21.2%) accounting for the largest median household size of 3.37 persons per household. non-family households (488 | 33.5%) represent the smallest median household size with 1.08 persons per household.
| Household Type | # Households | Household Size |
| Married-Couple | 560 (38.4%) | 3.01 |
| Single Male/Father | 101 (6.9%) | 2.80 |
| Single Female/Mother | 310 (21.2%) | 3.37 |
| Non-family | 488 (33.5%) | 1.08 |
| Total Households | 1,459 (100.0%) | 2.43 |
Household Size by Marriage Status in Piggott
Out of a total of 1,459 households in Piggott, 971 (66.5%) are family households, while 488 (33.5%) are nonfamily households. The most numerous type of family households are 2-person households, comprising 466, and the most common type of nonfamily households are 1-person households, comprising 447.
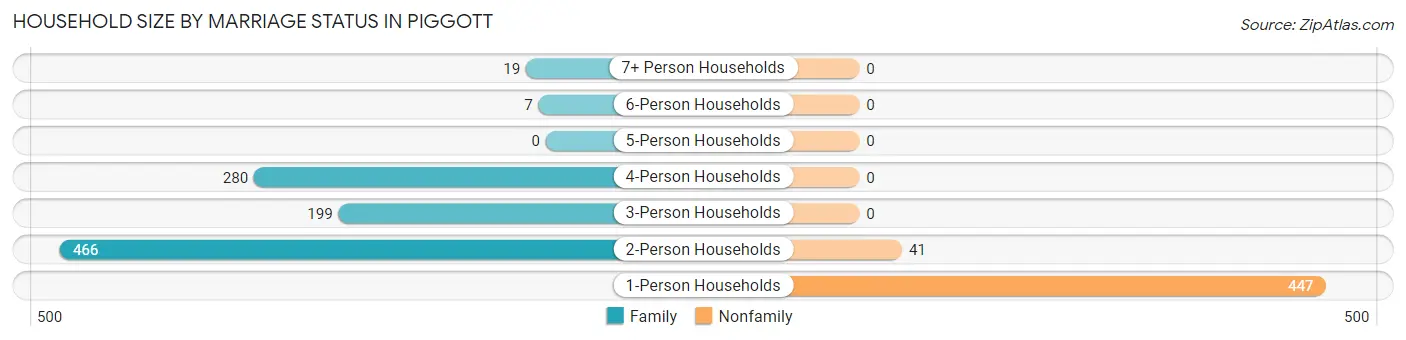
| Household Size | Family Households | Nonfamily Households |
| 1-Person Households | - | 447 (30.6%) |
| 2-Person Households | 466 (31.9%) | 41 (2.8%) |
| 3-Person Households | 199 (13.6%) | 0 (0.0%) |
| 4-Person Households | 280 (19.2%) | 0 (0.0%) |
| 5-Person Households | 0 (0.0%) | 0 (0.0%) |
| 6-Person Households | 7 (0.5%) | 0 (0.0%) |
| 7+ Person Households | 19 (1.3%) | 0 (0.0%) |
| Total | 971 (66.5%) | 488 (33.5%) |
Female Fertility in Piggott
Fertility by Age in Piggott
Average fertility rate in Piggott is 192.0 births per 1,000 women. Women in the age bracket of 20 to 34 years have the highest fertility rate with 281.0 births per 1,000 women. Women in the age bracket of 20 to 34 years acount for 84.3% of all women with births.
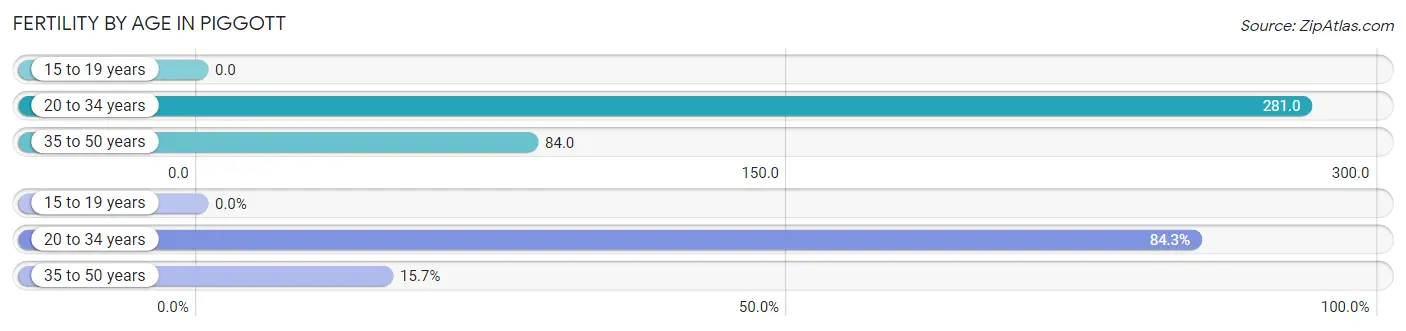
| Age Bracket | Women with Births | Births / 1,000 Women |
| 15 to 19 years | 0 (0.0%) | 0.0 |
| 20 to 34 years | 102 (84.3%) | 281.0 |
| 35 to 50 years | 19 (15.7%) | 84.0 |
| Total | 121 (100.0%) | 192.0 |
Fertility by Age by Marriage Status in Piggott
14.0% of women with births (121) in Piggott are married. The highest percentage of unmarried women with births falls into 35 to 50 years age bracket with 100.0% of them unmarried at the time of birth, while the lowest percentage of unmarried women with births belong to 20 to 34 years age bracket with 83.3% of them unmarried.
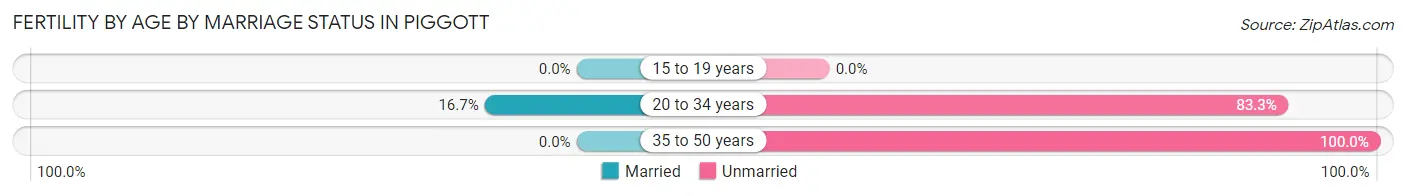
| Age Bracket | Married | Unmarried |
| 15 to 19 years | 0 (0.0%) | 0 (0.0%) |
| 20 to 34 years | 17 (16.7%) | 85 (83.3%) |
| 35 to 50 years | 0 (0.0%) | 19 (100.0%) |
| Total | 17 (14.1%) | 104 (86.0%) |
Fertility by Education in Piggott
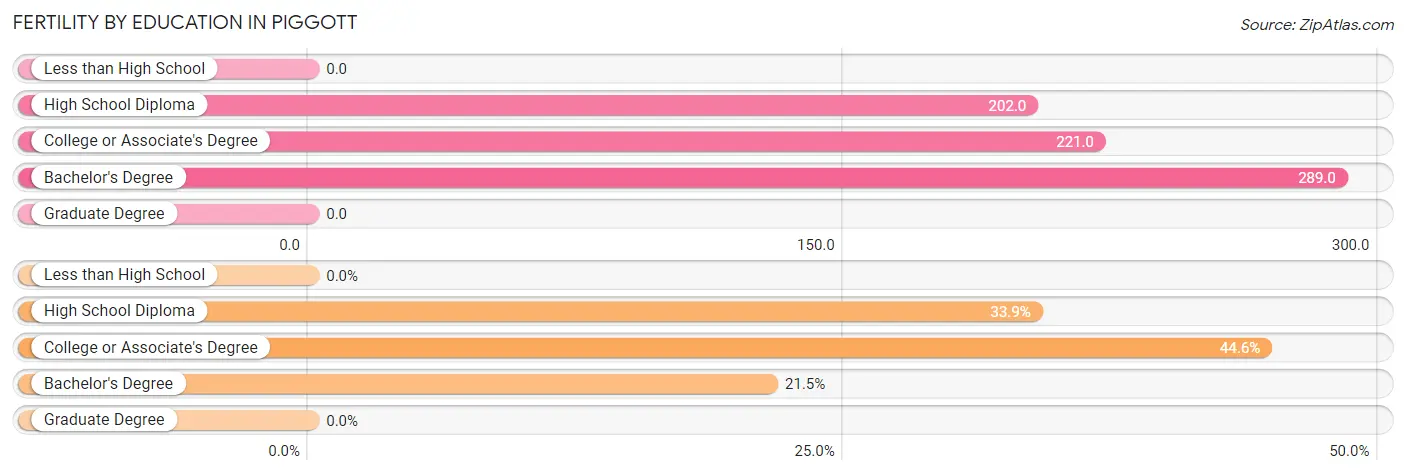
| Educational Attainment | Women with Births | Births / 1,000 Women |
| Less than High School | 0 (0.0%) | 0.0 |
| High School Diploma | 41 (33.9%) | 202.0 |
| College or Associate's Degree | 54 (44.6%) | 221.0 |
| Bachelor's Degree | 26 (21.5%) | 289.0 |
| Graduate Degree | 0 (0.0%) | 0.0 |
| Total | 121 (100.0%) | 192.0 |
Fertility by Education by Marriage Status in Piggott
86.0% of women with births in Piggott are unmarried. Women with the educational attainment of high school diploma are most likely to be married with 26.8% of them married at childbirth, while women with the educational attainment of bachelor's degree are least likely to be married with 100.0% of them unmarried at childbirth.
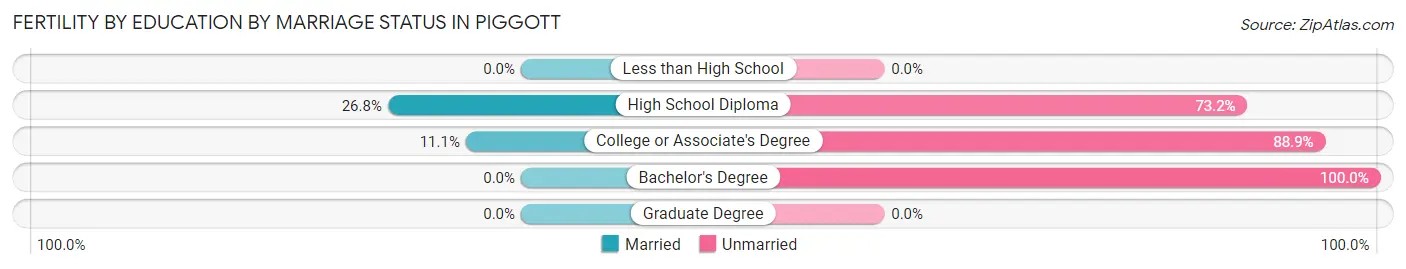
| Educational Attainment | Married | Unmarried |
| Less than High School | 0 (0.0%) | 0 (0.0%) |
| High School Diploma | 11 (26.8%) | 30 (73.2%) |
| College or Associate's Degree | 6 (11.1%) | 48 (88.9%) |
| Bachelor's Degree | 0 (0.0%) | 26 (100.0%) |
| Graduate Degree | 0 (0.0%) | 0 (0.0%) |
| Total | 17 (14.1%) | 104 (86.0%) |
Employment Characteristics in Piggott
Employment by Class of Employer in Piggott
Among the 1,585 employed individuals in Piggott, private company employees (1,082 | 68.3%), local government employees (147 | 9.3%), and self-employed (not incorporated) (125 | 7.9%) make up the most common classes of employment.
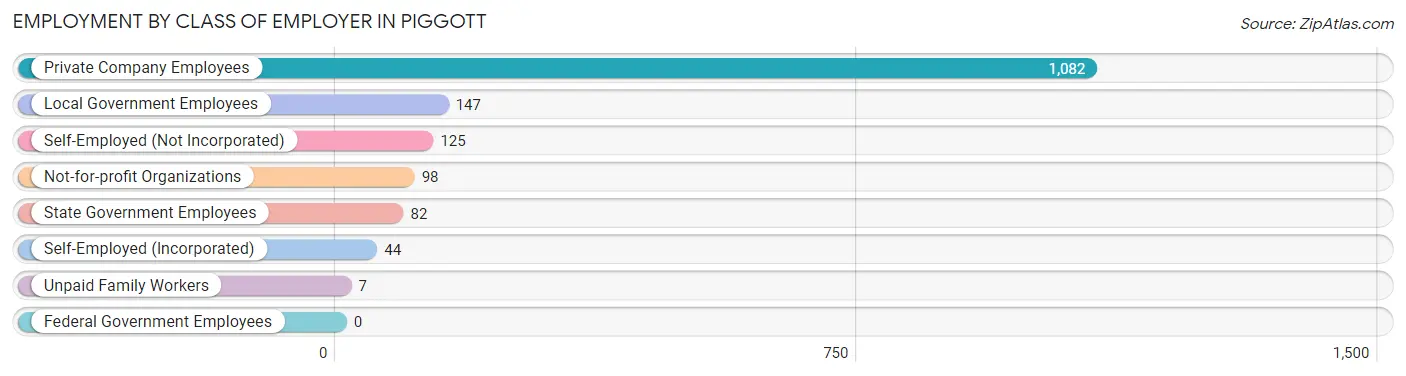
| Employer Class | # Employees | % Employees |
| Private Company Employees | 1,082 | 68.3% |
| Self-Employed (Incorporated) | 44 | 2.8% |
| Self-Employed (Not Incorporated) | 125 | 7.9% |
| Not-for-profit Organizations | 98 | 6.2% |
| Local Government Employees | 147 | 9.3% |
| State Government Employees | 82 | 5.2% |
| Federal Government Employees | 0 | 0.0% |
| Unpaid Family Workers | 7 | 0.4% |
| Total | 1,585 | 100.0% |
Employment Status by Age in Piggott
According to the labor force statistics for Piggott, out of the total population over 16 years of age (2,684), 61.4% or 1,648 individuals are in the labor force, with 3.0% or 49 of them unemployed. The age group with the highest labor force participation rate is 30 to 34 years, with 87.7% or 199 individuals in the labor force. Within the labor force, the 20 to 24 years age range has the highest percentage of unemployed individuals, with 20.5% or 43 of them being unemployed.
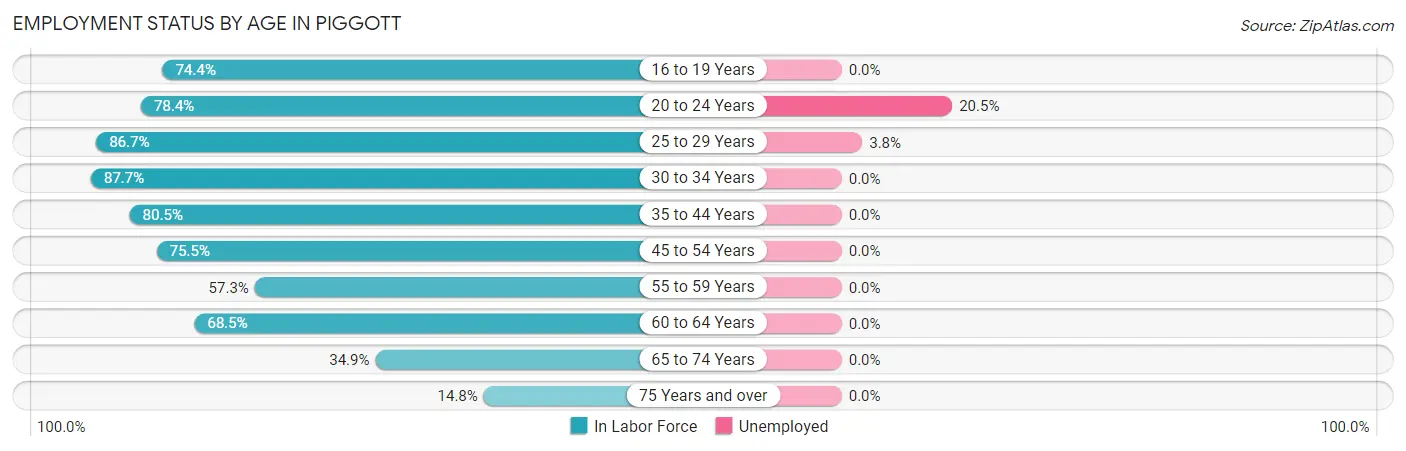
| Age Bracket | In Labor Force | Unemployed |
| 16 to 19 Years | 90 (74.4%) | 0 (0.0%) |
| 20 to 24 Years | 210 (78.4%) | 43 (20.5%) |
| 25 to 29 Years | 157 (86.7%) | 6 (3.8%) |
| 30 to 34 Years | 199 (87.7%) | 0 (0.0%) |
| 35 to 44 Years | 240 (80.5%) | 0 (0.0%) |
| 45 to 54 Years | 182 (75.5%) | 0 (0.0%) |
| 55 to 59 Years | 98 (57.3%) | 0 (0.0%) |
| 60 to 64 Years | 283 (68.5%) | 0 (0.0%) |
| 65 to 74 Years | 130 (34.9%) | 0 (0.0%) |
| 75 Years and over | 58 (14.8%) | 0 (0.0%) |
| Total | 1,648 (61.4%) | 49 (3.0%) |
Employment Status by Educational Attainment in Piggott
According to labor force statistics for Piggott, 75.7% of individuals (1,159) out of the total population between 25 and 64 years of age (1,531) are in the labor force, with 0.5% or 6 of them being unemployed. The group with the highest labor force participation rate are those with the educational attainment of bachelor's degree or higher, with 87.7% or 299 individuals in the labor force. Within the labor force, individuals with less than high school education have the highest percentage of unemployment, with 16.7% or 6 of them being unemployed.
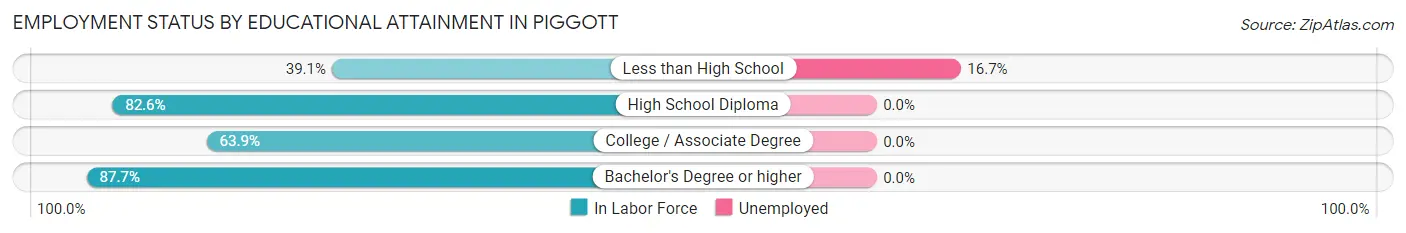
| Educational Attainment | In Labor Force | Unemployed |
| Less than High School | 36 (39.1%) | 15 (16.7%) |
| High School Diploma | 541 (82.6%) | 0 (0.0%) |
| College / Associate Degree | 283 (63.9%) | 0 (0.0%) |
| Bachelor's Degree or higher | 299 (87.7%) | 0 (0.0%) |
| Total | 1,159 (75.7%) | 8 (0.5%) |
Employment Occupations by Sex in Piggott
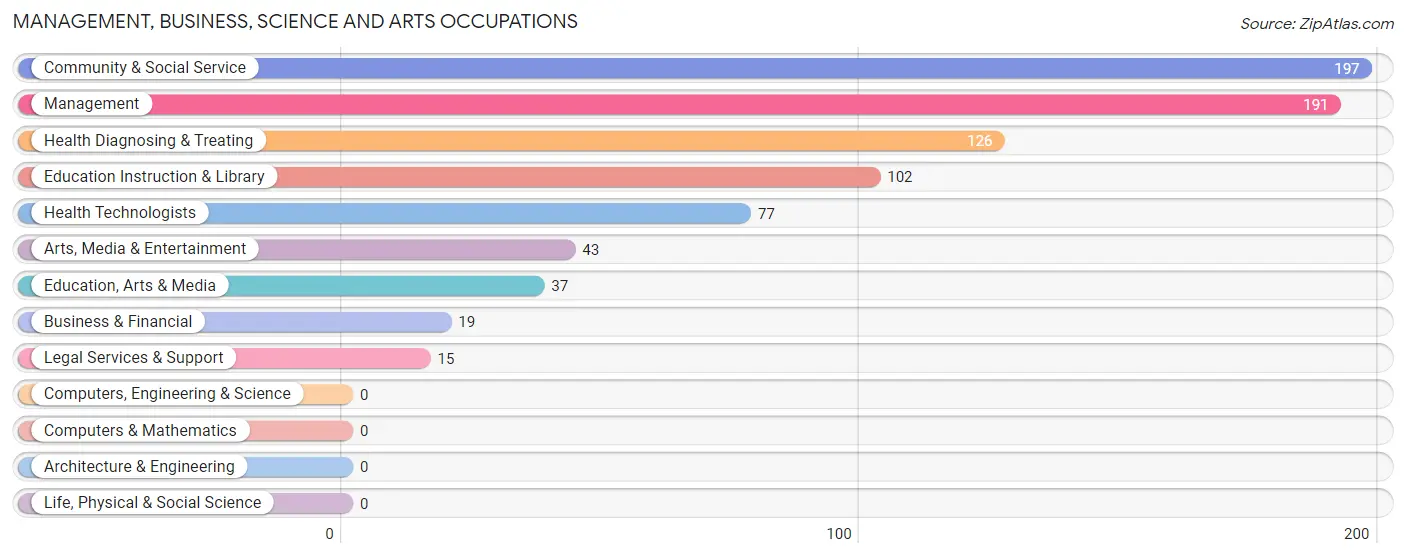
Management, Business, Science and Arts Occupations
The most common Management, Business, Science and Arts occupations in Piggott are Community & Social Service (197 | 12.3%), Management (191 | 11.9%), Health Diagnosing & Treating (126 | 7.9%), Education Instruction & Library (102 | 6.4%), and Health Technologists (77 | 4.8%).
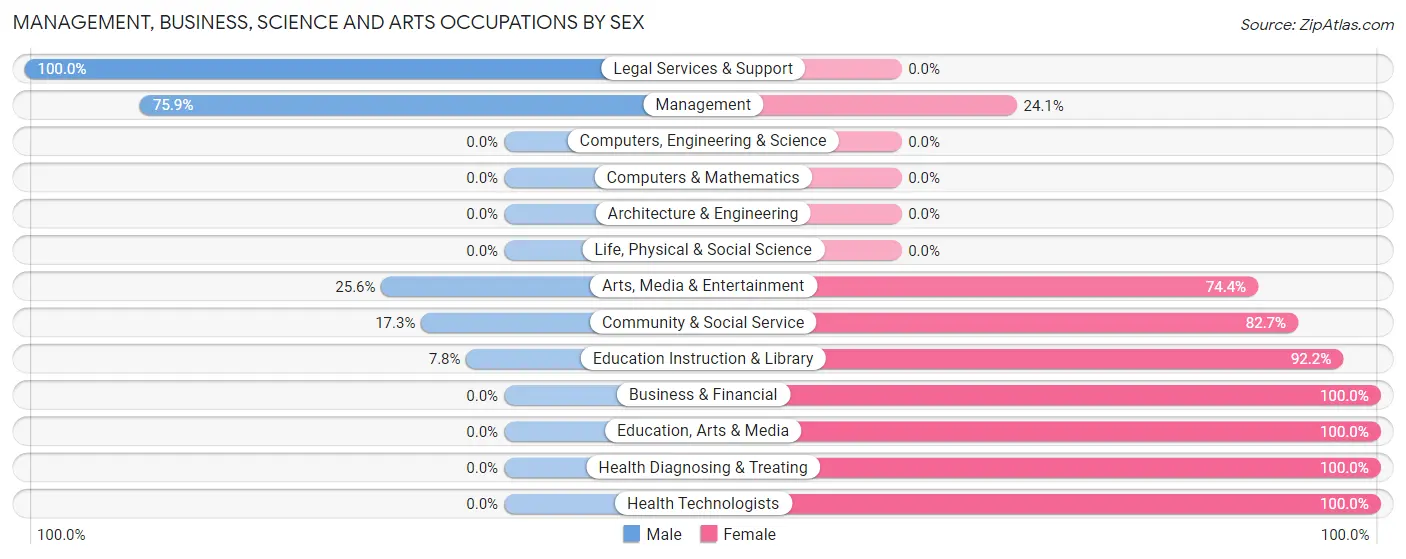
Management, Business, Science and Arts Occupations by Sex
Within the Management, Business, Science and Arts occupations in Piggott, the most male-oriented occupations are Legal Services & Support (100.0%), Management (75.9%), and Arts, Media & Entertainment (25.6%), while the most female-oriented occupations are Business & Financial (100.0%), Education, Arts & Media (100.0%), and Health Diagnosing & Treating (100.0%).
| Occupation | Male | Female |
| Management | 145 (75.9%) | 46 (24.1%) |
| Business & Financial | 0 (0.0%) | 19 (100.0%) |
| Computers, Engineering & Science | 0 (0.0%) | 0 (0.0%) |
| Computers & Mathematics | 0 (0.0%) | 0 (0.0%) |
| Architecture & Engineering | 0 (0.0%) | 0 (0.0%) |
| Life, Physical & Social Science | 0 (0.0%) | 0 (0.0%) |
| Community & Social Service | 34 (17.3%) | 163 (82.7%) |
| Education, Arts & Media | 0 (0.0%) | 37 (100.0%) |
| Legal Services & Support | 15 (100.0%) | 0 (0.0%) |
| Education Instruction & Library | 8 (7.8%) | 94 (92.2%) |
| Arts, Media & Entertainment | 11 (25.6%) | 32 (74.4%) |
| Health Diagnosing & Treating | 0 (0.0%) | 126 (100.0%) |
| Health Technologists | 0 (0.0%) | 77 (100.0%) |
| Total (Category) | 179 (33.6%) | 354 (66.4%) |
| Total (Overall) | 761 (47.6%) | 837 (52.4%) |
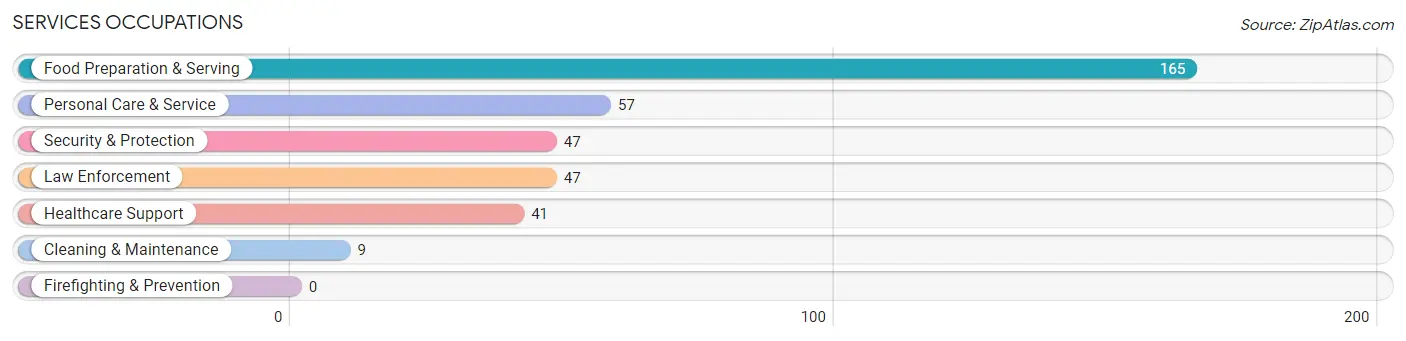
Services Occupations
The most common Services occupations in Piggott are Food Preparation & Serving (165 | 10.3%), Personal Care & Service (57 | 3.6%), Security & Protection (47 | 2.9%), Law Enforcement (47 | 2.9%), and Healthcare Support (41 | 2.6%).
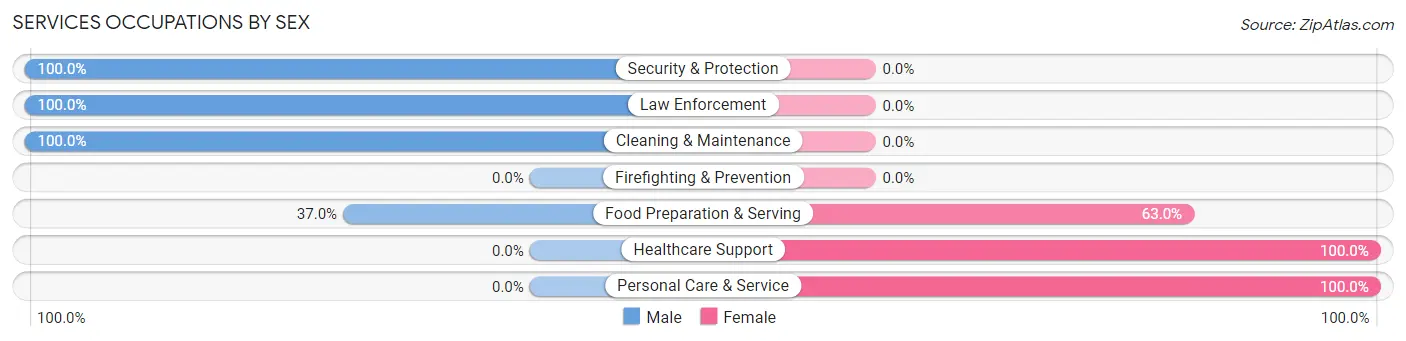
Services Occupations by Sex
Within the Services occupations in Piggott, the most male-oriented occupations are Security & Protection (100.0%), Law Enforcement (100.0%), and Cleaning & Maintenance (100.0%), while the most female-oriented occupations are Healthcare Support (100.0%), Personal Care & Service (100.0%), and Food Preparation & Serving (63.0%).
| Occupation | Male | Female |
| Healthcare Support | 0 (0.0%) | 41 (100.0%) |
| Security & Protection | 47 (100.0%) | 0 (0.0%) |
| Firefighting & Prevention | 0 (0.0%) | 0 (0.0%) |
| Law Enforcement | 47 (100.0%) | 0 (0.0%) |
| Food Preparation & Serving | 61 (37.0%) | 104 (63.0%) |
| Cleaning & Maintenance | 9 (100.0%) | 0 (0.0%) |
| Personal Care & Service | 0 (0.0%) | 57 (100.0%) |
| Total (Category) | 117 (36.7%) | 202 (63.3%) |
| Total (Overall) | 761 (47.6%) | 837 (52.4%) |
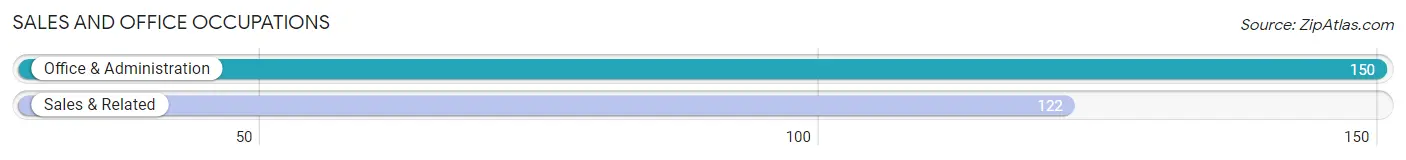
Sales and Office Occupations
The most common Sales and Office occupations in Piggott are Office & Administration (150 | 9.4%), and Sales & Related (122 | 7.6%).
Sales and Office Occupations by Sex
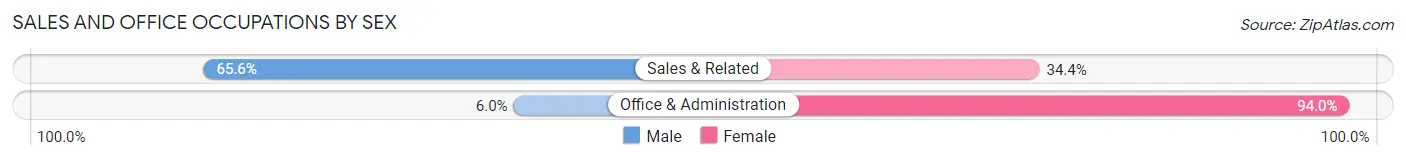
| Occupation | Male | Female |
| Sales & Related | 80 (65.6%) | 42 (34.4%) |
| Office & Administration | 9 (6.0%) | 141 (94.0%) |
| Total (Category) | 89 (32.7%) | 183 (67.3%) |
| Total (Overall) | 761 (47.6%) | 837 (52.4%) |
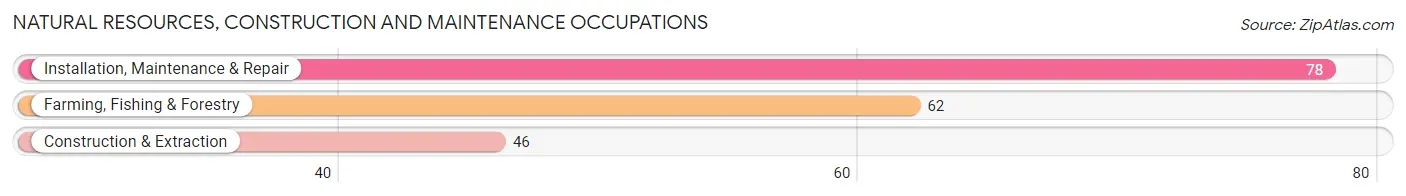
Natural Resources, Construction and Maintenance Occupations
The most common Natural Resources, Construction and Maintenance occupations in Piggott are Installation, Maintenance & Repair (78 | 4.9%), Farming, Fishing & Forestry (62 | 3.9%), and Construction & Extraction (46 | 2.9%).
Natural Resources, Construction and Maintenance Occupations by Sex
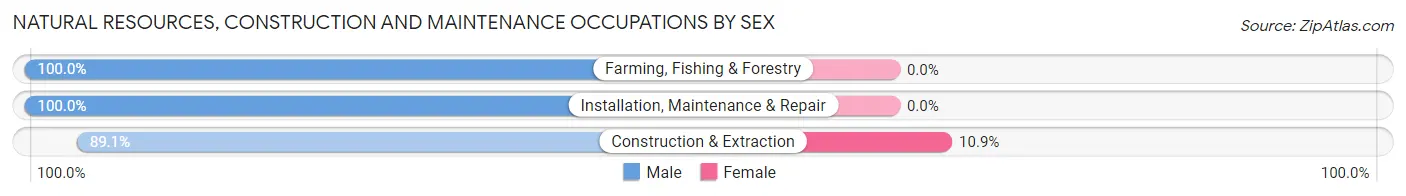
| Occupation | Male | Female |
| Farming, Fishing & Forestry | 62 (100.0%) | 0 (0.0%) |
| Construction & Extraction | 41 (89.1%) | 5 (10.9%) |
| Installation, Maintenance & Repair | 78 (100.0%) | 0 (0.0%) |
| Total (Category) | 181 (97.3%) | 5 (2.7%) |
| Total (Overall) | 761 (47.6%) | 837 (52.4%) |
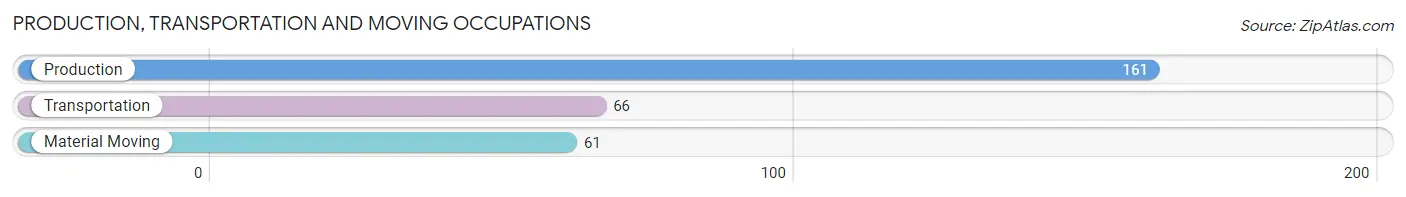
Production, Transportation and Moving Occupations
The most common Production, Transportation and Moving occupations in Piggott are Production (161 | 10.1%), Transportation (66 | 4.1%), and Material Moving (61 | 3.8%).
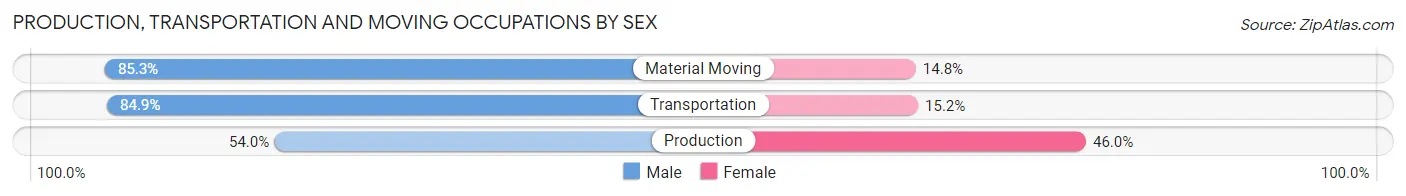
Production, Transportation and Moving Occupations by Sex
| Occupation | Male | Female |
| Production | 87 (54.0%) | 74 (46.0%) |
| Transportation | 56 (84.9%) | 10 (15.1%) |
| Material Moving | 52 (85.3%) | 9 (14.7%) |
| Total (Category) | 195 (67.7%) | 93 (32.3%) |
| Total (Overall) | 761 (47.6%) | 837 (52.4%) |
Employment Industries by Sex in Piggott
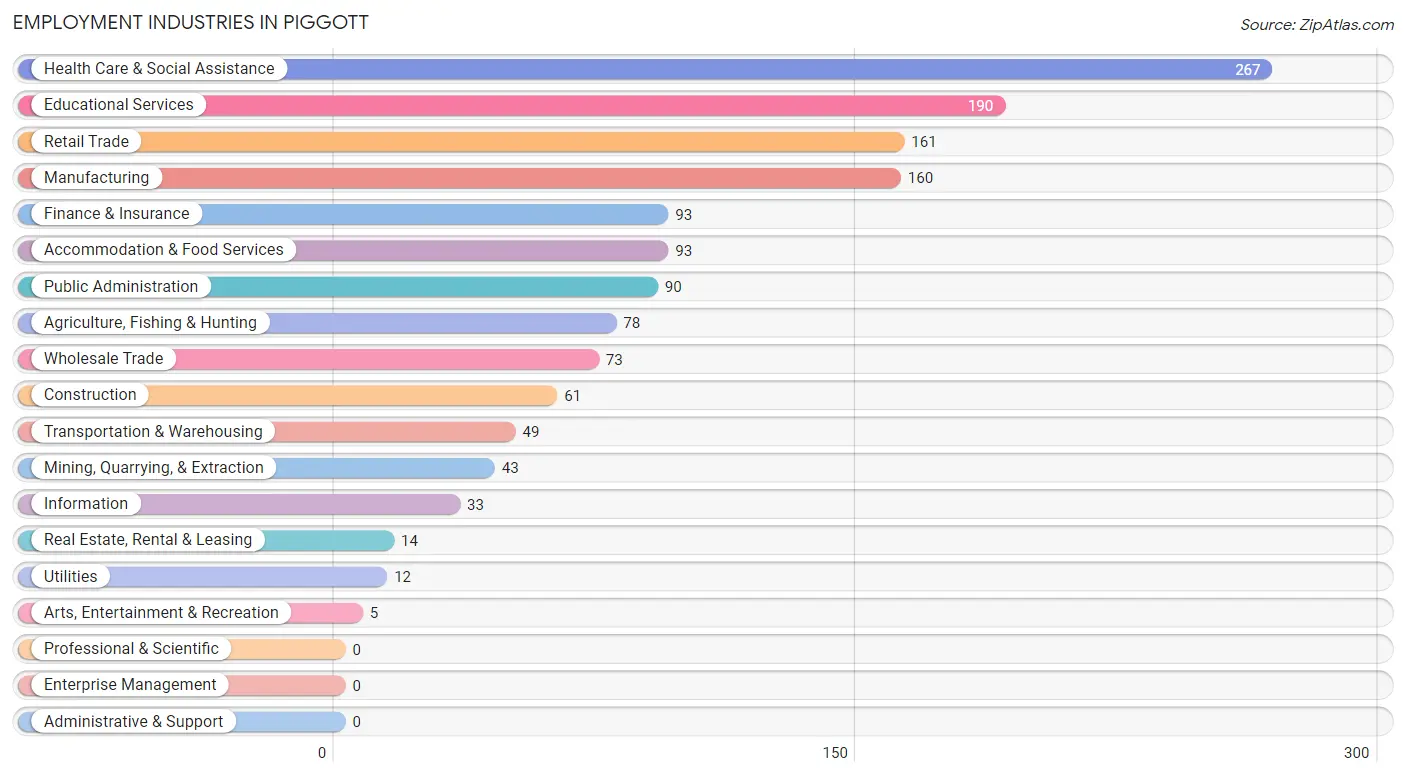
Employment Industries in Piggott
The major employment industries in Piggott include Health Care & Social Assistance (267 | 16.7%), Educational Services (190 | 11.9%), Retail Trade (161 | 10.1%), Manufacturing (160 | 10.0%), and Finance & Insurance (93 | 5.8%).
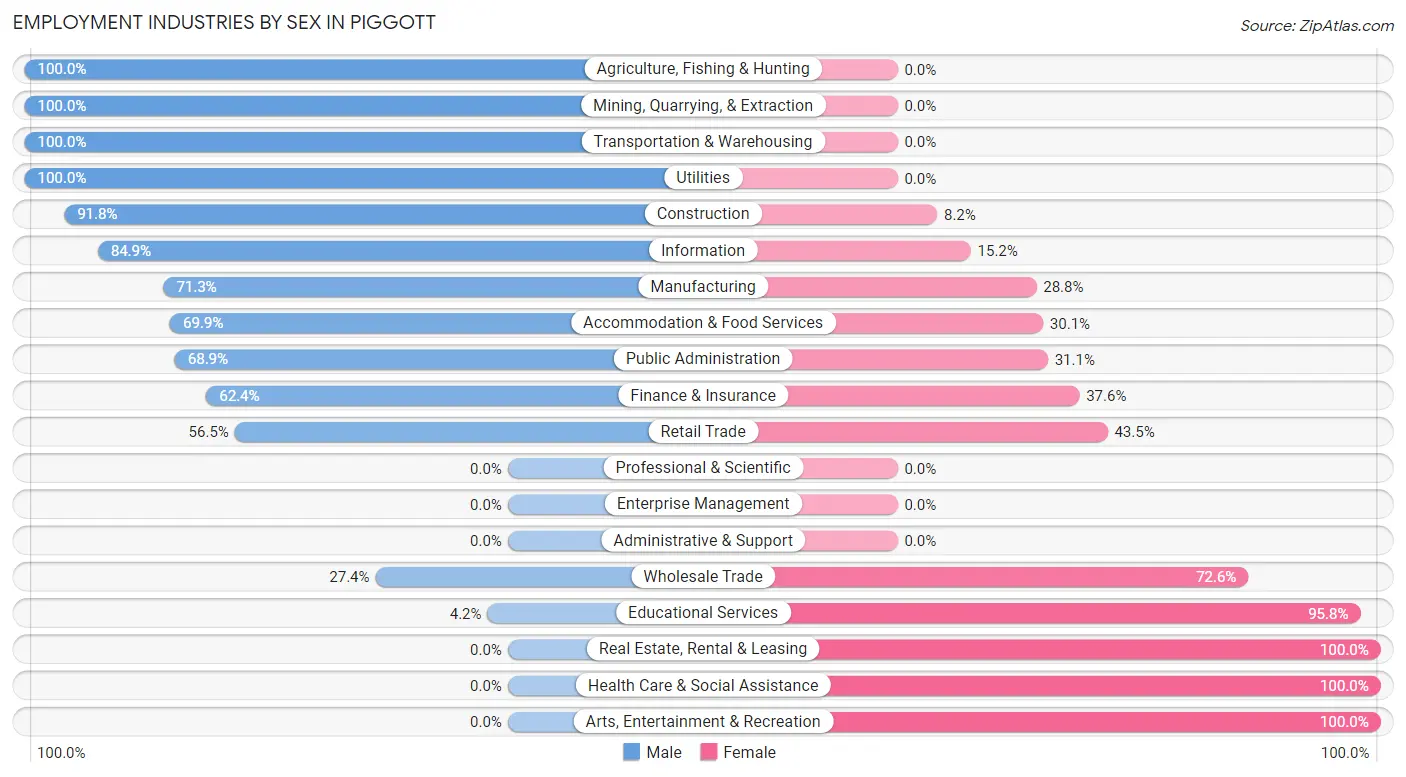
Employment Industries by Sex in Piggott
The Piggott industries that see more men than women are Agriculture, Fishing & Hunting (100.0%), Mining, Quarrying, & Extraction (100.0%), and Transportation & Warehousing (100.0%), whereas the industries that tend to have a higher number of women are Real Estate, Rental & Leasing (100.0%), Health Care & Social Assistance (100.0%), and Arts, Entertainment & Recreation (100.0%).
| Industry | Male | Female |
| Agriculture, Fishing & Hunting | 78 (100.0%) | 0 (0.0%) |
| Mining, Quarrying, & Extraction | 43 (100.0%) | 0 (0.0%) |
| Construction | 56 (91.8%) | 5 (8.2%) |
| Manufacturing | 114 (71.3%) | 46 (28.7%) |
| Wholesale Trade | 20 (27.4%) | 53 (72.6%) |
| Retail Trade | 91 (56.5%) | 70 (43.5%) |
| Transportation & Warehousing | 49 (100.0%) | 0 (0.0%) |
| Utilities | 12 (100.0%) | 0 (0.0%) |
| Information | 28 (84.9%) | 5 (15.1%) |
| Finance & Insurance | 58 (62.4%) | 35 (37.6%) |
| Real Estate, Rental & Leasing | 0 (0.0%) | 14 (100.0%) |
| Professional & Scientific | 0 (0.0%) | 0 (0.0%) |
| Enterprise Management | 0 (0.0%) | 0 (0.0%) |
| Administrative & Support | 0 (0.0%) | 0 (0.0%) |
| Educational Services | 8 (4.2%) | 182 (95.8%) |
| Health Care & Social Assistance | 0 (0.0%) | 267 (100.0%) |
| Arts, Entertainment & Recreation | 0 (0.0%) | 5 (100.0%) |
| Accommodation & Food Services | 65 (69.9%) | 28 (30.1%) |
| Public Administration | 62 (68.9%) | 28 (31.1%) |
| Total | 761 (47.6%) | 837 (52.4%) |
Education in Piggott
School Enrollment in Piggott
The most common levels of schooling among the 867 students in Piggott are middle school (270 | 31.1%), elementary school (156 | 18.0%), and nursery / preschool (149 | 17.2%).
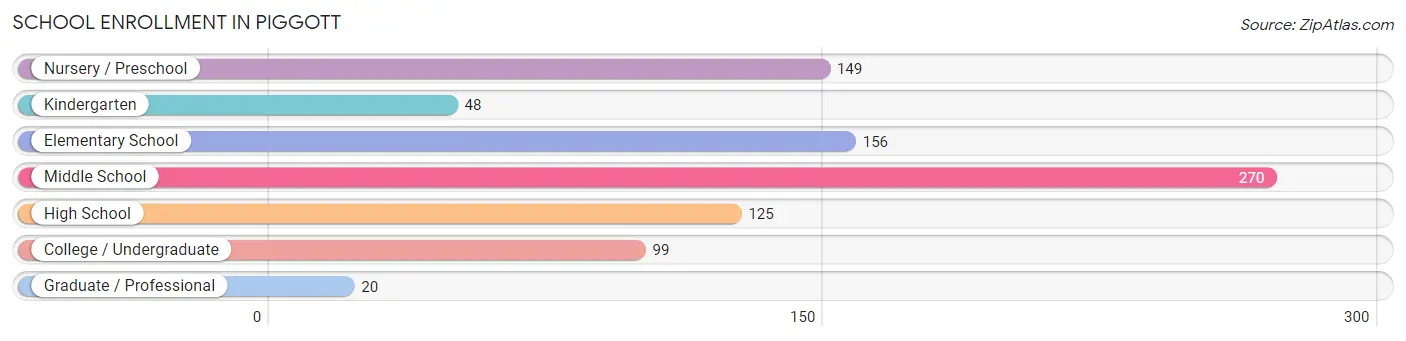
| School Level | # Students | % Students |
| Nursery / Preschool | 149 | 17.2% |
| Kindergarten | 48 | 5.5% |
| Elementary School | 156 | 18.0% |
| Middle School | 270 | 31.1% |
| High School | 125 | 14.4% |
| College / Undergraduate | 99 | 11.4% |
| Graduate / Professional | 20 | 2.3% |
| Total | 867 | 100.0% |
School Enrollment by Age by Funding Source in Piggott
Out of a total of 867 students who are enrolled in schools in Piggott, 23 (2.7%) attend a private institution, while the remaining 844 (97.3%) are enrolled in public schools. The age group of 20 to 24 year olds has the highest likelihood of being enrolled in private schools, with 5 (8.9% in the age bracket) enrolled. Conversely, the age group of 3 to 4 year olds has the lowest likelihood of being enrolled in a private school, with 56 (100.0% in the age bracket) attending a public institution.
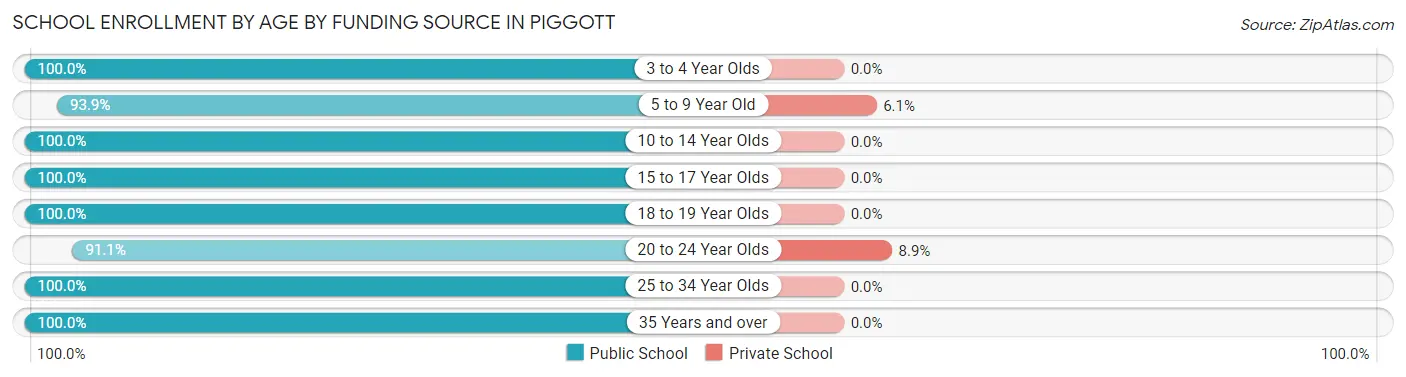
| Age Bracket | Public School | Private School |
| 3 to 4 Year Olds | 56 (100.0%) | 0 (0.0%) |
| 5 to 9 Year Old | 279 (93.9%) | 18 (6.1%) |
| 10 to 14 Year Olds | 289 (100.0%) | 0 (0.0%) |
| 15 to 17 Year Olds | 74 (100.0%) | 0 (0.0%) |
| 18 to 19 Year Olds | 32 (100.0%) | 0 (0.0%) |
| 20 to 24 Year Olds | 51 (91.1%) | 5 (8.9%) |
| 25 to 34 Year Olds | 26 (100.0%) | 0 (0.0%) |
| 35 Years and over | 37 (100.0%) | 0 (0.0%) |
| Total | 844 (97.3%) | 23 (2.7%) |
Educational Attainment by Field of Study in Piggott
Education (141 | 32.1%), science & technology (58 | 13.2%), psychology (49 | 11.1%), business (48 | 10.9%), and arts & humanities (44 | 10.0%) are the most common fields of study among 440 individuals in Piggott who have obtained a bachelor's degree or higher.
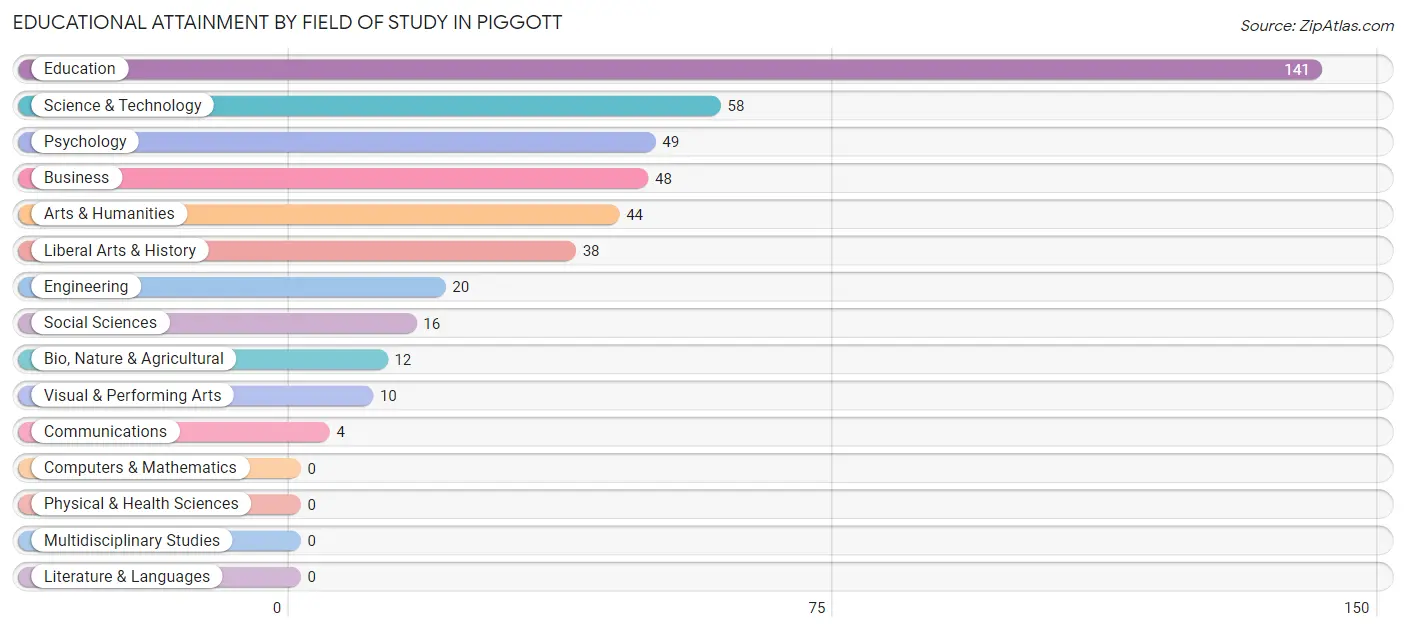
| Field of Study | # Graduates | % Graduates |
| Computers & Mathematics | 0 | 0.0% |
| Bio, Nature & Agricultural | 12 | 2.7% |
| Physical & Health Sciences | 0 | 0.0% |
| Psychology | 49 | 11.1% |
| Social Sciences | 16 | 3.6% |
| Engineering | 20 | 4.5% |
| Multidisciplinary Studies | 0 | 0.0% |
| Science & Technology | 58 | 13.2% |
| Business | 48 | 10.9% |
| Education | 141 | 32.1% |
| Literature & Languages | 0 | 0.0% |
| Liberal Arts & History | 38 | 8.6% |
| Visual & Performing Arts | 10 | 2.3% |
| Communications | 4 | 0.9% |
| Arts & Humanities | 44 | 10.0% |
| Total | 440 | 100.0% |
Transportation & Commute in Piggott
Vehicle Availability by Sex in Piggott
The most prevalent vehicle ownership categories in Piggott are males with 2 vehicles (280, accounting for 36.8%) and females with 2 vehicles (274, making up 34.0%).
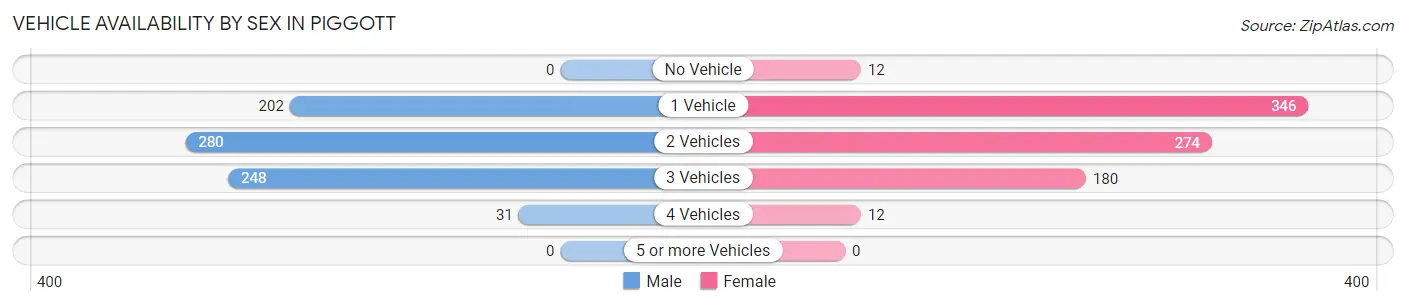
| Vehicles Available | Male | Female |
| No Vehicle | 0 (0.0%) | 12 (1.5%) |
| 1 Vehicle | 202 (26.5%) | 346 (42.0%) |
| 2 Vehicles | 280 (36.8%) | 274 (33.3%) |
| 3 Vehicles | 248 (32.6%) | 180 (21.8%) |
| 4 Vehicles | 31 (4.1%) | 12 (1.5%) |
| 5 or more Vehicles | 0 (0.0%) | 0 (0.0%) |
| Total | 761 (100.0%) | 824 (100.0%) |
Commute Time in Piggott
The most frequently occuring commute durations in Piggott are 5 to 9 minutes (465 commuters, 30.0%), 10 to 14 minutes (252 commuters, 16.3%), and less than 5 minutes (148 commuters, 9.6%).
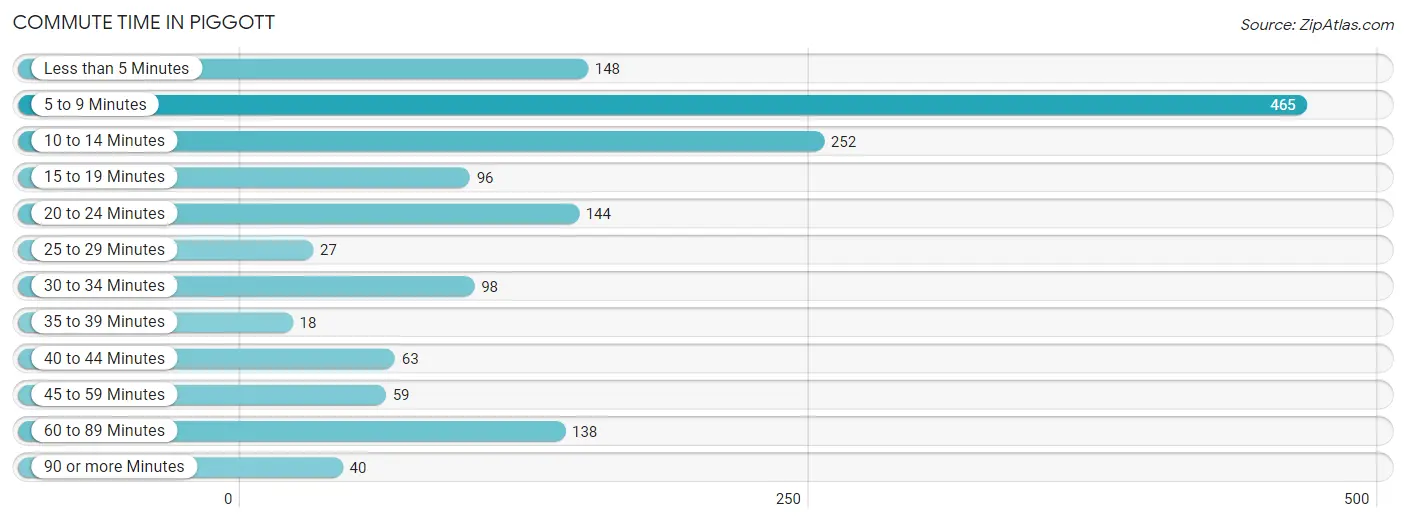
| Commute Time | # Commuters | % Commuters |
| Less than 5 Minutes | 148 | 9.6% |
| 5 to 9 Minutes | 465 | 30.0% |
| 10 to 14 Minutes | 252 | 16.3% |
| 15 to 19 Minutes | 96 | 6.2% |
| 20 to 24 Minutes | 144 | 9.3% |
| 25 to 29 Minutes | 27 | 1.7% |
| 30 to 34 Minutes | 98 | 6.3% |
| 35 to 39 Minutes | 18 | 1.2% |
| 40 to 44 Minutes | 63 | 4.1% |
| 45 to 59 Minutes | 59 | 3.8% |
| 60 to 89 Minutes | 138 | 8.9% |
| 90 or more Minutes | 40 | 2.6% |
Commute Time by Sex in Piggott
The most common commute times in Piggott are 5 to 9 minutes (193 commuters, 26.6%) for males and 5 to 9 minutes (272 commuters, 33.1%) for females.
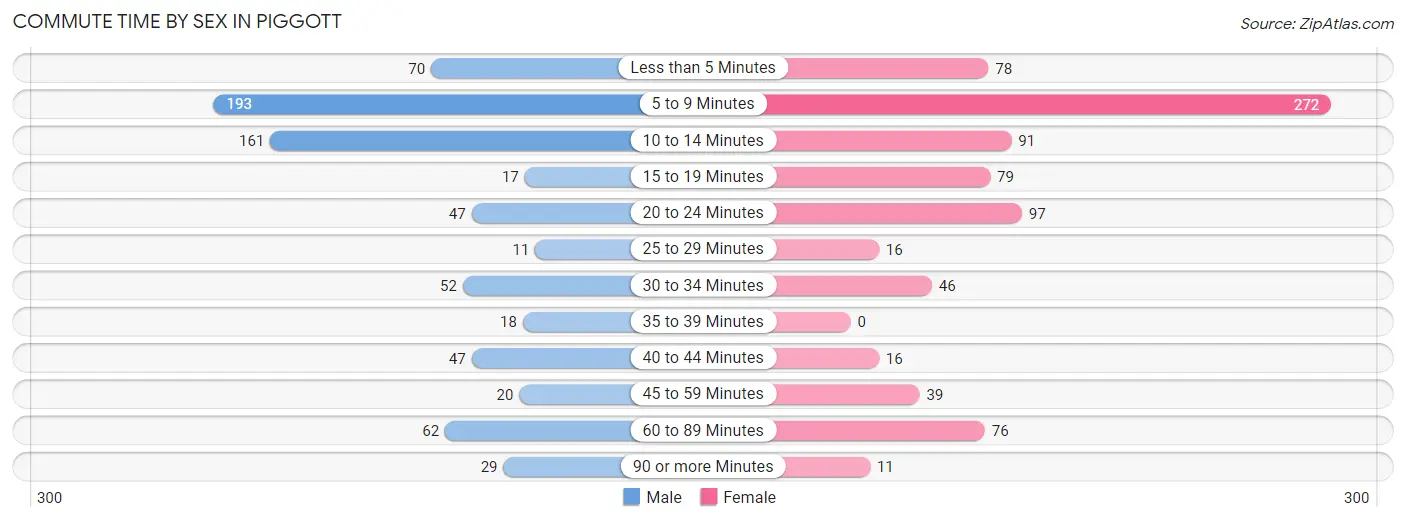
| Commute Time | Male | Female |
| Less than 5 Minutes | 70 (9.6%) | 78 (9.5%) |
| 5 to 9 Minutes | 193 (26.6%) | 272 (33.1%) |
| 10 to 14 Minutes | 161 (22.2%) | 91 (11.1%) |
| 15 to 19 Minutes | 17 (2.3%) | 79 (9.6%) |
| 20 to 24 Minutes | 47 (6.5%) | 97 (11.8%) |
| 25 to 29 Minutes | 11 (1.5%) | 16 (1.9%) |
| 30 to 34 Minutes | 52 (7.1%) | 46 (5.6%) |
| 35 to 39 Minutes | 18 (2.5%) | 0 (0.0%) |
| 40 to 44 Minutes | 47 (6.5%) | 16 (1.9%) |
| 45 to 59 Minutes | 20 (2.8%) | 39 (4.8%) |
| 60 to 89 Minutes | 62 (8.5%) | 76 (9.3%) |
| 90 or more Minutes | 29 (4.0%) | 11 (1.3%) |
Time of Departure to Work by Sex in Piggott
The most frequent times of departure to work in Piggott are 12:00 AM to 4:59 AM (102, 14.0%) for males and 7:30 AM to 7:59 AM (198, 24.1%) for females.
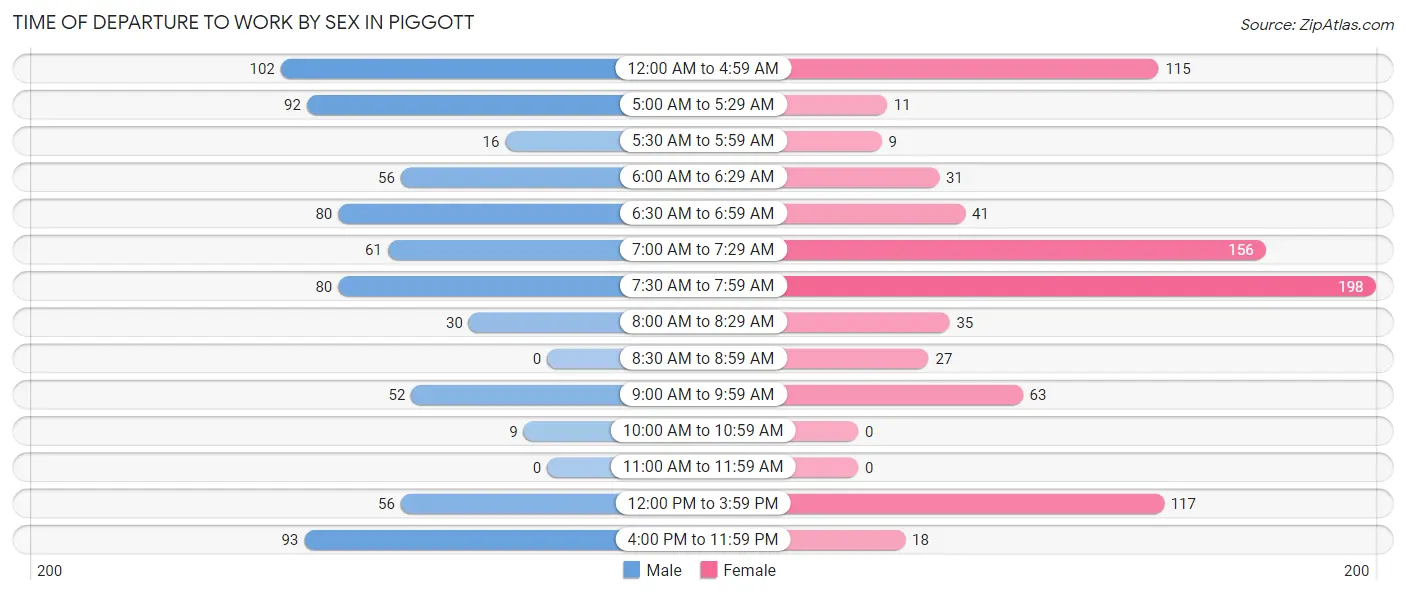
| Time of Departure | Male | Female |
| 12:00 AM to 4:59 AM | 102 (14.0%) | 115 (14.0%) |
| 5:00 AM to 5:29 AM | 92 (12.7%) | 11 (1.3%) |
| 5:30 AM to 5:59 AM | 16 (2.2%) | 9 (1.1%) |
| 6:00 AM to 6:29 AM | 56 (7.7%) | 31 (3.8%) |
| 6:30 AM to 6:59 AM | 80 (11.0%) | 41 (5.0%) |
| 7:00 AM to 7:29 AM | 61 (8.4%) | 156 (19.0%) |
| 7:30 AM to 7:59 AM | 80 (11.0%) | 198 (24.1%) |
| 8:00 AM to 8:29 AM | 30 (4.1%) | 35 (4.3%) |
| 8:30 AM to 8:59 AM | 0 (0.0%) | 27 (3.3%) |
| 9:00 AM to 9:59 AM | 52 (7.1%) | 63 (7.7%) |
| 10:00 AM to 10:59 AM | 9 (1.2%) | 0 (0.0%) |
| 11:00 AM to 11:59 AM | 0 (0.0%) | 0 (0.0%) |
| 12:00 PM to 3:59 PM | 56 (7.7%) | 117 (14.2%) |
| 4:00 PM to 11:59 PM | 93 (12.8%) | 18 (2.2%) |
| Total | 727 (100.0%) | 821 (100.0%) |
Housing Occupancy in Piggott
Occupancy by Ownership in Piggott
Of the total 1,459 dwellings in Piggott, owner-occupied units account for 936 (64.1%), while renter-occupied units make up 523 (35.8%).
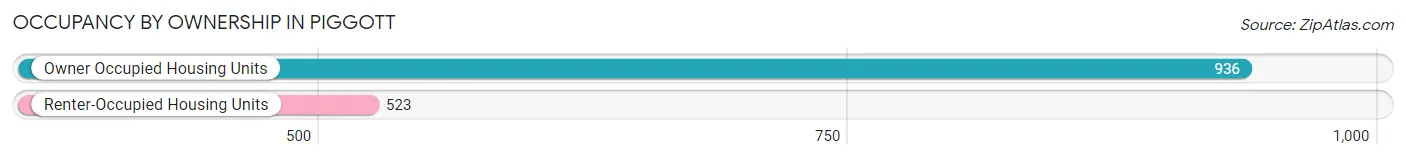
| Occupancy | # Housing Units | % Housing Units |
| Owner Occupied Housing Units | 936 | 64.1% |
| Renter-Occupied Housing Units | 523 | 35.8% |
| Total Occupied Housing Units | 1,459 | 100.0% |
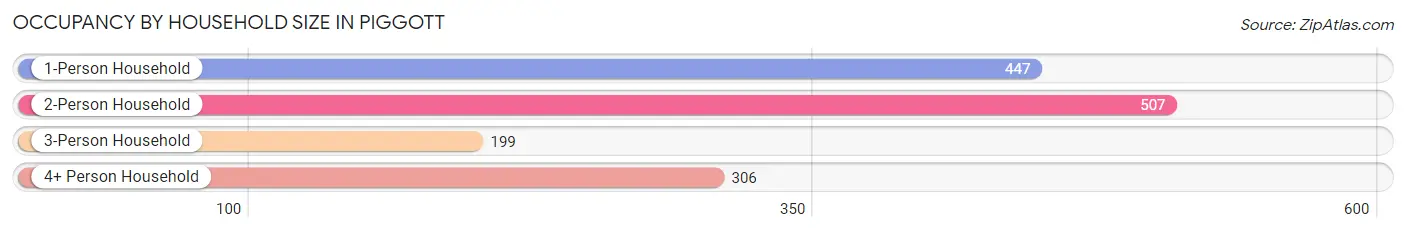
Occupancy by Household Size in Piggott
| Household Size | # Housing Units | % Housing Units |
| 1-Person Household | 447 | 30.6% |
| 2-Person Household | 507 | 34.7% |
| 3-Person Household | 199 | 13.6% |
| 4+ Person Household | 306 | 21.0% |
| Total Housing Units | 1,459 | 100.0% |
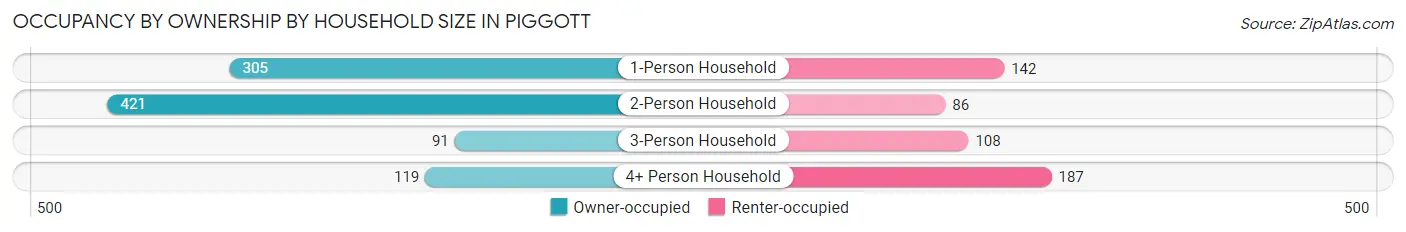
Occupancy by Ownership by Household Size in Piggott
| Household Size | Owner-occupied | Renter-occupied |
| 1-Person Household | 305 (68.2%) | 142 (31.8%) |
| 2-Person Household | 421 (83.0%) | 86 (17.0%) |
| 3-Person Household | 91 (45.7%) | 108 (54.3%) |
| 4+ Person Household | 119 (38.9%) | 187 (61.1%) |
| Total Housing Units | 936 (64.1%) | 523 (35.8%) |
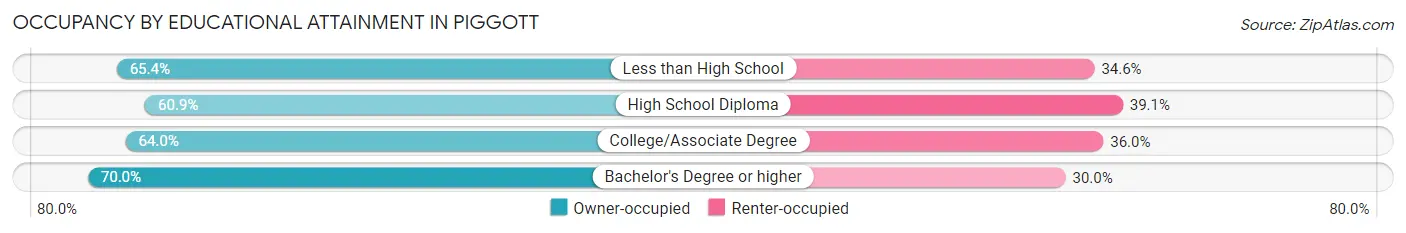
Occupancy by Educational Attainment in Piggott
| Household Size | Owner-occupied | Renter-occupied |
| Less than High School | 85 (65.4%) | 45 (34.6%) |
| High School Diploma | 319 (60.9%) | 205 (39.1%) |
| College/Associate Degree | 334 (64.0%) | 188 (36.0%) |
| Bachelor's Degree or higher | 198 (70.0%) | 85 (30.0%) |
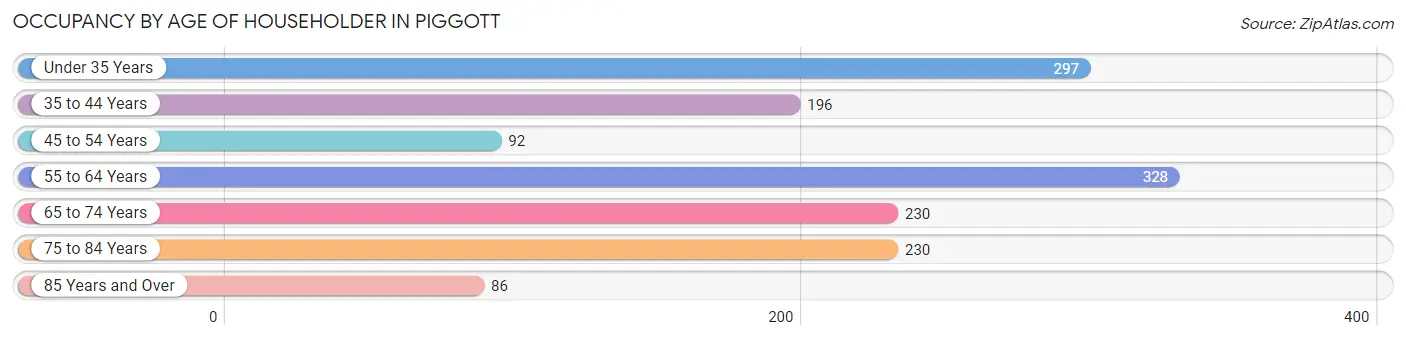
Occupancy by Age of Householder in Piggott
| Age Bracket | # Households | % Households |
| Under 35 Years | 297 | 20.4% |
| 35 to 44 Years | 196 | 13.4% |
| 45 to 54 Years | 92 | 6.3% |
| 55 to 64 Years | 328 | 22.5% |
| 65 to 74 Years | 230 | 15.8% |
| 75 to 84 Years | 230 | 15.8% |
| 85 Years and Over | 86 | 5.9% |
| Total | 1,459 | 100.0% |
Housing Finances in Piggott
Median Income by Occupancy in Piggott
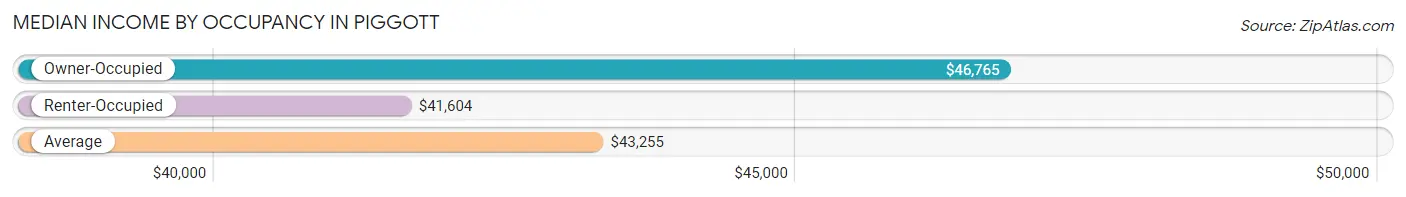
| Occupancy Type | # Households | Median Income |
| Owner-Occupied | 936 (64.1%) | $46,765 |
| Renter-Occupied | 523 (35.8%) | $41,604 |
| Average | 1,459 (100.0%) | $43,255 |
Occupancy by Householder Income Bracket in Piggott
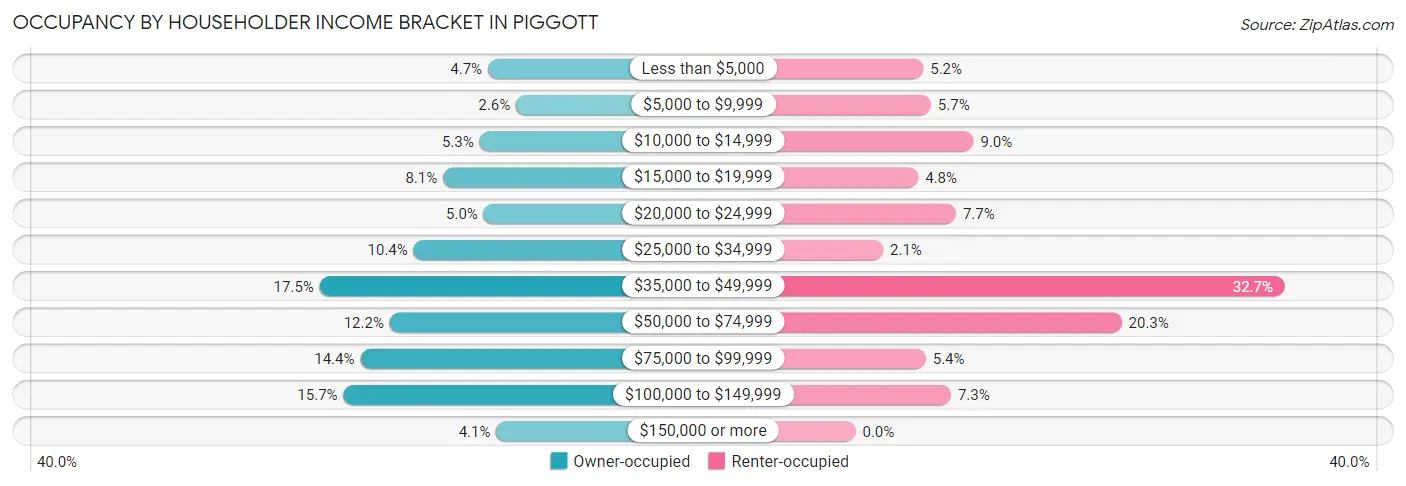
| Income Bracket | Owner-occupied | Renter-occupied |
| Less than $5,000 | 44 (4.7%) | 27 (5.2%) |
| $5,000 to $9,999 | 24 (2.6%) | 30 (5.7%) |
| $10,000 to $14,999 | 50 (5.3%) | 47 (9.0%) |
| $15,000 to $19,999 | 76 (8.1%) | 25 (4.8%) |
| $20,000 to $24,999 | 47 (5.0%) | 40 (7.6%) |
| $25,000 to $34,999 | 97 (10.4%) | 11 (2.1%) |
| $35,000 to $49,999 | 164 (17.5%) | 171 (32.7%) |
| $50,000 to $74,999 | 114 (12.2%) | 106 (20.3%) |
| $75,000 to $99,999 | 135 (14.4%) | 28 (5.3%) |
| $100,000 to $149,999 | 147 (15.7%) | 38 (7.3%) |
| $150,000 or more | 38 (4.1%) | 0 (0.0%) |
| Total | 936 (100.0%) | 523 (100.0%) |
Monthly Housing Cost Tiers in Piggott
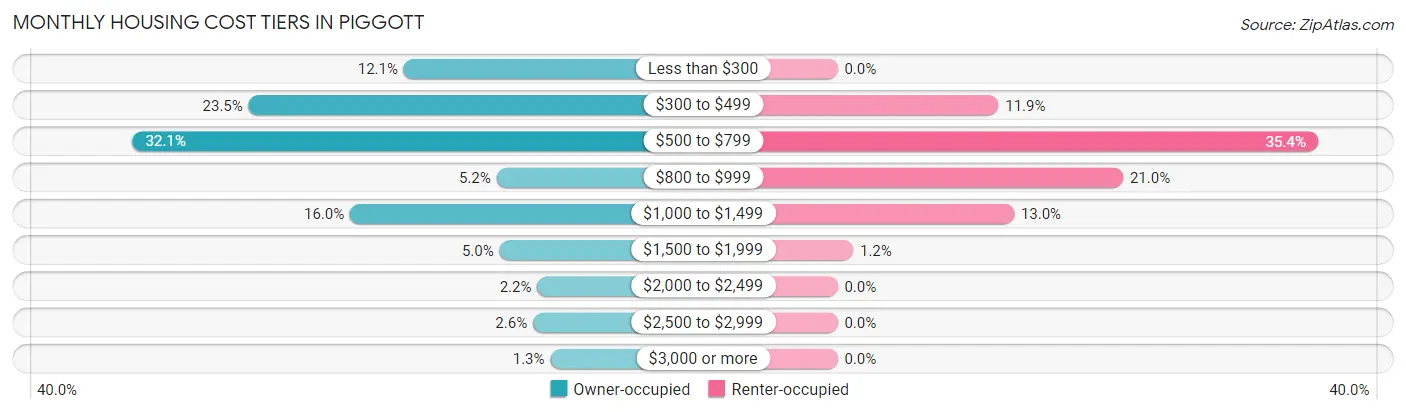
| Monthly Cost | Owner-occupied | Renter-occupied |
| Less than $300 | 113 (12.1%) | 0 (0.0%) |
| $300 to $499 | 220 (23.5%) | 62 (11.8%) |
| $500 to $799 | 300 (32.1%) | 185 (35.4%) |
| $800 to $999 | 49 (5.2%) | 110 (21.0%) |
| $1,000 to $1,499 | 150 (16.0%) | 68 (13.0%) |
| $1,500 to $1,999 | 47 (5.0%) | 6 (1.1%) |
| $2,000 to $2,499 | 21 (2.2%) | 0 (0.0%) |
| $2,500 to $2,999 | 24 (2.6%) | 0 (0.0%) |
| $3,000 or more | 12 (1.3%) | 0 (0.0%) |
| Total | 936 (100.0%) | 523 (100.0%) |
Physical Housing Characteristics in Piggott
Housing Structures in Piggott
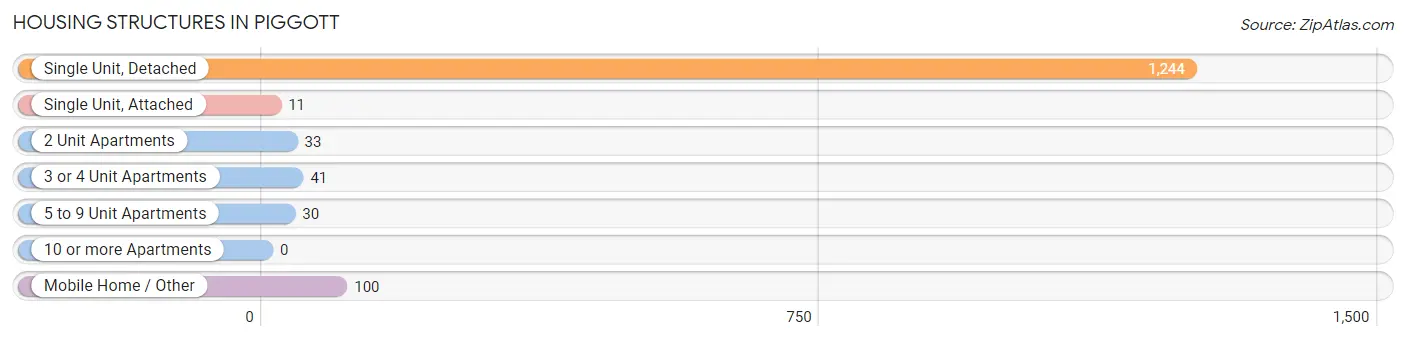
| Structure Type | # Housing Units | % Housing Units |
| Single Unit, Detached | 1,244 | 85.3% |
| Single Unit, Attached | 11 | 0.7% |
| 2 Unit Apartments | 33 | 2.3% |
| 3 or 4 Unit Apartments | 41 | 2.8% |
| 5 to 9 Unit Apartments | 30 | 2.1% |
| 10 or more Apartments | 0 | 0.0% |
| Mobile Home / Other | 100 | 6.9% |
| Total | 1,459 | 100.0% |
Housing Structures by Occupancy in Piggott
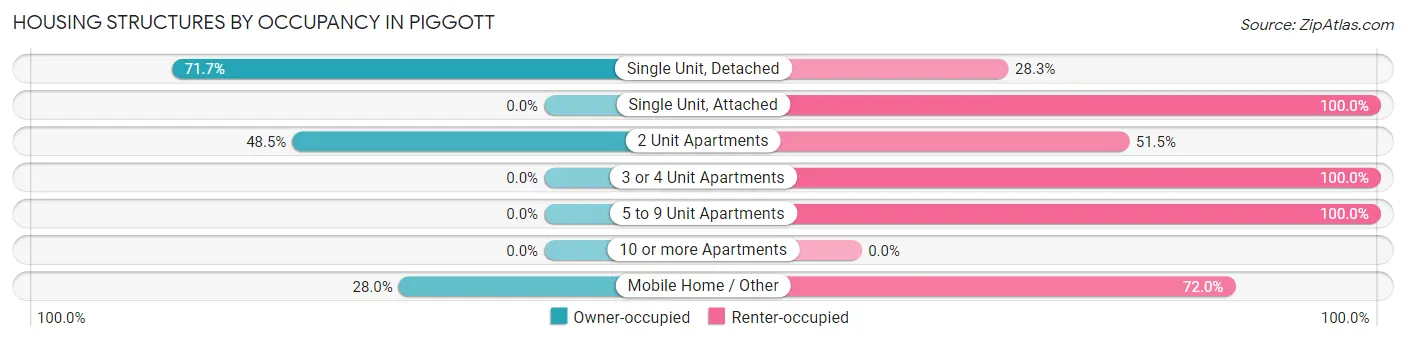
| Structure Type | Owner-occupied | Renter-occupied |
| Single Unit, Detached | 892 (71.7%) | 352 (28.3%) |
| Single Unit, Attached | 0 (0.0%) | 11 (100.0%) |
| 2 Unit Apartments | 16 (48.5%) | 17 (51.5%) |
| 3 or 4 Unit Apartments | 0 (0.0%) | 41 (100.0%) |
| 5 to 9 Unit Apartments | 0 (0.0%) | 30 (100.0%) |
| 10 or more Apartments | 0 (0.0%) | 0 (0.0%) |
| Mobile Home / Other | 28 (28.0%) | 72 (72.0%) |
| Total | 936 (64.1%) | 523 (35.8%) |
Housing Structures by Number of Rooms in Piggott
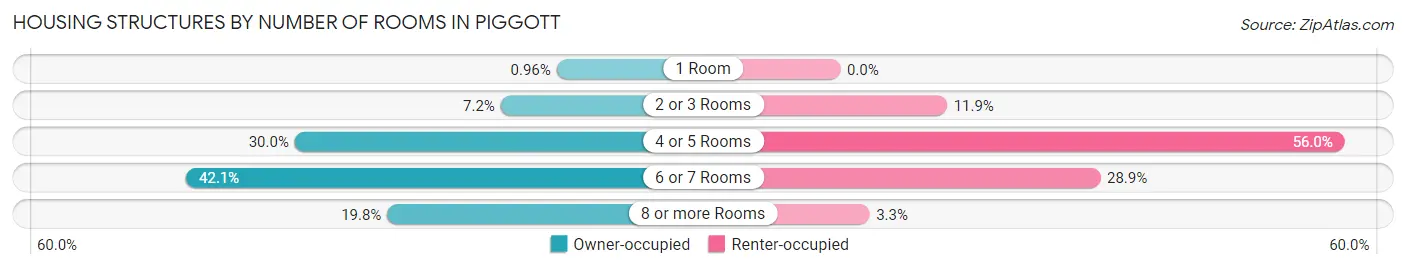
| Number of Rooms | Owner-occupied | Renter-occupied |
| 1 Room | 9 (1.0%) | 0 (0.0%) |
| 2 or 3 Rooms | 67 (7.2%) | 62 (11.8%) |
| 4 or 5 Rooms | 281 (30.0%) | 293 (56.0%) |
| 6 or 7 Rooms | 394 (42.1%) | 151 (28.9%) |
| 8 or more Rooms | 185 (19.8%) | 17 (3.3%) |
| Total | 936 (100.0%) | 523 (100.0%) |
Housing Structure by Heating Type in Piggott
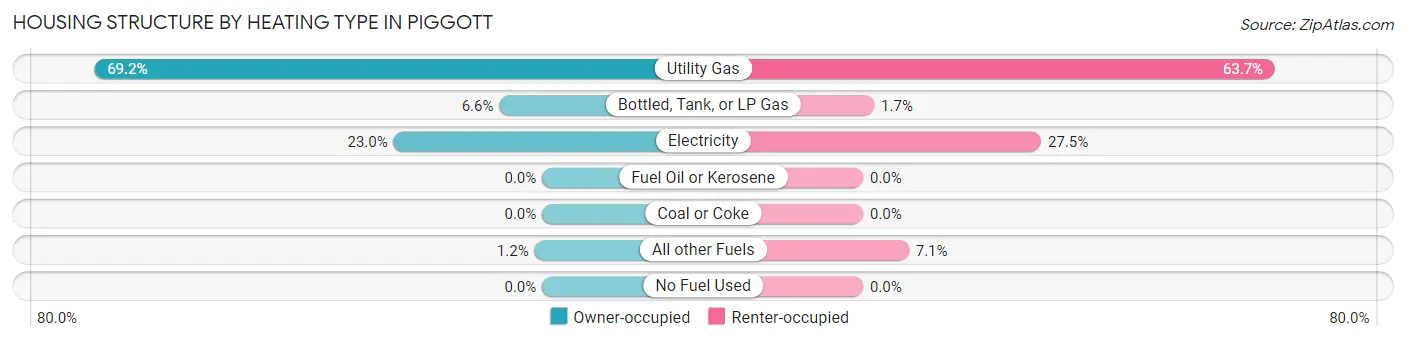
| Heating Type | Owner-occupied | Renter-occupied |
| Utility Gas | 648 (69.2%) | 333 (63.7%) |
| Bottled, Tank, or LP Gas | 62 (6.6%) | 9 (1.7%) |
| Electricity | 215 (23.0%) | 144 (27.5%) |
| Fuel Oil or Kerosene | 0 (0.0%) | 0 (0.0%) |
| Coal or Coke | 0 (0.0%) | 0 (0.0%) |
| All other Fuels | 11 (1.2%) | 37 (7.1%) |
| No Fuel Used | 0 (0.0%) | 0 (0.0%) |
| Total | 936 (100.0%) | 523 (100.0%) |
Household Vehicle Usage in Piggott
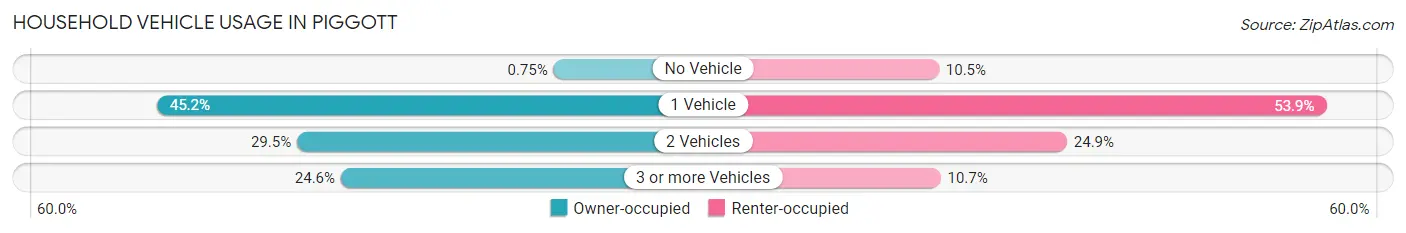
| Vehicles per Household | Owner-occupied | Renter-occupied |
| No Vehicle | 7 (0.7%) | 55 (10.5%) |
| 1 Vehicle | 423 (45.2%) | 282 (53.9%) |
| 2 Vehicles | 276 (29.5%) | 130 (24.9%) |
| 3 or more Vehicles | 230 (24.6%) | 56 (10.7%) |
| Total | 936 (100.0%) | 523 (100.0%) |
Real Estate & Mortgages in Piggott
Real Estate and Mortgage Overview in Piggott
| Characteristic | Without Mortgage | With Mortgage |
| Housing Units | 446 | 490 |
| Median Property Value | $123,400 | $96,200 |
| Median Household Income | $37,404 | $27 |
| Monthly Housing Costs | $390 | $12 |
| Real Estate Taxes | $649 | $56 |
Property Value by Mortgage Status in Piggott
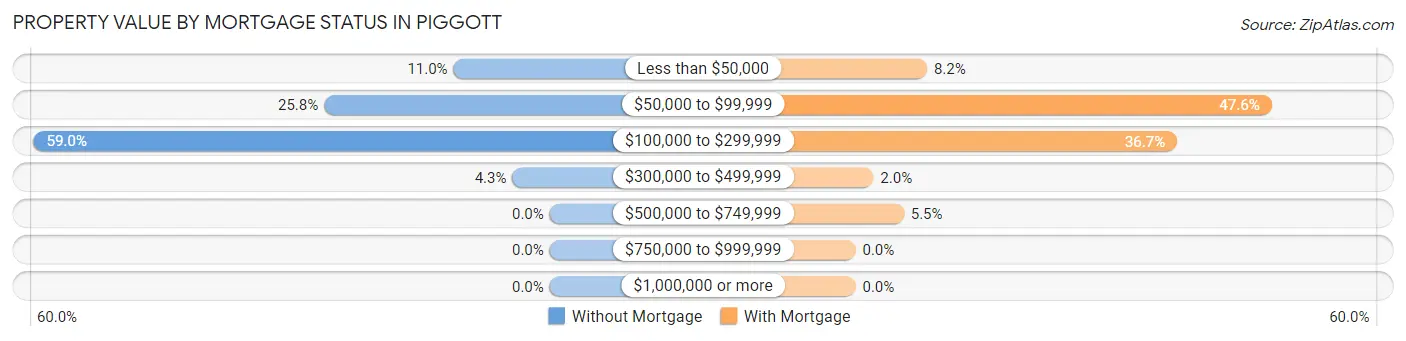
| Property Value | Without Mortgage | With Mortgage |
| Less than $50,000 | 49 (11.0%) | 40 (8.2%) |
| $50,000 to $99,999 | 115 (25.8%) | 233 (47.5%) |
| $100,000 to $299,999 | 263 (59.0%) | 180 (36.7%) |
| $300,000 to $499,999 | 19 (4.3%) | 10 (2.0%) |
| $500,000 to $749,999 | 0 (0.0%) | 27 (5.5%) |
| $750,000 to $999,999 | 0 (0.0%) | 0 (0.0%) |
| $1,000,000 or more | 0 (0.0%) | 0 (0.0%) |
| Total | 446 (100.0%) | 490 (100.0%) |
Household Income by Mortgage Status in Piggott
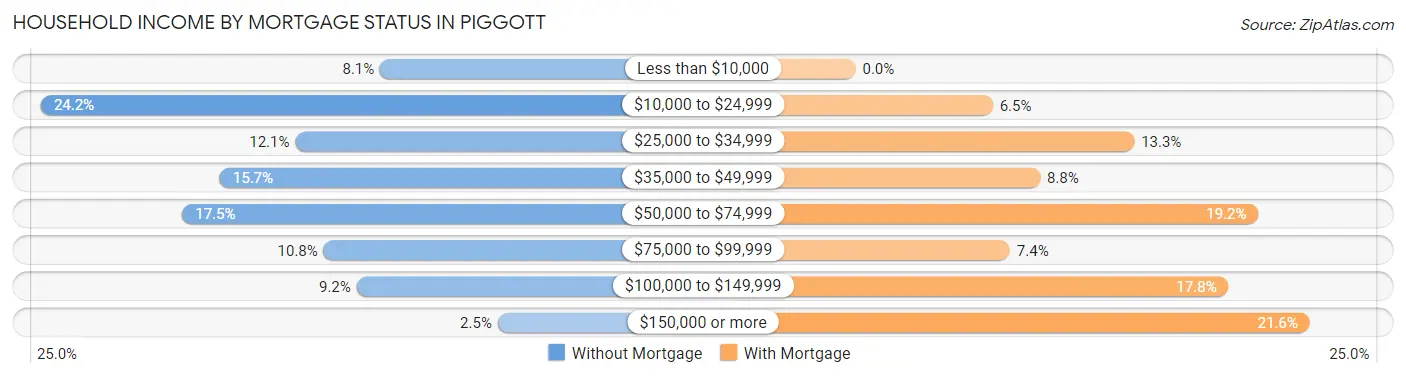
| Household Income | Without Mortgage | With Mortgage |
| Less than $10,000 | 36 (8.1%) | 0 (0.0%) |
| $10,000 to $24,999 | 108 (24.2%) | 32 (6.5%) |
| $25,000 to $34,999 | 54 (12.1%) | 65 (13.3%) |
| $35,000 to $49,999 | 70 (15.7%) | 43 (8.8%) |
| $50,000 to $74,999 | 78 (17.5%) | 94 (19.2%) |
| $75,000 to $99,999 | 48 (10.8%) | 36 (7.3%) |
| $100,000 to $149,999 | 41 (9.2%) | 87 (17.8%) |
| $150,000 or more | 11 (2.5%) | 106 (21.6%) |
| Total | 446 (100.0%) | 490 (100.0%) |
Property Value to Household Income Ratio in Piggott
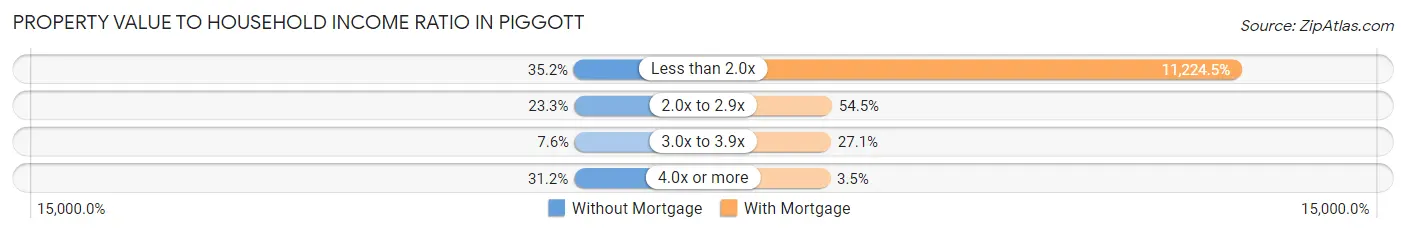
| Value-to-Income Ratio | Without Mortgage | With Mortgage |
| Less than 2.0x | 157 (35.2%) | 55,000 (11,224.5%) |
| 2.0x to 2.9x | 104 (23.3%) | 267 (54.5%) |
| 3.0x to 3.9x | 34 (7.6%) | 133 (27.1%) |
| 4.0x or more | 139 (31.2%) | 17 (3.5%) |
| Total | 446 (100.0%) | 490 (100.0%) |
Real Estate Taxes by Mortgage Status in Piggott
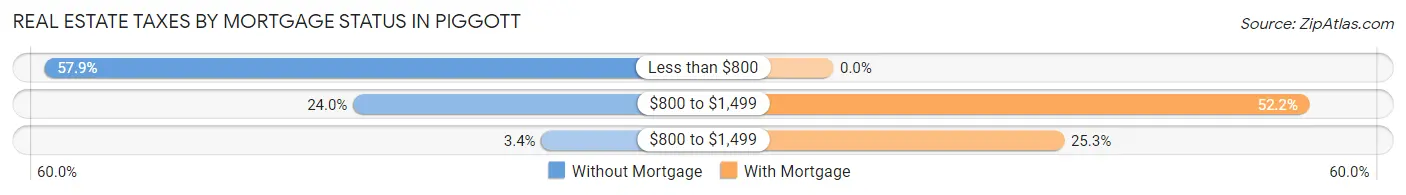
| Property Taxes | Without Mortgage | With Mortgage |
| Less than $800 | 258 (57.9%) | 0 (0.0%) |
| $800 to $1,499 | 107 (24.0%) | 256 (52.2%) |
| $800 to $1,499 | 15 (3.4%) | 124 (25.3%) |
| Total | 446 (100.0%) | 490 (100.0%) |
Health & Disability in Piggott
Health Insurance Coverage by Age in Piggott
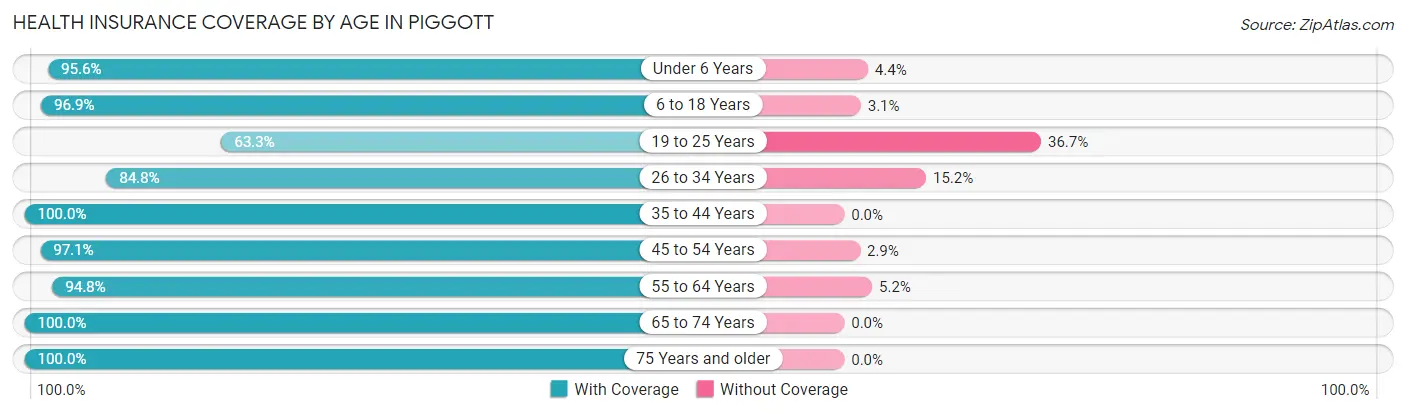
| Age Bracket | With Coverage | Without Coverage |
| Under 6 Years | 369 (95.6%) | 17 (4.4%) |
| 6 to 18 Years | 629 (96.9%) | 20 (3.1%) |
| 19 to 25 Years | 195 (63.3%) | 113 (36.7%) |
| 26 to 34 Years | 317 (84.8%) | 57 (15.2%) |
| 35 to 44 Years | 286 (100.0%) | 0 (0.0%) |
| 45 to 54 Years | 232 (97.1%) | 7 (2.9%) |
| 55 to 64 Years | 549 (94.8%) | 30 (5.2%) |
| 65 to 74 Years | 364 (100.0%) | 0 (0.0%) |
| 75 Years and older | 354 (100.0%) | 0 (0.0%) |
| Total | 3,295 (93.1%) | 244 (6.9%) |
Health Insurance Coverage by Citizenship Status in Piggott
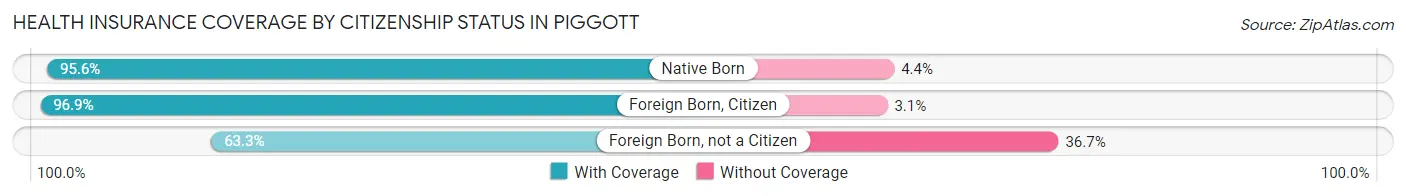
| Citizenship Status | With Coverage | Without Coverage |
| Native Born | 369 (95.6%) | 17 (4.4%) |
| Foreign Born, Citizen | 629 (96.9%) | 20 (3.1%) |
| Foreign Born, not a Citizen | 195 (63.3%) | 113 (36.7%) |
Health Insurance Coverage by Household Income in Piggott
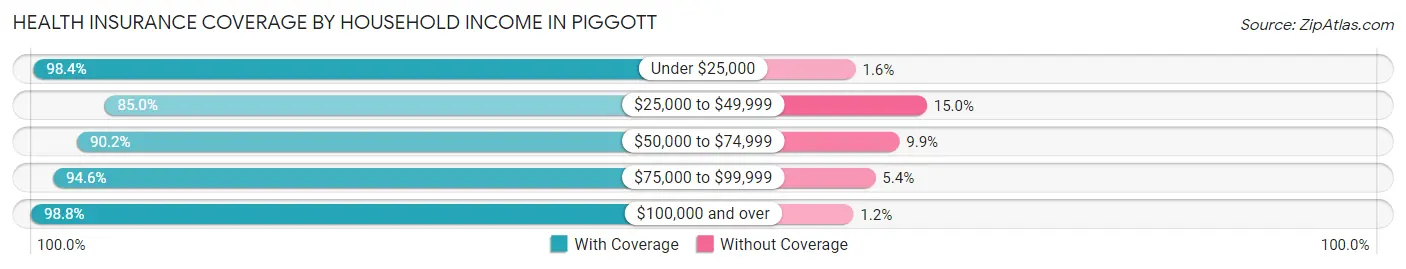
| Household Income | With Coverage | Without Coverage |
| Under $25,000 | 780 (98.4%) | 13 (1.6%) |
| $25,000 to $49,999 | 828 (85.0%) | 146 (15.0%) |
| $50,000 to $74,999 | 467 (90.1%) | 51 (9.9%) |
| $75,000 to $99,999 | 424 (94.6%) | 24 (5.4%) |
| $100,000 and over | 796 (98.8%) | 10 (1.2%) |
Public vs Private Health Insurance Coverage by Age in Piggott
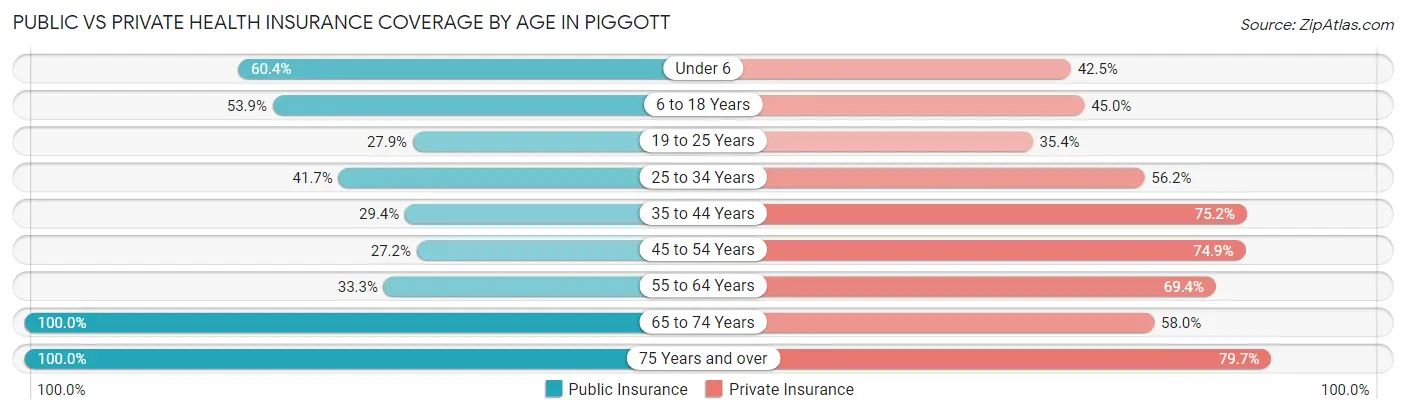
| Age Bracket | Public Insurance | Private Insurance |
| Under 6 | 233 (60.4%) | 164 (42.5%) |
| 6 to 18 Years | 350 (53.9%) | 292 (45.0%) |
| 19 to 25 Years | 86 (27.9%) | 109 (35.4%) |
| 25 to 34 Years | 156 (41.7%) | 210 (56.1%) |
| 35 to 44 Years | 84 (29.4%) | 215 (75.2%) |
| 45 to 54 Years | 65 (27.2%) | 179 (74.9%) |
| 55 to 64 Years | 193 (33.3%) | 402 (69.4%) |
| 65 to 74 Years | 364 (100.0%) | 211 (58.0%) |
| 75 Years and over | 354 (100.0%) | 282 (79.7%) |
| Total | 1,885 (53.3%) | 2,064 (58.3%) |
Disability Status by Sex by Age in Piggott
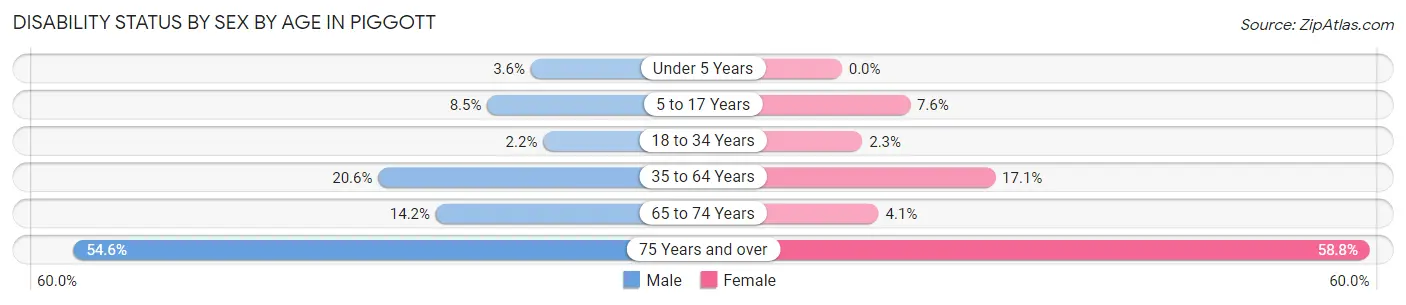
| Age Bracket | Male | Female |
| Under 5 Years | 7 (3.6%) | 0 (0.0%) |
| 5 to 17 Years | 31 (8.5%) | 24 (7.6%) |
| 18 to 34 Years | 8 (2.2%) | 9 (2.3%) |
| 35 to 64 Years | 102 (20.6%) | 104 (17.1%) |
| 65 to 74 Years | 24 (14.2%) | 8 (4.1%) |
| 75 Years and over | 66 (54.5%) | 137 (58.8%) |
Disability Class by Sex by Age in Piggott
Disability Class: Hearing Difficulty
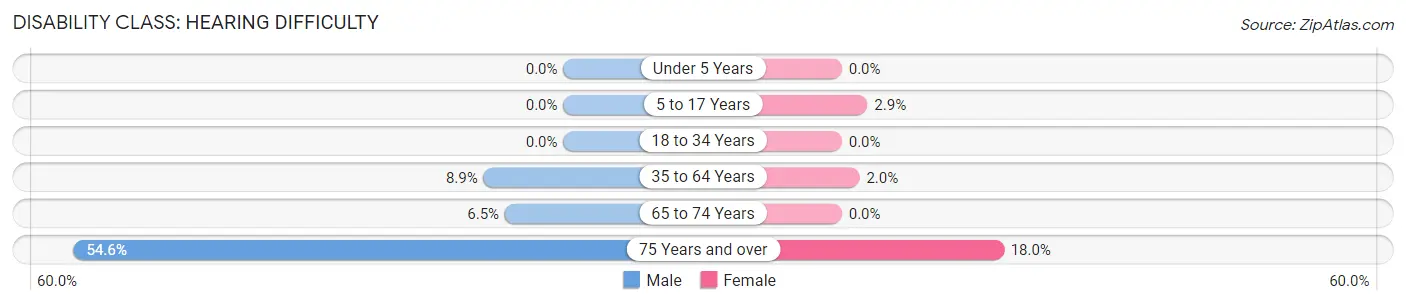
| Age Bracket | Male | Female |
| Under 5 Years | 0 (0.0%) | 0 (0.0%) |
| 5 to 17 Years | 0 (0.0%) | 9 (2.9%) |
| 18 to 34 Years | 0 (0.0%) | 0 (0.0%) |
| 35 to 64 Years | 44 (8.9%) | 12 (2.0%) |
| 65 to 74 Years | 11 (6.5%) | 0 (0.0%) |
| 75 Years and over | 66 (54.5%) | 42 (18.0%) |
Disability Class: Vision Difficulty
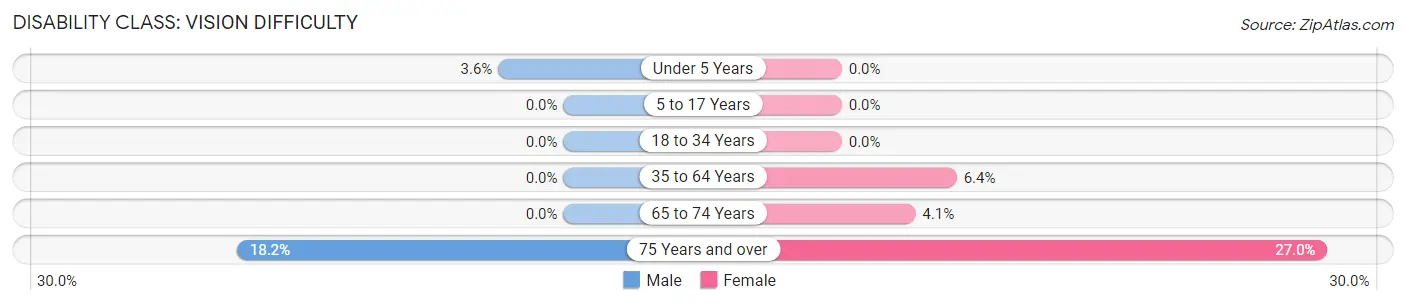
| Age Bracket | Male | Female |
| Under 5 Years | 7 (3.6%) | 0 (0.0%) |
| 5 to 17 Years | 0 (0.0%) | 0 (0.0%) |
| 18 to 34 Years | 0 (0.0%) | 0 (0.0%) |
| 35 to 64 Years | 0 (0.0%) | 39 (6.4%) |
| 65 to 74 Years | 0 (0.0%) | 8 (4.1%) |
| 75 Years and over | 22 (18.2%) | 63 (27.0%) |
Disability Class: Cognitive Difficulty
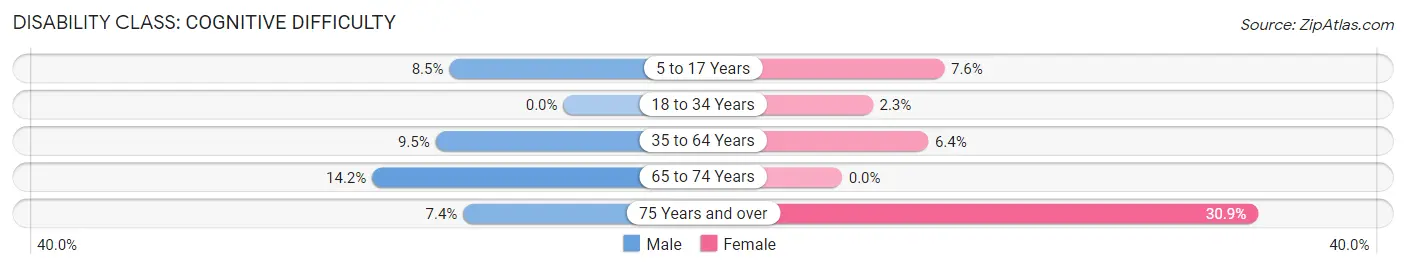
| Age Bracket | Male | Female |
| 5 to 17 Years | 31 (8.5%) | 24 (7.6%) |
| 18 to 34 Years | 0 (0.0%) | 9 (2.3%) |
| 35 to 64 Years | 47 (9.5%) | 39 (6.4%) |
| 65 to 74 Years | 24 (14.2%) | 0 (0.0%) |
| 75 Years and over | 9 (7.4%) | 72 (30.9%) |
Disability Class: Ambulatory Difficulty
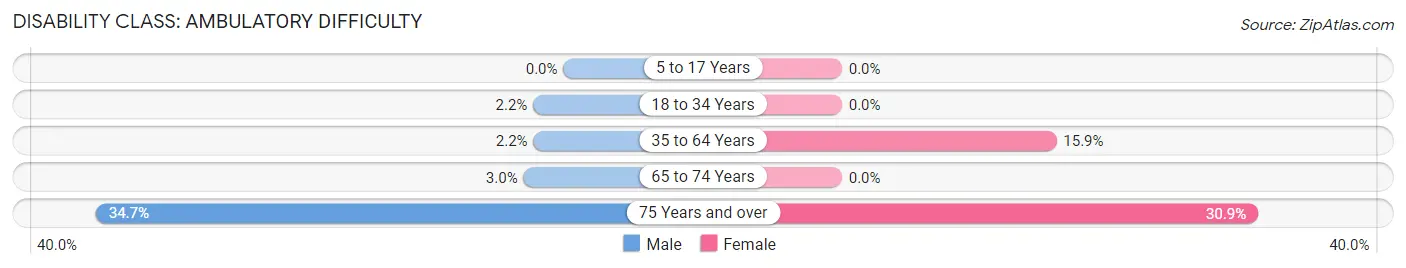
| Age Bracket | Male | Female |
| 5 to 17 Years | 0 (0.0%) | 0 (0.0%) |
| 18 to 34 Years | 8 (2.2%) | 0 (0.0%) |
| 35 to 64 Years | 11 (2.2%) | 97 (15.9%) |
| 65 to 74 Years | 5 (3.0%) | 0 (0.0%) |
| 75 Years and over | 42 (34.7%) | 72 (30.9%) |
Disability Class: Self-Care Difficulty
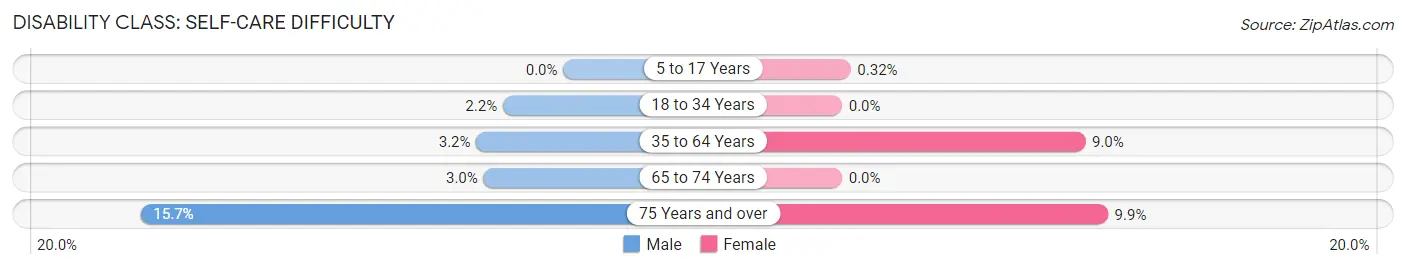
| Age Bracket | Male | Female |
| 5 to 17 Years | 0 (0.0%) | 1 (0.3%) |
| 18 to 34 Years | 8 (2.2%) | 0 (0.0%) |
| 35 to 64 Years | 16 (3.2%) | 55 (9.0%) |
| 65 to 74 Years | 5 (3.0%) | 0 (0.0%) |
| 75 Years and over | 19 (15.7%) | 23 (9.9%) |
Technology Access in Piggott
Computing Device Access in Piggott
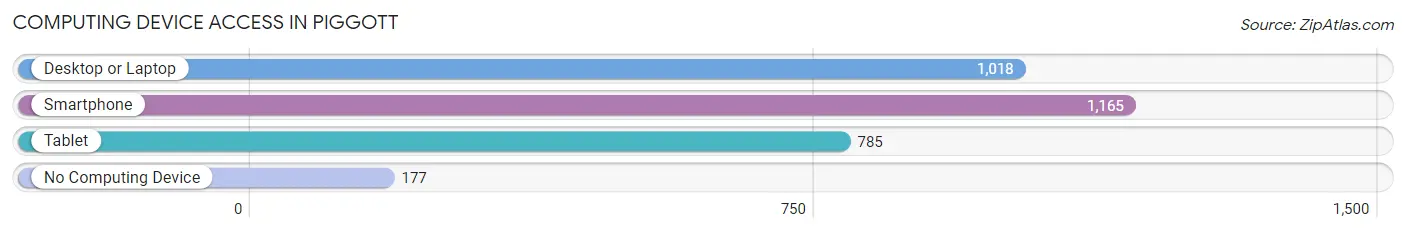
| Device Type | # Households | % Households |
| Desktop or Laptop | 1,018 | 69.8% |
| Smartphone | 1,165 | 79.8% |
| Tablet | 785 | 53.8% |
| No Computing Device | 177 | 12.1% |
| Total | 1,459 | 100.0% |
Internet Access in Piggott
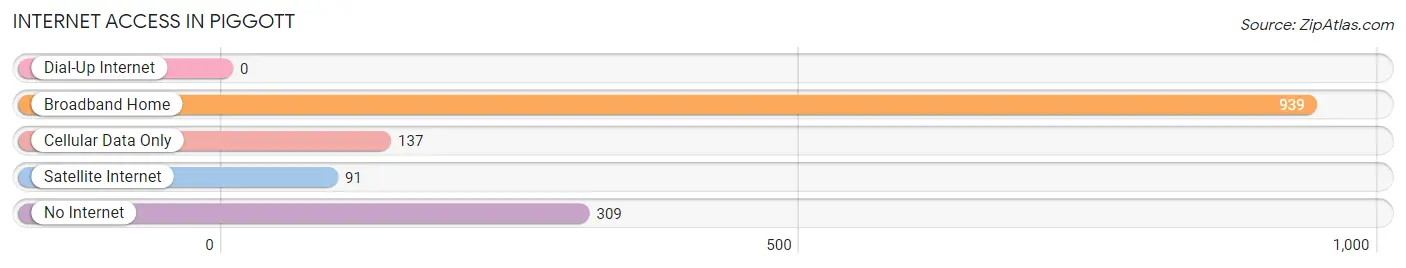
| Internet Type | # Households | % Households |
| Dial-Up Internet | 0 | 0.0% |
| Broadband Home | 939 | 64.4% |
| Cellular Data Only | 137 | 9.4% |
| Satellite Internet | 91 | 6.2% |
| No Internet | 309 | 21.2% |
| Total | 1,459 | 100.0% |
Piggott Summary
Piggott, Arkansas is a small town located in Clay County in the northeastern corner of the state. It is situated on the banks of the St. Francis River, and is the county seat of Clay County. The town was founded in 1883 and has a population of approximately 3,000 people.
Piggott is located in the Arkansas Delta, an area of the state known for its rich agricultural heritage. The town is surrounded by vast fields of cotton, soybeans, and rice, and is home to several large poultry farms. The town is also home to a number of small businesses, including a few restaurants, a grocery store, and a few small shops.
The town of Piggott has a rich history that dates back to the early 1800s. The town was originally settled by Native Americans, and was later settled by European settlers in the early 1800s. The town was named after a local settler, William Piggott, who was a prominent figure in the area.
The economy of Piggott is largely based on agriculture. The town is home to several large poultry farms, as well as a number of small businesses. The town is also home to a number of small manufacturing companies, including a furniture factory and a woodworking shop.
The demographics of Piggott are largely white, with a small African American population. The town is also home to a small Hispanic population. The median household income in Piggott is approximately $30,000, and the median home value is around $90,000.
Piggott is served by the Piggott School District, which includes two elementary schools, a middle school, and a high school. The town is also home to a number of churches, including the First Baptist Church, the First United Methodist Church, and the Church of Christ.
Piggott is a small town with a rich history and a strong agricultural heritage. The town is home to a number of small businesses, and is served by the Piggott School District. The town is also home to a small Hispanic population, and the median household income is approximately $30,000. The town is a great place to live and work, and is a great place to raise a family.
Common Questions
What is Per Capita Income in Piggott?
Per Capita income in Piggott is $24,537.
What is the Median Family Income in Piggott?
Median Family Income in Piggott is $47,649.
What is the Median Household income in Piggott?
Median Household Income in Piggott is $43,255.
What is Income or Wage Gap in Piggott?
Income or Wage Gap in Piggott is 31.6%.
Women in Piggott earn 68.4 cents for every dollar earned by a man.
What is Inequality or Gini Index in Piggott?
Inequality or Gini Index in Piggott is 0.44.
What is the Total Population of Piggott?
Total Population of Piggott is 3,610.
What is the Total Male Population of Piggott?
Total Male Population of Piggott is 1,743.
What is the Total Female Population of Piggott?
Total Female Population of Piggott is 1,867.
What is the Ratio of Males per 100 Females in Piggott?
There are 93.36 Males per 100 Females in Piggott.
What is the Ratio of Females per 100 Males in Piggott?
There are 107.11 Females per 100 Males in Piggott.
What is the Median Population Age in Piggott?
Median Population Age in Piggott is 37.6 Years.
What is the Average Family Size in Piggott
Average Family Size in Piggott is 2.9 People.
What is the Average Household Size in Piggott
Average Household Size in Piggott is 2.4 People.
How Large is the Labor Force in Piggott?
There are 1,648 People in the Labor Forcein in Piggott.
What is the Percentage of People in the Labor Force in Piggott?
61.4% of People are in the Labor Force in Piggott.
What is the Unemployment Rate in Piggott?
Unemployment Rate in Piggott is 3.0%.