Zip Codes with the Highest Percentage of Population Employed in Legal Services & Support in Benton, AR
RELATED REPORTS & OPTIONS
Legal Services & Support
Benton
Compare Zip Codes
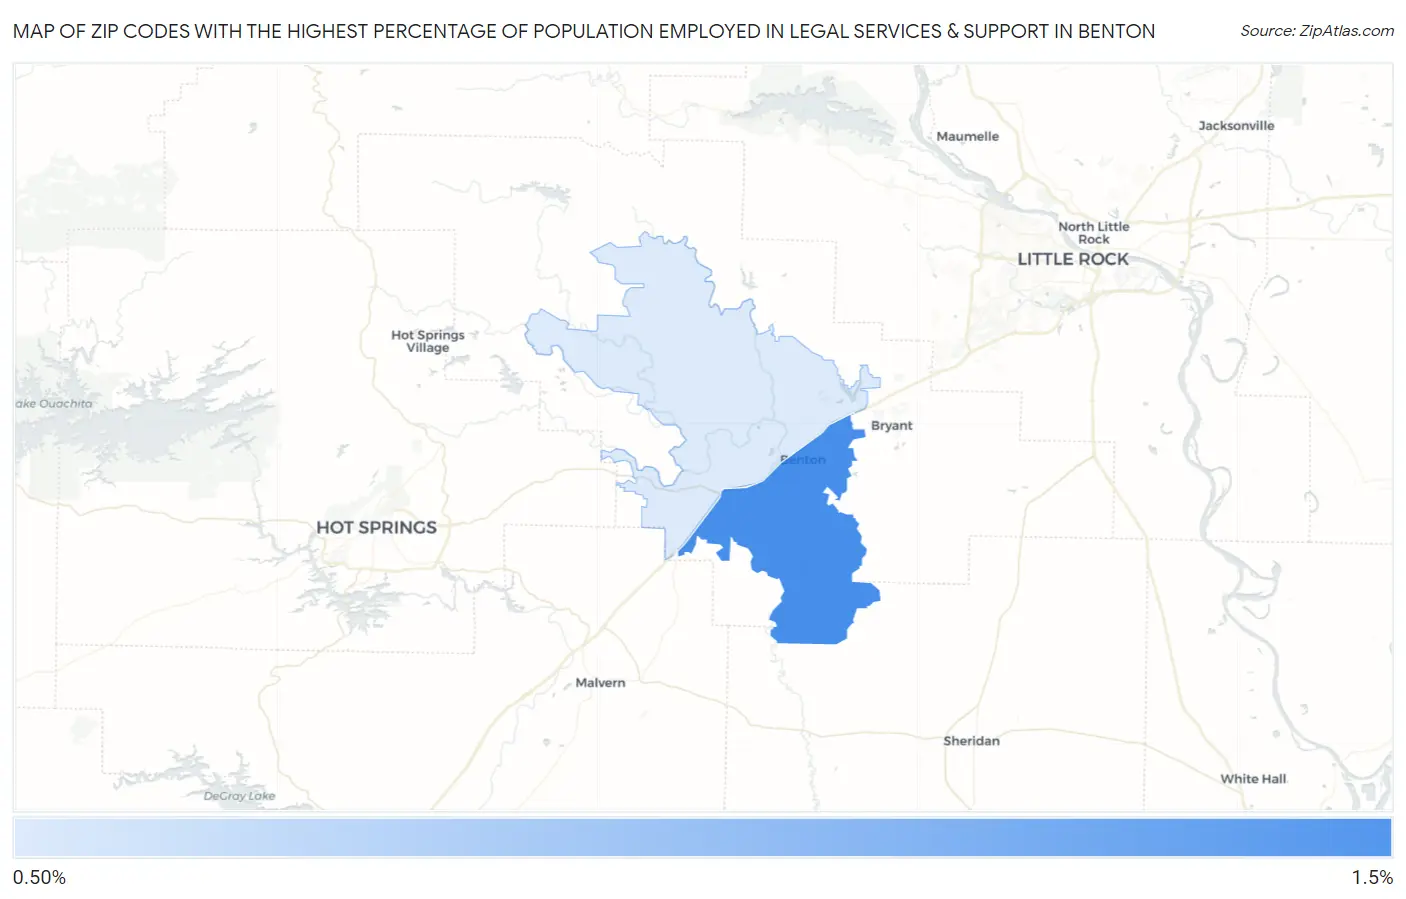
Map of Zip Codes with the Highest Percentage of Population Employed in Legal Services & Support in Benton
0.65%
1.1%
Zip Codes with the Highest Percentage of Population Employed in Legal Services & Support in Benton, AR
| Zip Code | % Employed | vs State | vs National | |
| 1. | 72015 | 1.1% | 0.79%(+0.304)#63 | 1.2%(-0.095)#7,243 |
| 2. | 72019 | 0.65% | 0.79%(-0.136)#111 | 1.2%(-0.534)#10,949 |
1
Common Questions
What are the Top Zip Codes with the Highest Percentage of Population Employed in Legal Services & Support in Benton, AR?
Top Zip Codes with the Highest Percentage of Population Employed in Legal Services & Support in Benton, AR are:
What zip code has the Highest Percentage of Population Employed in Legal Services & Support in Benton, AR?
72015 has the Highest Percentage of Population Employed in Legal Services & Support in Benton, AR with 1.1%.
What is the Percentage of Population Employed in Legal Services & Support in Benton, AR?
Percentage of Population Employed in Legal Services & Support in Benton is 0.93%.
What is the Percentage of Population Employed in Legal Services & Support in Arkansas?
Percentage of Population Employed in Legal Services & Support in Arkansas is 0.79%.
What is the Percentage of Population Employed in Legal Services & Support in the United States?
Percentage of Population Employed in Legal Services & Support in the United States is 1.2%.