Jonesboro, AR Map & Demographics
Jonesboro Map
Jonesboro Overview
$31,108
PER CAPITA INCOME
$68,698
AVG FAMILY INCOME
$51,124
AVG HOUSEHOLD INCOME
27.3%
WAGE / INCOME GAP [ % ]
72.7¢/ $1
WAGE / INCOME GAP [ $ ]
$12,269
FAMILY INCOME DEFICIT
0.52
INEQUALITY / GINI INDEX
78,379
TOTAL POPULATION
37,463
MALE POPULATION
40,916
FEMALE POPULATION
91.56
MALES / 100 FEMALES
109.22
FEMALES / 100 MALES
33.8
MEDIAN AGE
3.1
AVG FAMILY SIZE
2.5
AVG HOUSEHOLD SIZE
38,698
LABOR FORCE [ PEOPLE ]
63.0%
PERCENT IN LABOR FORCE
6.7%
UNEMPLOYMENT RATE
Jonesboro Area Codes
Income in Jonesboro
Income Overview in Jonesboro
Per Capita Income in Jonesboro is $31,108, while median incomes of families and households are $68,698 and $51,124 respectively.
| Characteristic | Number | Measure |
| Per Capita Income | 78,379 | $31,108 |
| Median Family Income | 18,981 | $68,698 |
| Mean Family Income | 18,981 | $96,782 |
| Median Household Income | 30,187 | $51,124 |
| Mean Household Income | 30,187 | $78,941 |
| Income Deficit | 18,981 | $12,269 |
| Wage / Income Gap (%) | 78,379 | 27.30% |
| Wage / Income Gap ($) | 78,379 | 72.70¢ per $1 |
| Gini / Inequality Index | 78,379 | 0.52 |
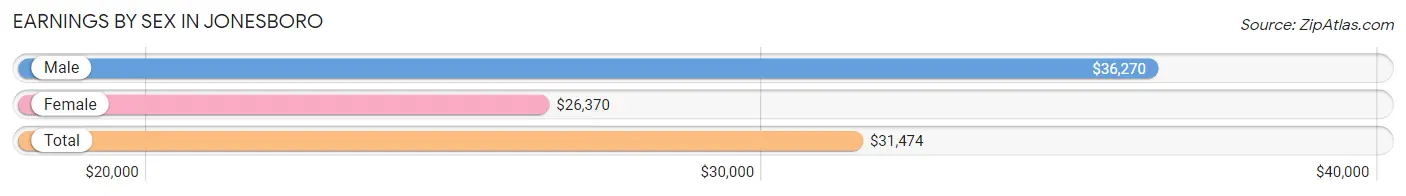
Earnings by Sex in Jonesboro
Average Earnings in Jonesboro are $31,474, $36,270 for men and $26,370 for women, a difference of 27.3%.
| Sex | Number | Average Earnings |
| Male | 20,125 (49.8%) | $36,270 |
| Female | 20,292 (50.2%) | $26,370 |
| Total | 40,417 (100.0%) | $31,474 |
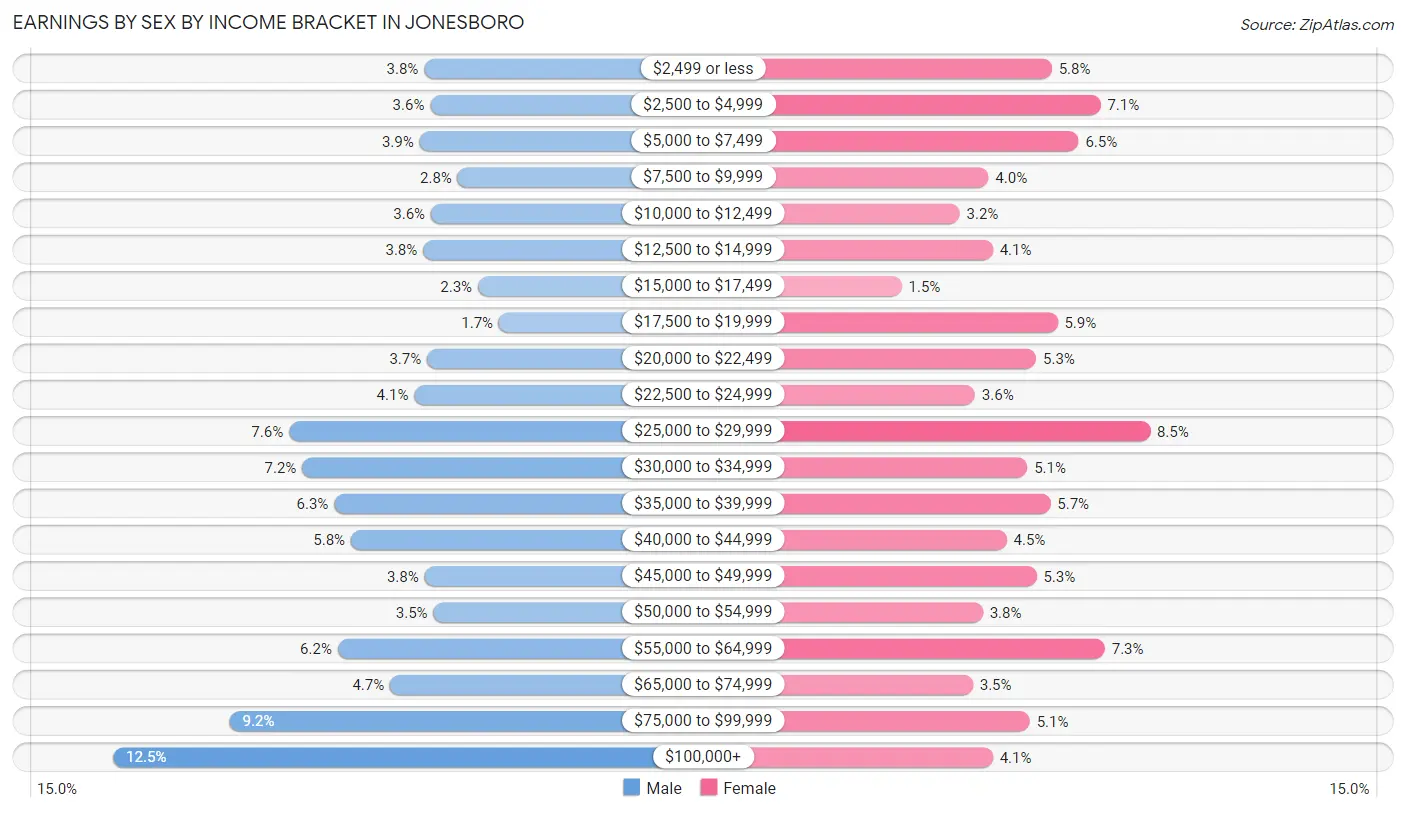
Earnings by Sex by Income Bracket in Jonesboro
The most common earnings brackets in Jonesboro are $100,000+ for men (2,518 | 12.5%) and $25,000 to $29,999 for women (1,728 | 8.5%).
| Income | Male | Female |
| $2,499 or less | 759 (3.8%) | 1,169 (5.8%) |
| $2,500 to $4,999 | 724 (3.6%) | 1,447 (7.1%) |
| $5,000 to $7,499 | 785 (3.9%) | 1,322 (6.5%) |
| $7,500 to $9,999 | 570 (2.8%) | 807 (4.0%) |
| $10,000 to $12,499 | 721 (3.6%) | 643 (3.2%) |
| $12,500 to $14,999 | 765 (3.8%) | 831 (4.1%) |
| $15,000 to $17,499 | 454 (2.3%) | 312 (1.5%) |
| $17,500 to $19,999 | 337 (1.7%) | 1,201 (5.9%) |
| $20,000 to $22,499 | 742 (3.7%) | 1,080 (5.3%) |
| $22,500 to $24,999 | 816 (4.1%) | 731 (3.6%) |
| $25,000 to $29,999 | 1,524 (7.6%) | 1,728 (8.5%) |
| $30,000 to $34,999 | 1,449 (7.2%) | 1,029 (5.1%) |
| $35,000 to $39,999 | 1,268 (6.3%) | 1,160 (5.7%) |
| $40,000 to $44,999 | 1,173 (5.8%) | 912 (4.5%) |
| $45,000 to $49,999 | 756 (3.8%) | 1,081 (5.3%) |
| $50,000 to $54,999 | 707 (3.5%) | 775 (3.8%) |
| $55,000 to $64,999 | 1,247 (6.2%) | 1,471 (7.2%) |
| $65,000 to $74,999 | 951 (4.7%) | 719 (3.5%) |
| $75,000 to $99,999 | 1,859 (9.2%) | 1,042 (5.1%) |
| $100,000+ | 2,518 (12.5%) | 832 (4.1%) |
| Total | 20,125 (100.0%) | 20,292 (100.0%) |
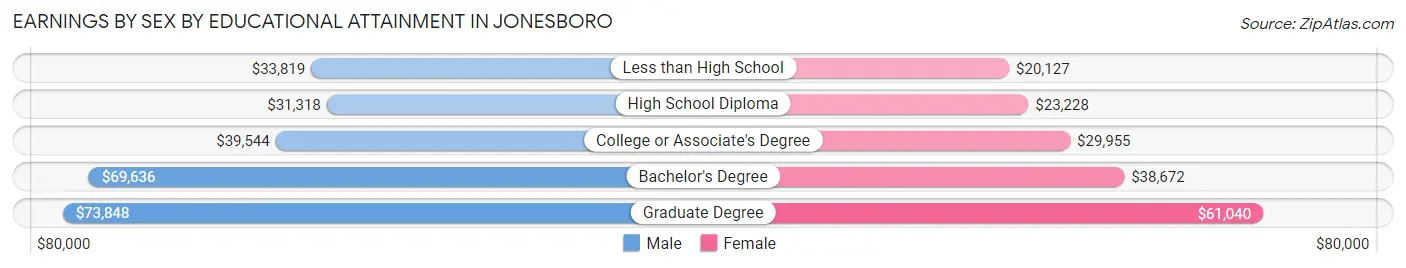
Earnings by Sex by Educational Attainment in Jonesboro
Average earnings in Jonesboro are $42,919 for men and $32,654 for women, a difference of 23.9%. Men with an educational attainment of graduate degree enjoy the highest average annual earnings of $73,848, while those with high school diploma education earn the least with $31,318. Women with an educational attainment of graduate degree earn the most with the average annual earnings of $61,040, while those with less than high school education have the smallest earnings of $20,127.
| Educational Attainment | Male Income | Female Income |
| Less than High School | $33,819 | $20,127 |
| High School Diploma | $31,318 | $23,228 |
| College or Associate's Degree | $39,544 | $29,955 |
| Bachelor's Degree | $69,636 | $38,672 |
| Graduate Degree | $73,848 | $61,040 |
| Total | $42,919 | $32,654 |
Family Income in Jonesboro
Family Income Brackets in Jonesboro
According to the Jonesboro family income data, there are 3,606 families falling into the $100,000 to $149,999 income range, which is the most common income bracket and makes up 19.0% of all families. Conversely, the $10,000 to $14,999 income bracket is the least frequent group with only 759 families (4.0%) belonging to this category.
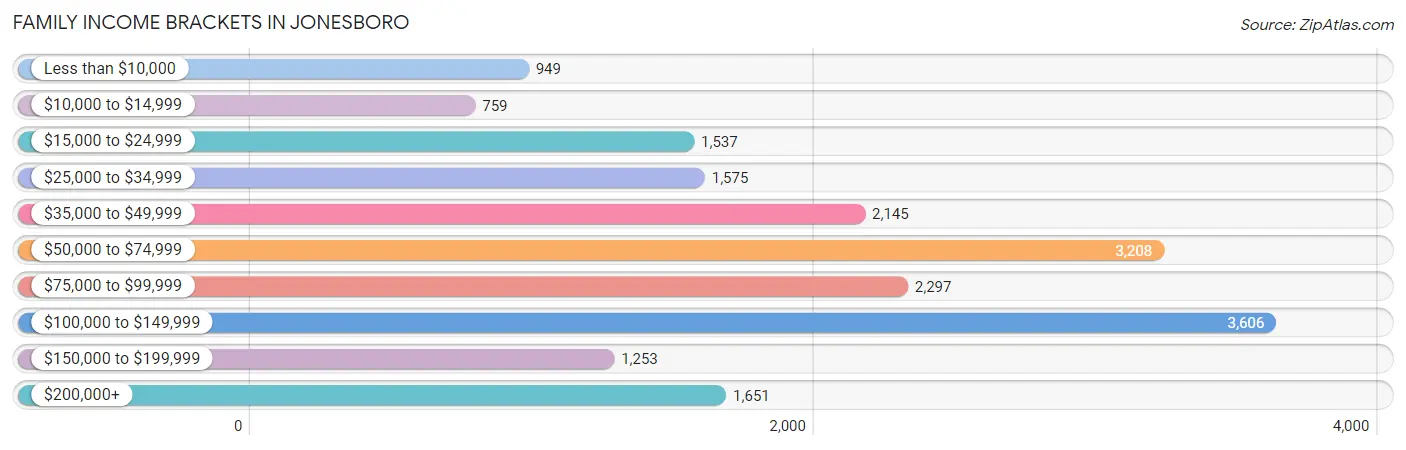
| Income Bracket | # Families | % Families |
| Less than $10,000 | 949 | 5.0% |
| $10,000 to $14,999 | 759 | 4.0% |
| $15,000 to $24,999 | 1,537 | 8.1% |
| $25,000 to $34,999 | 1,575 | 8.3% |
| $35,000 to $49,999 | 2,145 | 11.3% |
| $50,000 to $74,999 | 3,208 | 16.9% |
| $75,000 to $99,999 | 2,297 | 12.1% |
| $100,000 to $149,999 | 3,606 | 19.0% |
| $150,000 to $199,999 | 1,253 | 6.6% |
| $200,000+ | 1,651 | 8.7% |
Family Income by Famaliy Size in Jonesboro
4-person families (3,839 | 20.2%) account for the highest median family income in Jonesboro with $90,121 per family, while 2-person families (8,687 | 45.8%) have the highest median income of $31,382 per family member.
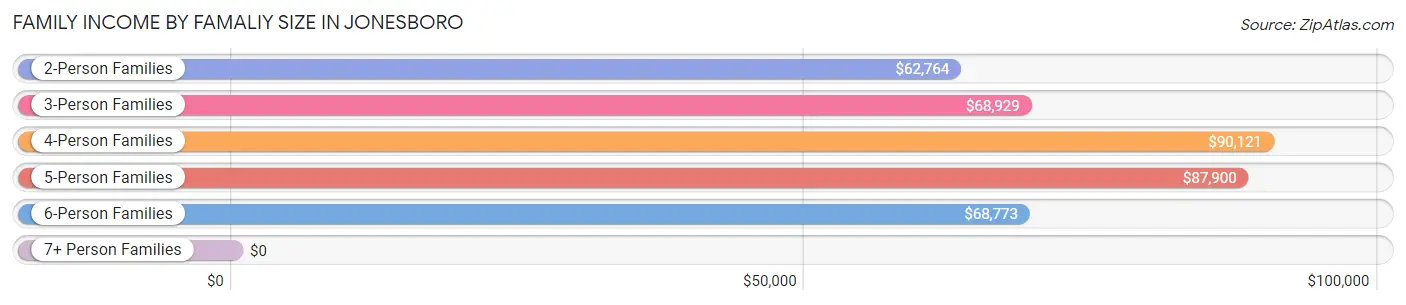
| Income Bracket | # Families | Median Income |
| 2-Person Families | 8,687 (45.8%) | $62,764 |
| 3-Person Families | 3,930 (20.7%) | $68,929 |
| 4-Person Families | 3,839 (20.2%) | $90,121 |
| 5-Person Families | 1,550 (8.2%) | $87,900 |
| 6-Person Families | 655 (3.5%) | $68,773 |
| 7+ Person Families | 320 (1.7%) | $0 |
| Total | 18,981 (100.0%) | $68,698 |
Family Income by Number of Earners in Jonesboro
The median family income in Jonesboro is $68,698, with families comprising 3+ earners (1,846) having the highest median family income of $118,500, while families with no earners (3,097) have the lowest median family income of $37,080, accounting for 9.7% and 16.3% of families, respectively.
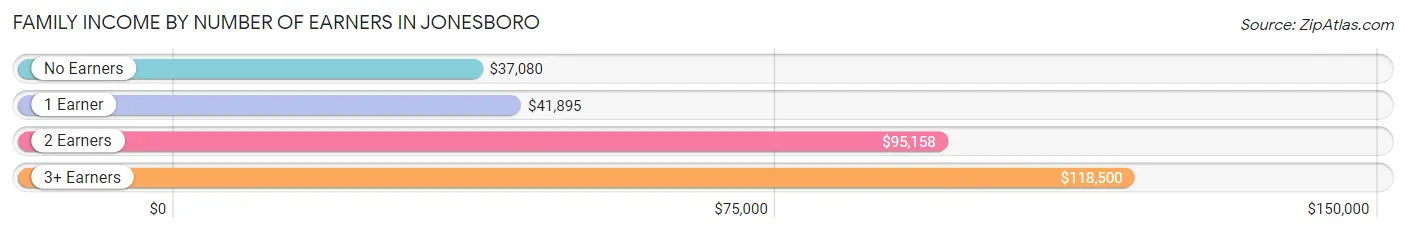
| Number of Earners | # Families | Median Income |
| No Earners | 3,097 (16.3%) | $37,080 |
| 1 Earner | 6,279 (33.1%) | $41,895 |
| 2 Earners | 7,759 (40.9%) | $95,158 |
| 3+ Earners | 1,846 (9.7%) | $118,500 |
| Total | 18,981 (100.0%) | $68,698 |
Household Income in Jonesboro
Household Income Brackets in Jonesboro
With 4,920 households falling in the category, the $50,000 to $74,999 income range is the most frequent in Jonesboro, accounting for 16.3% of all households. In contrast, only 1,358 households (4.5%) fall into the $150,000 to $199,999 income bracket, making it the least populous group.
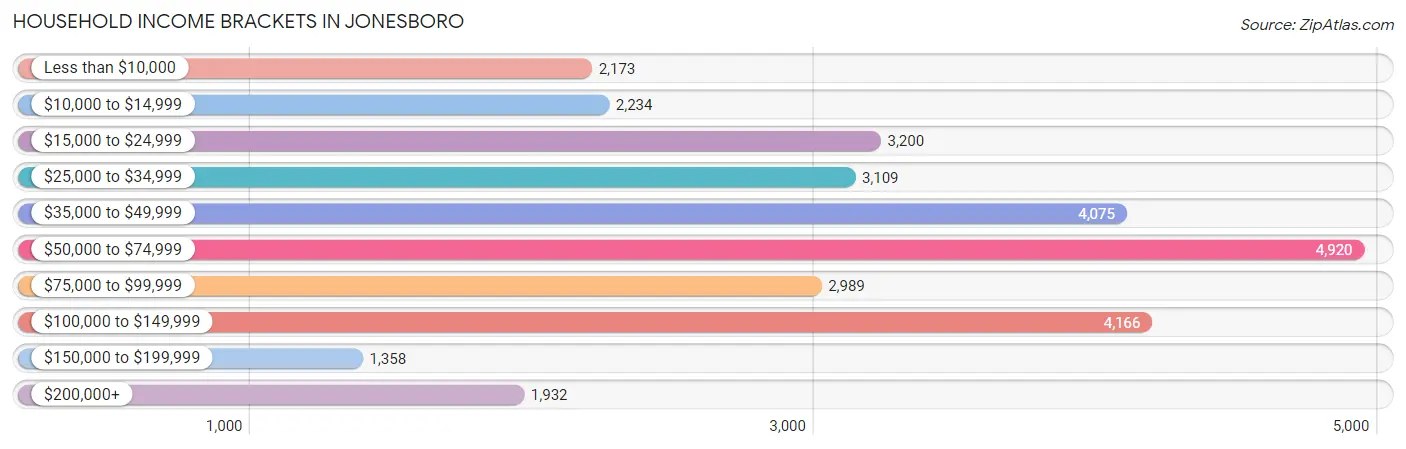
| Income Bracket | # Households | % Households |
| Less than $10,000 | 2,173 | 7.2% |
| $10,000 to $14,999 | 2,234 | 7.4% |
| $15,000 to $24,999 | 3,200 | 10.6% |
| $25,000 to $34,999 | 3,109 | 10.3% |
| $35,000 to $49,999 | 4,075 | 13.5% |
| $50,000 to $74,999 | 4,920 | 16.3% |
| $75,000 to $99,999 | 2,989 | 9.9% |
| $100,000 to $149,999 | 4,166 | 13.8% |
| $150,000 to $199,999 | 1,358 | 4.5% |
| $200,000+ | 1,932 | 6.4% |
Household Income by Householder Age in Jonesboro
The median household income in Jonesboro is $51,124, with the highest median household income of $65,210 found in the 45 to 64 years age bracket for the primary householder. A total of 9,918 households (32.9%) fall into this category. Meanwhile, the 15 to 24 years age bracket for the primary householder has the lowest median household income of $29,420, with 2,177 households (7.2%) in this group.
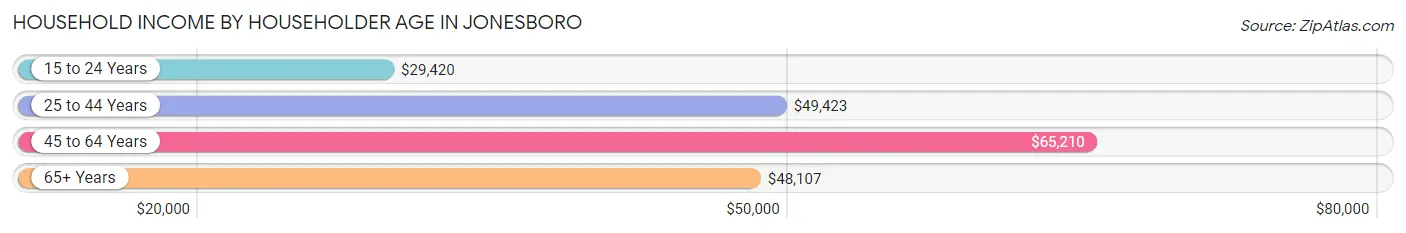
| Income Bracket | # Households | Median Income |
| 15 to 24 Years | 2,177 (7.2%) | $29,420 |
| 25 to 44 Years | 11,505 (38.1%) | $49,423 |
| 45 to 64 Years | 9,918 (32.9%) | $65,210 |
| 65+ Years | 6,587 (21.8%) | $48,107 |
| Total | 30,187 (100.0%) | $51,124 |
Poverty in Jonesboro
Income Below Poverty by Sex and Age in Jonesboro
With 18.7% poverty level for males and 25.7% for females among the residents of Jonesboro, 5 year old males and under 5 year old females are the most vulnerable to poverty, with 194 males (36.6%) and 1,296 females (51.5%) in their respective age groups living below the poverty level.
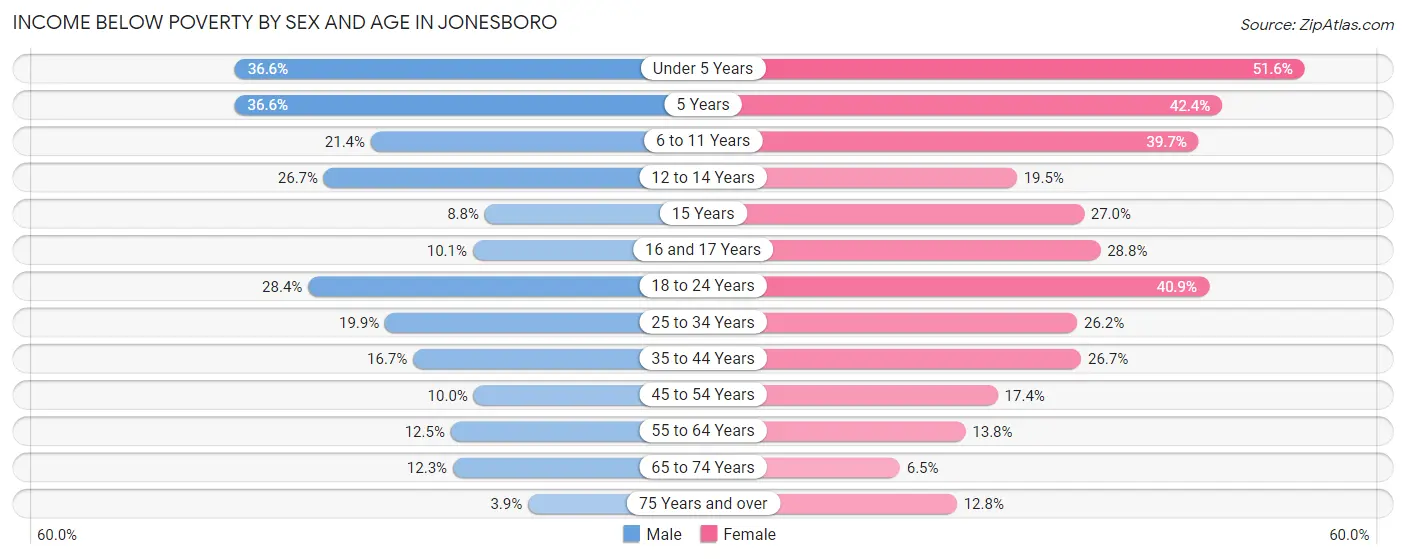
| Age Bracket | Male | Female |
| Under 5 Years | 906 (36.6%) | 1,296 (51.5%) |
| 5 Years | 194 (36.6%) | 213 (42.3%) |
| 6 to 11 Years | 631 (21.4%) | 1,296 (39.7%) |
| 12 to 14 Years | 490 (26.7%) | 293 (19.5%) |
| 15 Years | 45 (8.7%) | 135 (27.0%) |
| 16 and 17 Years | 103 (10.1%) | 278 (28.8%) |
| 18 to 24 Years | 1,196 (28.4%) | 1,711 (40.9%) |
| 25 to 34 Years | 1,051 (19.9%) | 1,531 (26.2%) |
| 35 to 44 Years | 774 (16.7%) | 1,415 (26.7%) |
| 45 to 54 Years | 419 (10.0%) | 772 (17.4%) |
| 55 to 64 Years | 490 (12.5%) | 604 (13.8%) |
| 65 to 74 Years | 331 (12.3%) | 219 (6.5%) |
| 75 Years and over | 59 (3.9%) | 312 (12.8%) |
| Total | 6,689 (18.7%) | 10,075 (25.7%) |
Income Above Poverty by Sex and Age in Jonesboro
According to the poverty statistics in Jonesboro, males aged 75 years and over and females aged 65 to 74 years are the age groups that are most secure financially, with 96.1% of males and 93.5% of females in these age groups living above the poverty line.
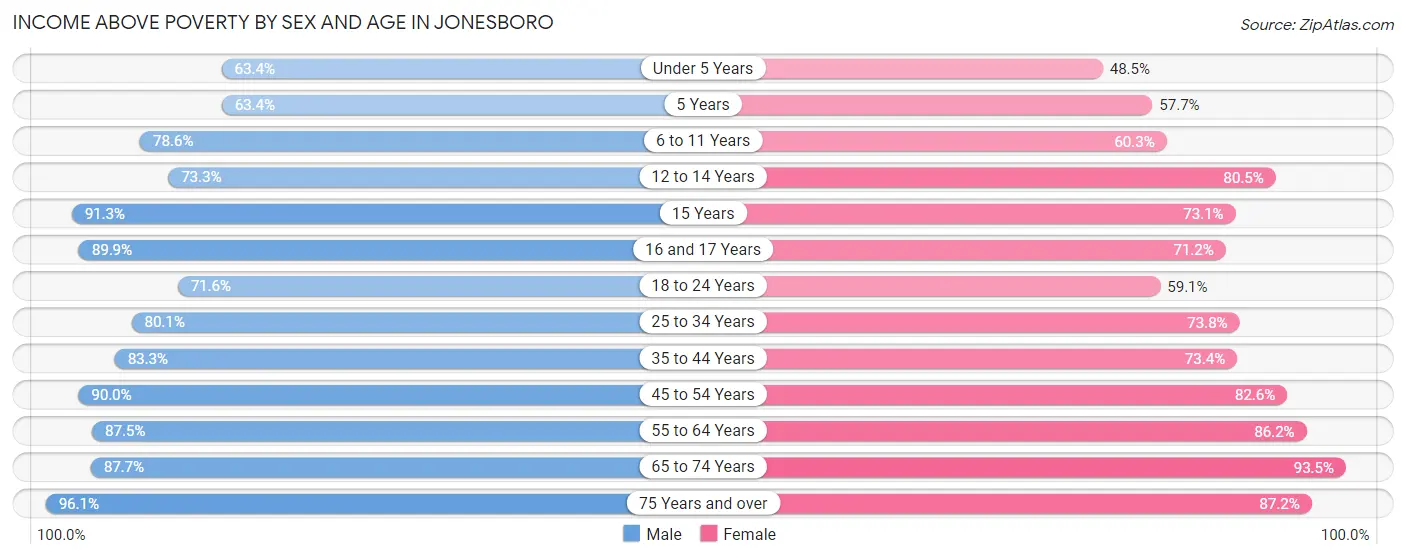
| Age Bracket | Male | Female |
| Under 5 Years | 1,571 (63.4%) | 1,218 (48.4%) |
| 5 Years | 336 (63.4%) | 290 (57.7%) |
| 6 to 11 Years | 2,312 (78.6%) | 1,965 (60.3%) |
| 12 to 14 Years | 1,347 (73.3%) | 1,211 (80.5%) |
| 15 Years | 469 (91.2%) | 366 (73.1%) |
| 16 and 17 Years | 919 (89.9%) | 688 (71.2%) |
| 18 to 24 Years | 3,012 (71.6%) | 2,475 (59.1%) |
| 25 to 34 Years | 4,240 (80.1%) | 4,312 (73.8%) |
| 35 to 44 Years | 3,853 (83.3%) | 3,894 (73.4%) |
| 45 to 54 Years | 3,774 (90.0%) | 3,674 (82.6%) |
| 55 to 64 Years | 3,417 (87.5%) | 3,785 (86.2%) |
| 65 to 74 Years | 2,361 (87.7%) | 3,170 (93.5%) |
| 75 Years and over | 1,443 (96.1%) | 2,126 (87.2%) |
| Total | 29,054 (81.3%) | 29,174 (74.3%) |
Income Below Poverty Among Married-Couple Families in Jonesboro
The poverty statistics for married-couple families in Jonesboro show that 6.7% or 862 of the total 12,866 families live below the poverty line. Families with 5 or more children have the highest poverty rate of 87.0%, comprising of 107 families. On the other hand, families with no children have the lowest poverty rate of 3.5%, which includes 253 families.
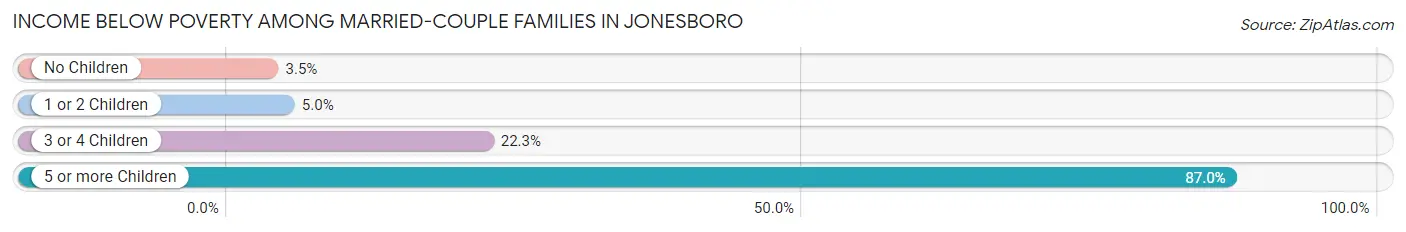
| Children | Above Poverty | Below Poverty |
| No Children | 6,907 (96.5%) | 253 (3.5%) |
| 1 or 2 Children | 4,068 (95.1%) | 212 (5.0%) |
| 3 or 4 Children | 1,013 (77.7%) | 290 (22.3%) |
| 5 or more Children | 16 (13.0%) | 107 (87.0%) |
| Total | 12,004 (93.3%) | 862 (6.7%) |
Income Below Poverty Among Single-Parent Households in Jonesboro
According to the poverty data in Jonesboro, 19.7% or 214 single-father households and 39.3% or 1,975 single-mother households are living below the poverty line. Among single-father households, those with 5 or more children have the highest poverty rate, with 23 households (100.0%) experiencing poverty. Likewise, among single-mother households, those with 5 or more children have the highest poverty rate, with 99 households (76.7%) falling below the poverty line.
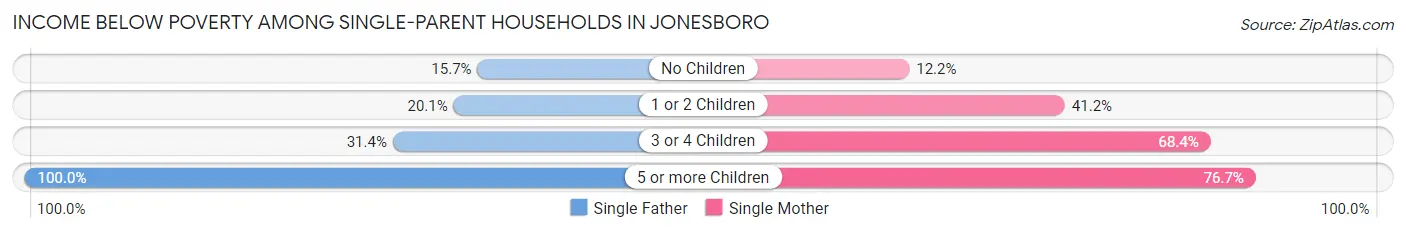
| Children | Single Father | Single Mother |
| No Children | 96 (15.7%) | 178 (12.2%) |
| 1 or 2 Children | 84 (20.1%) | 994 (41.2%) |
| 3 or 4 Children | 11 (31.4%) | 704 (68.3%) |
| 5 or more Children | 23 (100.0%) | 99 (76.7%) |
| Total | 214 (19.7%) | 1,975 (39.3%) |
Income Below Poverty Among Married-Couple vs Single-Parent Households in Jonesboro
The poverty data for Jonesboro shows that 862 of the married-couple family households (6.7%) and 2,189 of the single-parent households (35.8%) are living below the poverty level. Within the married-couple family households, those with 5 or more children have the highest poverty rate, with 107 households (87.0%) falling below the poverty line. Among the single-parent households, those with 5 or more children have the highest poverty rate, with 122 household (80.3%) living below poverty.
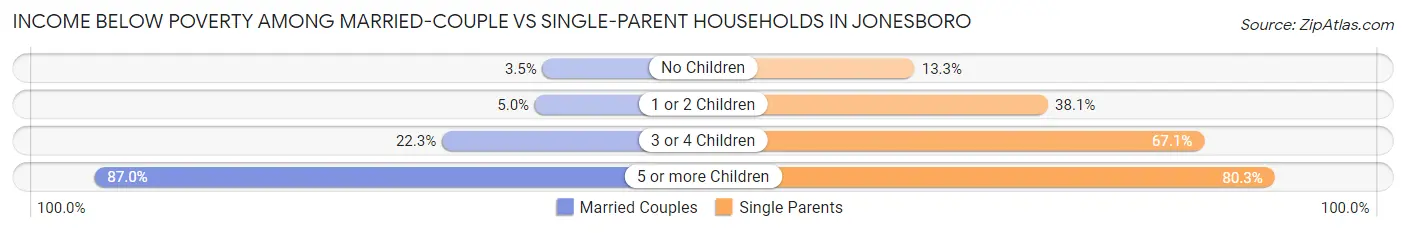
| Children | Married-Couple Families | Single-Parent Households |
| No Children | 253 (3.5%) | 274 (13.3%) |
| 1 or 2 Children | 212 (5.0%) | 1,078 (38.1%) |
| 3 or 4 Children | 290 (22.3%) | 715 (67.1%) |
| 5 or more Children | 107 (87.0%) | 122 (80.3%) |
| Total | 862 (6.7%) | 2,189 (35.8%) |
Race in Jonesboro
The most populous races in Jonesboro are White / Caucasian (53,845 | 68.7%), Black / African American (17,071 | 21.8%), and Hispanic or Latino (5,299 | 6.8%).
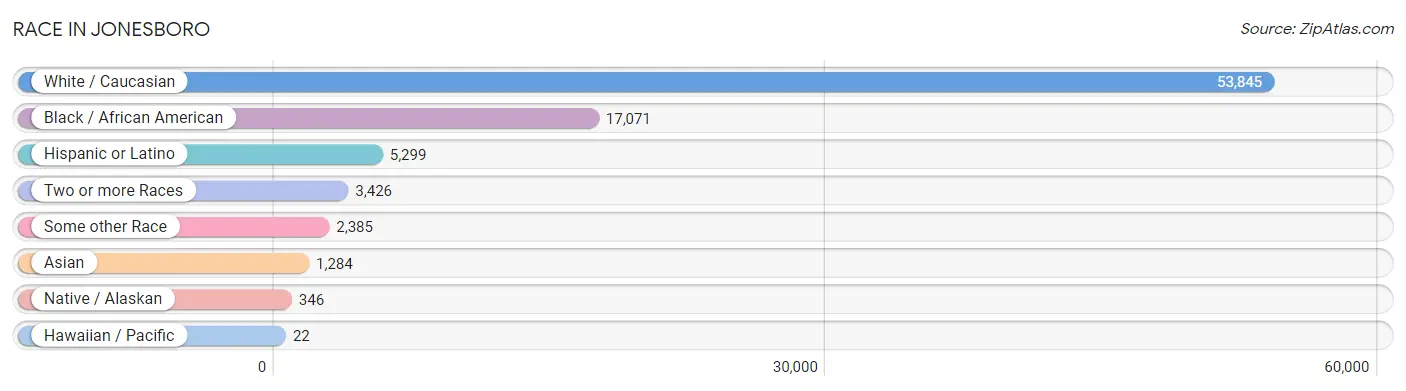
| Race | # Population | % Population |
| Asian | 1,284 | 1.6% |
| Black / African American | 17,071 | 21.8% |
| Hawaiian / Pacific | 22 | 0.0% |
| Hispanic or Latino | 5,299 | 6.8% |
| Native / Alaskan | 346 | 0.4% |
| White / Caucasian | 53,845 | 68.7% |
| Two or more Races | 3,426 | 4.4% |
| Some other Race | 2,385 | 3.0% |
| Total | 78,379 | 100.0% |
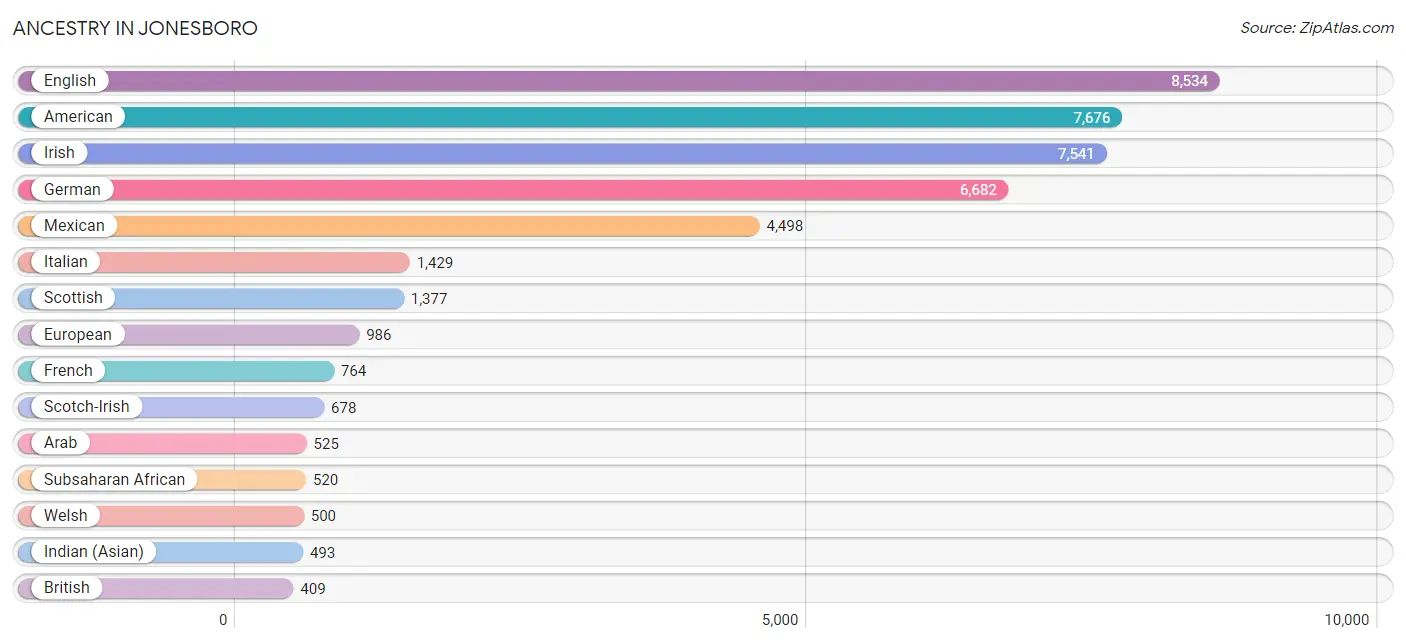
Ancestry in Jonesboro
The most populous ancestries reported in Jonesboro are English (8,534 | 10.9%), American (7,676 | 9.8%), Irish (7,541 | 9.6%), German (6,682 | 8.5%), and Mexican (4,498 | 5.7%), together accounting for 44.6% of all Jonesboro residents.
| Ancestry | # Population | % Population |
| African | 370 | 0.5% |
| Alaska Native | 10 | 0.0% |
| Alaskan Athabascan | 28 | 0.0% |
| Albanian | 21 | 0.0% |
| American | 7,676 | 9.8% |
| Apache | 27 | 0.0% |
| Arab | 525 | 0.7% |
| Austrian | 82 | 0.1% |
| Basque | 15 | 0.0% |
| Bhutanese | 45 | 0.1% |
| Blackfeet | 65 | 0.1% |
| British | 409 | 0.5% |
| British West Indian | 26 | 0.0% |
| Bulgarian | 7 | 0.0% |
| Burmese | 95 | 0.1% |
| Canadian | 23 | 0.0% |
| Central American | 203 | 0.3% |
| Central American Indian | 25 | 0.0% |
| Cherokee | 339 | 0.4% |
| Chickasaw | 6 | 0.0% |
| Choctaw | 58 | 0.1% |
| Creek | 6 | 0.0% |
| Croatian | 70 | 0.1% |
| Crow | 21 | 0.0% |
| Czech | 98 | 0.1% |
| Dutch | 355 | 0.4% |
| Eastern European | 129 | 0.2% |
| English | 8,534 | 10.9% |
| European | 986 | 1.3% |
| Fijian | 22 | 0.0% |
| French | 764 | 1.0% |
| French Canadian | 60 | 0.1% |
| German | 6,682 | 8.5% |
| Greek | 29 | 0.0% |
| Guatemalan | 91 | 0.1% |
| Honduran | 22 | 0.0% |
| Hungarian | 33 | 0.0% |
| Indian (Asian) | 493 | 0.6% |
| Iranian | 6 | 0.0% |
| Irish | 7,541 | 9.6% |
| Italian | 1,429 | 1.8% |
| Korean | 248 | 0.3% |
| Lebanese | 18 | 0.0% |
| Lithuanian | 10 | 0.0% |
| Malaysian | 156 | 0.2% |
| Mexican | 4,498 | 5.7% |
| Moroccan | 36 | 0.1% |
| Navajo | 2 | 0.0% |
| Nicaraguan | 24 | 0.0% |
| Nigerian | 117 | 0.2% |
| Northern European | 79 | 0.1% |
| Norwegian | 134 | 0.2% |
| Osage | 24 | 0.0% |
| Palestinian | 101 | 0.1% |
| Peruvian | 7 | 0.0% |
| Polish | 398 | 0.5% |
| Portuguese | 41 | 0.1% |
| Potawatomi | 8 | 0.0% |
| Puerto Rican | 240 | 0.3% |
| Russian | 71 | 0.1% |
| Salvadoran | 66 | 0.1% |
| Scandinavian | 105 | 0.1% |
| Scotch-Irish | 678 | 0.9% |
| Scottish | 1,377 | 1.8% |
| Sioux | 10 | 0.0% |
| Slovak | 19 | 0.0% |
| South African | 1 | 0.0% |
| South American | 14 | 0.0% |
| Spaniard | 154 | 0.2% |
| Spanish | 96 | 0.1% |
| Sri Lankan | 293 | 0.4% |
| Subsaharan African | 520 | 0.7% |
| Swedish | 184 | 0.2% |
| Swiss | 37 | 0.1% |
| Syrian | 38 | 0.1% |
| Thai | 139 | 0.2% |
| Venezuelan | 7 | 0.0% |
| Vietnamese | 17 | 0.0% |
| Welsh | 500 | 0.6% | View All 79 Rows |
Immigrants in Jonesboro
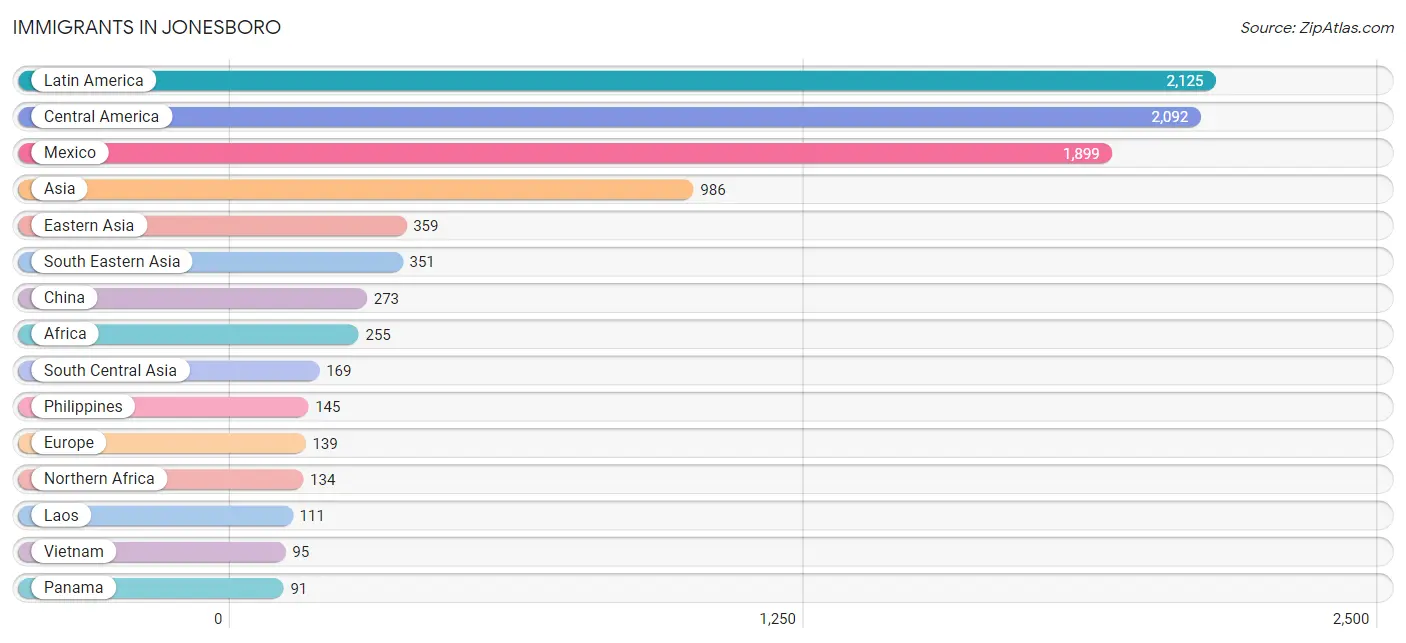
The most numerous immigrant groups reported in Jonesboro came from Latin America (2,125 | 2.7%), Central America (2,092 | 2.7%), Mexico (1,899 | 2.4%), Asia (986 | 1.3%), and Eastern Asia (359 | 0.5%), together accounting for 9.5% of all Jonesboro residents.
| Immigration Origin | # Population | % Population |
| Africa | 255 | 0.3% |
| Asia | 986 | 1.3% |
| Bangladesh | 49 | 0.1% |
| Canada | 30 | 0.0% |
| Caribbean | 26 | 0.0% |
| Central America | 2,092 | 2.7% |
| China | 273 | 0.4% |
| Eastern Asia | 359 | 0.5% |
| Eastern Europe | 66 | 0.1% |
| El Salvador | 20 | 0.0% |
| England | 24 | 0.0% |
| Europe | 139 | 0.2% |
| France | 6 | 0.0% |
| Germany | 9 | 0.0% |
| Guatemala | 60 | 0.1% |
| Honduras | 22 | 0.0% |
| India | 47 | 0.1% |
| Japan | 16 | 0.0% |
| Korea | 70 | 0.1% |
| Laos | 111 | 0.1% |
| Latin America | 2,125 | 2.7% |
| Lebanon | 38 | 0.1% |
| Mexico | 1,899 | 2.4% |
| Northern Africa | 134 | 0.2% |
| Northern Europe | 58 | 0.1% |
| Oceania | 55 | 0.1% |
| Pakistan | 66 | 0.1% |
| Panama | 91 | 0.1% |
| Peru | 7 | 0.0% |
| Philippines | 145 | 0.2% |
| Russia | 59 | 0.1% |
| Saudi Arabia | 15 | 0.0% |
| South Africa | 43 | 0.1% |
| South America | 7 | 0.0% |
| South Central Asia | 169 | 0.2% |
| South Eastern Asia | 351 | 0.4% |
| Sweden | 10 | 0.0% |
| Ukraine | 7 | 0.0% |
| Vietnam | 95 | 0.1% |
| Western Africa | 32 | 0.0% |
| Western Asia | 86 | 0.1% |
| Western Europe | 15 | 0.0% |
| Yemen | 33 | 0.0% | View All 43 Rows |
Sex and Age in Jonesboro
Sex and Age in Jonesboro
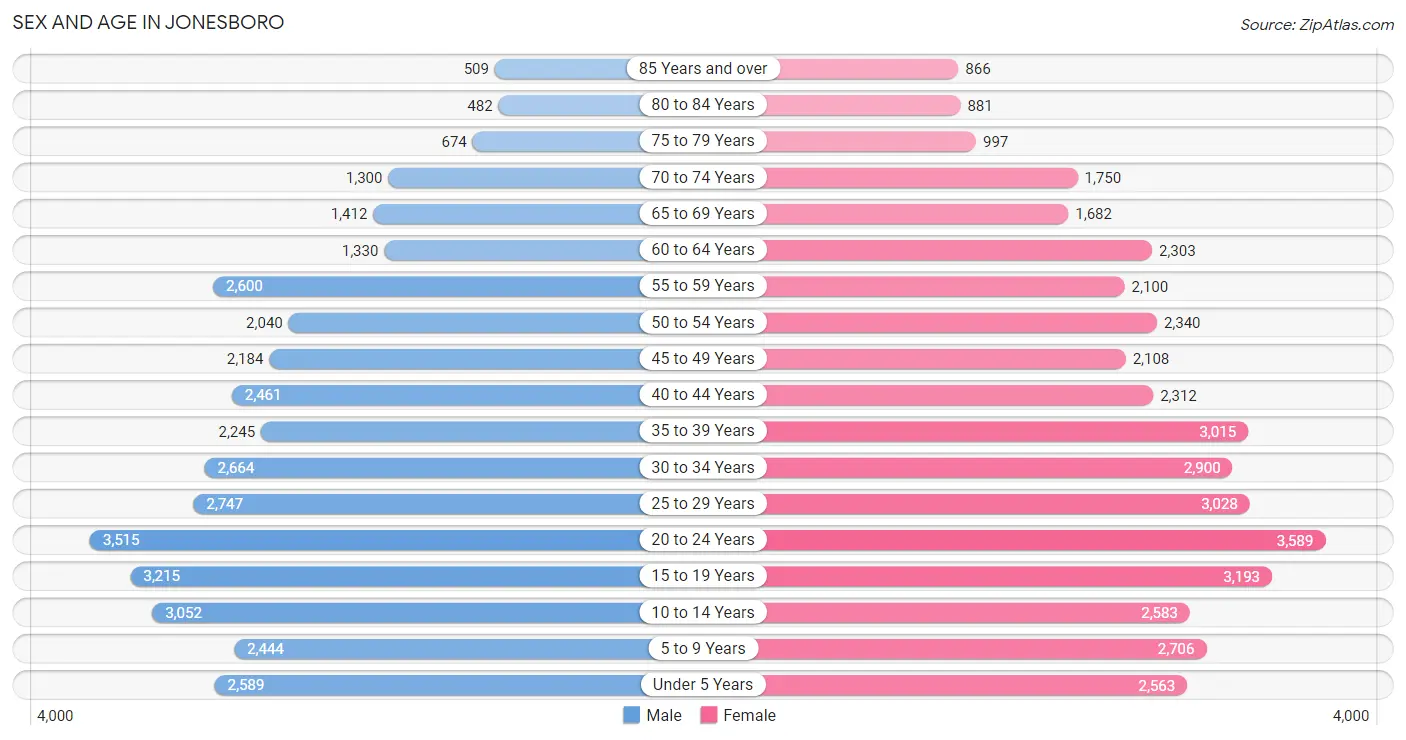
The most populous age groups in Jonesboro are 20 to 24 Years (3,515 | 9.4%) for men and 20 to 24 Years (3,589 | 8.8%) for women.
| Age Bracket | Male | Female |
| Under 5 Years | 2,589 (6.9%) | 2,563 (6.3%) |
| 5 to 9 Years | 2,444 (6.5%) | 2,706 (6.6%) |
| 10 to 14 Years | 3,052 (8.2%) | 2,583 (6.3%) |
| 15 to 19 Years | 3,215 (8.6%) | 3,193 (7.8%) |
| 20 to 24 Years | 3,515 (9.4%) | 3,589 (8.8%) |
| 25 to 29 Years | 2,747 (7.3%) | 3,028 (7.4%) |
| 30 to 34 Years | 2,664 (7.1%) | 2,900 (7.1%) |
| 35 to 39 Years | 2,245 (6.0%) | 3,015 (7.4%) |
| 40 to 44 Years | 2,461 (6.6%) | 2,312 (5.7%) |
| 45 to 49 Years | 2,184 (5.8%) | 2,108 (5.1%) |
| 50 to 54 Years | 2,040 (5.4%) | 2,340 (5.7%) |
| 55 to 59 Years | 2,600 (6.9%) | 2,100 (5.1%) |
| 60 to 64 Years | 1,330 (3.5%) | 2,303 (5.6%) |
| 65 to 69 Years | 1,412 (3.8%) | 1,682 (4.1%) |
| 70 to 74 Years | 1,300 (3.5%) | 1,750 (4.3%) |
| 75 to 79 Years | 674 (1.8%) | 997 (2.4%) |
| 80 to 84 Years | 482 (1.3%) | 881 (2.1%) |
| 85 Years and over | 509 (1.4%) | 866 (2.1%) |
| Total | 37,463 (100.0%) | 40,916 (100.0%) |
Families and Households in Jonesboro
Median Family Size in Jonesboro
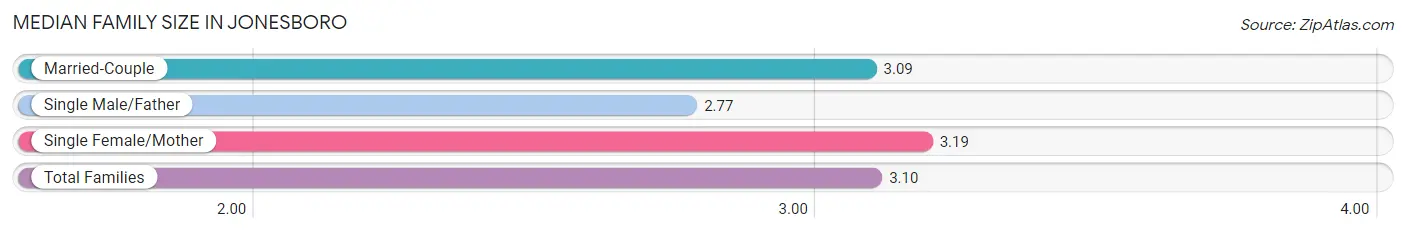
The median family size in Jonesboro is 3.10 persons per family, with single female/mother families (5,026 | 26.5%) accounting for the largest median family size of 3.19 persons per family. On the other hand, single male/father families (1,089 | 5.7%) represent the smallest median family size with 2.77 persons per family.
| Family Type | # Families | Family Size |
| Married-Couple | 12,866 (67.8%) | 3.09 |
| Single Male/Father | 1,089 (5.7%) | 2.77 |
| Single Female/Mother | 5,026 (26.5%) | 3.19 |
| Total Families | 18,981 (100.0%) | 3.10 |
Median Household Size in Jonesboro
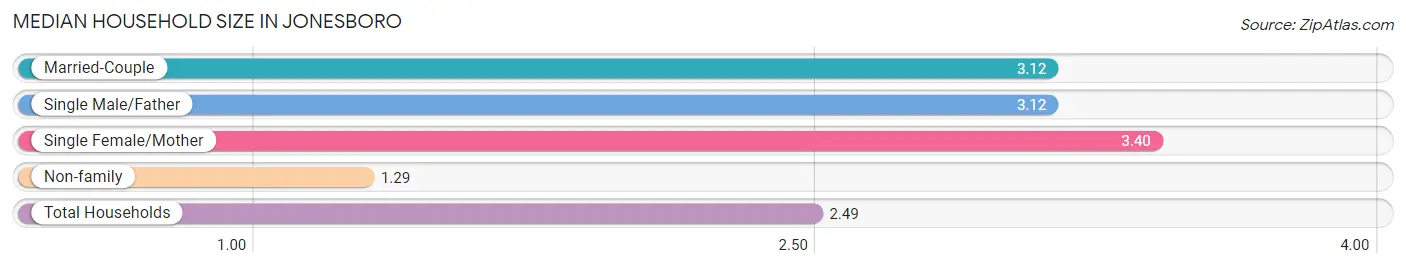
The median household size in Jonesboro is 2.49 persons per household, with single female/mother households (5,026 | 16.7%) accounting for the largest median household size of 3.4 persons per household. non-family households (11,206 | 37.1%) represent the smallest median household size with 1.29 persons per household.
| Household Type | # Households | Household Size |
| Married-Couple | 12,866 (42.6%) | 3.12 |
| Single Male/Father | 1,089 (3.6%) | 3.12 |
| Single Female/Mother | 5,026 (16.7%) | 3.40 |
| Non-family | 11,206 (37.1%) | 1.29 |
| Total Households | 30,187 (100.0%) | 2.49 |
Household Size by Marriage Status in Jonesboro
Out of a total of 30,187 households in Jonesboro, 18,981 (62.9%) are family households, while 11,206 (37.1%) are nonfamily households. The most numerous type of family households are 2-person households, comprising 8,177, and the most common type of nonfamily households are 1-person households, comprising 8,890.
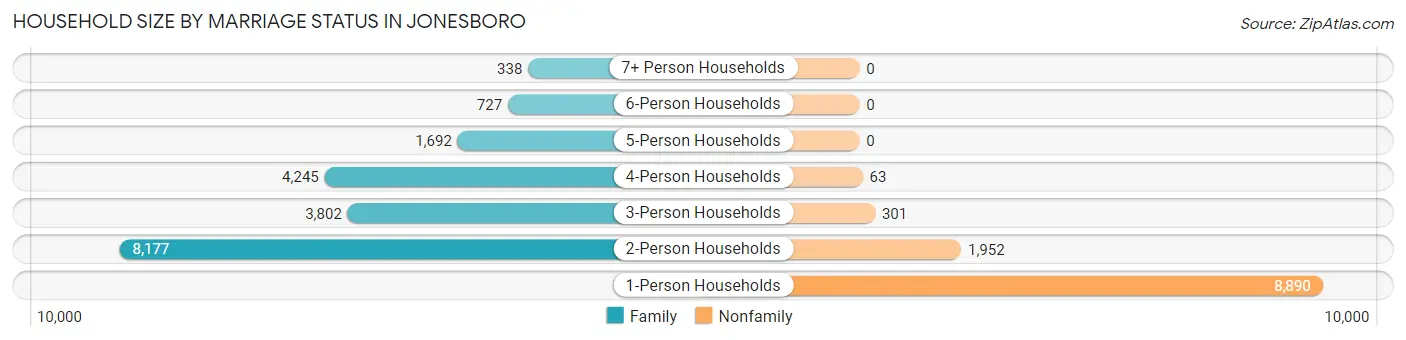
| Household Size | Family Households | Nonfamily Households |
| 1-Person Households | - | 8,890 (29.4%) |
| 2-Person Households | 8,177 (27.1%) | 1,952 (6.5%) |
| 3-Person Households | 3,802 (12.6%) | 301 (1.0%) |
| 4-Person Households | 4,245 (14.1%) | 63 (0.2%) |
| 5-Person Households | 1,692 (5.6%) | 0 (0.0%) |
| 6-Person Households | 727 (2.4%) | 0 (0.0%) |
| 7+ Person Households | 338 (1.1%) | 0 (0.0%) |
| Total | 18,981 (62.9%) | 11,206 (37.1%) |
Female Fertility in Jonesboro
Fertility by Age in Jonesboro
Average fertility rate in Jonesboro is 36.0 births per 1,000 women. Women in the age bracket of 20 to 34 years have the highest fertility rate with 67.0 births per 1,000 women. Women in the age bracket of 20 to 34 years acount for 85.0% of all women with births.
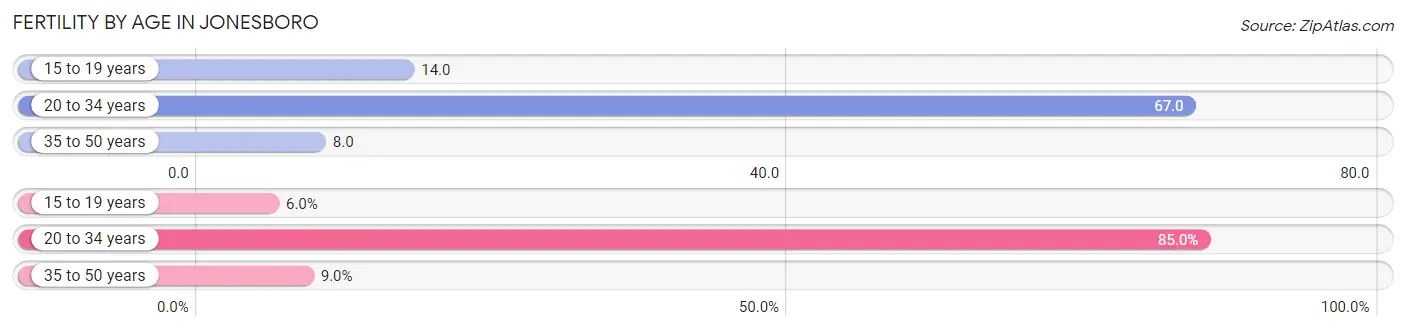
| Age Bracket | Women with Births | Births / 1,000 Women |
| 15 to 19 years | 45 (6.0%) | 14.0 |
| 20 to 34 years | 635 (85.0%) | 67.0 |
| 35 to 50 years | 67 (9.0%) | 8.0 |
| Total | 747 (100.0%) | 36.0 |
Fertility by Age by Marriage Status in Jonesboro
42.4% of women with births (747) in Jonesboro are married. The highest percentage of unmarried women with births falls into 15 to 19 years age bracket with 75.6% of them unmarried at the time of birth, while the lowest percentage of unmarried women with births belong to 35 to 50 years age bracket with 0.0% of them unmarried.
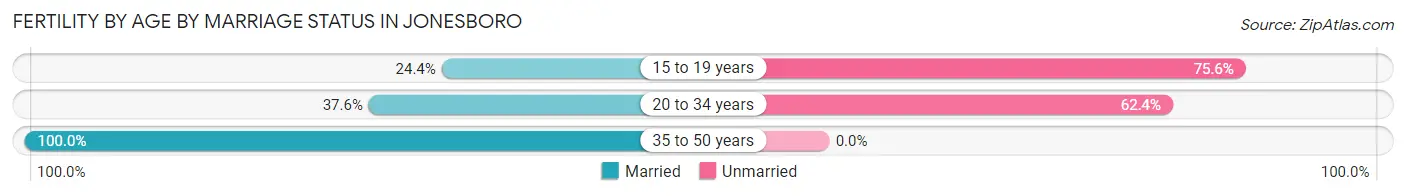
| Age Bracket | Married | Unmarried |
| 15 to 19 years | 11 (24.4%) | 34 (75.6%) |
| 20 to 34 years | 239 (37.6%) | 396 (62.4%) |
| 35 to 50 years | 67 (100.0%) | 0 (0.0%) |
| Total | 317 (42.4%) | 430 (57.6%) |
Fertility by Education in Jonesboro
Average fertility rate in Jonesboro is 36.0 births per 1,000 women. Women with the education attainment of high school diploma have the highest fertility rate of 70.0 births per 1,000 women, while women with the education attainment of graduate degree have the lowest fertility at 16.0 births per 1,000 women. Women with the education attainment of high school diploma represent 43.2% of all women with births.
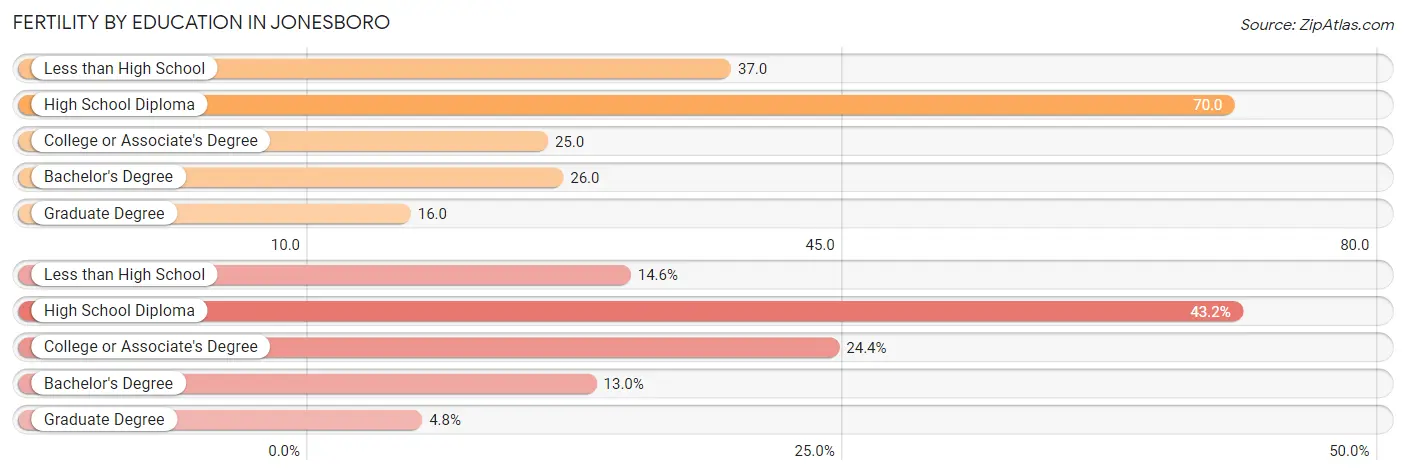
| Educational Attainment | Women with Births | Births / 1,000 Women |
| Less than High School | 109 (14.6%) | 37.0 |
| High School Diploma | 323 (43.2%) | 70.0 |
| College or Associate's Degree | 182 (24.4%) | 25.0 |
| Bachelor's Degree | 97 (13.0%) | 26.0 |
| Graduate Degree | 36 (4.8%) | 16.0 |
| Total | 747 (100.0%) | 36.0 |
Fertility by Education by Marriage Status in Jonesboro
57.6% of women with births in Jonesboro are unmarried. Women with the educational attainment of bachelor's degree are most likely to be married with 100.0% of them married at childbirth, while women with the educational attainment of less than high school are least likely to be married with 82.6% of them unmarried at childbirth.
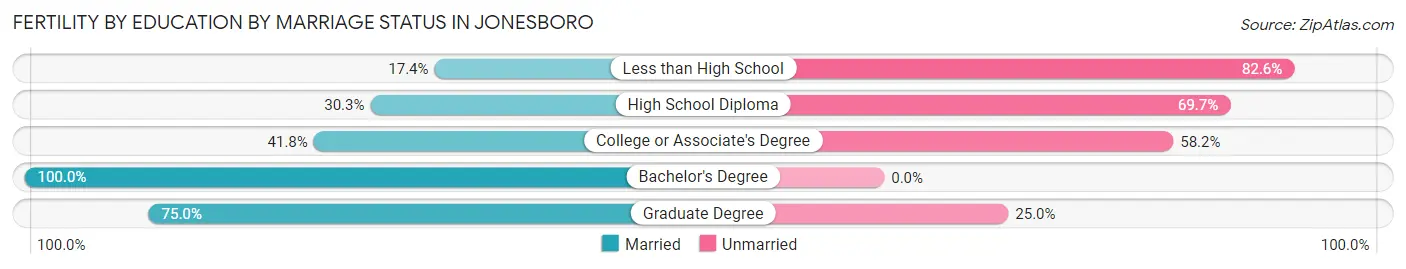
| Educational Attainment | Married | Unmarried |
| Less than High School | 19 (17.4%) | 90 (82.6%) |
| High School Diploma | 98 (30.3%) | 225 (69.7%) |
| College or Associate's Degree | 76 (41.8%) | 106 (58.2%) |
| Bachelor's Degree | 97 (100.0%) | 0 (0.0%) |
| Graduate Degree | 27 (75.0%) | 9 (25.0%) |
| Total | 317 (42.4%) | 430 (57.6%) |
Employment Characteristics in Jonesboro
Employment by Class of Employer in Jonesboro
Among the 34,960 employed individuals in Jonesboro, private company employees (21,934 | 62.7%), not-for-profit organizations (3,562 | 10.2%), and state government employees (2,515 | 7.2%) make up the most common classes of employment.
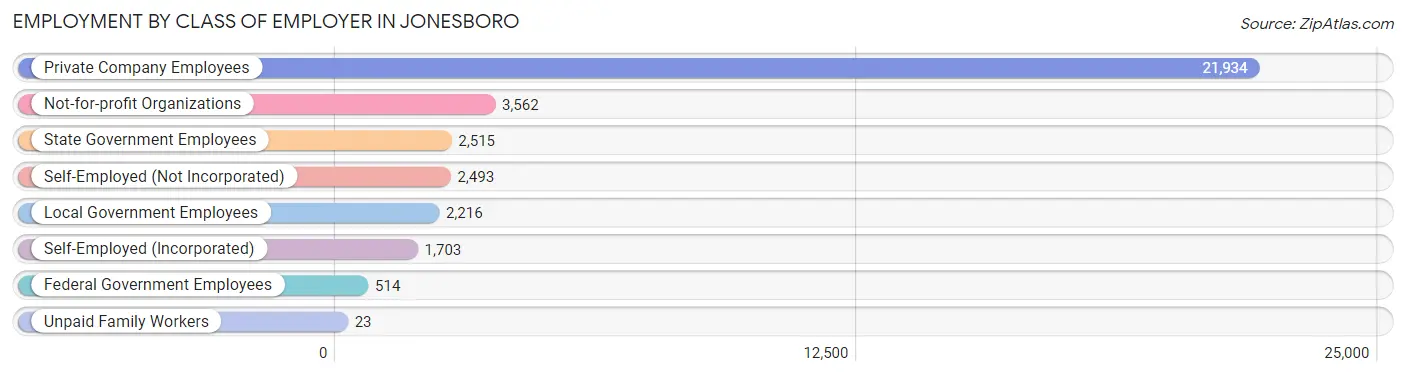
| Employer Class | # Employees | % Employees |
| Private Company Employees | 21,934 | 62.7% |
| Self-Employed (Incorporated) | 1,703 | 4.9% |
| Self-Employed (Not Incorporated) | 2,493 | 7.1% |
| Not-for-profit Organizations | 3,562 | 10.2% |
| Local Government Employees | 2,216 | 6.3% |
| State Government Employees | 2,515 | 7.2% |
| Federal Government Employees | 514 | 1.5% |
| Unpaid Family Workers | 23 | 0.1% |
| Total | 34,960 | 100.0% |
Employment Status by Age in Jonesboro
According to the labor force statistics for Jonesboro, out of the total population over 16 years of age (61,426), 63.0% or 38,698 individuals are in the labor force, with 6.7% or 2,593 of them unemployed. The age group with the highest labor force participation rate is 30 to 34 years, with 82.5% or 4,590 individuals in the labor force. Within the labor force, the 16 to 19 years age range has the highest percentage of unemployed individuals, with 21.5% or 479 of them being unemployed.
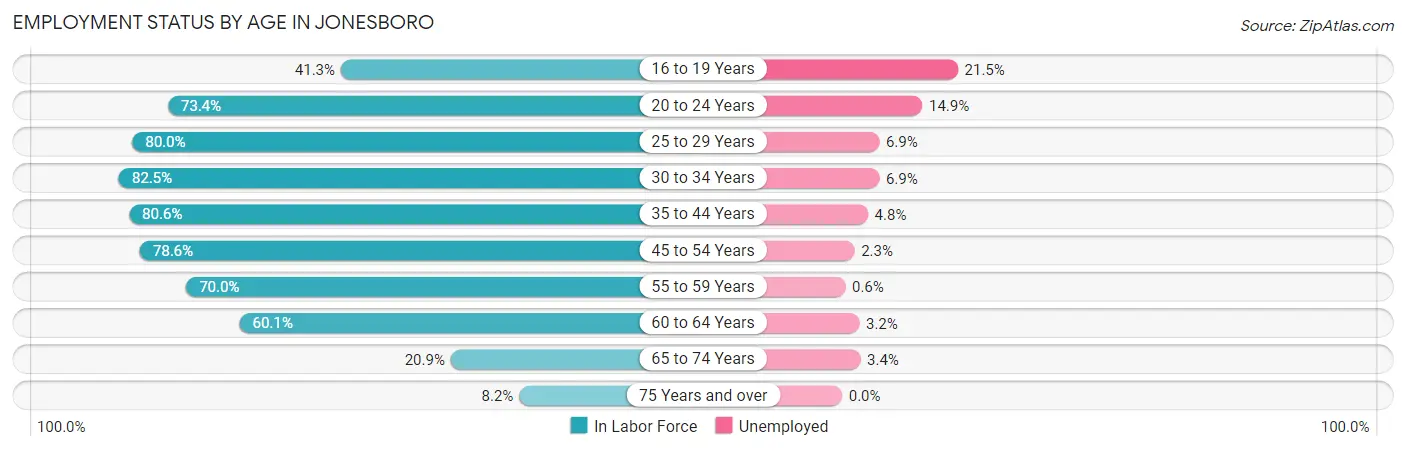
| Age Bracket | In Labor Force | Unemployed |
| 16 to 19 Years | 2,227 (41.3%) | 479 (21.5%) |
| 20 to 24 Years | 5,214 (73.4%) | 777 (14.9%) |
| 25 to 29 Years | 4,620 (80.0%) | 319 (6.9%) |
| 30 to 34 Years | 4,590 (82.5%) | 317 (6.9%) |
| 35 to 44 Years | 8,087 (80.6%) | 388 (4.8%) |
| 45 to 54 Years | 6,816 (78.6%) | 157 (2.3%) |
| 55 to 59 Years | 3,290 (70.0%) | 20 (0.6%) |
| 60 to 64 Years | 2,183 (60.1%) | 70 (3.2%) |
| 65 to 74 Years | 1,284 (20.9%) | 44 (3.4%) |
| 75 Years and over | 362 (8.2%) | 0 (0.0%) |
| Total | 38,698 (63.0%) | 2,593 (6.7%) |
Employment Status by Educational Attainment in Jonesboro
According to labor force statistics for Jonesboro, 77.1% of individuals (29,589) out of the total population between 25 and 64 years of age (38,377) are in the labor force, with 4.3% or 1,272 of them being unemployed. The group with the highest labor force participation rate are those with the educational attainment of bachelor's degree or higher, with 87.9% or 10,708 individuals in the labor force. Within the labor force, individuals with high school diploma education have the highest percentage of unemployment, with 7.1% or 552 of them being unemployed.
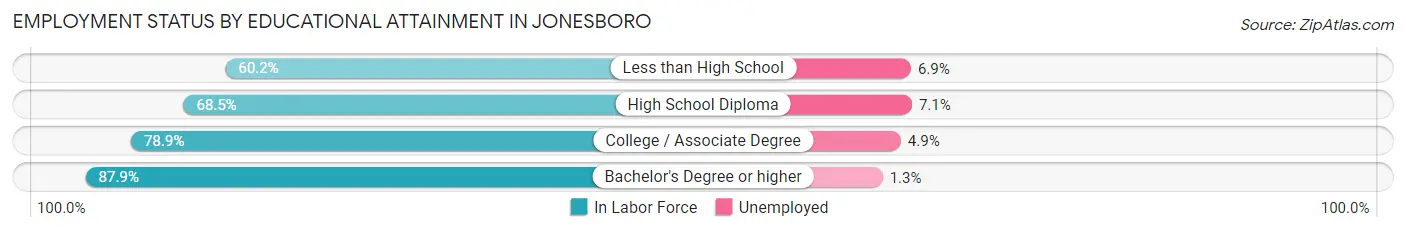
| Educational Attainment | In Labor Force | Unemployed |
| Less than High School | 1,949 (60.2%) | 223 (6.9%) |
| High School Diploma | 7,771 (68.5%) | 805 (7.1%) |
| College / Associate Degree | 9,162 (78.9%) | 569 (4.9%) |
| Bachelor's Degree or higher | 10,708 (87.9%) | 158 (1.3%) |
| Total | 29,589 (77.1%) | 1,650 (4.3%) |
Employment Occupations by Sex in Jonesboro
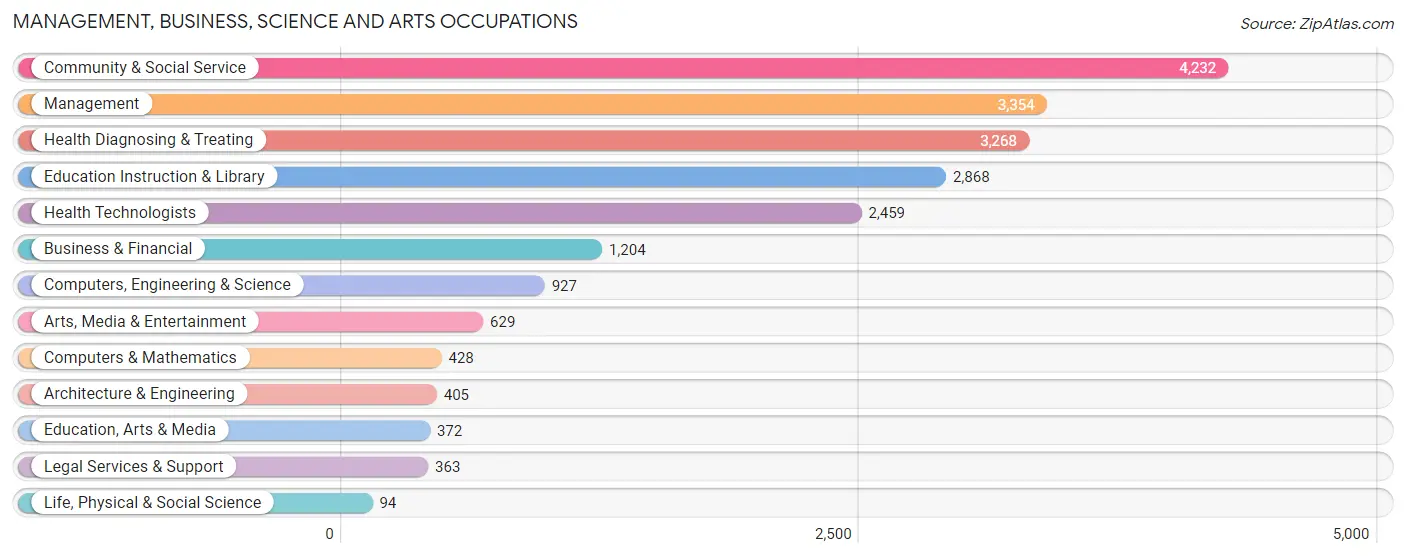
Management, Business, Science and Arts Occupations
The most common Management, Business, Science and Arts occupations in Jonesboro are Community & Social Service (4,232 | 11.8%), Management (3,354 | 9.3%), Health Diagnosing & Treating (3,268 | 9.1%), Education Instruction & Library (2,868 | 8.0%), and Health Technologists (2,459 | 6.8%).
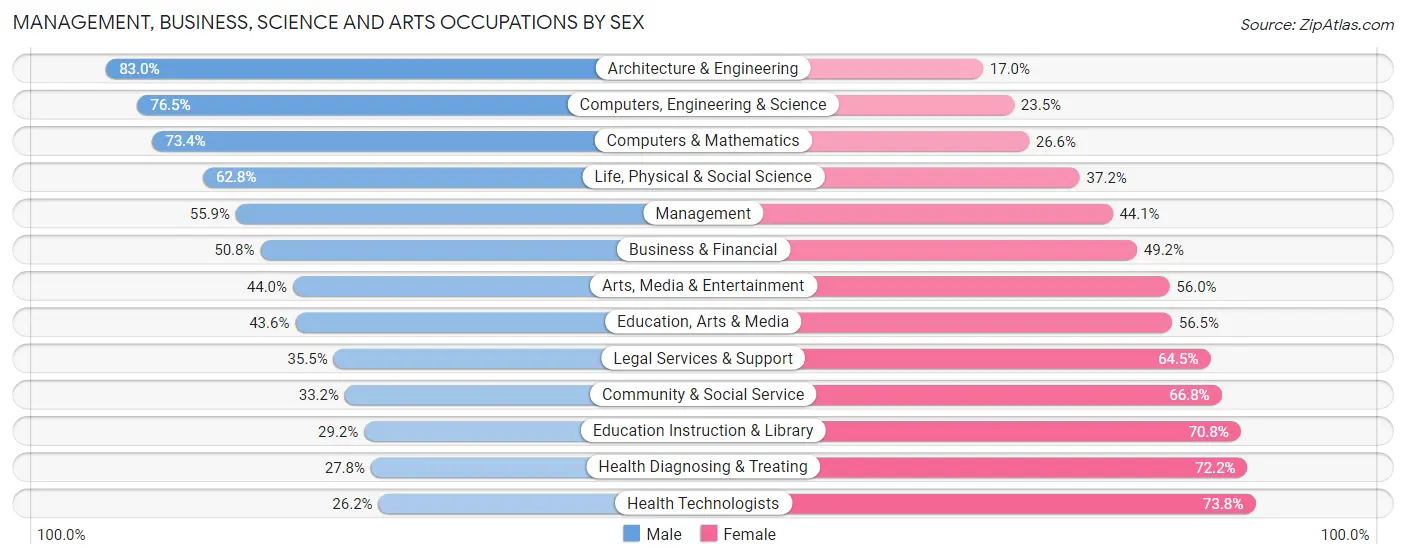
Management, Business, Science and Arts Occupations by Sex
Within the Management, Business, Science and Arts occupations in Jonesboro, the most male-oriented occupations are Architecture & Engineering (83.0%), Computers, Engineering & Science (76.5%), and Computers & Mathematics (73.4%), while the most female-oriented occupations are Health Technologists (73.8%), Health Diagnosing & Treating (72.2%), and Education Instruction & Library (70.8%).
| Occupation | Male | Female |
| Management | 1,876 (55.9%) | 1,478 (44.1%) |
| Business & Financial | 612 (50.8%) | 592 (49.2%) |
| Computers, Engineering & Science | 709 (76.5%) | 218 (23.5%) |
| Computers & Mathematics | 314 (73.4%) | 114 (26.6%) |
| Architecture & Engineering | 336 (83.0%) | 69 (17.0%) |
| Life, Physical & Social Science | 59 (62.8%) | 35 (37.2%) |
| Community & Social Service | 1,405 (33.2%) | 2,827 (66.8%) |
| Education, Arts & Media | 162 (43.5%) | 210 (56.5%) |
| Legal Services & Support | 129 (35.5%) | 234 (64.5%) |
| Education Instruction & Library | 837 (29.2%) | 2,031 (70.8%) |
| Arts, Media & Entertainment | 277 (44.0%) | 352 (56.0%) |
| Health Diagnosing & Treating | 908 (27.8%) | 2,360 (72.2%) |
| Health Technologists | 644 (26.2%) | 1,815 (73.8%) |
| Total (Category) | 5,510 (42.4%) | 7,475 (57.6%) |
| Total (Overall) | 18,230 (50.7%) | 17,757 (49.3%) |
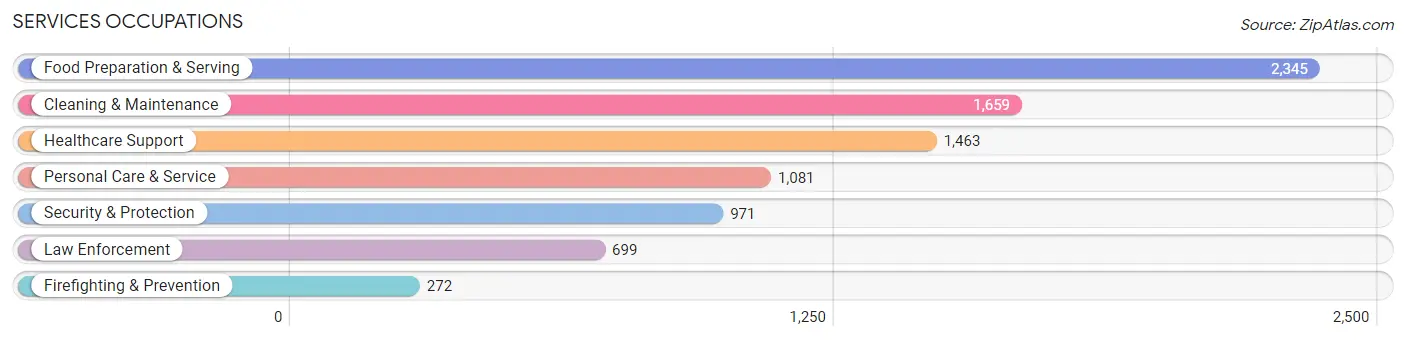
Services Occupations
The most common Services occupations in Jonesboro are Food Preparation & Serving (2,345 | 6.5%), Cleaning & Maintenance (1,659 | 4.6%), Healthcare Support (1,463 | 4.1%), Personal Care & Service (1,081 | 3.0%), and Security & Protection (971 | 2.7%).
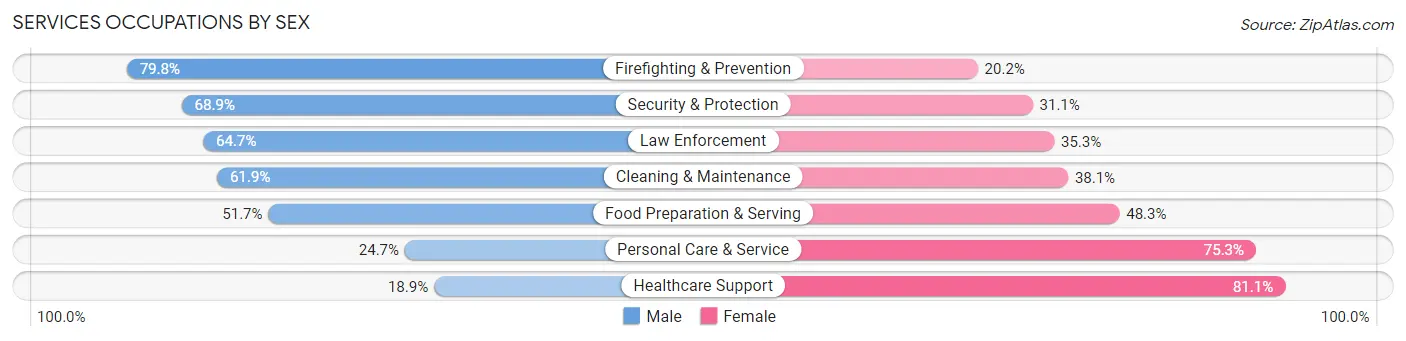
Services Occupations by Sex
Within the Services occupations in Jonesboro, the most male-oriented occupations are Firefighting & Prevention (79.8%), Security & Protection (68.9%), and Law Enforcement (64.7%), while the most female-oriented occupations are Healthcare Support (81.1%), Personal Care & Service (75.3%), and Food Preparation & Serving (48.3%).
| Occupation | Male | Female |
| Healthcare Support | 277 (18.9%) | 1,186 (81.1%) |
| Security & Protection | 669 (68.9%) | 302 (31.1%) |
| Firefighting & Prevention | 217 (79.8%) | 55 (20.2%) |
| Law Enforcement | 452 (64.7%) | 247 (35.3%) |
| Food Preparation & Serving | 1,213 (51.7%) | 1,132 (48.3%) |
| Cleaning & Maintenance | 1,027 (61.9%) | 632 (38.1%) |
| Personal Care & Service | 267 (24.7%) | 814 (75.3%) |
| Total (Category) | 3,453 (45.9%) | 4,066 (54.1%) |
| Total (Overall) | 18,230 (50.7%) | 17,757 (49.3%) |
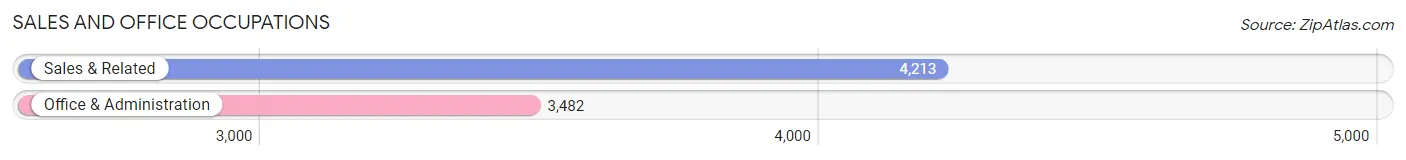
Sales and Office Occupations
The most common Sales and Office occupations in Jonesboro are Sales & Related (4,213 | 11.7%), and Office & Administration (3,482 | 9.7%).
Sales and Office Occupations by Sex
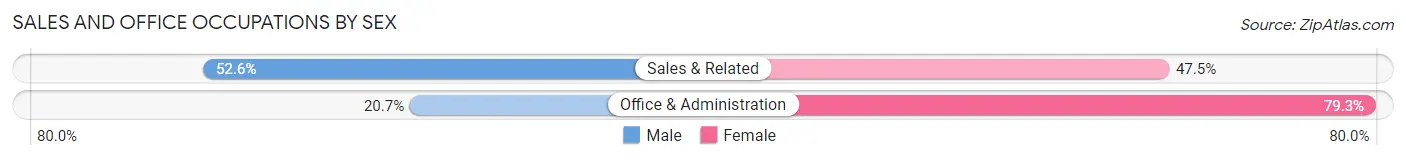
| Occupation | Male | Female |
| Sales & Related | 2,214 (52.5%) | 1,999 (47.4%) |
| Office & Administration | 721 (20.7%) | 2,761 (79.3%) |
| Total (Category) | 2,935 (38.1%) | 4,760 (61.9%) |
| Total (Overall) | 18,230 (50.7%) | 17,757 (49.3%) |
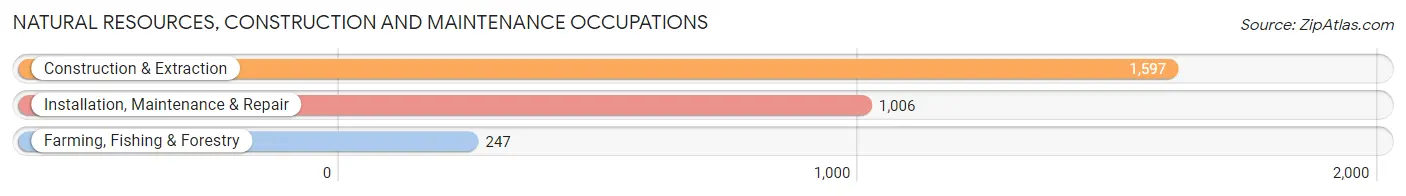
Natural Resources, Construction and Maintenance Occupations
The most common Natural Resources, Construction and Maintenance occupations in Jonesboro are Construction & Extraction (1,597 | 4.4%), Installation, Maintenance & Repair (1,006 | 2.8%), and Farming, Fishing & Forestry (247 | 0.7%).
Natural Resources, Construction and Maintenance Occupations by Sex
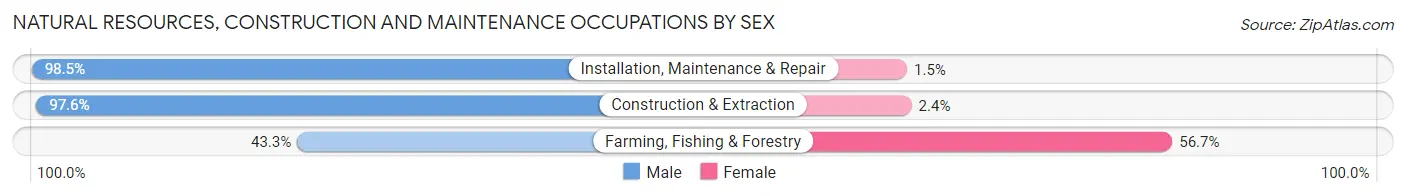
| Occupation | Male | Female |
| Farming, Fishing & Forestry | 107 (43.3%) | 140 (56.7%) |
| Construction & Extraction | 1,558 (97.6%) | 39 (2.4%) |
| Installation, Maintenance & Repair | 991 (98.5%) | 15 (1.5%) |
| Total (Category) | 2,656 (93.2%) | 194 (6.8%) |
| Total (Overall) | 18,230 (50.7%) | 17,757 (49.3%) |
Production, Transportation and Moving Occupations
The most common Production, Transportation and Moving occupations in Jonesboro are Production (2,257 | 6.3%), Material Moving (1,550 | 4.3%), and Transportation (1,131 | 3.1%).
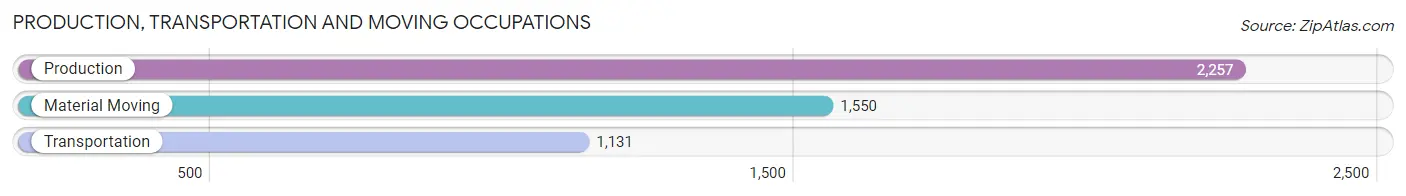
Production, Transportation and Moving Occupations by Sex
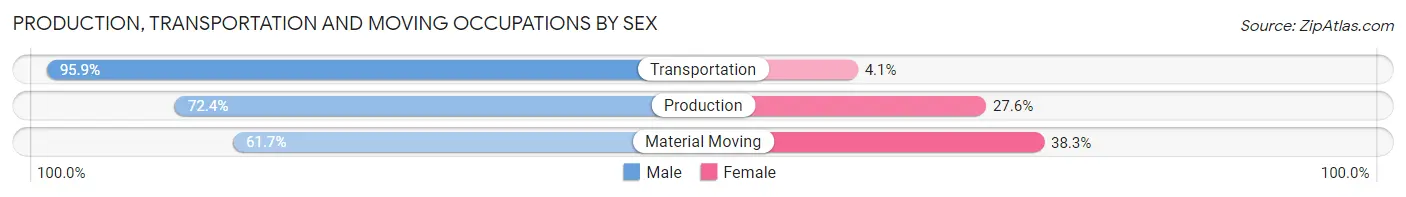
| Occupation | Male | Female |
| Production | 1,634 (72.4%) | 623 (27.6%) |
| Transportation | 1,085 (95.9%) | 46 (4.1%) |
| Material Moving | 957 (61.7%) | 593 (38.3%) |
| Total (Category) | 3,676 (74.4%) | 1,262 (25.6%) |
| Total (Overall) | 18,230 (50.7%) | 17,757 (49.3%) |
Employment Industries by Sex in Jonesboro
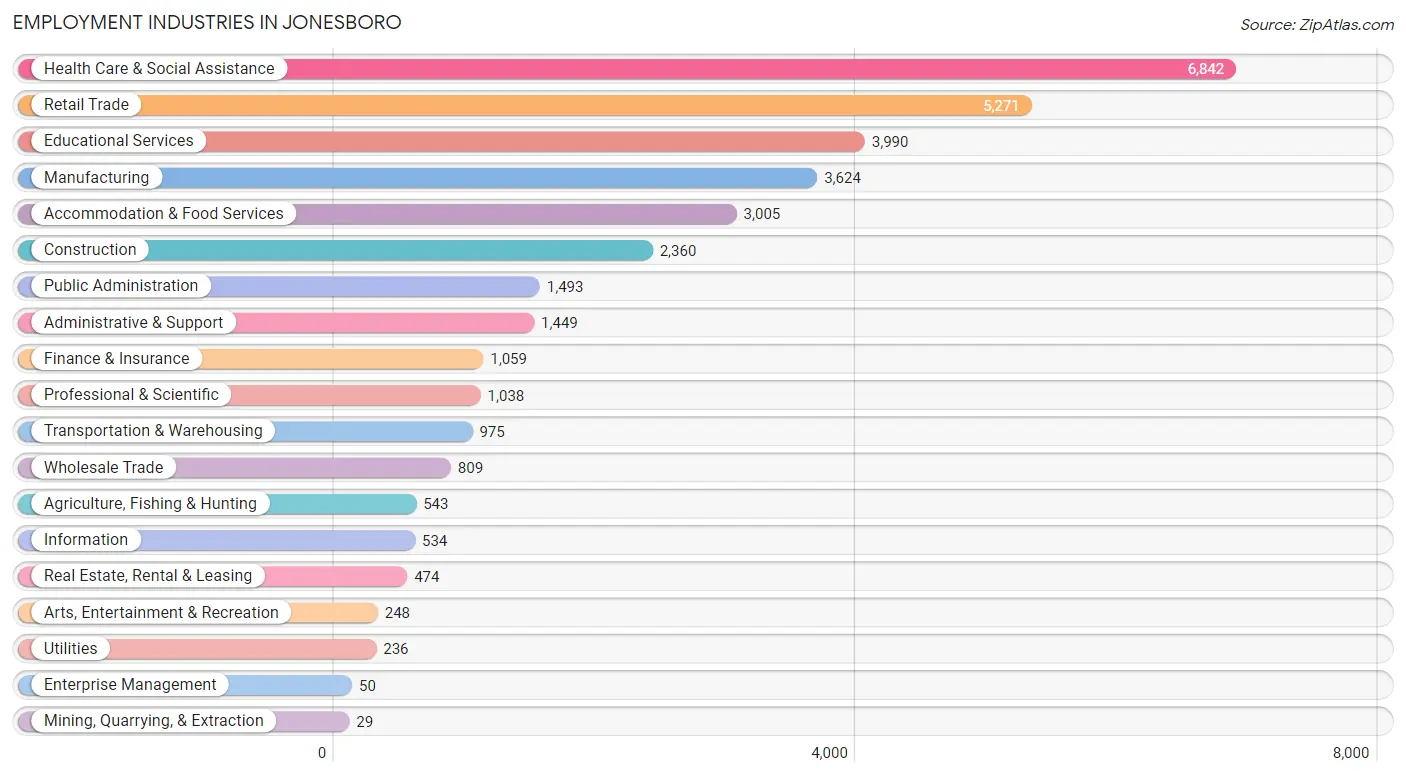
Employment Industries in Jonesboro
The major employment industries in Jonesboro include Health Care & Social Assistance (6,842 | 19.0%), Retail Trade (5,271 | 14.6%), Educational Services (3,990 | 11.1%), Manufacturing (3,624 | 10.1%), and Accommodation & Food Services (3,005 | 8.4%).
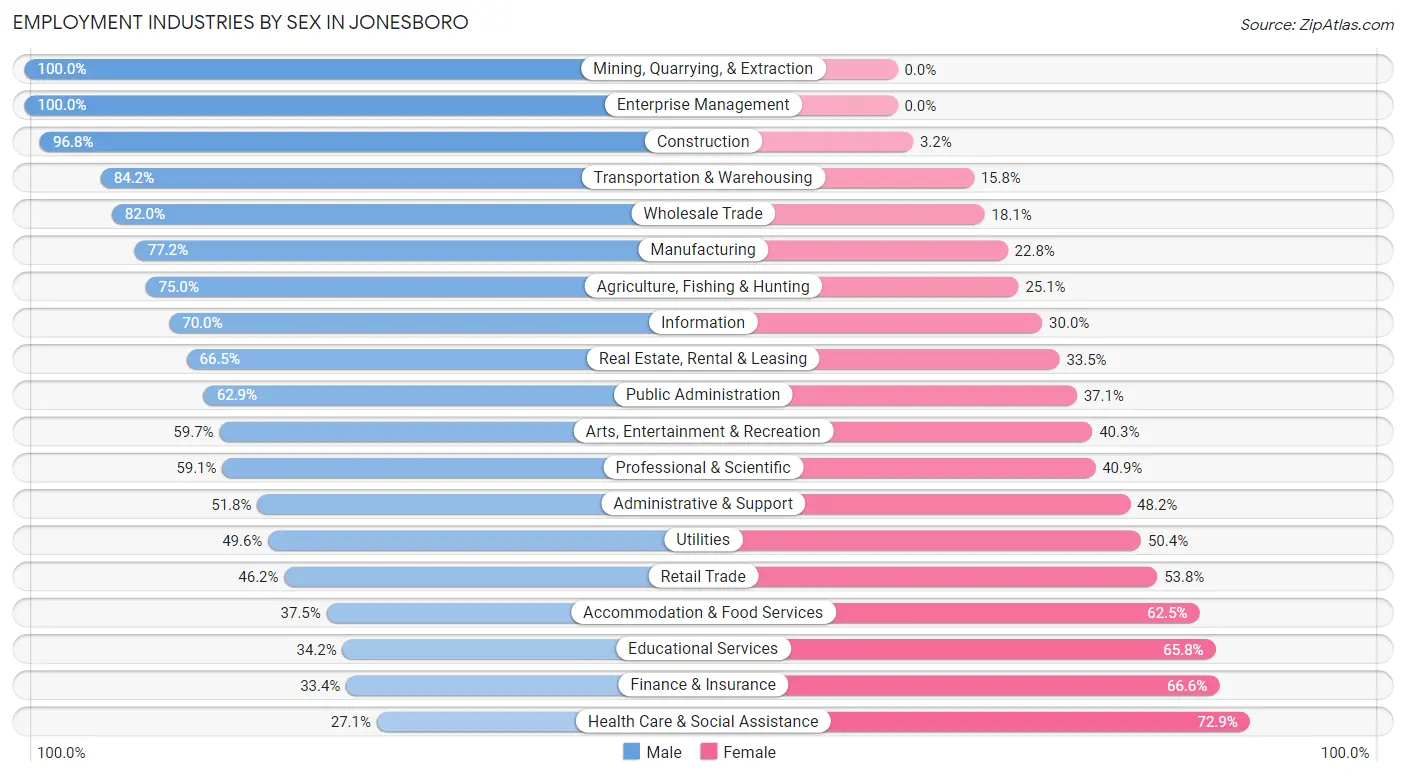
Employment Industries by Sex in Jonesboro
The Jonesboro industries that see more men than women are Mining, Quarrying, & Extraction (100.0%), Enterprise Management (100.0%), and Construction (96.8%), whereas the industries that tend to have a higher number of women are Health Care & Social Assistance (72.9%), Finance & Insurance (66.6%), and Educational Services (65.8%).
| Industry | Male | Female |
| Agriculture, Fishing & Hunting | 407 (75.0%) | 136 (25.1%) |
| Mining, Quarrying, & Extraction | 29 (100.0%) | 0 (0.0%) |
| Construction | 2,284 (96.8%) | 76 (3.2%) |
| Manufacturing | 2,797 (77.2%) | 827 (22.8%) |
| Wholesale Trade | 663 (82.0%) | 146 (18.0%) |
| Retail Trade | 2,437 (46.2%) | 2,834 (53.8%) |
| Transportation & Warehousing | 821 (84.2%) | 154 (15.8%) |
| Utilities | 117 (49.6%) | 119 (50.4%) |
| Information | 374 (70.0%) | 160 (30.0%) |
| Finance & Insurance | 354 (33.4%) | 705 (66.6%) |
| Real Estate, Rental & Leasing | 315 (66.5%) | 159 (33.5%) |
| Professional & Scientific | 613 (59.1%) | 425 (40.9%) |
| Enterprise Management | 50 (100.0%) | 0 (0.0%) |
| Administrative & Support | 751 (51.8%) | 698 (48.2%) |
| Educational Services | 1,364 (34.2%) | 2,626 (65.8%) |
| Health Care & Social Assistance | 1,855 (27.1%) | 4,987 (72.9%) |
| Arts, Entertainment & Recreation | 148 (59.7%) | 100 (40.3%) |
| Accommodation & Food Services | 1,127 (37.5%) | 1,878 (62.5%) |
| Public Administration | 939 (62.9%) | 554 (37.1%) |
| Total | 18,230 (50.7%) | 17,757 (49.3%) |
Education in Jonesboro
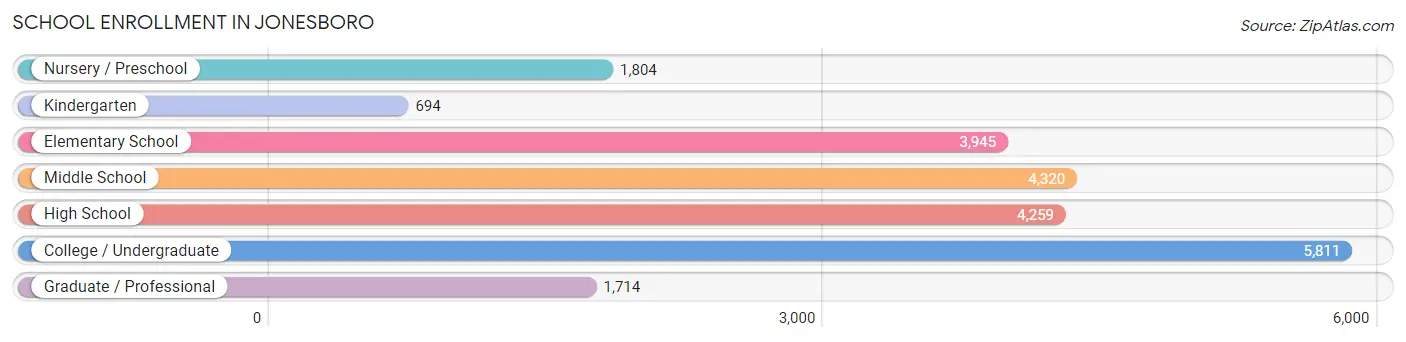
School Enrollment in Jonesboro
The most common levels of schooling among the 22,547 students in Jonesboro are college / undergraduate (5,811 | 25.8%), middle school (4,320 | 19.2%), and high school (4,259 | 18.9%).
| School Level | # Students | % Students |
| Nursery / Preschool | 1,804 | 8.0% |
| Kindergarten | 694 | 3.1% |
| Elementary School | 3,945 | 17.5% |
| Middle School | 4,320 | 19.2% |
| High School | 4,259 | 18.9% |
| College / Undergraduate | 5,811 | 25.8% |
| Graduate / Professional | 1,714 | 7.6% |
| Total | 22,547 | 100.0% |
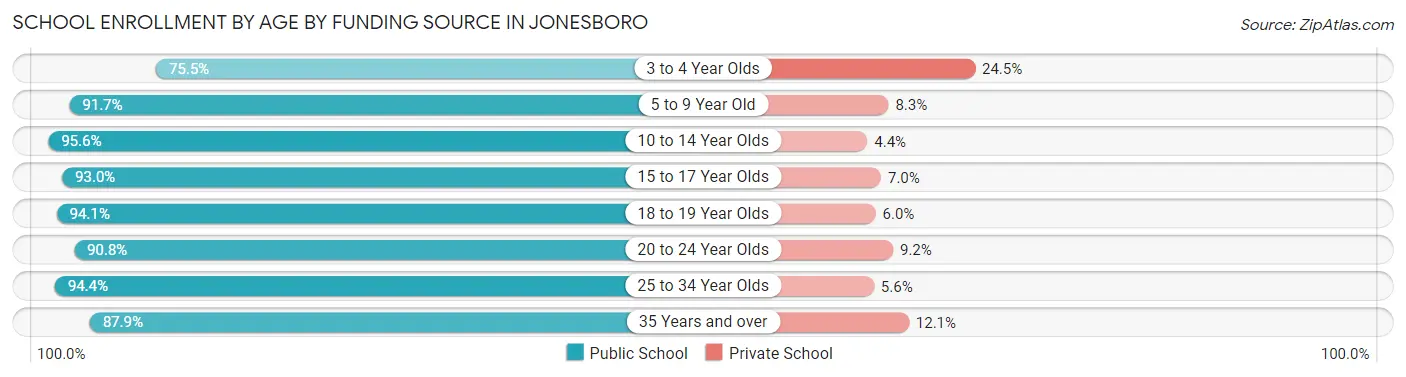
School Enrollment by Age by Funding Source in Jonesboro
Out of a total of 22,547 students who are enrolled in schools in Jonesboro, 1,826 (8.1%) attend a private institution, while the remaining 20,721 (91.9%) are enrolled in public schools. The age group of 3 to 4 year olds has the highest likelihood of being enrolled in private schools, with 347 (24.5% in the age bracket) enrolled. Conversely, the age group of 10 to 14 year olds has the lowest likelihood of being enrolled in a private school, with 5,133 (95.6% in the age bracket) attending a public institution.
| Age Bracket | Public School | Private School |
| 3 to 4 Year Olds | 1,071 (75.5%) | 347 (24.5%) |
| 5 to 9 Year Old | 4,157 (91.7%) | 378 (8.3%) |
| 10 to 14 Year Olds | 5,133 (95.6%) | 237 (4.4%) |
| 15 to 17 Year Olds | 2,673 (93.0%) | 200 (7.0%) |
| 18 to 19 Year Olds | 2,452 (94.1%) | 155 (5.9%) |
| 20 to 24 Year Olds | 3,247 (90.8%) | 329 (9.2%) |
| 25 to 34 Year Olds | 1,323 (94.4%) | 79 (5.6%) |
| 35 Years and over | 673 (87.9%) | 93 (12.1%) |
| Total | 20,721 (91.9%) | 1,826 (8.1%) |
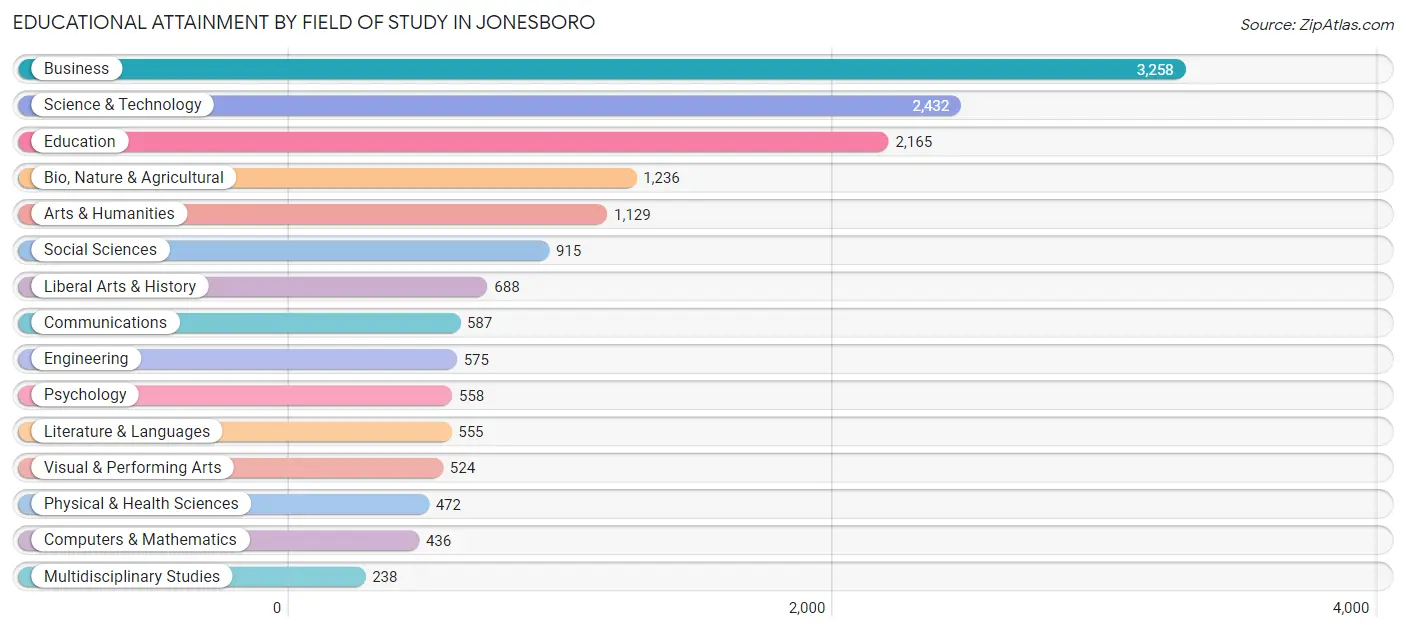
Educational Attainment by Field of Study in Jonesboro
Business (3,258 | 20.7%), science & technology (2,432 | 15.4%), education (2,165 | 13.7%), bio, nature & agricultural (1,236 | 7.8%), and arts & humanities (1,129 | 7.2%) are the most common fields of study among 15,768 individuals in Jonesboro who have obtained a bachelor's degree or higher.
| Field of Study | # Graduates | % Graduates |
| Computers & Mathematics | 436 | 2.8% |
| Bio, Nature & Agricultural | 1,236 | 7.8% |
| Physical & Health Sciences | 472 | 3.0% |
| Psychology | 558 | 3.5% |
| Social Sciences | 915 | 5.8% |
| Engineering | 575 | 3.6% |
| Multidisciplinary Studies | 238 | 1.5% |
| Science & Technology | 2,432 | 15.4% |
| Business | 3,258 | 20.7% |
| Education | 2,165 | 13.7% |
| Literature & Languages | 555 | 3.5% |
| Liberal Arts & History | 688 | 4.4% |
| Visual & Performing Arts | 524 | 3.3% |
| Communications | 587 | 3.7% |
| Arts & Humanities | 1,129 | 7.2% |
| Total | 15,768 | 100.0% |
Transportation & Commute in Jonesboro
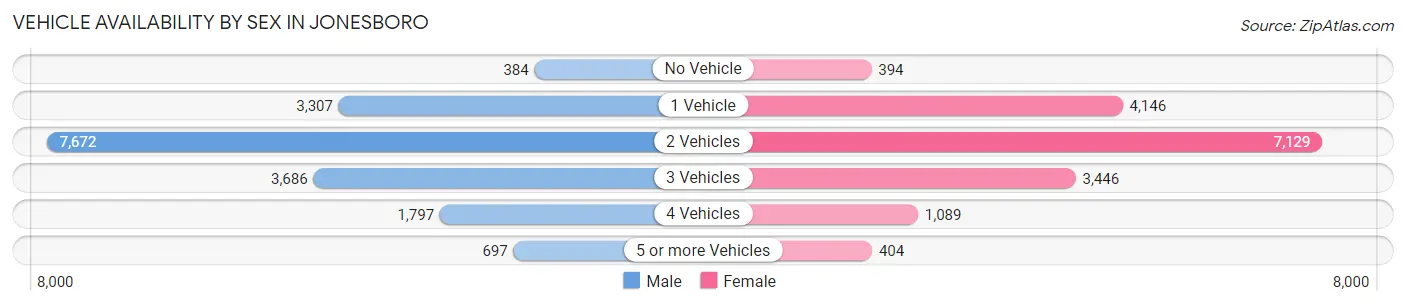
Vehicle Availability by Sex in Jonesboro
The most prevalent vehicle ownership categories in Jonesboro are males with 2 vehicles (7,672, accounting for 43.7%) and females with 2 vehicles (7,129, making up 46.2%).
| Vehicles Available | Male | Female |
| No Vehicle | 384 (2.2%) | 394 (2.4%) |
| 1 Vehicle | 3,307 (18.9%) | 4,146 (25.0%) |
| 2 Vehicles | 7,672 (43.7%) | 7,129 (42.9%) |
| 3 Vehicles | 3,686 (21.0%) | 3,446 (20.7%) |
| 4 Vehicles | 1,797 (10.2%) | 1,089 (6.6%) |
| 5 or more Vehicles | 697 (4.0%) | 404 (2.4%) |
| Total | 17,543 (100.0%) | 16,608 (100.0%) |
Commute Time in Jonesboro
The most frequently occuring commute durations in Jonesboro are 10 to 14 minutes (9,106 commuters, 27.3%), 15 to 19 minutes (8,658 commuters, 25.9%), and 5 to 9 minutes (4,412 commuters, 13.2%).
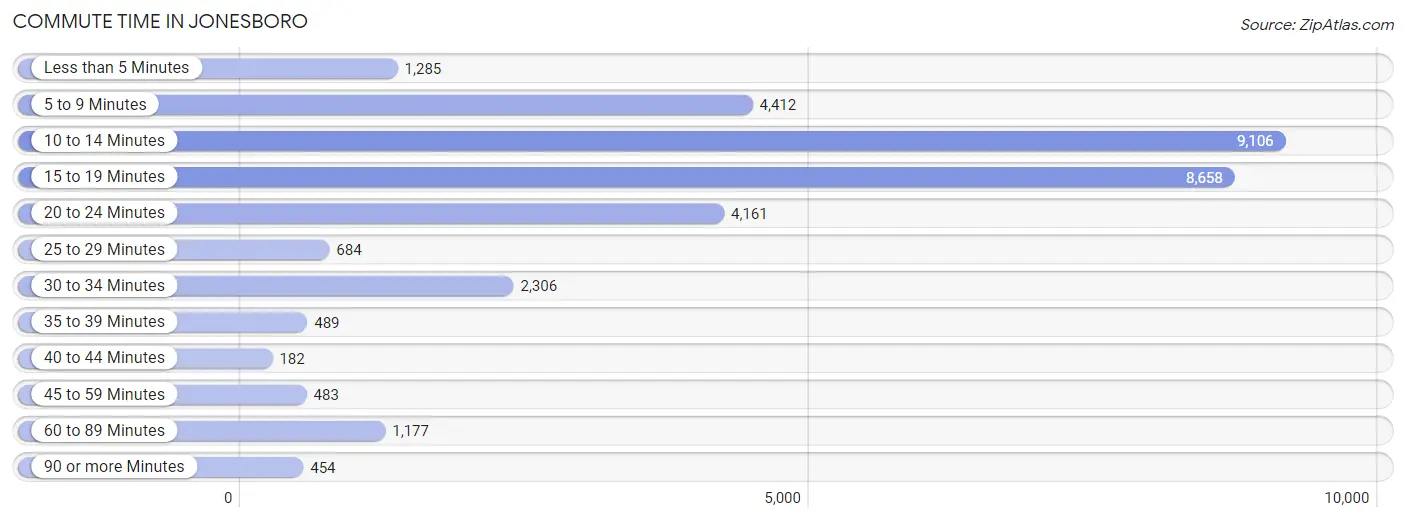
| Commute Time | # Commuters | % Commuters |
| Less than 5 Minutes | 1,285 | 3.8% |
| 5 to 9 Minutes | 4,412 | 13.2% |
| 10 to 14 Minutes | 9,106 | 27.3% |
| 15 to 19 Minutes | 8,658 | 25.9% |
| 20 to 24 Minutes | 4,161 | 12.5% |
| 25 to 29 Minutes | 684 | 2.1% |
| 30 to 34 Minutes | 2,306 | 6.9% |
| 35 to 39 Minutes | 489 | 1.5% |
| 40 to 44 Minutes | 182 | 0.5% |
| 45 to 59 Minutes | 483 | 1.5% |
| 60 to 89 Minutes | 1,177 | 3.5% |
| 90 or more Minutes | 454 | 1.4% |
Commute Time by Sex in Jonesboro
The most common commute times in Jonesboro are 15 to 19 minutes (4,492 commuters, 26.1%) for males and 10 to 14 minutes (4,819 commuters, 29.7%) for females.
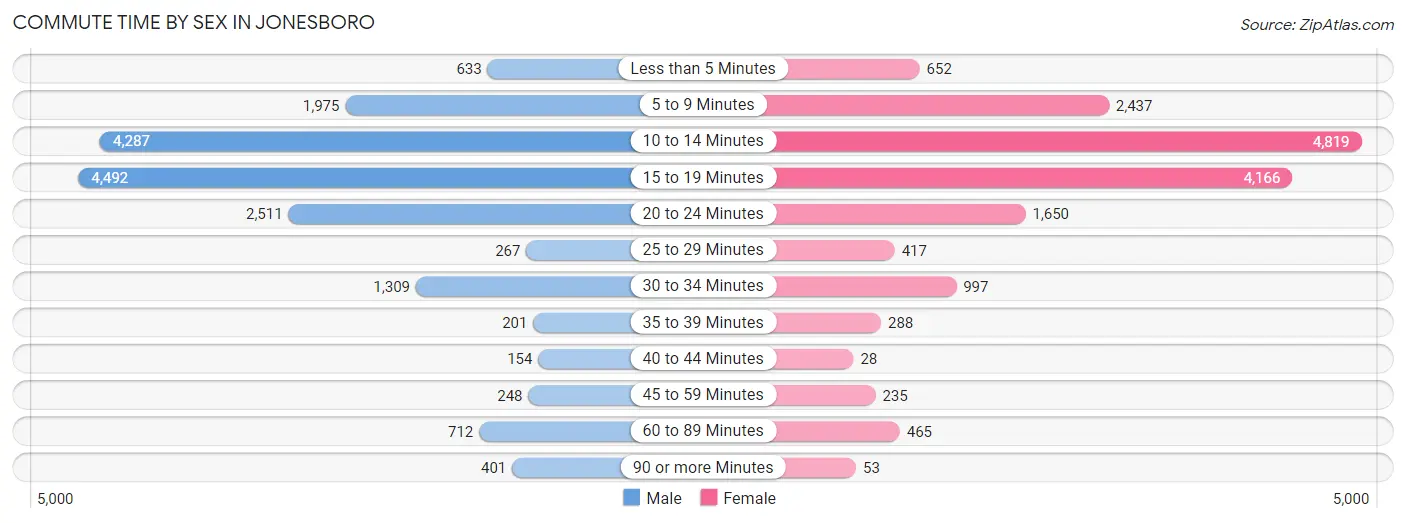
| Commute Time | Male | Female |
| Less than 5 Minutes | 633 (3.7%) | 652 (4.0%) |
| 5 to 9 Minutes | 1,975 (11.5%) | 2,437 (15.0%) |
| 10 to 14 Minutes | 4,287 (24.9%) | 4,819 (29.7%) |
| 15 to 19 Minutes | 4,492 (26.1%) | 4,166 (25.7%) |
| 20 to 24 Minutes | 2,511 (14.6%) | 1,650 (10.2%) |
| 25 to 29 Minutes | 267 (1.5%) | 417 (2.6%) |
| 30 to 34 Minutes | 1,309 (7.6%) | 997 (6.1%) |
| 35 to 39 Minutes | 201 (1.2%) | 288 (1.8%) |
| 40 to 44 Minutes | 154 (0.9%) | 28 (0.2%) |
| 45 to 59 Minutes | 248 (1.4%) | 235 (1.5%) |
| 60 to 89 Minutes | 712 (4.1%) | 465 (2.9%) |
| 90 or more Minutes | 401 (2.3%) | 53 (0.3%) |
Time of Departure to Work by Sex in Jonesboro
The most frequent times of departure to work in Jonesboro are 7:30 AM to 7:59 AM (2,717, 15.8%) for males and 7:00 AM to 7:29 AM (2,698, 16.7%) for females.
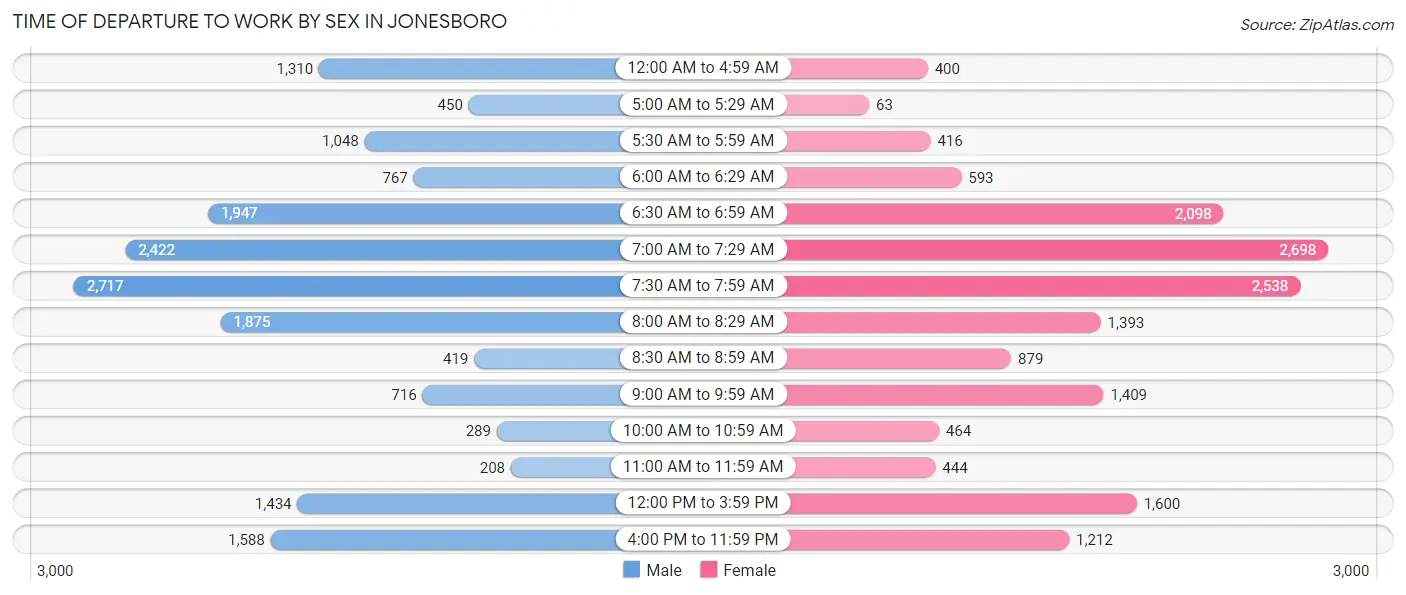
| Time of Departure | Male | Female |
| 12:00 AM to 4:59 AM | 1,310 (7.6%) | 400 (2.5%) |
| 5:00 AM to 5:29 AM | 450 (2.6%) | 63 (0.4%) |
| 5:30 AM to 5:59 AM | 1,048 (6.1%) | 416 (2.6%) |
| 6:00 AM to 6:29 AM | 767 (4.5%) | 593 (3.7%) |
| 6:30 AM to 6:59 AM | 1,947 (11.3%) | 2,098 (13.0%) |
| 7:00 AM to 7:29 AM | 2,422 (14.1%) | 2,698 (16.7%) |
| 7:30 AM to 7:59 AM | 2,717 (15.8%) | 2,538 (15.7%) |
| 8:00 AM to 8:29 AM | 1,875 (10.9%) | 1,393 (8.6%) |
| 8:30 AM to 8:59 AM | 419 (2.4%) | 879 (5.4%) |
| 9:00 AM to 9:59 AM | 716 (4.2%) | 1,409 (8.7%) |
| 10:00 AM to 10:59 AM | 289 (1.7%) | 464 (2.9%) |
| 11:00 AM to 11:59 AM | 208 (1.2%) | 444 (2.7%) |
| 12:00 PM to 3:59 PM | 1,434 (8.3%) | 1,600 (9.9%) |
| 4:00 PM to 11:59 PM | 1,588 (9.2%) | 1,212 (7.5%) |
| Total | 17,190 (100.0%) | 16,207 (100.0%) |
Housing Occupancy in Jonesboro
Occupancy by Ownership in Jonesboro
Of the total 30,187 dwellings in Jonesboro, owner-occupied units account for 16,287 (53.9%), while renter-occupied units make up 13,900 (46.1%).
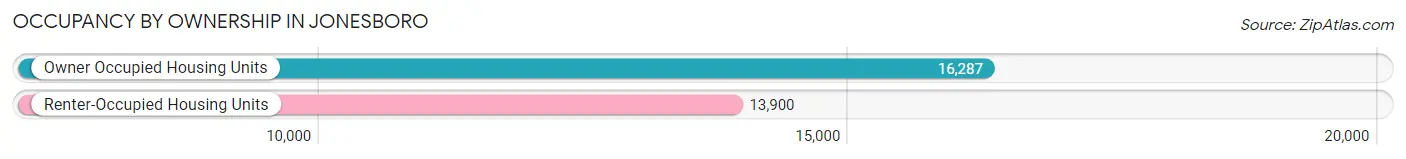
| Occupancy | # Housing Units | % Housing Units |
| Owner Occupied Housing Units | 16,287 | 53.9% |
| Renter-Occupied Housing Units | 13,900 | 46.1% |
| Total Occupied Housing Units | 30,187 | 100.0% |
Occupancy by Household Size in Jonesboro
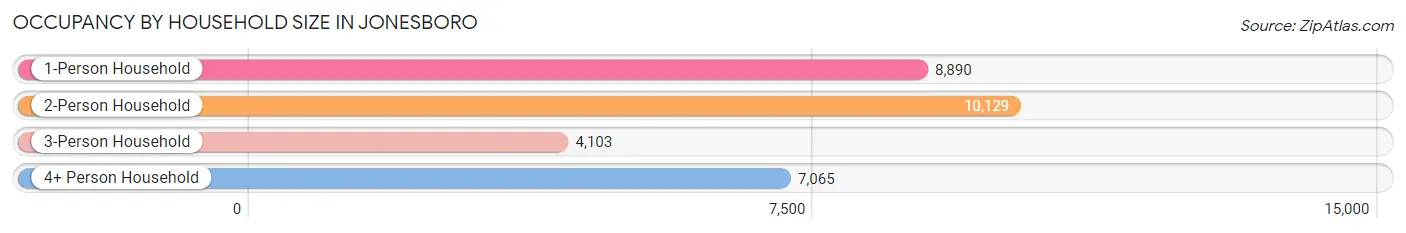
| Household Size | # Housing Units | % Housing Units |
| 1-Person Household | 8,890 | 29.4% |
| 2-Person Household | 10,129 | 33.6% |
| 3-Person Household | 4,103 | 13.6% |
| 4+ Person Household | 7,065 | 23.4% |
| Total Housing Units | 30,187 | 100.0% |
Occupancy by Ownership by Household Size in Jonesboro
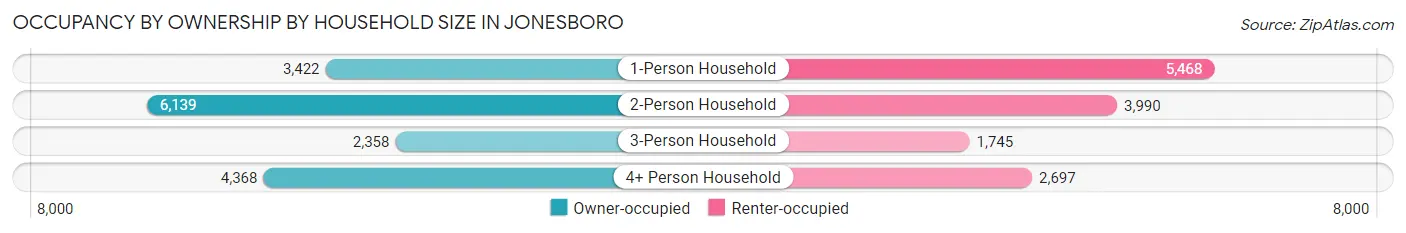
| Household Size | Owner-occupied | Renter-occupied |
| 1-Person Household | 3,422 (38.5%) | 5,468 (61.5%) |
| 2-Person Household | 6,139 (60.6%) | 3,990 (39.4%) |
| 3-Person Household | 2,358 (57.5%) | 1,745 (42.5%) |
| 4+ Person Household | 4,368 (61.8%) | 2,697 (38.2%) |
| Total Housing Units | 16,287 (53.9%) | 13,900 (46.1%) |
Occupancy by Educational Attainment in Jonesboro
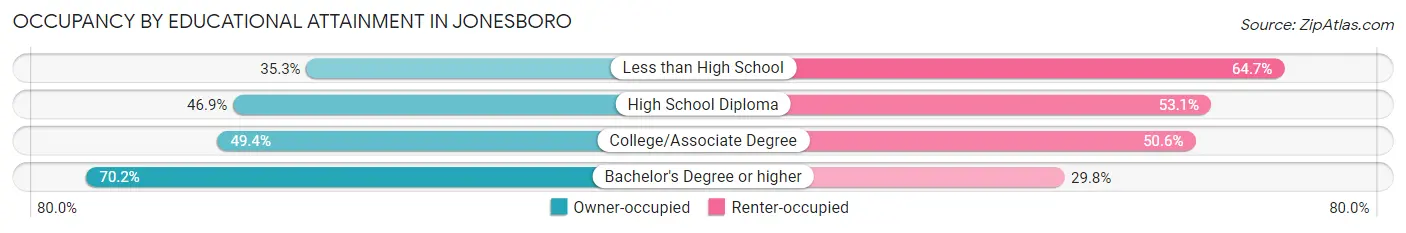
| Household Size | Owner-occupied | Renter-occupied |
| Less than High School | 1,005 (35.3%) | 1,842 (64.7%) |
| High School Diploma | 3,675 (46.9%) | 4,157 (53.1%) |
| College/Associate Degree | 4,956 (49.4%) | 5,076 (50.6%) |
| Bachelor's Degree or higher | 6,651 (70.2%) | 2,825 (29.8%) |
Occupancy by Age of Householder in Jonesboro
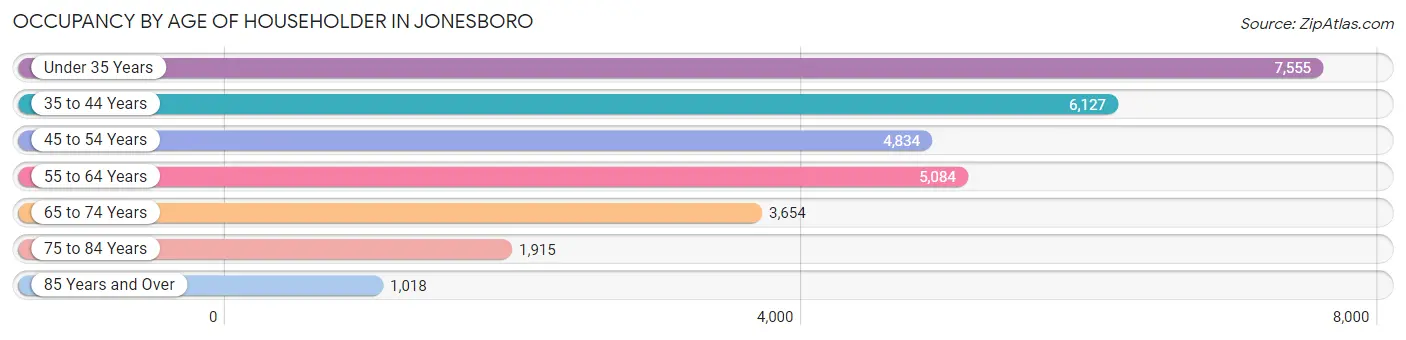
| Age Bracket | # Households | % Households |
| Under 35 Years | 7,555 | 25.0% |
| 35 to 44 Years | 6,127 | 20.3% |
| 45 to 54 Years | 4,834 | 16.0% |
| 55 to 64 Years | 5,084 | 16.8% |
| 65 to 74 Years | 3,654 | 12.1% |
| 75 to 84 Years | 1,915 | 6.3% |
| 85 Years and Over | 1,018 | 3.4% |
| Total | 30,187 | 100.0% |
Housing Finances in Jonesboro
Median Income by Occupancy in Jonesboro
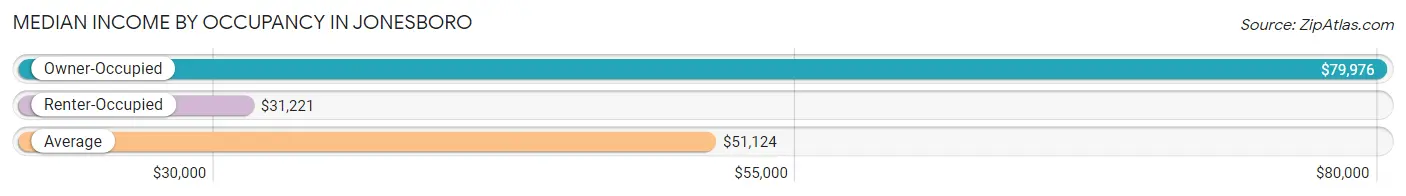
| Occupancy Type | # Households | Median Income |
| Owner-Occupied | 16,287 (53.9%) | $79,976 |
| Renter-Occupied | 13,900 (46.1%) | $31,221 |
| Average | 30,187 (100.0%) | $51,124 |
Occupancy by Householder Income Bracket in Jonesboro
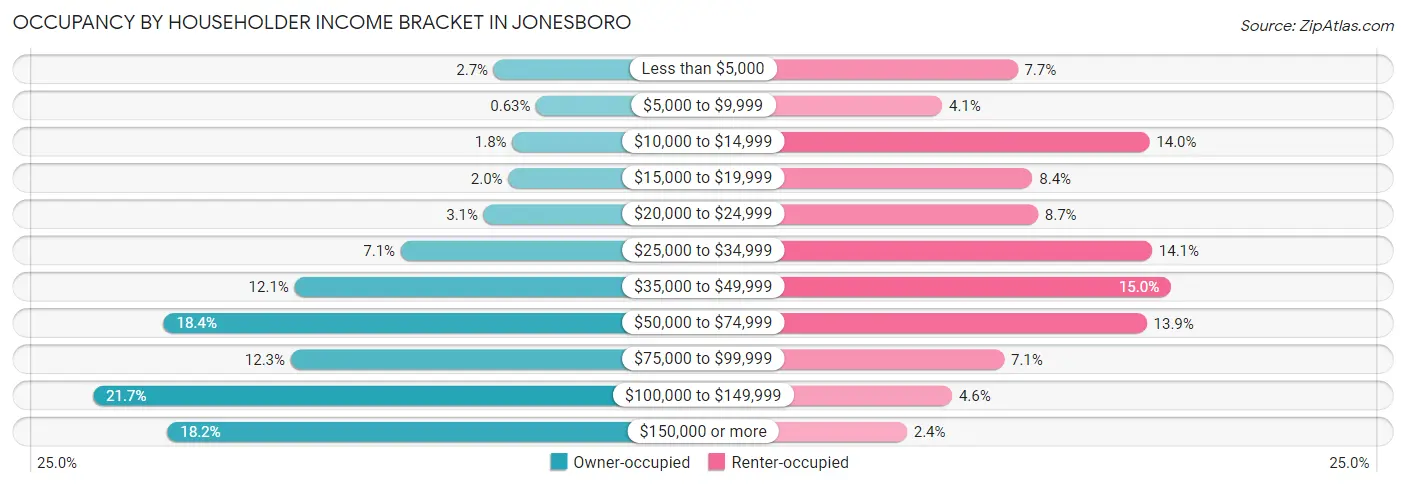
| Income Bracket | Owner-occupied | Renter-occupied |
| Less than $5,000 | 431 (2.6%) | 1,072 (7.7%) |
| $5,000 to $9,999 | 103 (0.6%) | 572 (4.1%) |
| $10,000 to $14,999 | 288 (1.8%) | 1,945 (14.0%) |
| $15,000 to $19,999 | 319 (2.0%) | 1,170 (8.4%) |
| $20,000 to $24,999 | 510 (3.1%) | 1,206 (8.7%) |
| $25,000 to $34,999 | 1,153 (7.1%) | 1,961 (14.1%) |
| $35,000 to $49,999 | 1,977 (12.1%) | 2,088 (15.0%) |
| $50,000 to $74,999 | 2,993 (18.4%) | 1,926 (13.9%) |
| $75,000 to $99,999 | 2,007 (12.3%) | 983 (7.1%) |
| $100,000 to $149,999 | 3,541 (21.7%) | 638 (4.6%) |
| $150,000 or more | 2,965 (18.2%) | 339 (2.4%) |
| Total | 16,287 (100.0%) | 13,900 (100.0%) |
Monthly Housing Cost Tiers in Jonesboro
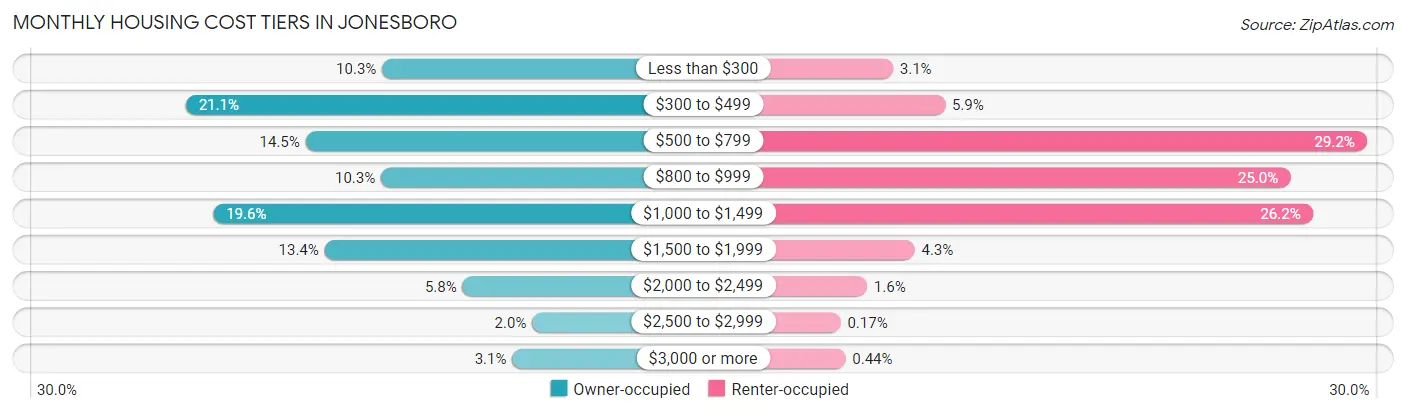
| Monthly Cost | Owner-occupied | Renter-occupied |
| Less than $300 | 1,670 (10.2%) | 426 (3.1%) |
| $300 to $499 | 3,437 (21.1%) | 825 (5.9%) |
| $500 to $799 | 2,359 (14.5%) | 4,063 (29.2%) |
| $800 to $999 | 1,680 (10.3%) | 3,475 (25.0%) |
| $1,000 to $1,499 | 3,189 (19.6%) | 3,648 (26.2%) |
| $1,500 to $1,999 | 2,187 (13.4%) | 592 (4.3%) |
| $2,000 to $2,499 | 947 (5.8%) | 227 (1.6%) |
| $2,500 to $2,999 | 320 (2.0%) | 23 (0.2%) |
| $3,000 or more | 498 (3.1%) | 61 (0.4%) |
| Total | 16,287 (100.0%) | 13,900 (100.0%) |
Physical Housing Characteristics in Jonesboro
Housing Structures in Jonesboro
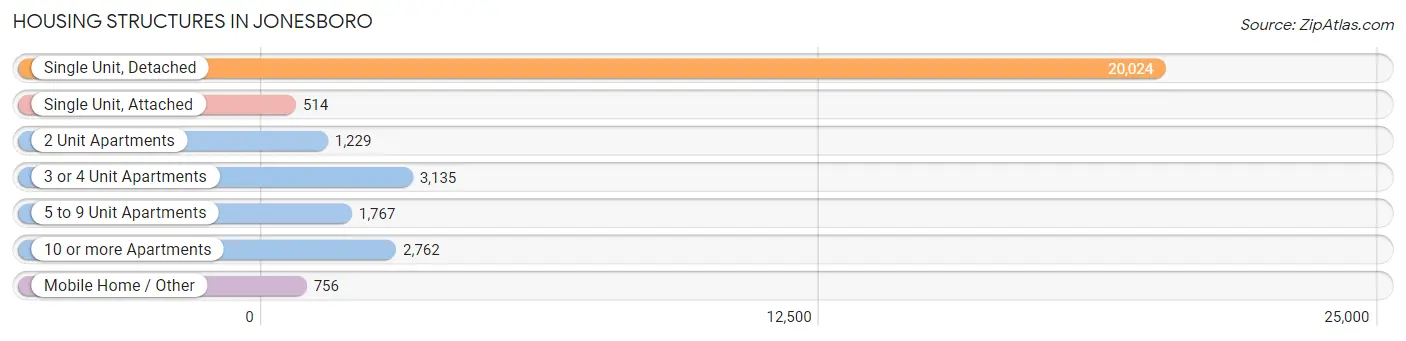
| Structure Type | # Housing Units | % Housing Units |
| Single Unit, Detached | 20,024 | 66.3% |
| Single Unit, Attached | 514 | 1.7% |
| 2 Unit Apartments | 1,229 | 4.1% |
| 3 or 4 Unit Apartments | 3,135 | 10.4% |
| 5 to 9 Unit Apartments | 1,767 | 5.9% |
| 10 or more Apartments | 2,762 | 9.1% |
| Mobile Home / Other | 756 | 2.5% |
| Total | 30,187 | 100.0% |
Housing Structures by Occupancy in Jonesboro
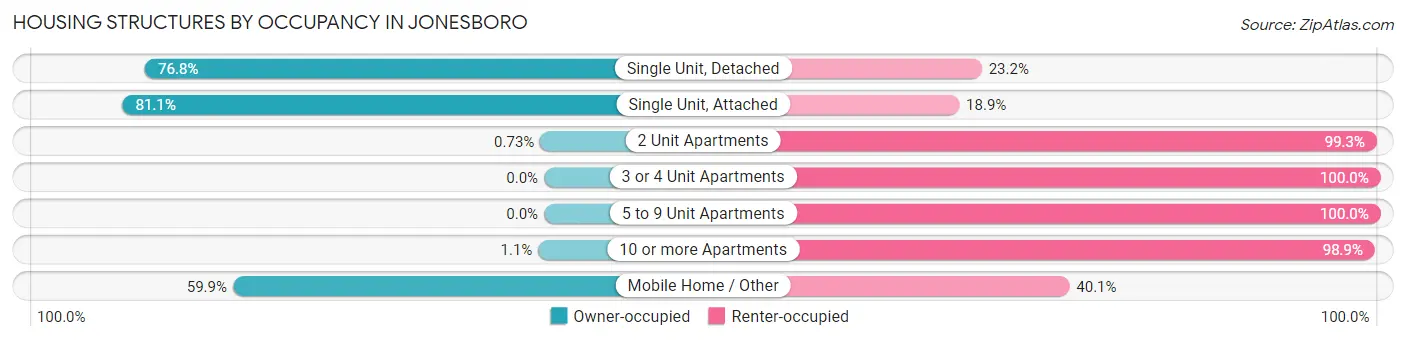
| Structure Type | Owner-occupied | Renter-occupied |
| Single Unit, Detached | 15,377 (76.8%) | 4,647 (23.2%) |
| Single Unit, Attached | 417 (81.1%) | 97 (18.9%) |
| 2 Unit Apartments | 9 (0.7%) | 1,220 (99.3%) |
| 3 or 4 Unit Apartments | 0 (0.0%) | 3,135 (100.0%) |
| 5 to 9 Unit Apartments | 0 (0.0%) | 1,767 (100.0%) |
| 10 or more Apartments | 31 (1.1%) | 2,731 (98.9%) |
| Mobile Home / Other | 453 (59.9%) | 303 (40.1%) |
| Total | 16,287 (53.9%) | 13,900 (46.1%) |
Housing Structures by Number of Rooms in Jonesboro
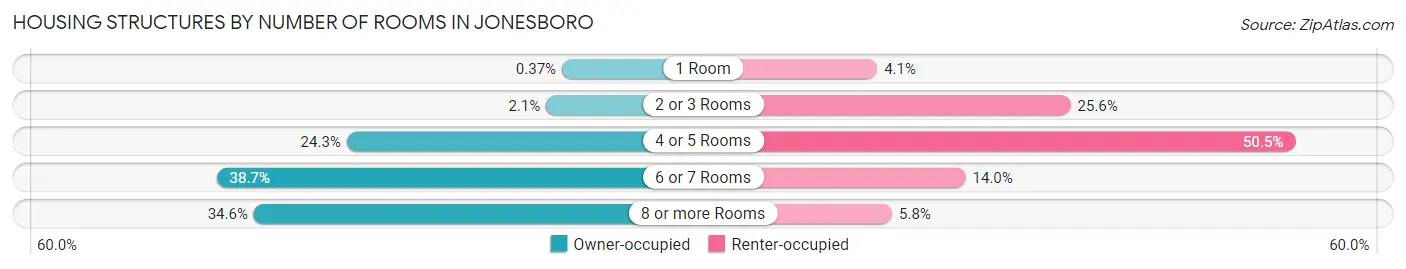
| Number of Rooms | Owner-occupied | Renter-occupied |
| 1 Room | 60 (0.4%) | 575 (4.1%) |
| 2 or 3 Rooms | 343 (2.1%) | 3,559 (25.6%) |
| 4 or 5 Rooms | 3,952 (24.3%) | 7,022 (50.5%) |
| 6 or 7 Rooms | 6,302 (38.7%) | 1,939 (14.0%) |
| 8 or more Rooms | 5,630 (34.6%) | 805 (5.8%) |
| Total | 16,287 (100.0%) | 13,900 (100.0%) |
Housing Structure by Heating Type in Jonesboro
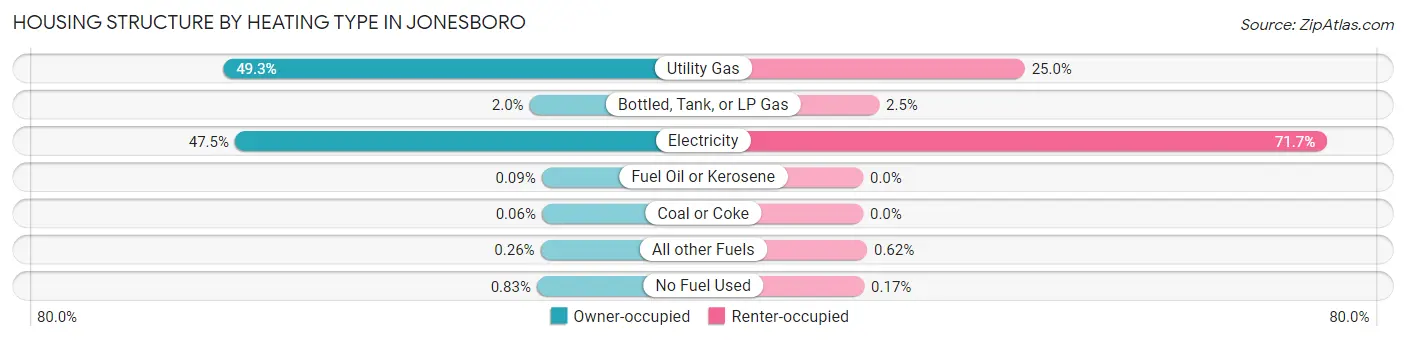
| Heating Type | Owner-occupied | Renter-occupied |
| Utility Gas | 8,028 (49.3%) | 3,474 (25.0%) |
| Bottled, Tank, or LP Gas | 320 (2.0%) | 345 (2.5%) |
| Electricity | 7,738 (47.5%) | 9,971 (71.7%) |
| Fuel Oil or Kerosene | 14 (0.1%) | 0 (0.0%) |
| Coal or Coke | 9 (0.1%) | 0 (0.0%) |
| All other Fuels | 43 (0.3%) | 86 (0.6%) |
| No Fuel Used | 135 (0.8%) | 24 (0.2%) |
| Total | 16,287 (100.0%) | 13,900 (100.0%) |
Household Vehicle Usage in Jonesboro
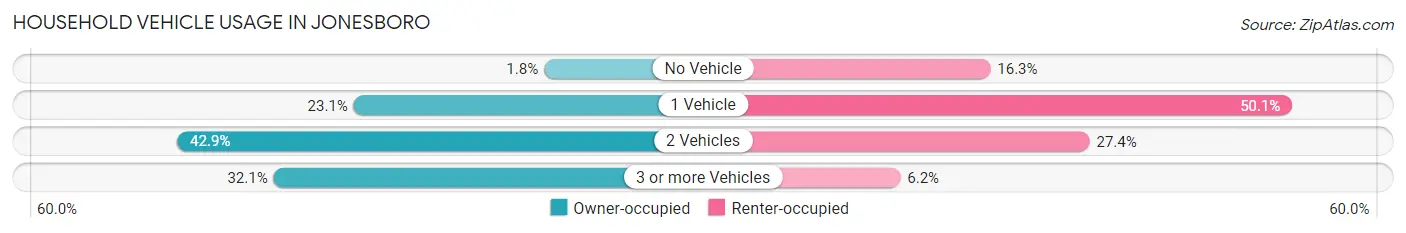
| Vehicles per Household | Owner-occupied | Renter-occupied |
| No Vehicle | 296 (1.8%) | 2,264 (16.3%) |
| 1 Vehicle | 3,769 (23.1%) | 6,964 (50.1%) |
| 2 Vehicles | 6,990 (42.9%) | 3,809 (27.4%) |
| 3 or more Vehicles | 5,232 (32.1%) | 863 (6.2%) |
| Total | 16,287 (100.0%) | 13,900 (100.0%) |
Real Estate & Mortgages in Jonesboro
Real Estate and Mortgage Overview in Jonesboro
| Characteristic | Without Mortgage | With Mortgage |
| Housing Units | 6,785 | 9,502 |
| Median Property Value | $179,900 | $208,300 |
| Median Household Income | $56,419 | $2,116 |
| Monthly Housing Costs | $404 | $498 |
| Real Estate Taxes | $977 | $841 |
Property Value by Mortgage Status in Jonesboro
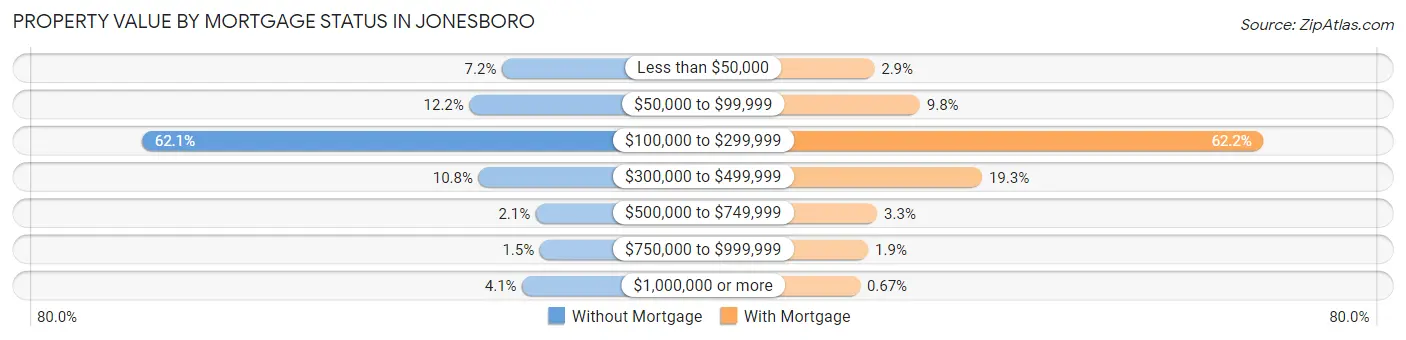
| Property Value | Without Mortgage | With Mortgage |
| Less than $50,000 | 490 (7.2%) | 272 (2.9%) |
| $50,000 to $99,999 | 827 (12.2%) | 931 (9.8%) |
| $100,000 to $299,999 | 4,216 (62.1%) | 5,909 (62.2%) |
| $300,000 to $499,999 | 732 (10.8%) | 1,831 (19.3%) |
| $500,000 to $749,999 | 140 (2.1%) | 313 (3.3%) |
| $750,000 to $999,999 | 99 (1.5%) | 182 (1.9%) |
| $1,000,000 or more | 281 (4.1%) | 64 (0.7%) |
| Total | 6,785 (100.0%) | 9,502 (100.0%) |
Household Income by Mortgage Status in Jonesboro
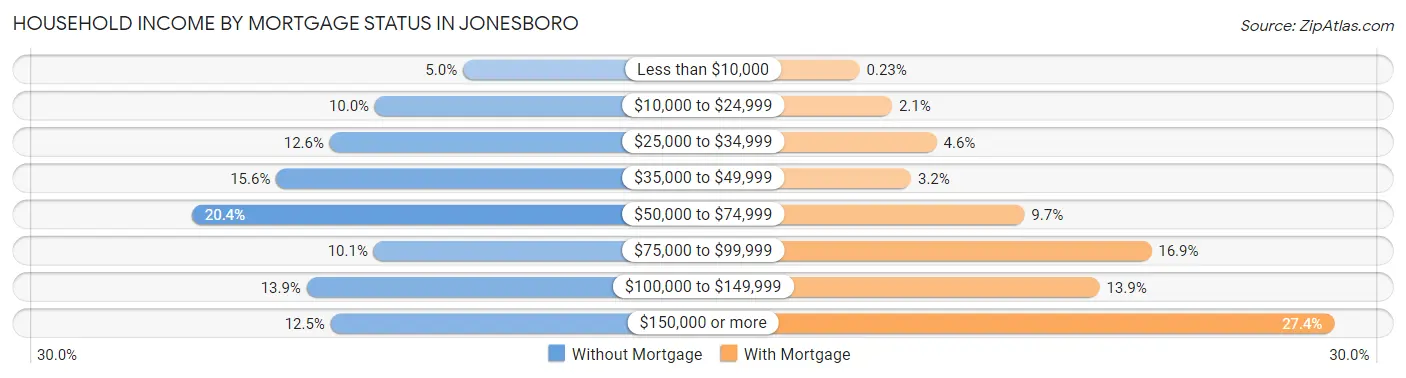
| Household Income | Without Mortgage | With Mortgage |
| Less than $10,000 | 336 (5.0%) | 22 (0.2%) |
| $10,000 to $24,999 | 677 (10.0%) | 198 (2.1%) |
| $25,000 to $34,999 | 852 (12.6%) | 440 (4.6%) |
| $35,000 to $49,999 | 1,060 (15.6%) | 301 (3.2%) |
| $50,000 to $74,999 | 1,387 (20.4%) | 917 (9.7%) |
| $75,000 to $99,999 | 682 (10.1%) | 1,606 (16.9%) |
| $100,000 to $149,999 | 942 (13.9%) | 1,325 (13.9%) |
| $150,000 or more | 849 (12.5%) | 2,599 (27.4%) |
| Total | 6,785 (100.0%) | 9,502 (100.0%) |
Property Value to Household Income Ratio in Jonesboro
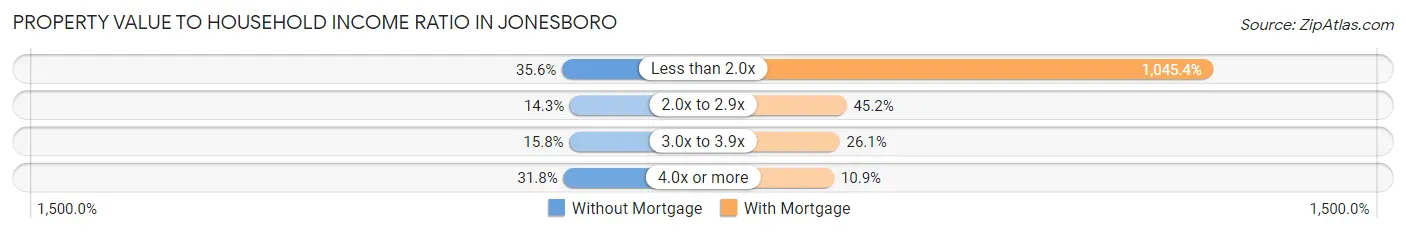
| Value-to-Income Ratio | Without Mortgage | With Mortgage |
| Less than 2.0x | 2,418 (35.6%) | 99,333 (1,045.4%) |
| 2.0x to 2.9x | 970 (14.3%) | 4,290 (45.2%) |
| 3.0x to 3.9x | 1,075 (15.8%) | 2,483 (26.1%) |
| 4.0x or more | 2,155 (31.8%) | 1,037 (10.9%) |
| Total | 6,785 (100.0%) | 9,502 (100.0%) |
Real Estate Taxes by Mortgage Status in Jonesboro
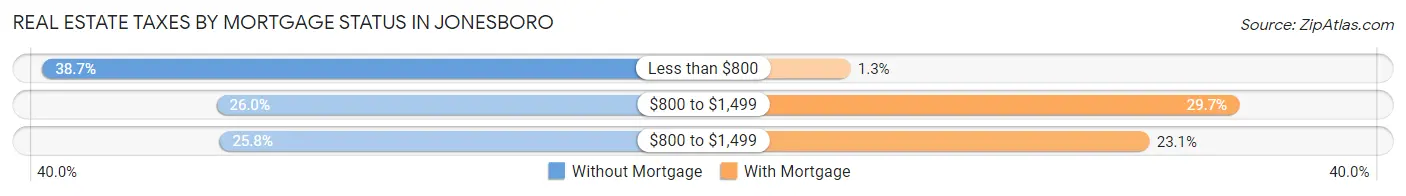
| Property Taxes | Without Mortgage | With Mortgage |
| Less than $800 | 2,625 (38.7%) | 124 (1.3%) |
| $800 to $1,499 | 1,762 (26.0%) | 2,817 (29.6%) |
| $800 to $1,499 | 1,748 (25.8%) | 2,199 (23.1%) |
| Total | 6,785 (100.0%) | 9,502 (100.0%) |
Health & Disability in Jonesboro
Health Insurance Coverage by Age in Jonesboro
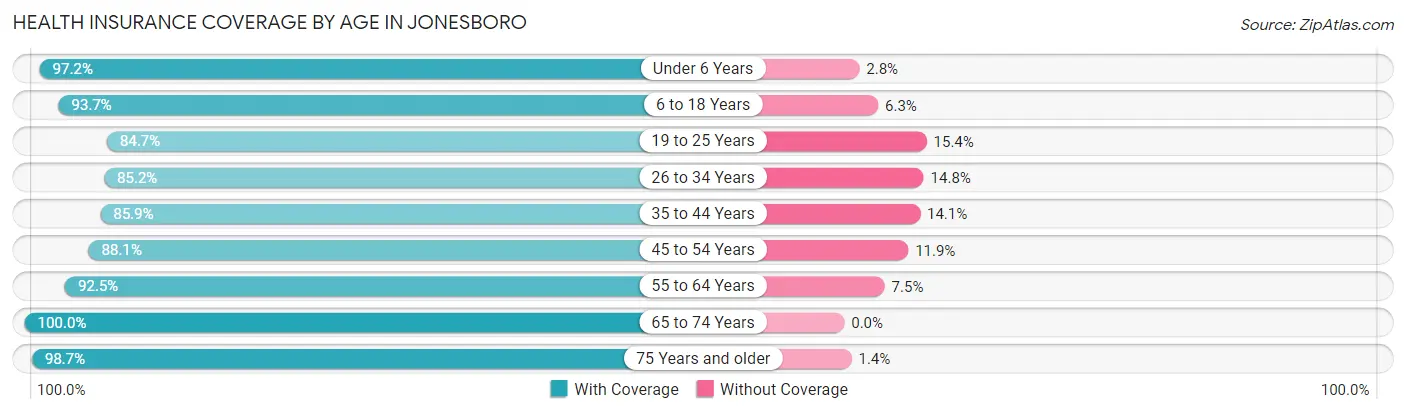
| Age Bracket | With Coverage | Without Coverage |
| Under 6 Years | 6,019 (97.2%) | 174 (2.8%) |
| 6 to 18 Years | 13,531 (93.7%) | 912 (6.3%) |
| 19 to 25 Years | 8,214 (84.7%) | 1,489 (15.3%) |
| 26 to 34 Years | 8,757 (85.2%) | 1,521 (14.8%) |
| 35 to 44 Years | 8,533 (85.9%) | 1,403 (14.1%) |
| 45 to 54 Years | 7,609 (88.1%) | 1,030 (11.9%) |
| 55 to 64 Years | 7,616 (92.5%) | 620 (7.5%) |
| 65 to 74 Years | 6,081 (100.0%) | 0 (0.0%) |
| 75 Years and older | 3,887 (98.7%) | 53 (1.3%) |
| Total | 70,247 (90.7%) | 7,202 (9.3%) |
Health Insurance Coverage by Citizenship Status in Jonesboro
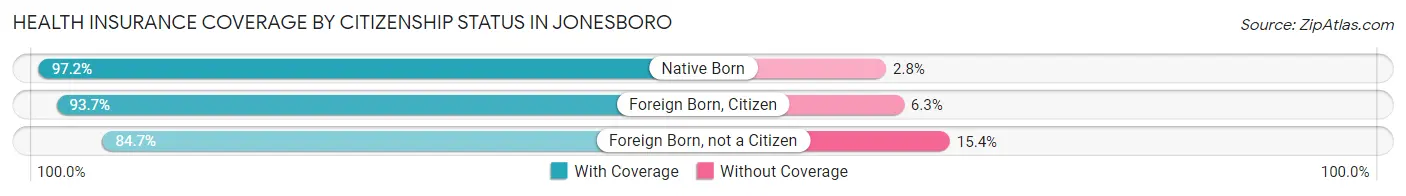
| Citizenship Status | With Coverage | Without Coverage |
| Native Born | 6,019 (97.2%) | 174 (2.8%) |
| Foreign Born, Citizen | 13,531 (93.7%) | 912 (6.3%) |
| Foreign Born, not a Citizen | 8,214 (84.7%) | 1,489 (15.3%) |
Health Insurance Coverage by Household Income in Jonesboro
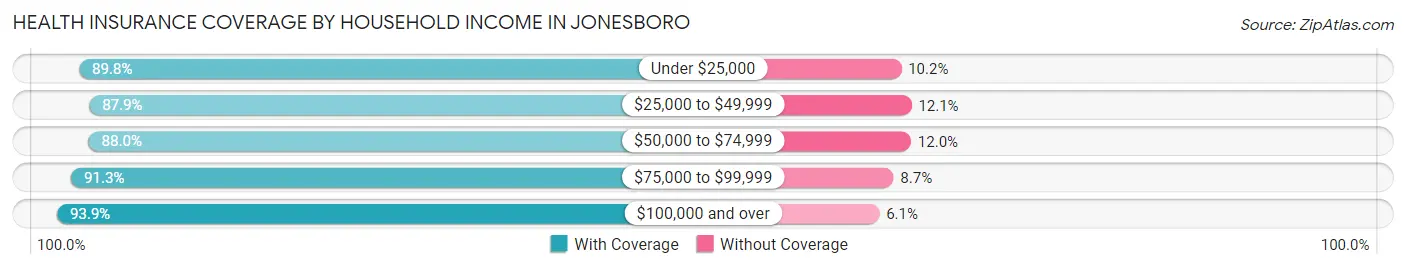
| Household Income | With Coverage | Without Coverage |
| Under $25,000 | 13,140 (89.8%) | 1,493 (10.2%) |
| $25,000 to $49,999 | 14,093 (87.9%) | 1,942 (12.1%) |
| $50,000 to $74,999 | 11,088 (88.0%) | 1,513 (12.0%) |
| $75,000 to $99,999 | 7,419 (91.3%) | 710 (8.7%) |
| $100,000 and over | 22,149 (93.9%) | 1,432 (6.1%) |
Public vs Private Health Insurance Coverage by Age in Jonesboro
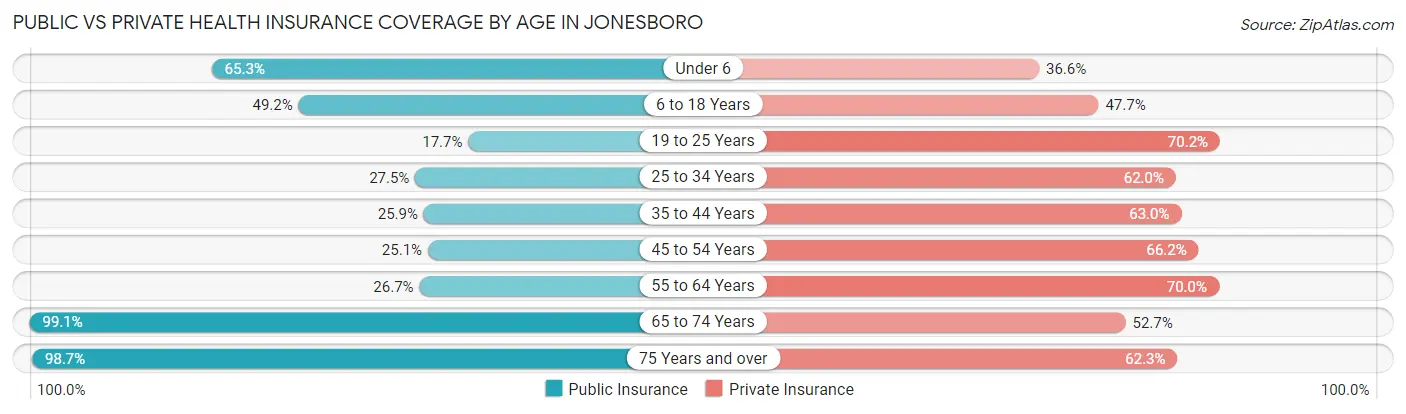
| Age Bracket | Public Insurance | Private Insurance |
| Under 6 | 4,042 (65.3%) | 2,267 (36.6%) |
| 6 to 18 Years | 7,099 (49.1%) | 6,882 (47.6%) |
| 19 to 25 Years | 1,713 (17.6%) | 6,810 (70.2%) |
| 25 to 34 Years | 2,826 (27.5%) | 6,371 (62.0%) |
| 35 to 44 Years | 2,573 (25.9%) | 6,261 (63.0%) |
| 45 to 54 Years | 2,172 (25.1%) | 5,720 (66.2%) |
| 55 to 64 Years | 2,201 (26.7%) | 5,763 (70.0%) |
| 65 to 74 Years | 6,027 (99.1%) | 3,203 (52.7%) |
| 75 Years and over | 3,887 (98.7%) | 2,454 (62.3%) |
| Total | 32,540 (42.0%) | 45,731 (59.1%) |
Disability Status by Sex by Age in Jonesboro
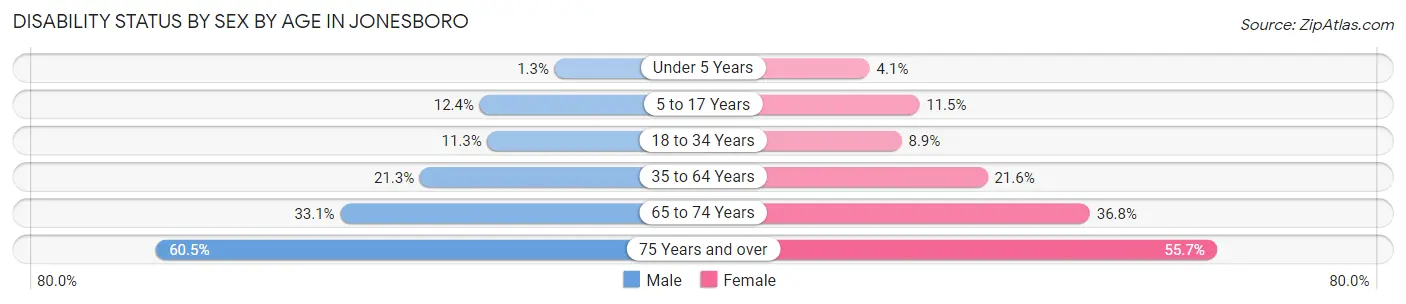
| Age Bracket | Male | Female |
| Under 5 Years | 33 (1.3%) | 106 (4.1%) |
| 5 to 17 Years | 872 (12.4%) | 779 (11.5%) |
| 18 to 34 Years | 1,178 (11.3%) | 994 (8.9%) |
| 35 to 64 Years | 2,696 (21.3%) | 3,060 (21.6%) |
| 65 to 74 Years | 891 (33.1%) | 1,248 (36.8%) |
| 75 Years and over | 908 (60.5%) | 1,357 (55.7%) |
Disability Class by Sex by Age in Jonesboro
Disability Class: Hearing Difficulty
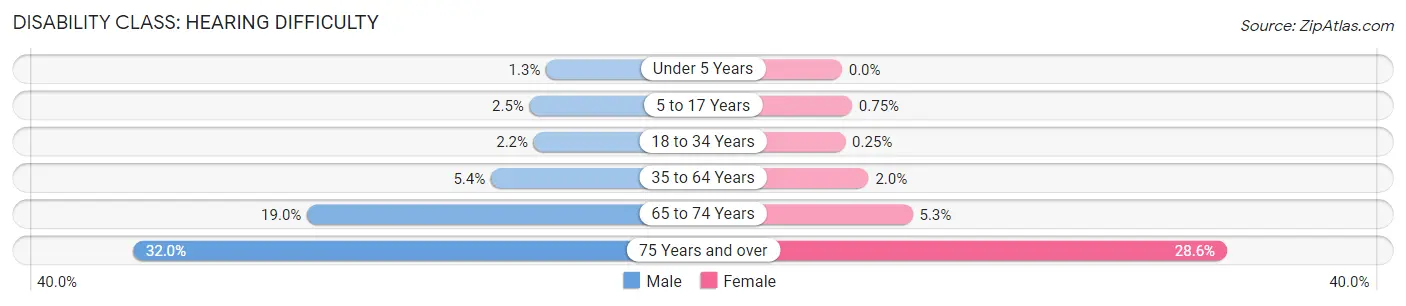
| Age Bracket | Male | Female |
| Under 5 Years | 33 (1.3%) | 0 (0.0%) |
| 5 to 17 Years | 176 (2.5%) | 51 (0.7%) |
| 18 to 34 Years | 229 (2.2%) | 28 (0.3%) |
| 35 to 64 Years | 680 (5.4%) | 280 (2.0%) |
| 65 to 74 Years | 512 (19.0%) | 178 (5.2%) |
| 75 Years and over | 480 (32.0%) | 697 (28.6%) |
Disability Class: Vision Difficulty
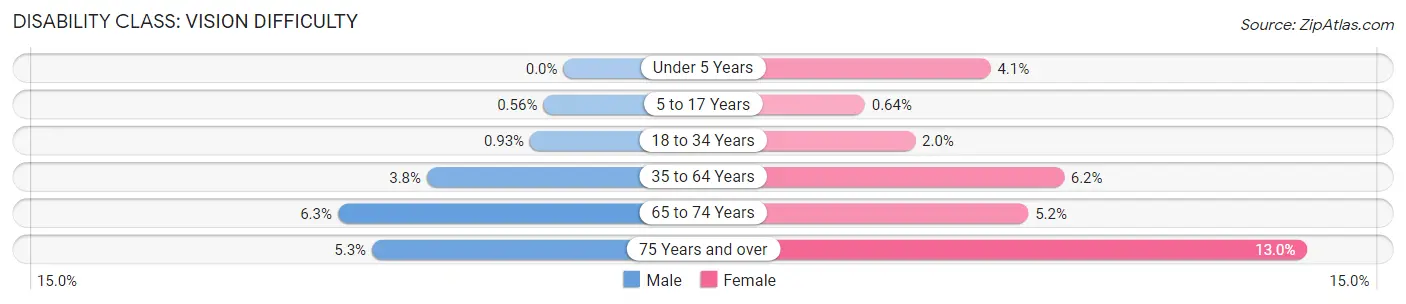
| Age Bracket | Male | Female |
| Under 5 Years | 0 (0.0%) | 106 (4.1%) |
| 5 to 17 Years | 39 (0.6%) | 43 (0.6%) |
| 18 to 34 Years | 97 (0.9%) | 229 (2.0%) |
| 35 to 64 Years | 481 (3.8%) | 874 (6.2%) |
| 65 to 74 Years | 169 (6.3%) | 176 (5.2%) |
| 75 Years and over | 80 (5.3%) | 316 (13.0%) |
Disability Class: Cognitive Difficulty
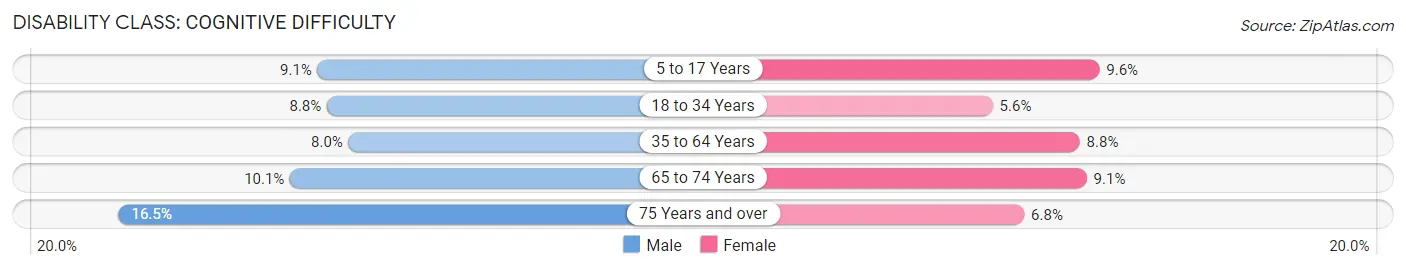
| Age Bracket | Male | Female |
| 5 to 17 Years | 641 (9.1%) | 647 (9.6%) |
| 18 to 34 Years | 918 (8.8%) | 628 (5.6%) |
| 35 to 64 Years | 1,010 (8.0%) | 1,249 (8.8%) |
| 65 to 74 Years | 273 (10.1%) | 308 (9.1%) |
| 75 Years and over | 248 (16.5%) | 165 (6.8%) |
Disability Class: Ambulatory Difficulty
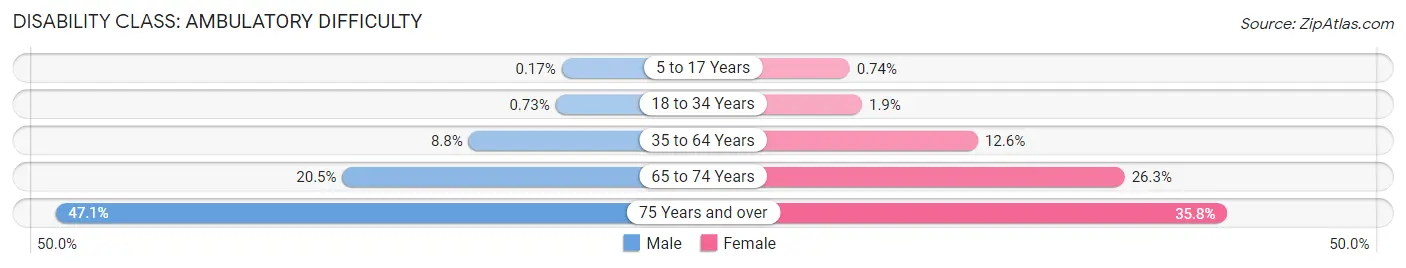
| Age Bracket | Male | Female |
| 5 to 17 Years | 12 (0.2%) | 50 (0.7%) |
| 18 to 34 Years | 76 (0.7%) | 211 (1.9%) |
| 35 to 64 Years | 1,115 (8.8%) | 1,788 (12.6%) |
| 65 to 74 Years | 552 (20.5%) | 890 (26.3%) |
| 75 Years and over | 708 (47.1%) | 872 (35.8%) |
Disability Class: Self-Care Difficulty
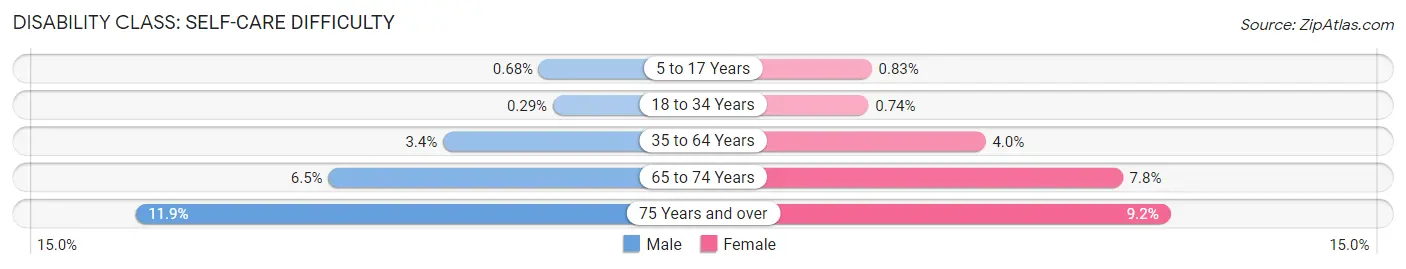
| Age Bracket | Male | Female |
| 5 to 17 Years | 48 (0.7%) | 56 (0.8%) |
| 18 to 34 Years | 30 (0.3%) | 83 (0.7%) |
| 35 to 64 Years | 424 (3.4%) | 566 (4.0%) |
| 65 to 74 Years | 176 (6.5%) | 265 (7.8%) |
| 75 Years and over | 179 (11.9%) | 223 (9.1%) |
Technology Access in Jonesboro
Computing Device Access in Jonesboro
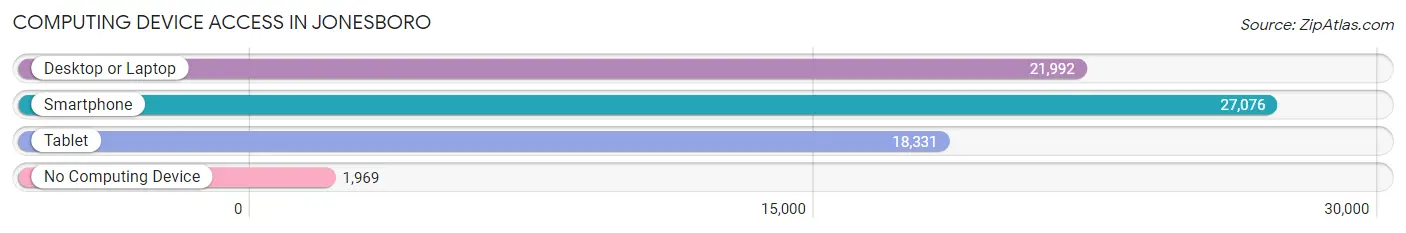
| Device Type | # Households | % Households |
| Desktop or Laptop | 21,992 | 72.9% |
| Smartphone | 27,076 | 89.7% |
| Tablet | 18,331 | 60.7% |
| No Computing Device | 1,969 | 6.5% |
| Total | 30,187 | 100.0% |
Internet Access in Jonesboro
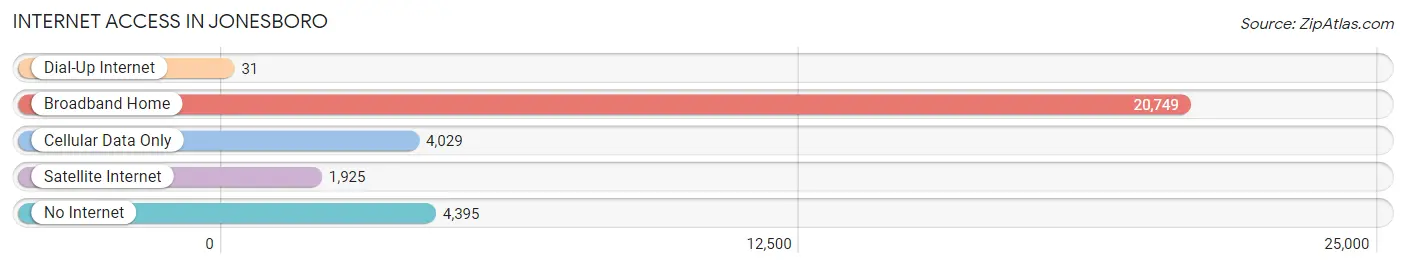
| Internet Type | # Households | % Households |
| Dial-Up Internet | 31 | 0.1% |
| Broadband Home | 20,749 | 68.7% |
| Cellular Data Only | 4,029 | 13.4% |
| Satellite Internet | 1,925 | 6.4% |
| No Internet | 4,395 | 14.6% |
| Total | 30,187 | 100.0% |
Jonesboro Summary
Jonesboro, Arkansas is a city located in Craighead County in the northeastern part of the state. It is the fifth-largest city in Arkansas and the county seat of Craighead County. The city is located in the Arkansas Delta region and is the principal city of the Jonesboro Metropolitan Statistical Area, which is home to over 121,000 people.
History
Jonesboro was founded in 1859 by William A. Jones, who named the city after himself. The city was incorporated in 1868 and was the first city in Craighead County. During the Civil War, Jonesboro was the site of the Battle of Jonesboro, which was a major victory for the Union Army. After the war, the city experienced a period of growth and development, becoming an important center for cotton production and processing.
In the late 19th century, Jonesboro was a major stop on the St. Louis, Iron Mountain and Southern Railway. The city was also home to a number of educational institutions, including Arkansas State University, which was founded in 1909.
Geography
Jonesboro is located in the Arkansas Delta region, which is characterized by flat terrain and fertile soil. The city is situated at the confluence of the St. Francis and Cache Rivers. The city is located in the foothills of the Ozark Mountains and is surrounded by a number of lakes and rivers.
The climate in Jonesboro is humid subtropical, with hot, humid summers and mild winters. The average annual temperature is around 64°F (18°C). The city receives an average of 48 inches (122 cm) of precipitation per year.
Economy
Jonesboro is an important economic center in the region. The city is home to a number of major employers, including St. Bernards Medical Center, Arkansas State University, and the Jonesboro Regional Chamber of Commerce. The city is also home to a number of manufacturing companies, including Emerson Electric, which produces electric motors and generators.
The city is also home to a number of retail stores, restaurants, and other businesses. The city is served by the Jonesboro Municipal Airport, which provides air service to the region.
Demographics
As of the 2010 census, the population of Jonesboro was 67,263. The racial makeup of the city was 73.3% White, 21.2% African American, 0.5% Native American, 1.3% Asian, 0.1% Pacific Islander, and 3.6% from other races. The median household income was $37,845, and the median family income was $45,919.
Jonesboro is home to a number of religious institutions, including Baptist, Methodist, Presbyterian, and Catholic churches. The city is also home to a number of cultural institutions, including the Arkansas State University Museum, the Jonesboro Arts Center, and the Jonesboro Symphony Orchestra.
Conclusion
Jonesboro, Arkansas is a city located in Craighead County in the northeastern part of the state. It is the fifth-largest city in Arkansas and the county seat of Craighead County. The city is located in the Arkansas Delta region and is the principal city of the Jonesboro Metropolitan Statistical Area, which is home to over 121,000 people. Jonesboro was founded in 1859 and has since become an important economic center in the region. The city is home to a number of major employers, including St. Bernards Medical Center, Arkansas State University, and the Jonesboro Regional Chamber of Commerce. As of the 2010 census, the population of Jonesboro was 67,263. The racial makeup of the city was 73.3% White, 21.2% African American, 0.5% Native American, 1.3% Asian, 0.1% Pacific Islander, and 3.6% from other races. The median household income was $37,845, and the median family income was $45,919. Jonesboro is home to a number of religious institutions, cultural institutions, and other businesses.
Common Questions
What is Per Capita Income in Jonesboro?
Per Capita income in Jonesboro is $31,108.
What is the Median Family Income in Jonesboro?
Median Family Income in Jonesboro is $68,698.
What is the Median Household income in Jonesboro?
Median Household Income in Jonesboro is $51,124.
What is Income or Wage Gap in Jonesboro?
Income or Wage Gap in Jonesboro is 27.3%.
Women in Jonesboro earn 72.7 cents for every dollar earned by a man.
What is Family Income Deficit in Jonesboro?
Family Income Deficit in Jonesboro is $12,269.
Families that are below poverty line in Jonesboro earn $12,269 less on average than the poverty threshold level.
What is Inequality or Gini Index in Jonesboro?
Inequality or Gini Index in Jonesboro is 0.52.
What is the Total Population of Jonesboro?
Total Population of Jonesboro is 78,379.
What is the Total Male Population of Jonesboro?
Total Male Population of Jonesboro is 37,463.
What is the Total Female Population of Jonesboro?
Total Female Population of Jonesboro is 40,916.
What is the Ratio of Males per 100 Females in Jonesboro?
There are 91.56 Males per 100 Females in Jonesboro.
What is the Ratio of Females per 100 Males in Jonesboro?
There are 109.22 Females per 100 Males in Jonesboro.
What is the Median Population Age in Jonesboro?
Median Population Age in Jonesboro is 33.8 Years.
What is the Average Family Size in Jonesboro
Average Family Size in Jonesboro is 3.1 People.
What is the Average Household Size in Jonesboro
Average Household Size in Jonesboro is 2.5 People.
How Large is the Labor Force in Jonesboro?
There are 38,698 People in the Labor Forcein in Jonesboro.
What is the Percentage of People in the Labor Force in Jonesboro?
63.0% of People are in the Labor Force in Jonesboro.
What is the Unemployment Rate in Jonesboro?
Unemployment Rate in Jonesboro is 6.7%.