Zip Codes with the Highest Percentage of Population Employed in Legal Services & Support in Bella Vista, AR
RELATED REPORTS & OPTIONS
Legal Services & Support
Bella Vista
Compare Zip Codes
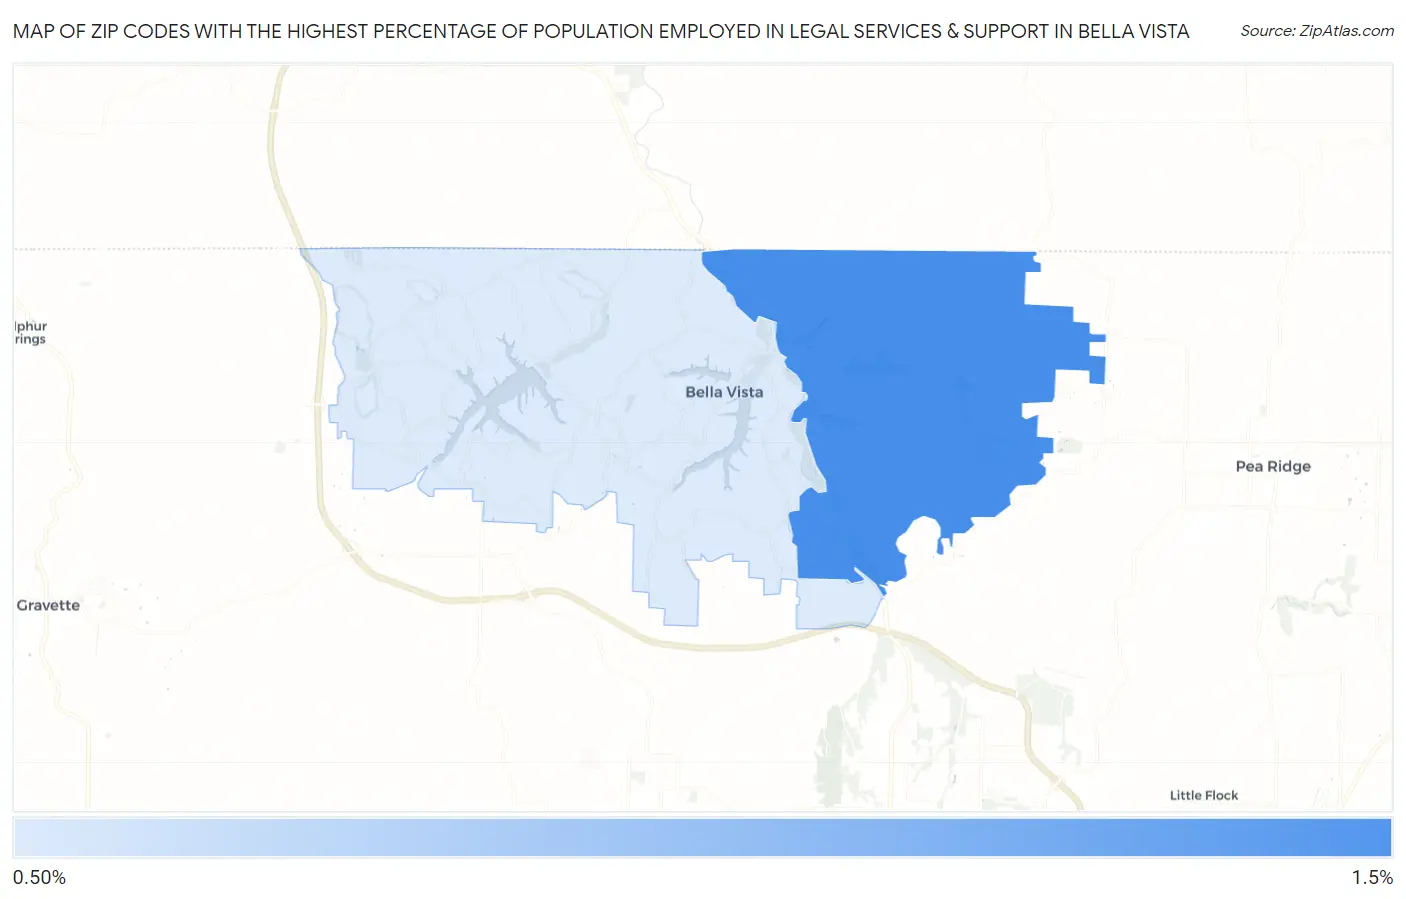
Map of Zip Codes with the Highest Percentage of Population Employed in Legal Services & Support in Bella Vista
0.93%
1.2%
Zip Codes with the Highest Percentage of Population Employed in Legal Services & Support in Bella Vista, AR
| Zip Code | % Employed | vs State | vs National | |
| 1. | 72714 | 1.2% | 0.79%(+0.420)#56 | 1.2%(+0.022)#6,456 |
| 2. | 72715 | 0.93% | 0.79%(+0.150)#76 | 1.2%(-0.249)#8,310 |
1
Common Questions
What are the Top Zip Codes with the Highest Percentage of Population Employed in Legal Services & Support in Bella Vista, AR?
Top Zip Codes with the Highest Percentage of Population Employed in Legal Services & Support in Bella Vista, AR are:
What zip code has the Highest Percentage of Population Employed in Legal Services & Support in Bella Vista, AR?
72714 has the Highest Percentage of Population Employed in Legal Services & Support in Bella Vista, AR with 1.2%.
What is the Percentage of Population Employed in Legal Services & Support in Bella Vista, AR?
Percentage of Population Employed in Legal Services & Support in Bella Vista is 1.1%.
What is the Percentage of Population Employed in Legal Services & Support in Arkansas?
Percentage of Population Employed in Legal Services & Support in Arkansas is 0.79%.
What is the Percentage of Population Employed in Legal Services & Support in the United States?
Percentage of Population Employed in Legal Services & Support in the United States is 1.2%.