Zip Codes with the Highest Percentage of Population Employed in Legal Services & Support in Hot Springs National Park, AR
RELATED REPORTS & OPTIONS
Legal Services & Support
Hot Springs National Park
Compare Zip Codes
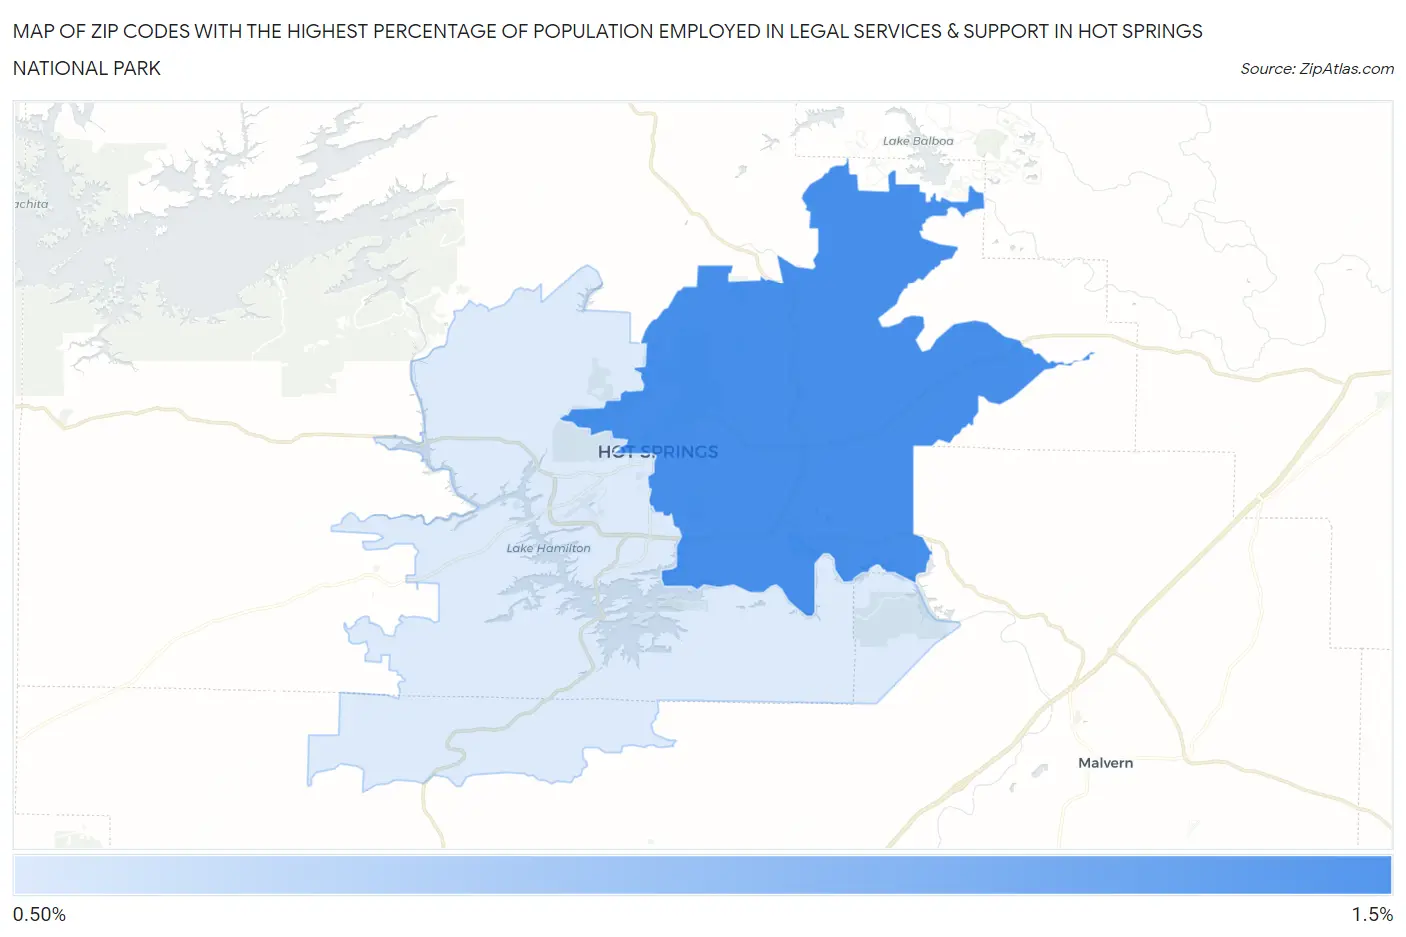
Map of Zip Codes with the Highest Percentage of Population Employed in Legal Services & Support in Hot Springs National Park
0.92%
1.3%
Zip Codes with the Highest Percentage of Population Employed in Legal Services & Support in Hot Springs National Park, AR
| Zip Code | % Employed | vs State | vs National | |
| 1. | 71901 | 1.3% | 0.79%(+0.497)#50 | 1.2%(+0.099)#6,027 |
| 2. | 71913 | 0.92% | 0.79%(+0.136)#79 | 1.2%(-0.263)#8,422 |
1
Common Questions
What are the Top Zip Codes with the Highest Percentage of Population Employed in Legal Services & Support in Hot Springs National Park, AR?
Top Zip Codes with the Highest Percentage of Population Employed in Legal Services & Support in Hot Springs National Park, AR are:
What zip code has the Highest Percentage of Population Employed in Legal Services & Support in Hot Springs National Park, AR?
71901 has the Highest Percentage of Population Employed in Legal Services & Support in Hot Springs National Park, AR with 1.3%.
What is the Percentage of Population Employed in Legal Services & Support in Arkansas?
Percentage of Population Employed in Legal Services & Support in Arkansas is 0.79%.
What is the Percentage of Population Employed in Legal Services & Support in the United States?
Percentage of Population Employed in Legal Services & Support in the United States is 1.2%.