Horseshoe Lake, AR Map & Demographics
Horseshoe Lake Map
Horseshoe Lake Overview
$35,029
PER CAPITA INCOME
$67,500
AVG FAMILY INCOME
$45,795
AVG HOUSEHOLD INCOME
5.8%
WAGE / INCOME GAP [ % ]
94.2¢/ $1
WAGE / INCOME GAP [ $ ]
0.42
INEQUALITY / GINI INDEX
393
TOTAL POPULATION
211
MALE POPULATION
182
FEMALE POPULATION
115.93
MALES / 100 FEMALES
86.26
FEMALES / 100 MALES
59.0
MEDIAN AGE
2.3
AVG FAMILY SIZE
1.8
AVG HOUSEHOLD SIZE
222
LABOR FORCE [ PEOPLE ]
58.1%
PERCENT IN LABOR FORCE
7.7%
UNEMPLOYMENT RATE
Horseshoe Lake Area Codes
Income in Horseshoe Lake
Income Overview in Horseshoe Lake
Per Capita Income in Horseshoe Lake is $35,029, while median incomes of families and households are $67,500 and $45,795 respectively.
| Characteristic | Number | Measure |
| Per Capita Income | 393 | $35,029 |
| Median Family Income | 108 | $67,500 |
| Mean Family Income | 108 | $76,964 |
| Median Household Income | 211 | $45,795 |
| Mean Household Income | 211 | $61,951 |
| Income Deficit | 108 | $0 |
| Wage / Income Gap (%) | 393 | 5.81% |
| Wage / Income Gap ($) | 393 | 94.19¢ per $1 |
| Gini / Inequality Index | 393 | 0.42 |
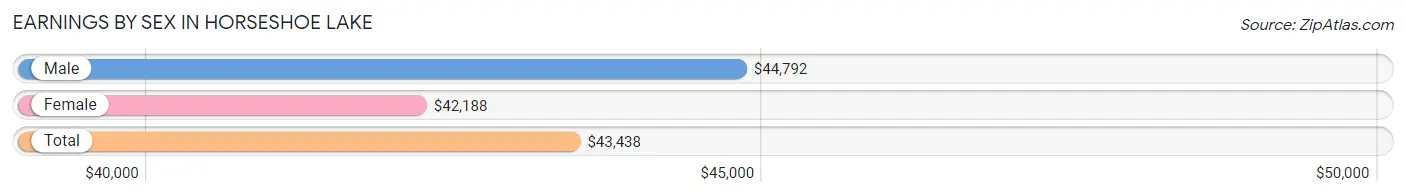
Earnings by Sex in Horseshoe Lake
Average Earnings in Horseshoe Lake are $43,438, $44,792 for men and $42,188 for women, a difference of 5.8%.
| Sex | Number | Average Earnings |
| Male | 133 (59.6%) | $44,792 |
| Female | 90 (40.4%) | $42,188 |
| Total | 223 (100.0%) | $43,438 |
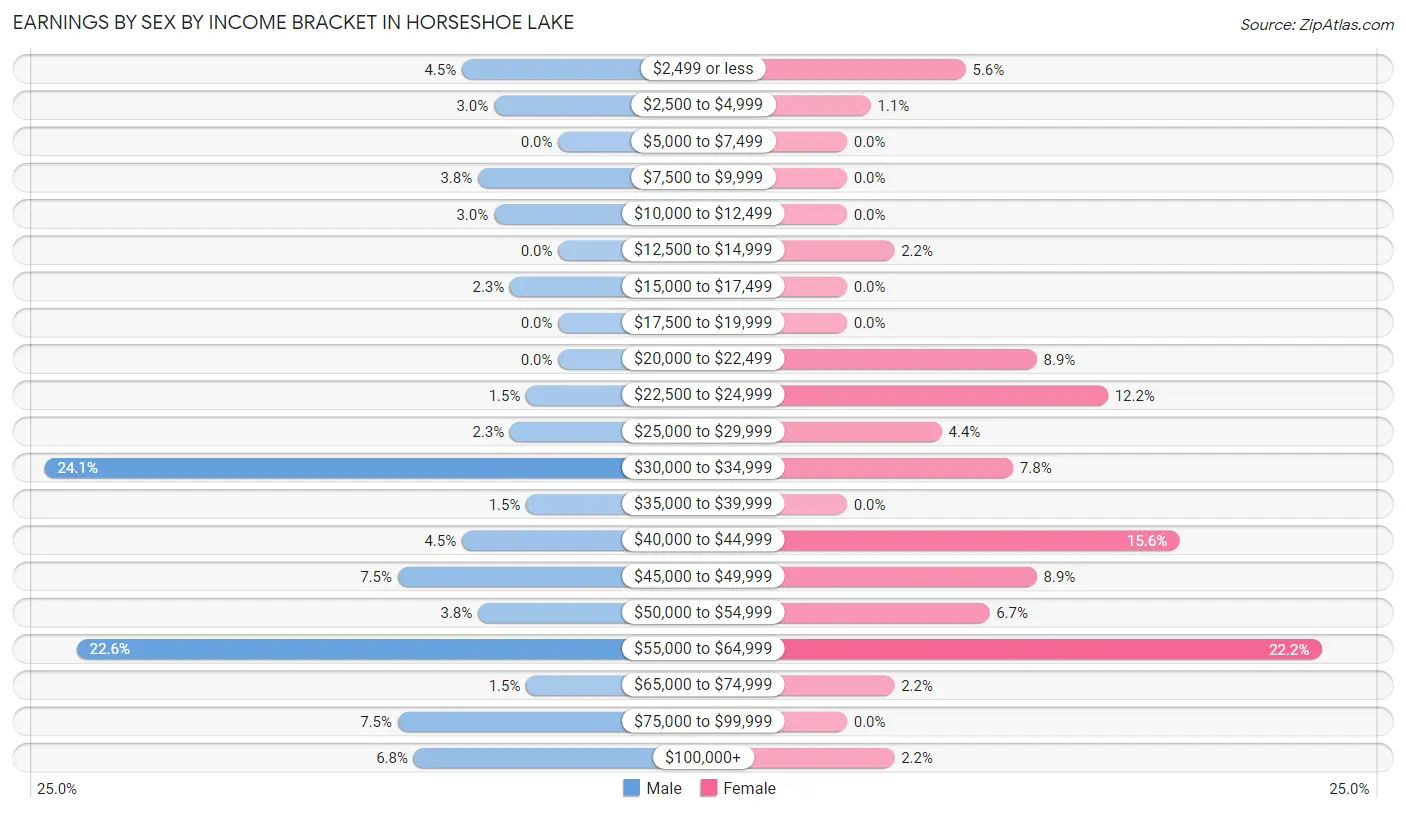
Earnings by Sex by Income Bracket in Horseshoe Lake
The most common earnings brackets in Horseshoe Lake are $30,000 to $34,999 for men (32 | 24.1%) and $55,000 to $64,999 for women (20 | 22.2%).
| Income | Male | Female |
| $2,499 or less | 6 (4.5%) | 5 (5.6%) |
| $2,500 to $4,999 | 4 (3.0%) | 1 (1.1%) |
| $5,000 to $7,499 | 0 (0.0%) | 0 (0.0%) |
| $7,500 to $9,999 | 5 (3.8%) | 0 (0.0%) |
| $10,000 to $12,499 | 4 (3.0%) | 0 (0.0%) |
| $12,500 to $14,999 | 0 (0.0%) | 2 (2.2%) |
| $15,000 to $17,499 | 3 (2.3%) | 0 (0.0%) |
| $17,500 to $19,999 | 0 (0.0%) | 0 (0.0%) |
| $20,000 to $22,499 | 0 (0.0%) | 8 (8.9%) |
| $22,500 to $24,999 | 2 (1.5%) | 11 (12.2%) |
| $25,000 to $29,999 | 3 (2.3%) | 4 (4.4%) |
| $30,000 to $34,999 | 32 (24.1%) | 7 (7.8%) |
| $35,000 to $39,999 | 2 (1.5%) | 0 (0.0%) |
| $40,000 to $44,999 | 6 (4.5%) | 14 (15.6%) |
| $45,000 to $49,999 | 10 (7.5%) | 8 (8.9%) |
| $50,000 to $54,999 | 5 (3.8%) | 6 (6.7%) |
| $55,000 to $64,999 | 30 (22.6%) | 20 (22.2%) |
| $65,000 to $74,999 | 2 (1.5%) | 2 (2.2%) |
| $75,000 to $99,999 | 10 (7.5%) | 0 (0.0%) |
| $100,000+ | 9 (6.8%) | 2 (2.2%) |
| Total | 133 (100.0%) | 90 (100.0%) |
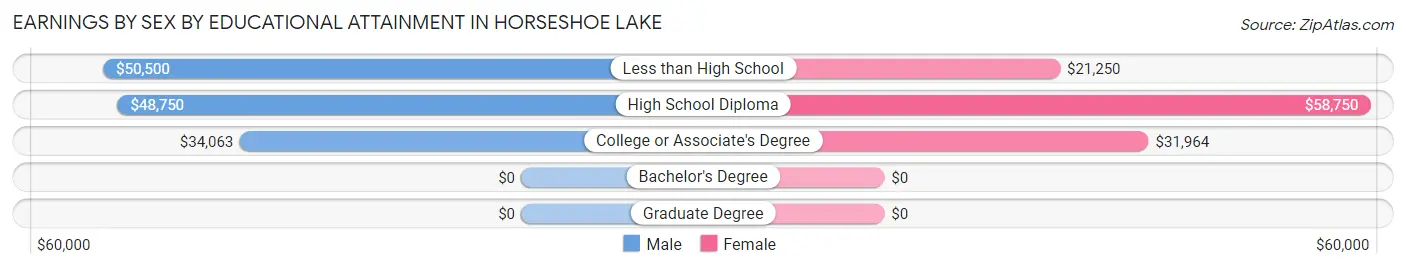
Earnings by Sex by Educational Attainment in Horseshoe Lake
Average earnings in Horseshoe Lake are $45,156 for men and $42,500 for women, a difference of 5.9%. Men with an educational attainment of less than high school enjoy the highest average annual earnings of $50,500, while those with college or associate's degree education earn the least with $34,063. Women with an educational attainment of high school diploma earn the most with the average annual earnings of $58,750, while those with less than high school education have the smallest earnings of $21,250.
| Educational Attainment | Male Income | Female Income |
| Less than High School | $50,500 | $21,250 |
| High School Diploma | $48,750 | $58,750 |
| College or Associate's Degree | $34,063 | $31,964 |
| Bachelor's Degree | - | - |
| Graduate Degree | - | - |
| Total | $45,156 | $42,500 |
Family Income in Horseshoe Lake
Family Income Brackets in Horseshoe Lake
According to the Horseshoe Lake family income data, there are 19 families falling into the $25,000 to $34,999 income range, which is the most common income bracket and makes up 17.6% of all families.
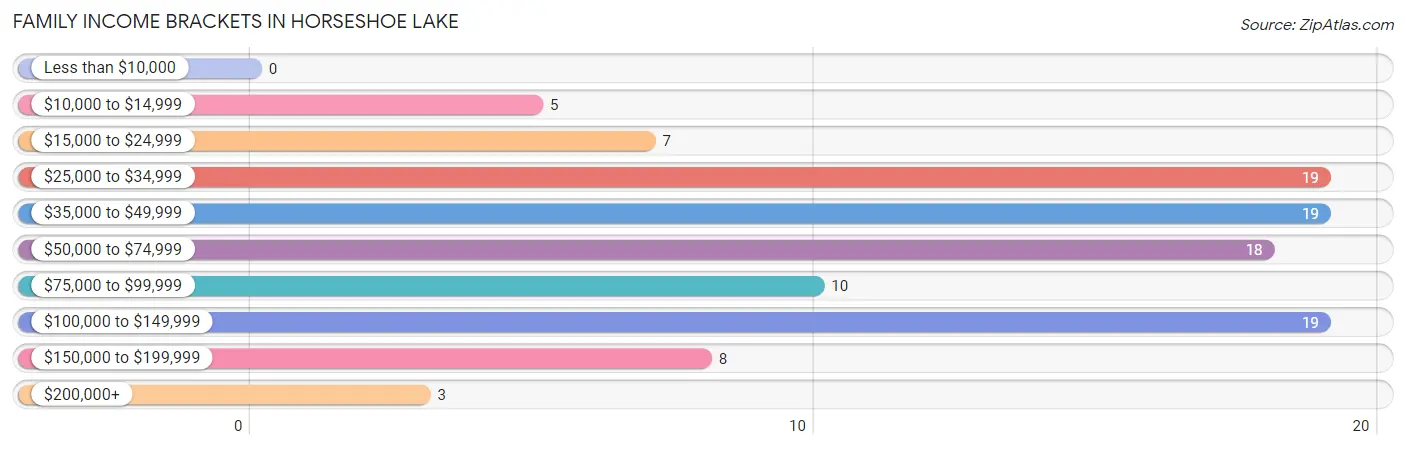
| Income Bracket | # Families | % Families |
| Less than $10,000 | 0 | 0.0% |
| $10,000 to $14,999 | 5 | 4.6% |
| $15,000 to $24,999 | 7 | 6.5% |
| $25,000 to $34,999 | 19 | 17.6% |
| $35,000 to $49,999 | 19 | 17.6% |
| $50,000 to $74,999 | 18 | 16.7% |
| $75,000 to $99,999 | 10 | 9.3% |
| $100,000 to $149,999 | 19 | 17.6% |
| $150,000 to $199,999 | 8 | 7.4% |
| $200,000+ | 3 | 2.8% |
Family Income by Famaliy Size in Horseshoe Lake
2-person families (80 | 74.1%) account for the highest median family income in Horseshoe Lake with $58,750 per family, while 2-person families (80 | 74.1%) have the highest median income of $29,375 per family member.
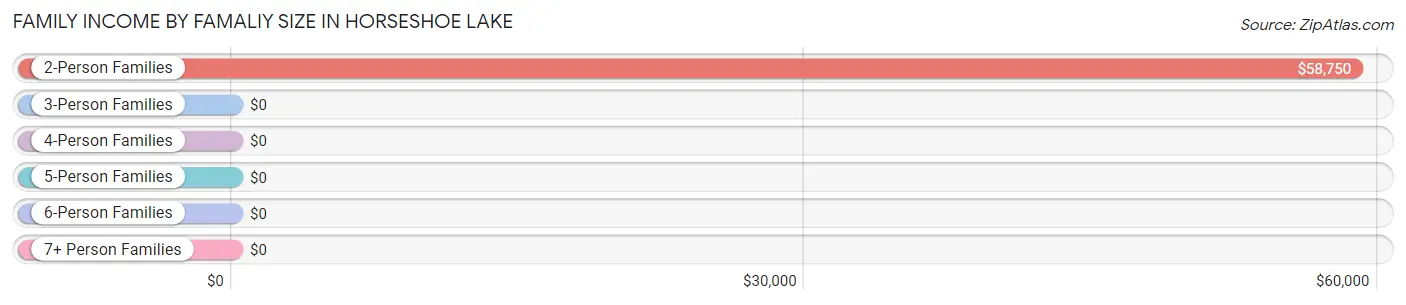
| Income Bracket | # Families | Median Income |
| 2-Person Families | 80 (74.1%) | $58,750 |
| 3-Person Families | 27 (25.0%) | $0 |
| 4-Person Families | 1 (0.9%) | $0 |
| 5-Person Families | 0 (0.0%) | $0 |
| 6-Person Families | 0 (0.0%) | $0 |
| 7+ Person Families | 0 (0.0%) | $0 |
| Total | 108 (100.0%) | $67,500 |
Family Income by Number of Earners in Horseshoe Lake
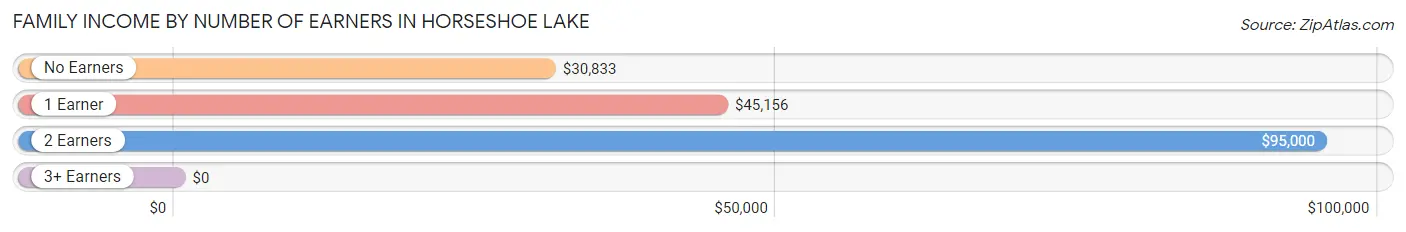
| Number of Earners | # Families | Median Income |
| No Earners | 26 (24.1%) | $30,833 |
| 1 Earner | 43 (39.8%) | $45,156 |
| 2 Earners | 36 (33.3%) | $95,000 |
| 3+ Earners | 3 (2.8%) | $0 |
| Total | 108 (100.0%) | $67,500 |
Household Income in Horseshoe Lake
Household Income Brackets in Horseshoe Lake
With 37 households falling in the category, the $25,000 to $34,999 income range is the most frequent in Horseshoe Lake, accounting for 17.5% of all households. In contrast, only 3 households (1.4%) fall into the $200,000+ income bracket, making it the least populous group.
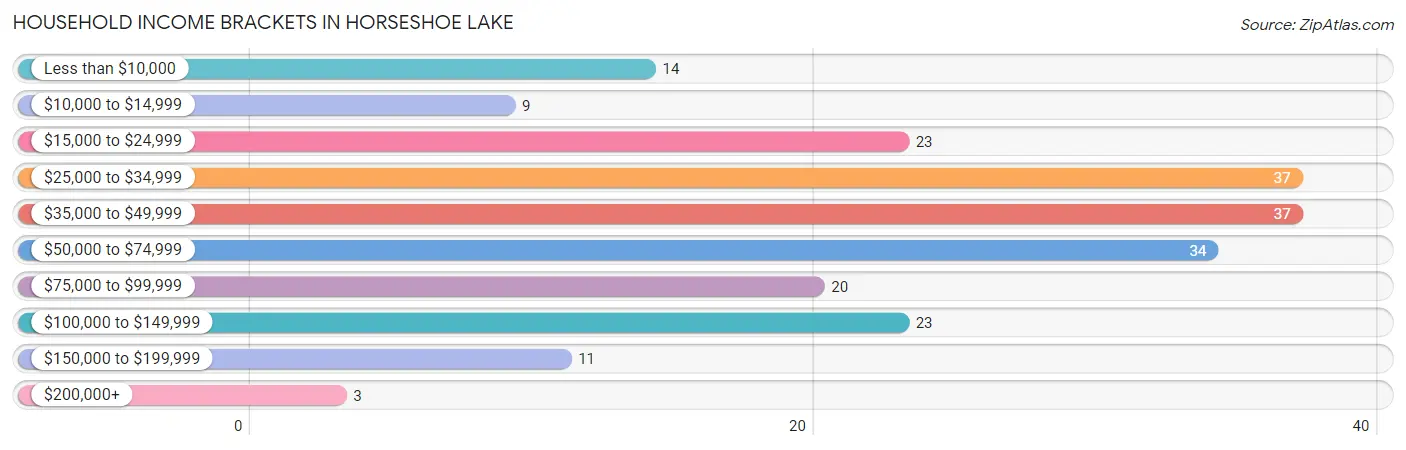
| Income Bracket | # Households | % Households |
| Less than $10,000 | 14 | 6.6% |
| $10,000 to $14,999 | 9 | 4.3% |
| $15,000 to $24,999 | 23 | 10.9% |
| $25,000 to $34,999 | 37 | 17.5% |
| $35,000 to $49,999 | 37 | 17.5% |
| $50,000 to $74,999 | 34 | 16.1% |
| $75,000 to $99,999 | 20 | 9.5% |
| $100,000 to $149,999 | 23 | 10.9% |
| $150,000 to $199,999 | 11 | 5.2% |
| $200,000+ | 3 | 1.4% |
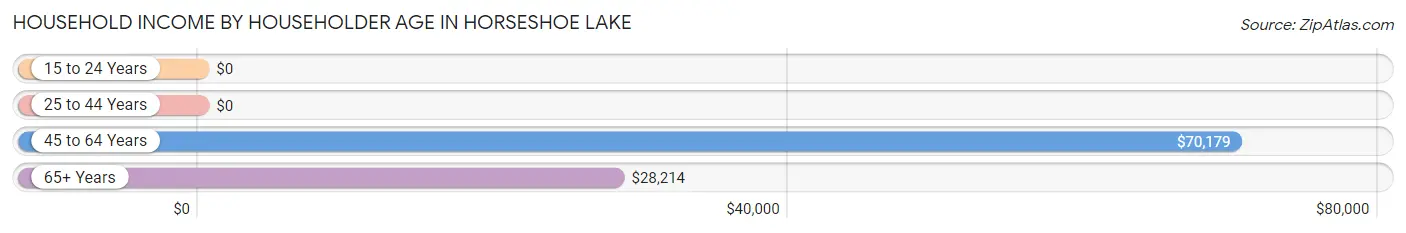
Household Income by Householder Age in Horseshoe Lake
The median household income in Horseshoe Lake is $45,795, with the highest median household income of $70,179 found in the 45 to 64 years age bracket for the primary householder. A total of 99 households (46.9%) fall into this category.
| Income Bracket | # Households | Median Income |
| 15 to 24 Years | 0 (0.0%) | $0 |
| 25 to 44 Years | 30 (14.2%) | $0 |
| 45 to 64 Years | 99 (46.9%) | $70,179 |
| 65+ Years | 82 (38.9%) | $28,214 |
| Total | 211 (100.0%) | $45,795 |
Poverty in Horseshoe Lake
Income Below Poverty by Sex and Age in Horseshoe Lake
With 10.9% poverty level for males and 13.2% for females among the residents of Horseshoe Lake, under 5 year old males and 75 year old and over females are the most vulnerable to poverty, with 3 males (60.0%) and 10 females (38.5%) in their respective age groups living below the poverty level.
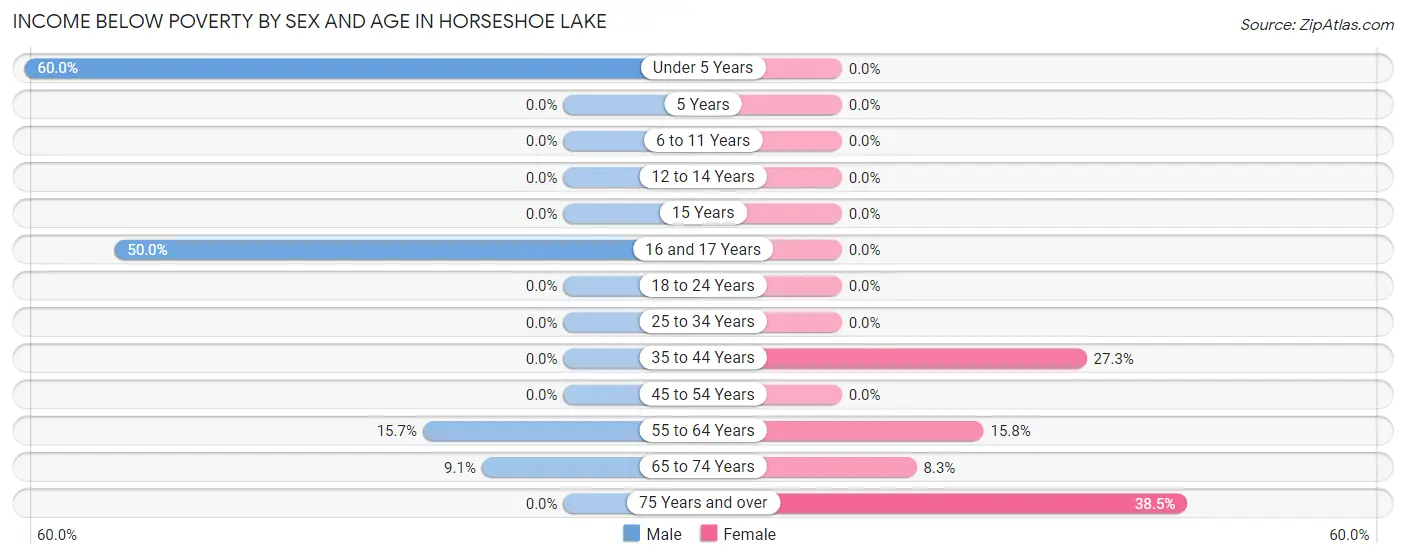
| Age Bracket | Male | Female |
| Under 5 Years | 3 (60.0%) | 0 (0.0%) |
| 5 Years | 0 (0.0%) | 0 (0.0%) |
| 6 to 11 Years | 0 (0.0%) | 0 (0.0%) |
| 12 to 14 Years | 0 (0.0%) | 0 (0.0%) |
| 15 Years | 0 (0.0%) | 0 (0.0%) |
| 16 and 17 Years | 4 (50.0%) | 0 (0.0%) |
| 18 to 24 Years | 0 (0.0%) | 0 (0.0%) |
| 25 to 34 Years | 0 (0.0%) | 0 (0.0%) |
| 35 to 44 Years | 0 (0.0%) | 3 (27.3%) |
| 45 to 54 Years | 0 (0.0%) | 0 (0.0%) |
| 55 to 64 Years | 13 (15.7%) | 9 (15.8%) |
| 65 to 74 Years | 3 (9.1%) | 2 (8.3%) |
| 75 Years and over | 0 (0.0%) | 10 (38.5%) |
| Total | 23 (10.9%) | 24 (13.2%) |
Income Above Poverty by Sex and Age in Horseshoe Lake
According to the poverty statistics in Horseshoe Lake, males aged 12 to 14 years and females aged under 5 years are the age groups that are most secure financially, with 100.0% of males and 100.0% of females in these age groups living above the poverty line.
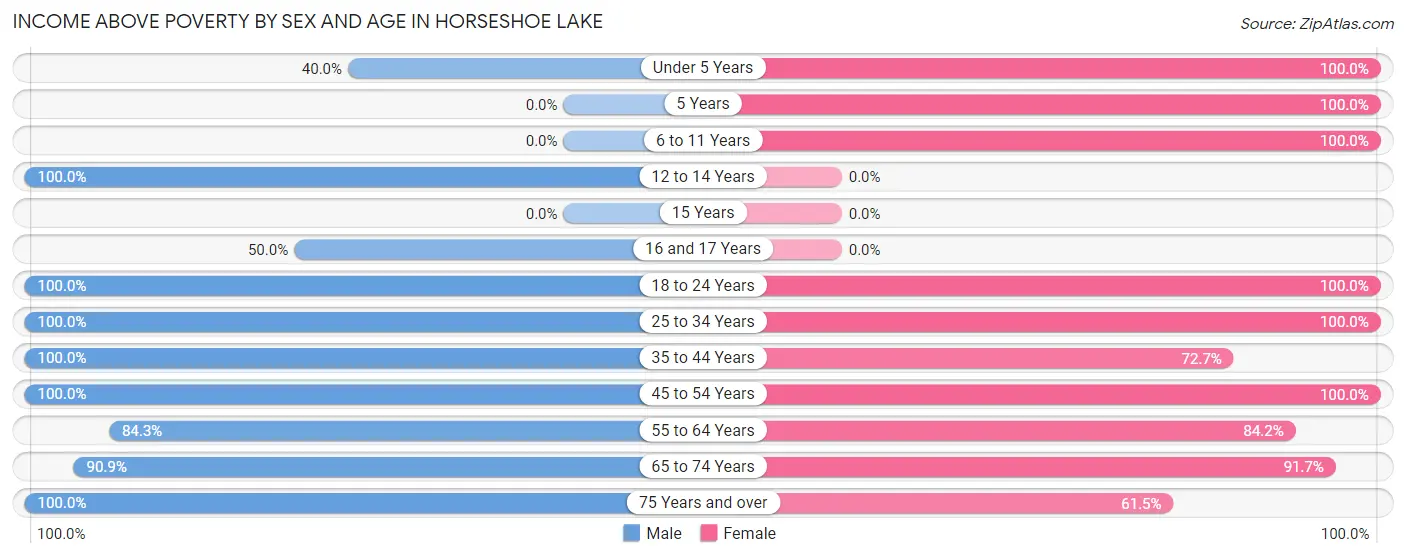
| Age Bracket | Male | Female |
| Under 5 Years | 2 (40.0%) | 2 (100.0%) |
| 5 Years | 0 (0.0%) | 1 (100.0%) |
| 6 to 11 Years | 0 (0.0%) | 1 (100.0%) |
| 12 to 14 Years | 2 (100.0%) | 0 (0.0%) |
| 15 Years | 0 (0.0%) | 0 (0.0%) |
| 16 and 17 Years | 4 (50.0%) | 0 (0.0%) |
| 18 to 24 Years | 5 (100.0%) | 10 (100.0%) |
| 25 to 34 Years | 15 (100.0%) | 15 (100.0%) |
| 35 to 44 Years | 10 (100.0%) | 8 (72.7%) |
| 45 to 54 Years | 24 (100.0%) | 35 (100.0%) |
| 55 to 64 Years | 70 (84.3%) | 48 (84.2%) |
| 65 to 74 Years | 30 (90.9%) | 22 (91.7%) |
| 75 Years and over | 26 (100.0%) | 16 (61.5%) |
| Total | 188 (89.1%) | 158 (86.8%) |
Income Below Poverty Among Married-Couple Families in Horseshoe Lake
The poverty statistics for married-couple families in Horseshoe Lake show that 5.9% or 5 of the total 84 families live below the poverty line. Families with no children have the highest poverty rate of 6.4%, comprising of 5 families. On the other hand, families with 1 or 2 children have the lowest poverty rate of 0.0%, which includes 0 families.
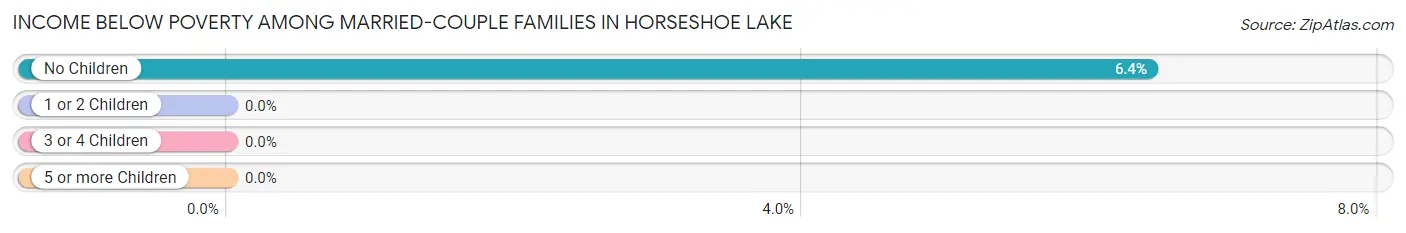
| Children | Above Poverty | Below Poverty |
| No Children | 73 (93.6%) | 5 (6.4%) |
| 1 or 2 Children | 6 (100.0%) | 0 (0.0%) |
| 3 or 4 Children | 0 (0.0%) | 0 (0.0%) |
| 5 or more Children | 0 (0.0%) | 0 (0.0%) |
| Total | 79 (94.1%) | 5 (5.9%) |
Income Below Poverty Among Single-Parent Households in Horseshoe Lake
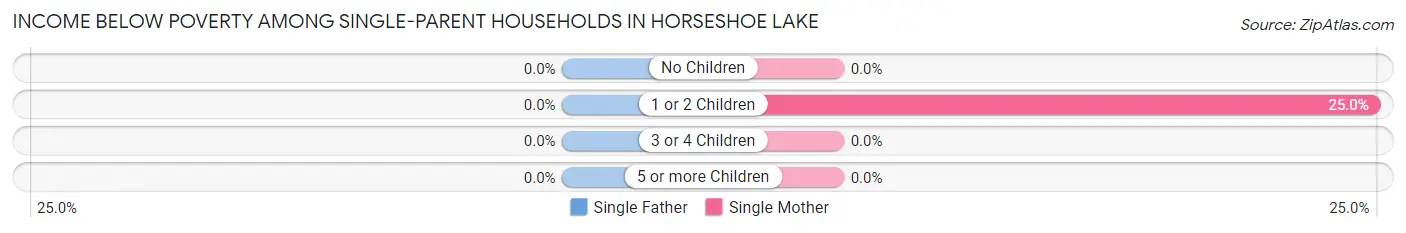
| Children | Single Father | Single Mother |
| No Children | 0 (0.0%) | 0 (0.0%) |
| 1 or 2 Children | 0 (0.0%) | 2 (25.0%) |
| 3 or 4 Children | 0 (0.0%) | 0 (0.0%) |
| 5 or more Children | 0 (0.0%) | 0 (0.0%) |
| Total | 0 (0.0%) | 2 (9.1%) |
Income Below Poverty Among Married-Couple vs Single-Parent Households in Horseshoe Lake
The poverty data for Horseshoe Lake shows that 5 of the married-couple family households (5.9%) and 2 of the single-parent households (8.3%) are living below the poverty level. Within the married-couple family households, those with no children have the highest poverty rate, with 5 households (6.4%) falling below the poverty line. Among the single-parent households, those with 1 or 2 children have the highest poverty rate, with 2 household (25.0%) living below poverty.
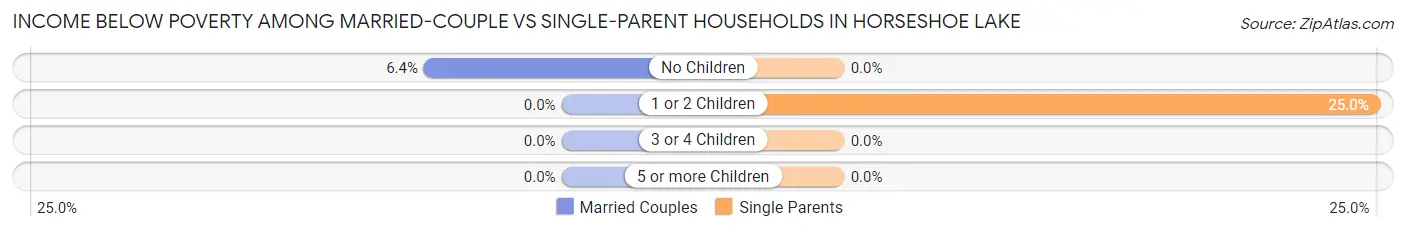
| Children | Married-Couple Families | Single-Parent Households |
| No Children | 5 (6.4%) | 0 (0.0%) |
| 1 or 2 Children | 0 (0.0%) | 2 (25.0%) |
| 3 or 4 Children | 0 (0.0%) | 0 (0.0%) |
| 5 or more Children | 0 (0.0%) | 0 (0.0%) |
| Total | 5 (5.9%) | 2 (8.3%) |
Race in Horseshoe Lake
The most populous races in Horseshoe Lake are White / Caucasian (316 | 80.4%), Two or more Races (58 | 14.8%), and Black / African American (13 | 3.3%).
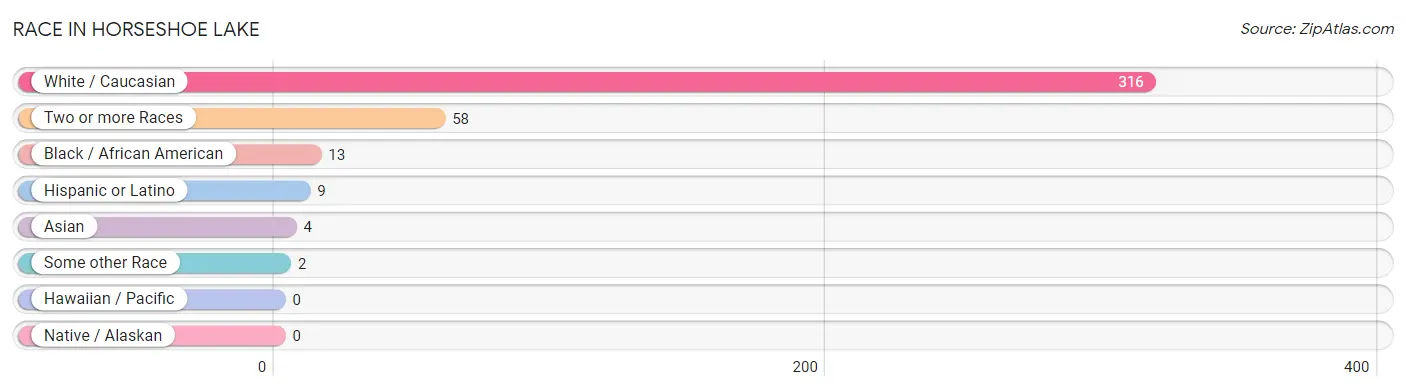
| Race | # Population | % Population |
| Asian | 4 | 1.0% |
| Black / African American | 13 | 3.3% |
| Hawaiian / Pacific | 0 | 0.0% |
| Hispanic or Latino | 9 | 2.3% |
| Native / Alaskan | 0 | 0.0% |
| White / Caucasian | 316 | 80.4% |
| Two or more Races | 58 | 14.8% |
| Some other Race | 2 | 0.5% |
| Total | 393 | 100.0% |
Ancestry in Horseshoe Lake
The most populous ancestries reported in Horseshoe Lake are American (66 | 16.8%), Irish (55 | 14.0%), English (38 | 9.7%), German (30 | 7.6%), and Cherokee (28 | 7.1%), together accounting for 55.2% of all Horseshoe Lake residents.
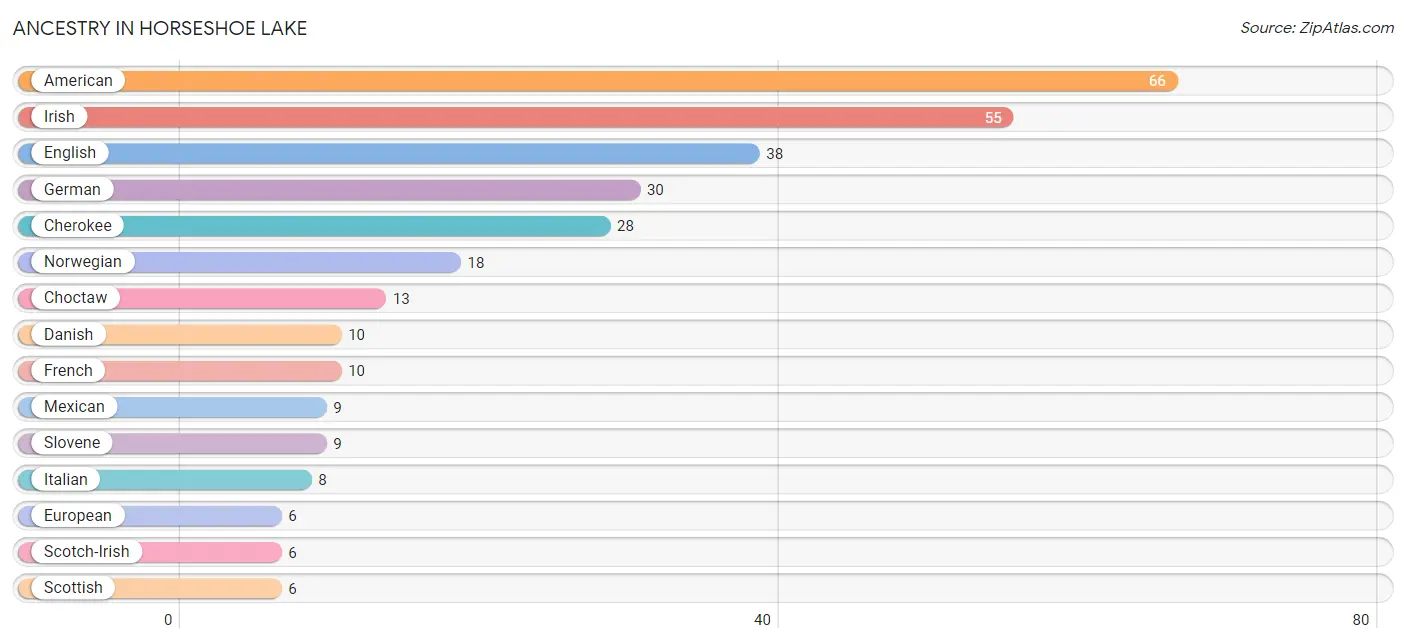
| Ancestry | # Population | % Population |
| American | 66 | 16.8% |
| Cajun | 2 | 0.5% |
| Cherokee | 28 | 7.1% |
| Choctaw | 13 | 3.3% |
| Danish | 10 | 2.5% |
| Dutch | 4 | 1.0% |
| English | 38 | 9.7% |
| European | 6 | 1.5% |
| French | 10 | 2.5% |
| French Canadian | 2 | 0.5% |
| German | 30 | 7.6% |
| Irish | 55 | 14.0% |
| Italian | 8 | 2.0% |
| Korean | 2 | 0.5% |
| Mexican | 9 | 2.3% |
| Norwegian | 18 | 4.6% |
| Polish | 1 | 0.3% |
| Scotch-Irish | 6 | 1.5% |
| Scottish | 6 | 1.5% |
| Slovene | 9 | 2.3% |
| Sri Lankan | 2 | 0.5% | View All 21 Rows |
Immigrants in Horseshoe Lake

| Immigration Origin | # Population | % Population | View All 0 Rows |
Sex and Age in Horseshoe Lake
Sex and Age in Horseshoe Lake
The most populous age groups in Horseshoe Lake are 60 to 64 Years (45 | 21.3%) for men and 60 to 64 Years (31 | 17.0%) for women.
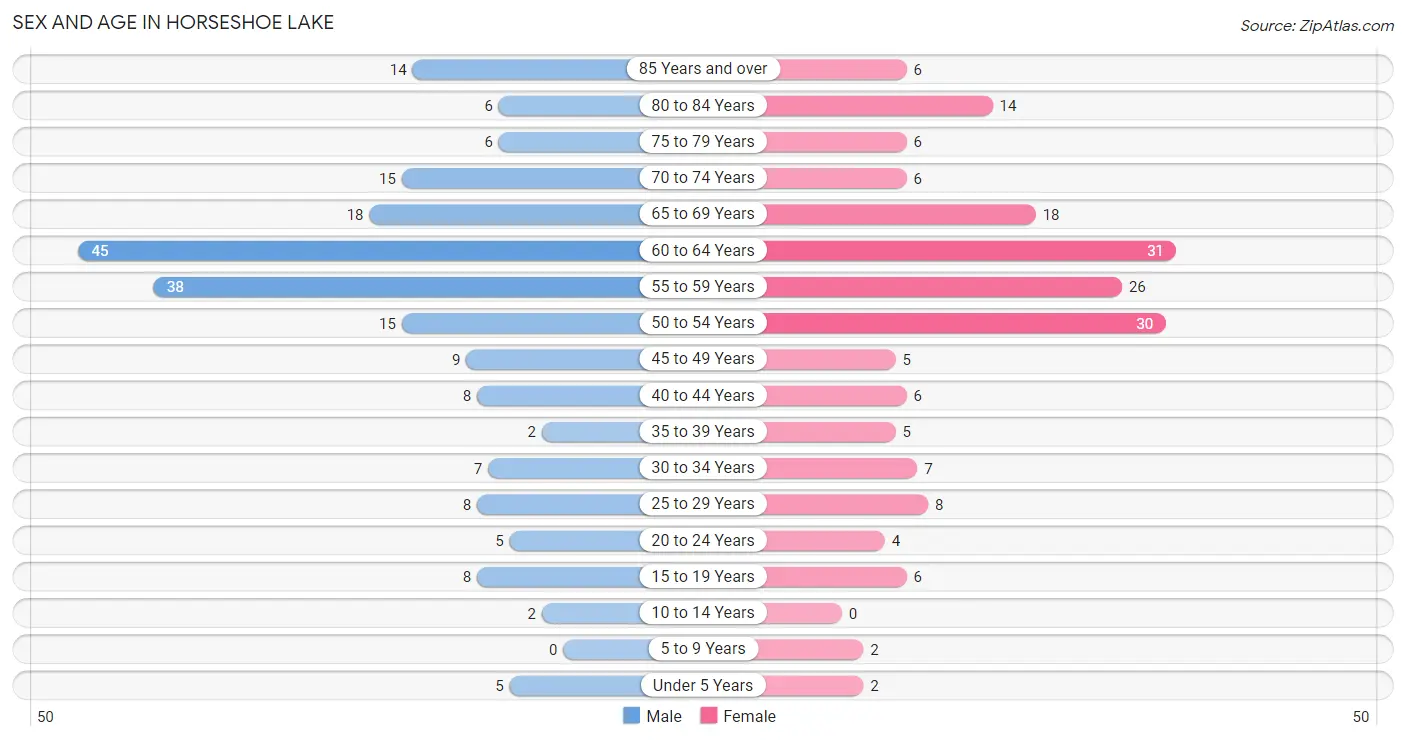
| Age Bracket | Male | Female |
| Under 5 Years | 5 (2.4%) | 2 (1.1%) |
| 5 to 9 Years | 0 (0.0%) | 2 (1.1%) |
| 10 to 14 Years | 2 (0.9%) | 0 (0.0%) |
| 15 to 19 Years | 8 (3.8%) | 6 (3.3%) |
| 20 to 24 Years | 5 (2.4%) | 4 (2.2%) |
| 25 to 29 Years | 8 (3.8%) | 8 (4.4%) |
| 30 to 34 Years | 7 (3.3%) | 7 (3.8%) |
| 35 to 39 Years | 2 (0.9%) | 5 (2.8%) |
| 40 to 44 Years | 8 (3.8%) | 6 (3.3%) |
| 45 to 49 Years | 9 (4.3%) | 5 (2.8%) |
| 50 to 54 Years | 15 (7.1%) | 30 (16.5%) |
| 55 to 59 Years | 38 (18.0%) | 26 (14.3%) |
| 60 to 64 Years | 45 (21.3%) | 31 (17.0%) |
| 65 to 69 Years | 18 (8.5%) | 18 (9.9%) |
| 70 to 74 Years | 15 (7.1%) | 6 (3.3%) |
| 75 to 79 Years | 6 (2.8%) | 6 (3.3%) |
| 80 to 84 Years | 6 (2.8%) | 14 (7.7%) |
| 85 Years and over | 14 (6.6%) | 6 (3.3%) |
| Total | 211 (100.0%) | 182 (100.0%) |
Families and Households in Horseshoe Lake
Median Family Size in Horseshoe Lake
The median family size in Horseshoe Lake is 2.29 persons per family, with single male/father families (2 | 1.8%) accounting for the largest median family size of 2.5 persons per family. On the other hand, married-couple families (84 | 77.8%) represent the smallest median family size with 2.24 persons per family.
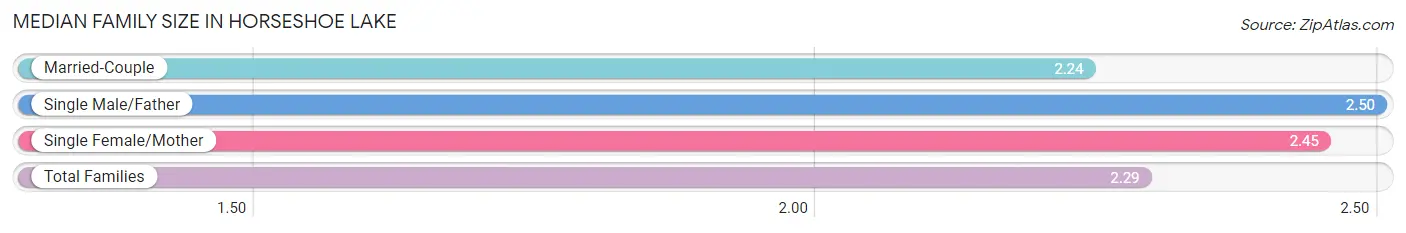
| Family Type | # Families | Family Size |
| Married-Couple | 84 (77.8%) | 2.24 |
| Single Male/Father | 2 (1.8%) | 2.50 |
| Single Female/Mother | 22 (20.4%) | 2.45 |
| Total Families | 108 (100.0%) | 2.29 |
Median Household Size in Horseshoe Lake
The median household size in Horseshoe Lake is 1.80 persons per household, with single female/mother households (22 | 10.4%) accounting for the largest median household size of 2.73 persons per household. non-family households (103 | 48.8%) represent the smallest median household size with 1.22 persons per household.
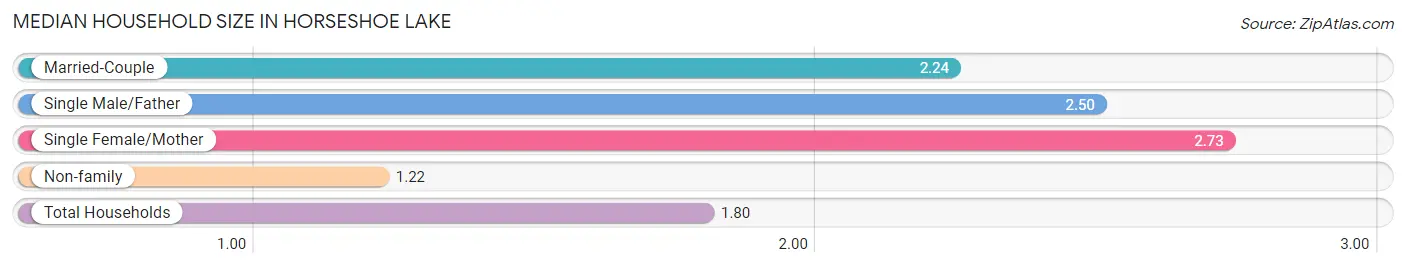
| Household Type | # Households | Household Size |
| Married-Couple | 84 (39.8%) | 2.24 |
| Single Male/Father | 2 (0.9%) | 2.50 |
| Single Female/Mother | 22 (10.4%) | 2.73 |
| Non-family | 103 (48.8%) | 1.22 |
| Total Households | 211 (100.0%) | 1.80 |
Household Size by Marriage Status in Horseshoe Lake
Out of a total of 211 households in Horseshoe Lake, 108 (51.2%) are family households, while 103 (48.8%) are nonfamily households. The most numerous type of family households are 2-person households, comprising 80, and the most common type of nonfamily households are 1-person households, comprising 80.
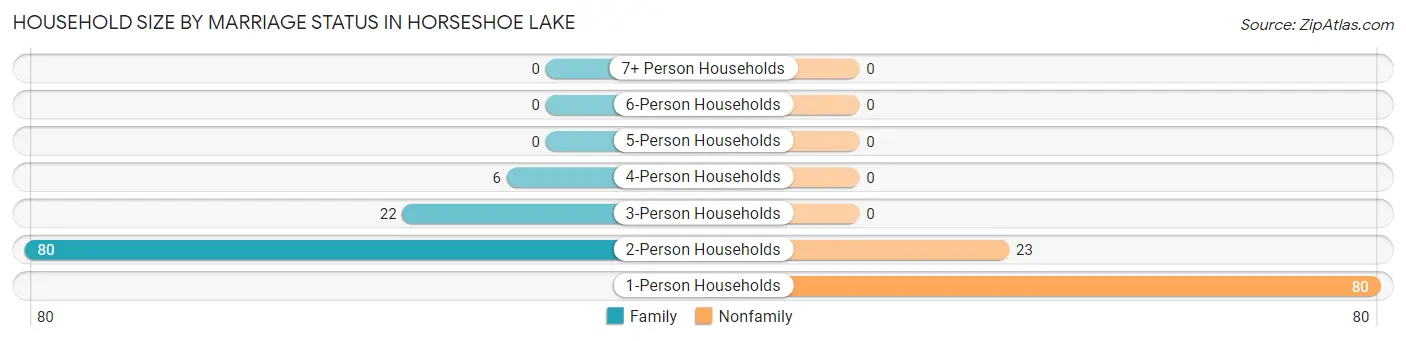
| Household Size | Family Households | Nonfamily Households |
| 1-Person Households | - | 80 (37.9%) |
| 2-Person Households | 80 (37.9%) | 23 (10.9%) |
| 3-Person Households | 22 (10.4%) | 0 (0.0%) |
| 4-Person Households | 6 (2.8%) | 0 (0.0%) |
| 5-Person Households | 0 (0.0%) | 0 (0.0%) |
| 6-Person Households | 0 (0.0%) | 0 (0.0%) |
| 7+ Person Households | 0 (0.0%) | 0 (0.0%) |
| Total | 108 (51.2%) | 103 (48.8%) |
Female Fertility in Horseshoe Lake
Fertility by Age in Horseshoe Lake
Average fertility rate in Horseshoe Lake is 35.0 births per 1,000 women. Women in the age bracket of 20 to 34 years have the highest fertility rate with 105.0 births per 1,000 women. Women in the age bracket of 20 to 34 years acount for 100.0% of all women with births.
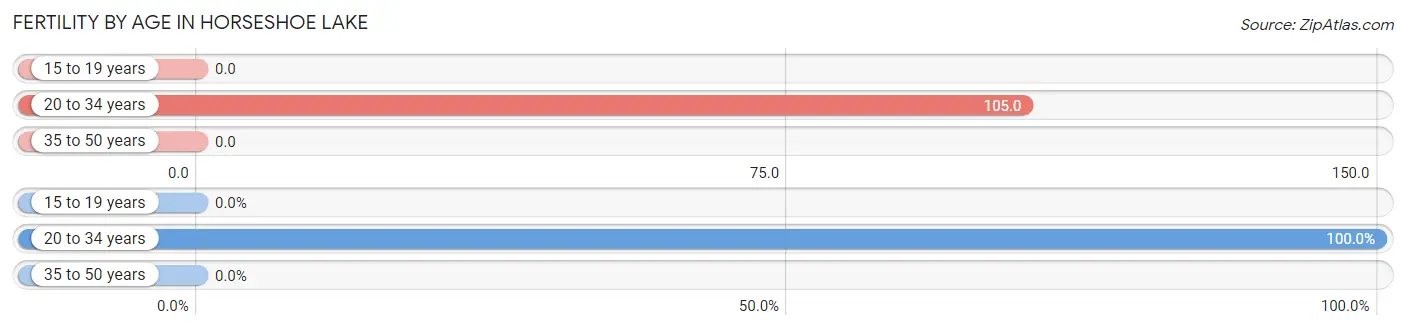
| Age Bracket | Women with Births | Births / 1,000 Women |
| 15 to 19 years | 0 (0.0%) | 0.0 |
| 20 to 34 years | 2 (100.0%) | 105.0 |
| 35 to 50 years | 0 (0.0%) | 0.0 |
| Total | 2 (100.0%) | 35.0 |
Fertility by Age by Marriage Status in Horseshoe Lake
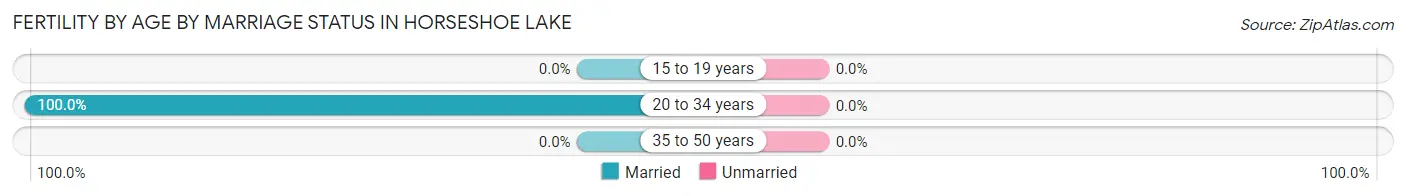
| Age Bracket | Married | Unmarried |
| 15 to 19 years | 0 (0.0%) | 0 (0.0%) |
| 20 to 34 years | 2 (100.0%) | 0 (0.0%) |
| 35 to 50 years | 0 (0.0%) | 0 (0.0%) |
| Total | 2 (100.0%) | 0 (0.0%) |
Fertility by Education in Horseshoe Lake
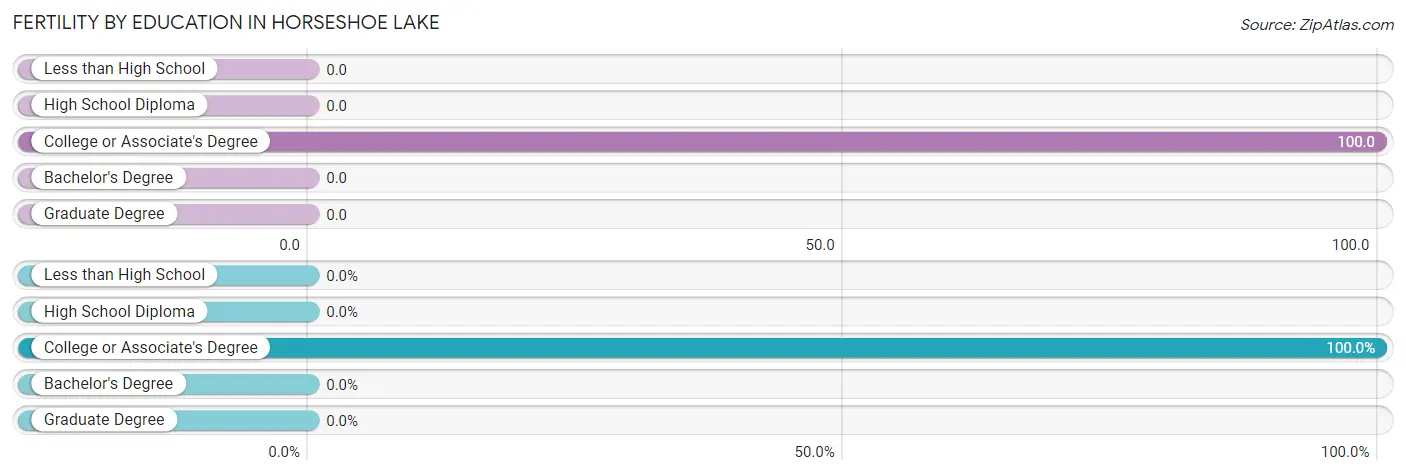
| Educational Attainment | Women with Births | Births / 1,000 Women |
| Less than High School | 0 (0.0%) | 0.0 |
| High School Diploma | 0 (0.0%) | 0.0 |
| College or Associate's Degree | 2 (100.0%) | 100.0 |
| Bachelor's Degree | 0 (0.0%) | 0.0 |
| Graduate Degree | 0 (0.0%) | 0.0 |
| Total | 2 (100.0%) | 35.0 |
Fertility by Education by Marriage Status in Horseshoe Lake
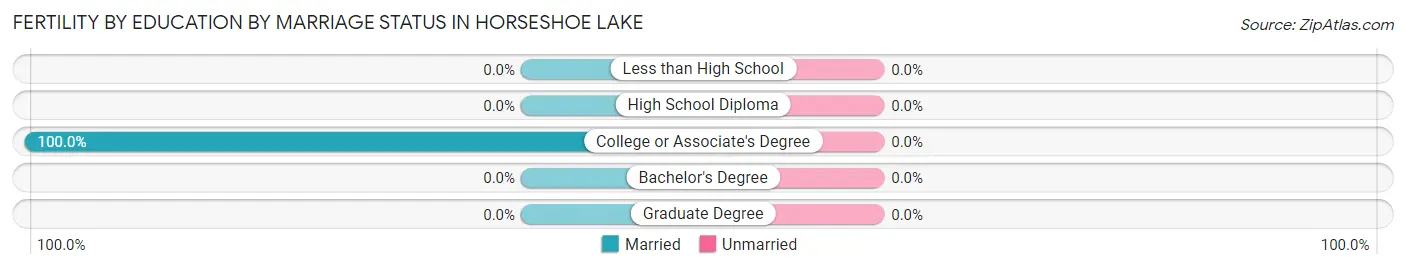
| Educational Attainment | Married | Unmarried |
| Less than High School | 0 (0.0%) | 0 (0.0%) |
| High School Diploma | 0 (0.0%) | 0 (0.0%) |
| College or Associate's Degree | 2 (100.0%) | 0 (0.0%) |
| Bachelor's Degree | 0 (0.0%) | 0 (0.0%) |
| Graduate Degree | 0 (0.0%) | 0 (0.0%) |
| Total | 2 (100.0%) | 0 (0.0%) |
Employment Characteristics in Horseshoe Lake
Employment by Class of Employer in Horseshoe Lake
Among the 199 employed individuals in Horseshoe Lake, private company employees (149 | 74.9%), local government employees (16 | 8.0%), and self-employed (not incorporated) (15 | 7.5%) make up the most common classes of employment.
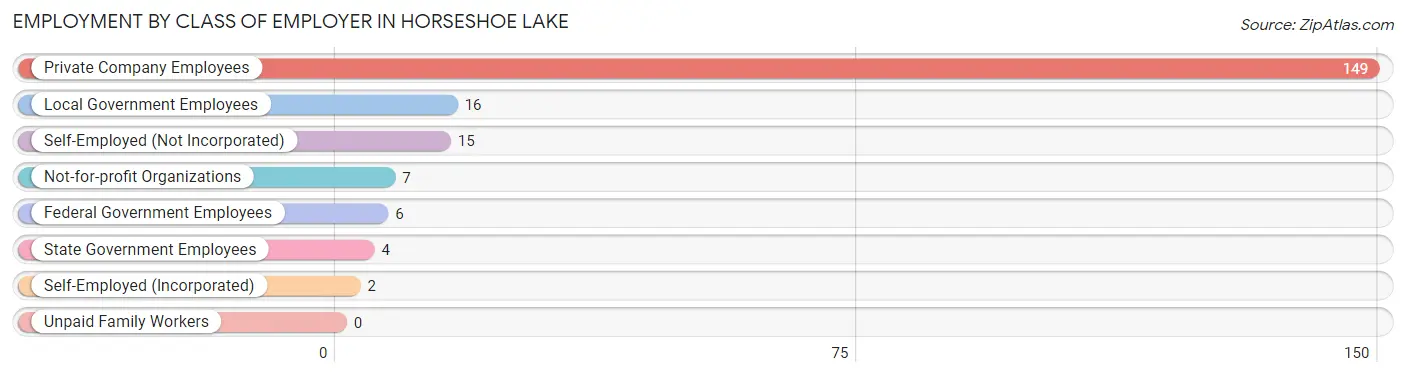
| Employer Class | # Employees | % Employees |
| Private Company Employees | 149 | 74.9% |
| Self-Employed (Incorporated) | 2 | 1.0% |
| Self-Employed (Not Incorporated) | 15 | 7.5% |
| Not-for-profit Organizations | 7 | 3.5% |
| Local Government Employees | 16 | 8.0% |
| State Government Employees | 4 | 2.0% |
| Federal Government Employees | 6 | 3.0% |
| Unpaid Family Workers | 0 | 0.0% |
| Total | 199 | 100.0% |
Employment Status by Age in Horseshoe Lake
According to the labor force statistics for Horseshoe Lake, out of the total population over 16 years of age (382), 58.1% or 222 individuals are in the labor force, with 7.7% or 17 of them unemployed. The age group with the highest labor force participation rate is 30 to 34 years, with 100.0% or 14 individuals in the labor force. Within the labor force, the 16 to 19 years age range has the highest percentage of unemployed individuals, with 100.0% or 6 of them being unemployed.
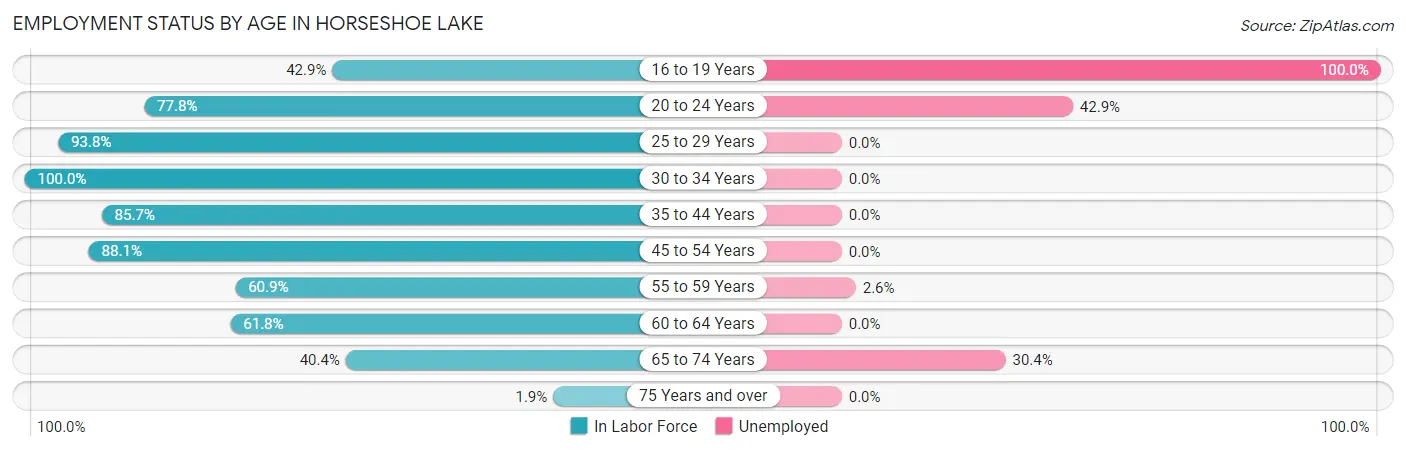
| Age Bracket | In Labor Force | Unemployed |
| 16 to 19 Years | 6 (42.9%) | 6 (100.0%) |
| 20 to 24 Years | 7 (77.8%) | 3 (42.9%) |
| 25 to 29 Years | 15 (93.8%) | 0 (0.0%) |
| 30 to 34 Years | 14 (100.0%) | 0 (0.0%) |
| 35 to 44 Years | 18 (85.7%) | 0 (0.0%) |
| 45 to 54 Years | 52 (88.1%) | 0 (0.0%) |
| 55 to 59 Years | 39 (60.9%) | 1 (2.6%) |
| 60 to 64 Years | 47 (61.8%) | 0 (0.0%) |
| 65 to 74 Years | 23 (40.4%) | 7 (30.4%) |
| 75 Years and over | 1 (1.9%) | 0 (0.0%) |
| Total | 222 (58.1%) | 17 (7.7%) |
Employment Status by Educational Attainment in Horseshoe Lake
According to labor force statistics for Horseshoe Lake, 74.0% of individuals (185) out of the total population between 25 and 64 years of age (250) are in the labor force, with 0.5% or 1 of them being unemployed. The group with the highest labor force participation rate are those with the educational attainment of bachelor's degree or higher, with 77.8% or 14 individuals in the labor force. Within the labor force, individuals with high school diploma education have the highest percentage of unemployment, with 1.3% or 1 of them being unemployed.
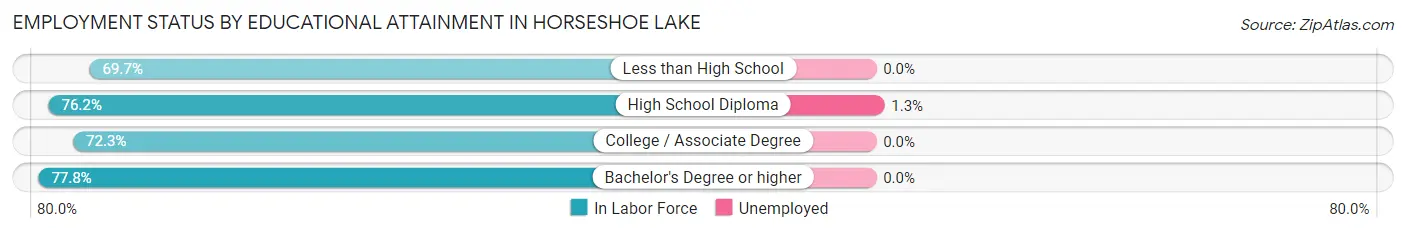
| Educational Attainment | In Labor Force | Unemployed |
| Less than High School | 23 (69.7%) | 0 (0.0%) |
| High School Diploma | 80 (76.2%) | 1 (1.3%) |
| College / Associate Degree | 68 (72.3%) | 0 (0.0%) |
| Bachelor's Degree or higher | 14 (77.8%) | 0 (0.0%) |
| Total | 185 (74.0%) | 1 (0.5%) |
Employment Occupations by Sex in Horseshoe Lake
Management, Business, Science and Arts Occupations
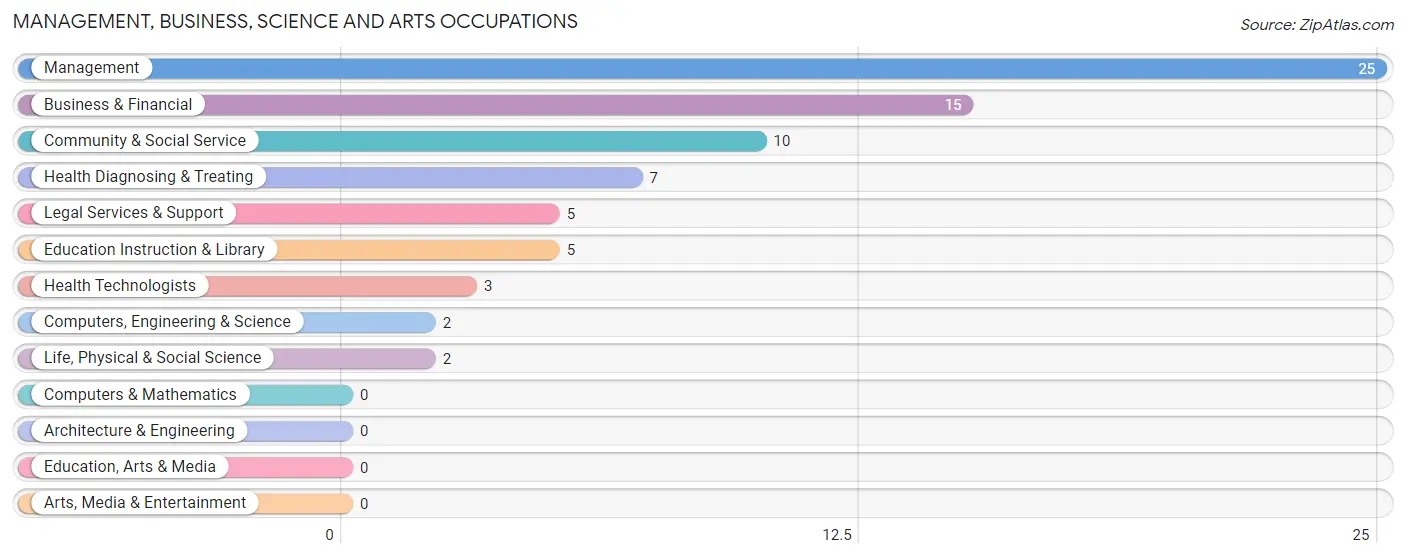
The most common Management, Business, Science and Arts occupations in Horseshoe Lake are Management (25 | 12.2%), Business & Financial (15 | 7.3%), Community & Social Service (10 | 4.9%), Health Diagnosing & Treating (7 | 3.4%), and Legal Services & Support (5 | 2.4%).
Management, Business, Science and Arts Occupations by Sex
Within the Management, Business, Science and Arts occupations in Horseshoe Lake, the most male-oriented occupations are Business & Financial (53.3%), Health Diagnosing & Treating (42.9%), and Education Instruction & Library (40.0%), while the most female-oriented occupations are Computers, Engineering & Science (100.0%), Life, Physical & Social Science (100.0%), and Legal Services & Support (100.0%).
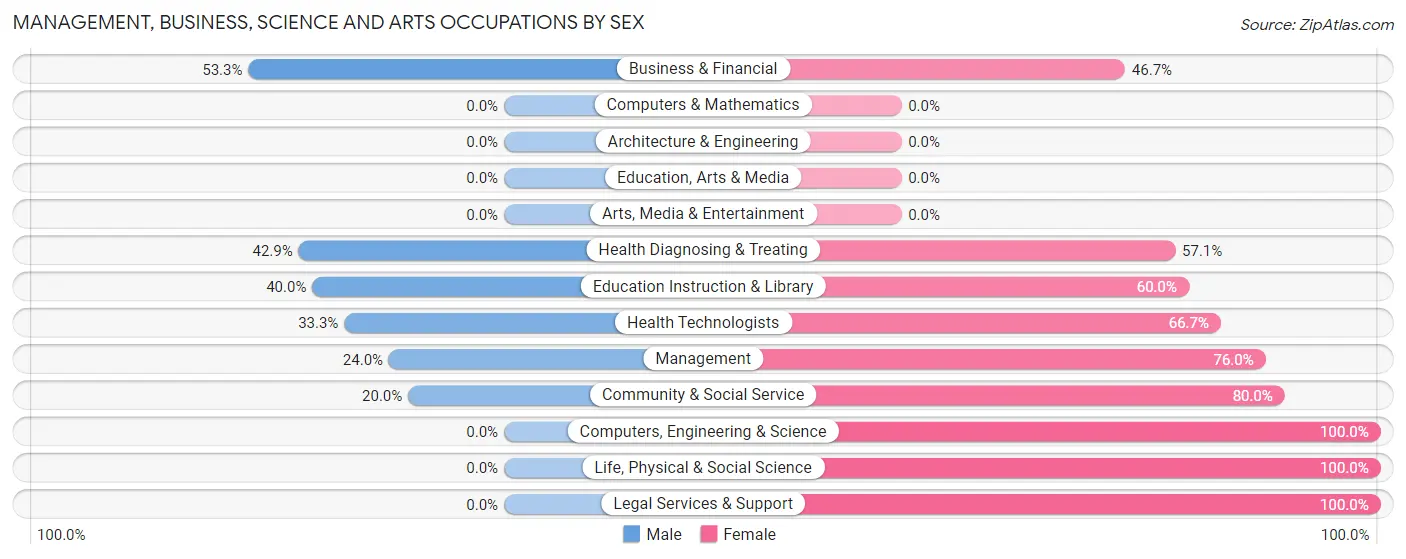
| Occupation | Male | Female |
| Management | 6 (24.0%) | 19 (76.0%) |
| Business & Financial | 8 (53.3%) | 7 (46.7%) |
| Computers, Engineering & Science | 0 (0.0%) | 2 (100.0%) |
| Computers & Mathematics | 0 (0.0%) | 0 (0.0%) |
| Architecture & Engineering | 0 (0.0%) | 0 (0.0%) |
| Life, Physical & Social Science | 0 (0.0%) | 2 (100.0%) |
| Community & Social Service | 2 (20.0%) | 8 (80.0%) |
| Education, Arts & Media | 0 (0.0%) | 0 (0.0%) |
| Legal Services & Support | 0 (0.0%) | 5 (100.0%) |
| Education Instruction & Library | 2 (40.0%) | 3 (60.0%) |
| Arts, Media & Entertainment | 0 (0.0%) | 0 (0.0%) |
| Health Diagnosing & Treating | 3 (42.9%) | 4 (57.1%) |
| Health Technologists | 1 (33.3%) | 2 (66.7%) |
| Total (Category) | 19 (32.2%) | 40 (67.8%) |
| Total (Overall) | 120 (58.5%) | 85 (41.5%) |
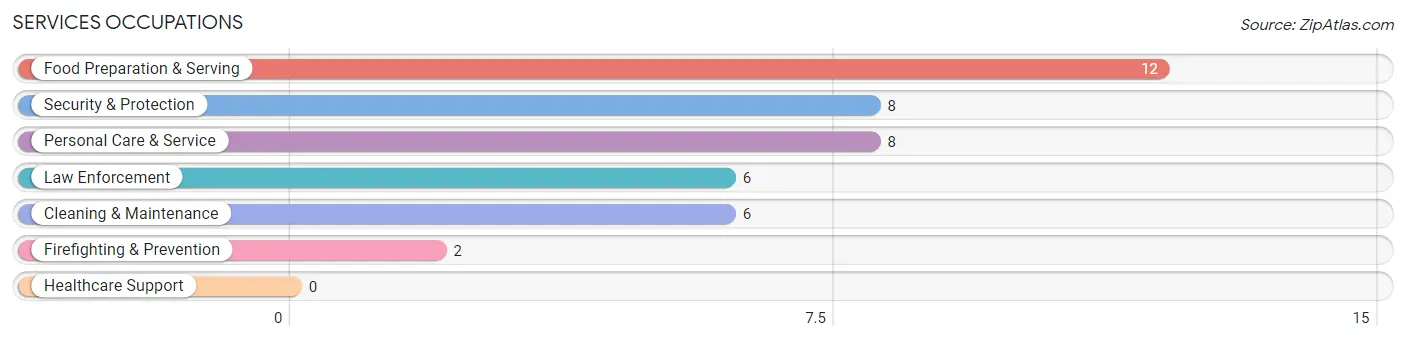
Services Occupations
The most common Services occupations in Horseshoe Lake are Food Preparation & Serving (12 | 5.9%), Security & Protection (8 | 3.9%), Personal Care & Service (8 | 3.9%), Law Enforcement (6 | 2.9%), and Cleaning & Maintenance (6 | 2.9%).
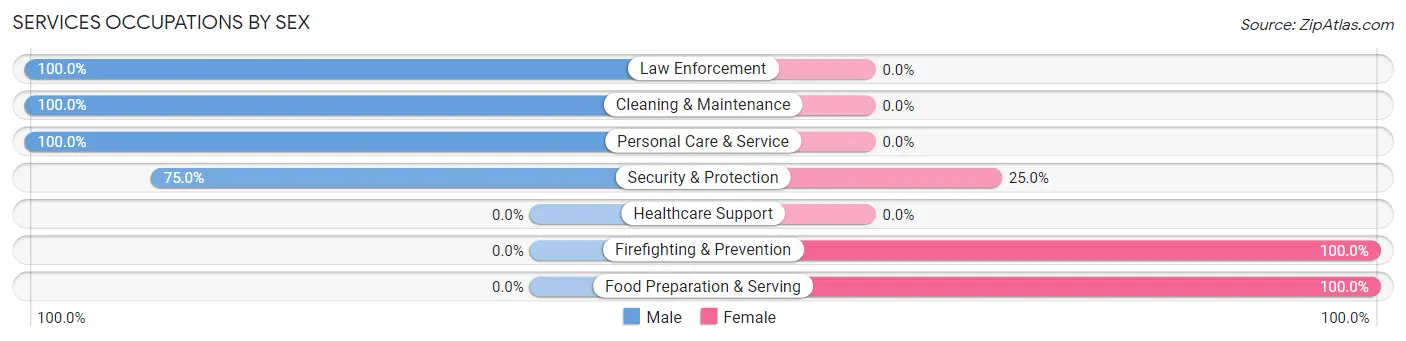
Services Occupations by Sex
Within the Services occupations in Horseshoe Lake, the most male-oriented occupations are Law Enforcement (100.0%), Cleaning & Maintenance (100.0%), and Personal Care & Service (100.0%), while the most female-oriented occupations are Firefighting & Prevention (100.0%), Food Preparation & Serving (100.0%), and Security & Protection (25.0%).
| Occupation | Male | Female |
| Healthcare Support | 0 (0.0%) | 0 (0.0%) |
| Security & Protection | 6 (75.0%) | 2 (25.0%) |
| Firefighting & Prevention | 0 (0.0%) | 2 (100.0%) |
| Law Enforcement | 6 (100.0%) | 0 (0.0%) |
| Food Preparation & Serving | 0 (0.0%) | 12 (100.0%) |
| Cleaning & Maintenance | 6 (100.0%) | 0 (0.0%) |
| Personal Care & Service | 8 (100.0%) | 0 (0.0%) |
| Total (Category) | 20 (58.8%) | 14 (41.2%) |
| Total (Overall) | 120 (58.5%) | 85 (41.5%) |
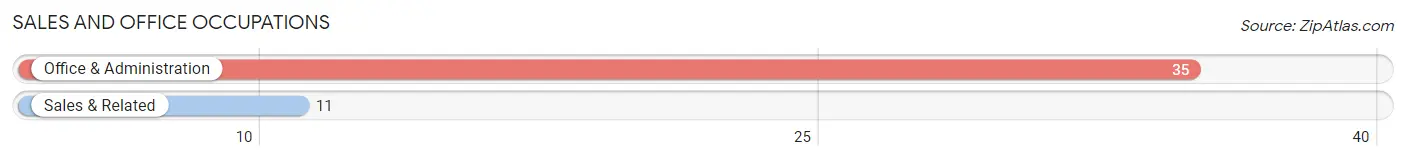
Sales and Office Occupations
The most common Sales and Office occupations in Horseshoe Lake are Office & Administration (35 | 17.1%), and Sales & Related (11 | 5.4%).
Sales and Office Occupations by Sex
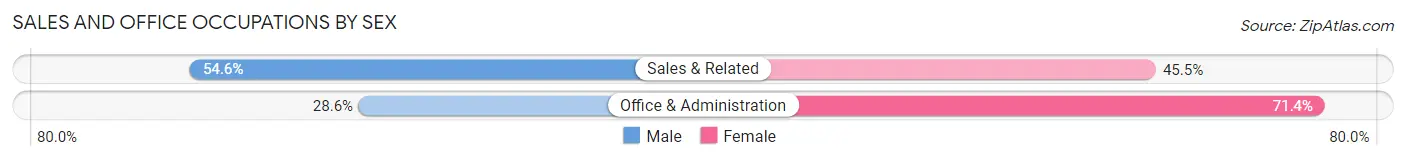
| Occupation | Male | Female |
| Sales & Related | 6 (54.5%) | 5 (45.5%) |
| Office & Administration | 10 (28.6%) | 25 (71.4%) |
| Total (Category) | 16 (34.8%) | 30 (65.2%) |
| Total (Overall) | 120 (58.5%) | 85 (41.5%) |
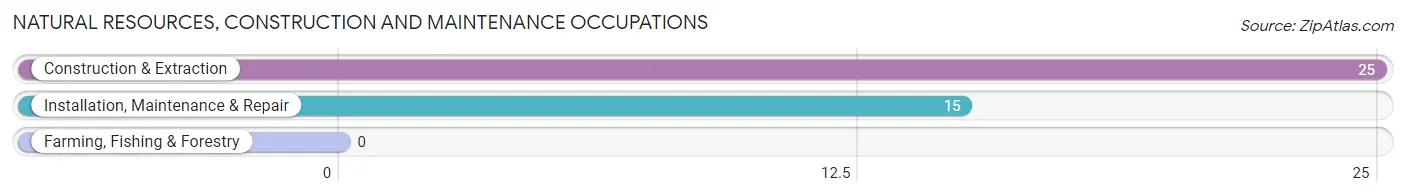
Natural Resources, Construction and Maintenance Occupations
The most common Natural Resources, Construction and Maintenance occupations in Horseshoe Lake are Construction & Extraction (25 | 12.2%), and Installation, Maintenance & Repair (15 | 7.3%).
Natural Resources, Construction and Maintenance Occupations by Sex
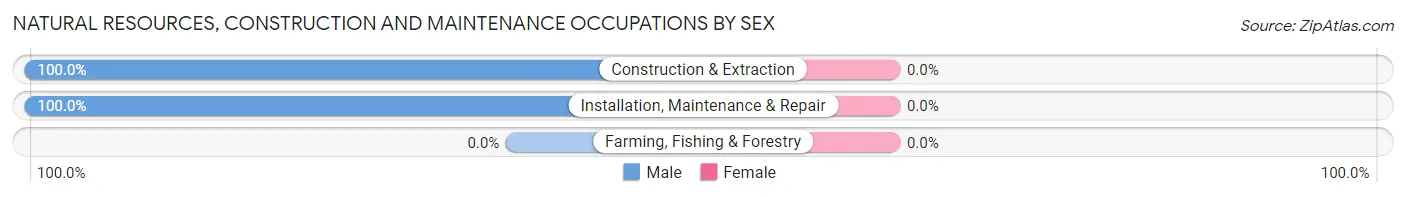
| Occupation | Male | Female |
| Farming, Fishing & Forestry | 0 (0.0%) | 0 (0.0%) |
| Construction & Extraction | 25 (100.0%) | 0 (0.0%) |
| Installation, Maintenance & Repair | 15 (100.0%) | 0 (0.0%) |
| Total (Category) | 40 (100.0%) | 0 (0.0%) |
| Total (Overall) | 120 (58.5%) | 85 (41.5%) |
Production, Transportation and Moving Occupations
The most common Production, Transportation and Moving occupations in Horseshoe Lake are Transportation (21 | 10.2%), Material Moving (3 | 1.5%), and Production (2 | 1.0%).
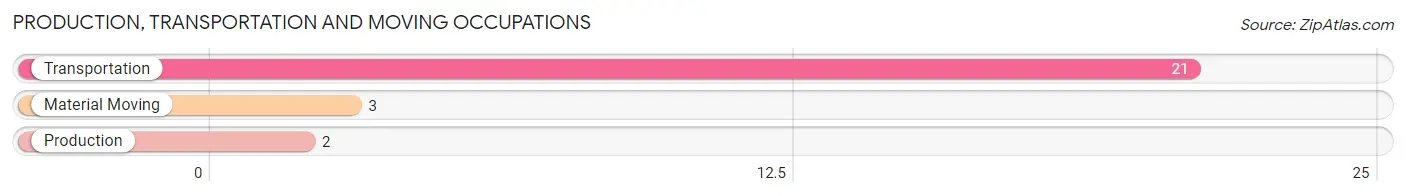
Production, Transportation and Moving Occupations by Sex
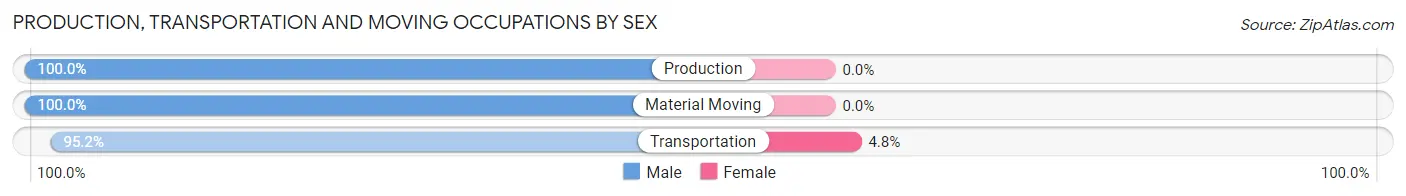
| Occupation | Male | Female |
| Production | 2 (100.0%) | 0 (0.0%) |
| Transportation | 20 (95.2%) | 1 (4.8%) |
| Material Moving | 3 (100.0%) | 0 (0.0%) |
| Total (Category) | 25 (96.2%) | 1 (3.8%) |
| Total (Overall) | 120 (58.5%) | 85 (41.5%) |
Employment Industries by Sex in Horseshoe Lake
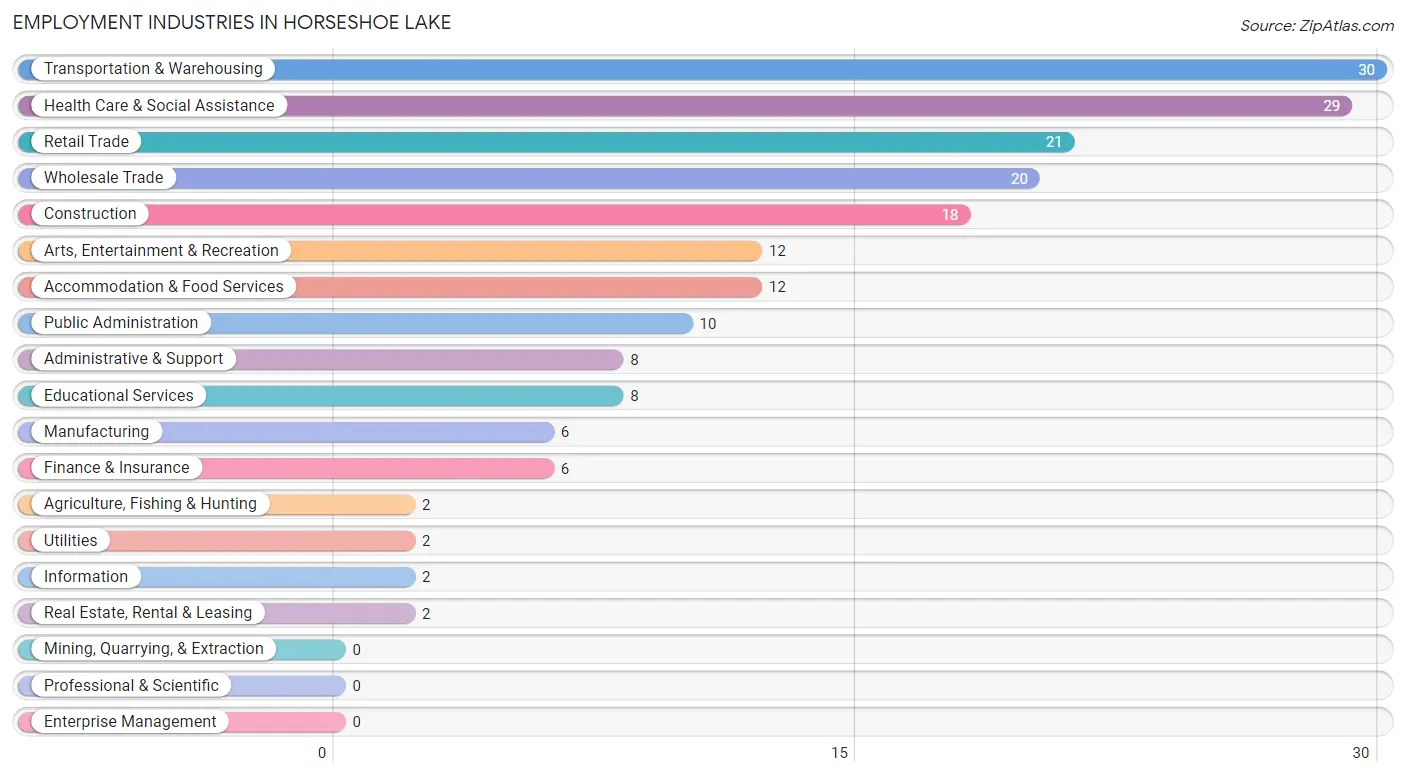
Employment Industries in Horseshoe Lake
The major employment industries in Horseshoe Lake include Transportation & Warehousing (30 | 14.6%), Health Care & Social Assistance (29 | 14.1%), Retail Trade (21 | 10.2%), Wholesale Trade (20 | 9.8%), and Construction (18 | 8.8%).
Employment Industries by Sex in Horseshoe Lake
The Horseshoe Lake industries that see more men than women are Agriculture, Fishing & Hunting (100.0%), Construction (100.0%), and Utilities (100.0%), whereas the industries that tend to have a higher number of women are Finance & Insurance (100.0%), Real Estate, Rental & Leasing (100.0%), and Accommodation & Food Services (100.0%).
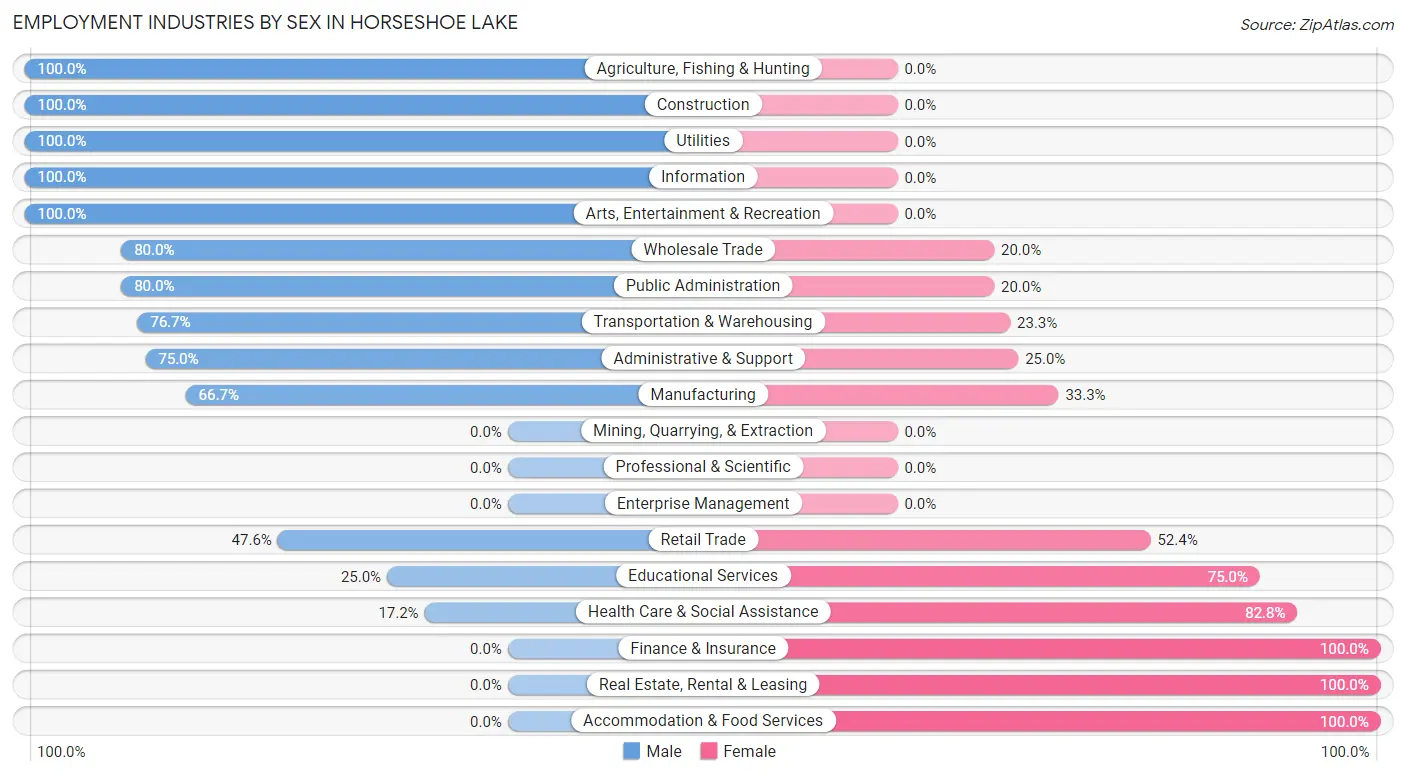
| Industry | Male | Female |
| Agriculture, Fishing & Hunting | 2 (100.0%) | 0 (0.0%) |
| Mining, Quarrying, & Extraction | 0 (0.0%) | 0 (0.0%) |
| Construction | 18 (100.0%) | 0 (0.0%) |
| Manufacturing | 4 (66.7%) | 2 (33.3%) |
| Wholesale Trade | 16 (80.0%) | 4 (20.0%) |
| Retail Trade | 10 (47.6%) | 11 (52.4%) |
| Transportation & Warehousing | 23 (76.7%) | 7 (23.3%) |
| Utilities | 2 (100.0%) | 0 (0.0%) |
| Information | 2 (100.0%) | 0 (0.0%) |
| Finance & Insurance | 0 (0.0%) | 6 (100.0%) |
| Real Estate, Rental & Leasing | 0 (0.0%) | 2 (100.0%) |
| Professional & Scientific | 0 (0.0%) | 0 (0.0%) |
| Enterprise Management | 0 (0.0%) | 0 (0.0%) |
| Administrative & Support | 6 (75.0%) | 2 (25.0%) |
| Educational Services | 2 (25.0%) | 6 (75.0%) |
| Health Care & Social Assistance | 5 (17.2%) | 24 (82.8%) |
| Arts, Entertainment & Recreation | 12 (100.0%) | 0 (0.0%) |
| Accommodation & Food Services | 0 (0.0%) | 12 (100.0%) |
| Public Administration | 8 (80.0%) | 2 (20.0%) |
| Total | 120 (58.5%) | 85 (41.5%) |
Education in Horseshoe Lake
School Enrollment in Horseshoe Lake
The most common levels of schooling among the 19 students in Horseshoe Lake are college / undergraduate (9 | 47.4%), high school (6 | 31.6%), and middle school (2 | 10.5%).
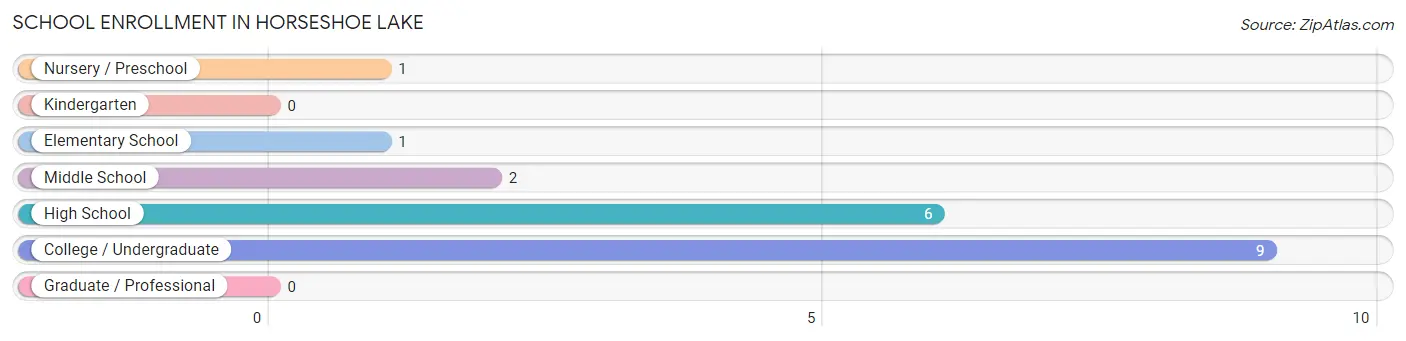
| School Level | # Students | % Students |
| Nursery / Preschool | 1 | 5.3% |
| Kindergarten | 0 | 0.0% |
| Elementary School | 1 | 5.3% |
| Middle School | 2 | 10.5% |
| High School | 6 | 31.6% |
| College / Undergraduate | 9 | 47.4% |
| Graduate / Professional | 0 | 0.0% |
| Total | 19 | 100.0% |
School Enrollment by Age by Funding Source in Horseshoe Lake
Out of a total of 19 students who are enrolled in schools in Horseshoe Lake, 11 (57.9%) attend a private institution, while the remaining 8 (42.1%) are enrolled in public schools. The age group of 18 to 19 year olds has the highest likelihood of being enrolled in private schools, with 6 (100.0% in the age bracket) enrolled. Conversely, the age group of 10 to 14 year olds has the lowest likelihood of being enrolled in a private school, with 2 (100.0% in the age bracket) attending a public institution.
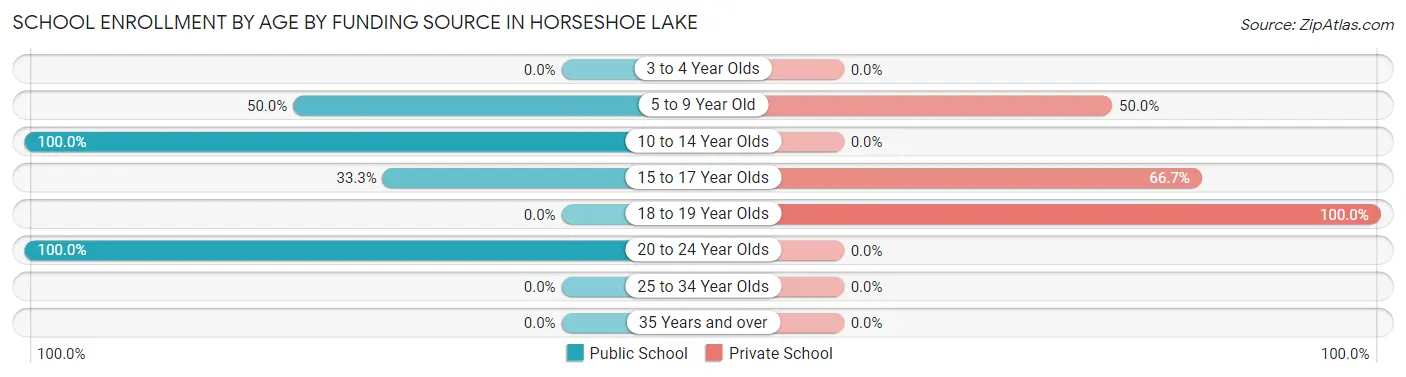
| Age Bracket | Public School | Private School |
| 3 to 4 Year Olds | 0 (0.0%) | 0 (0.0%) |
| 5 to 9 Year Old | 1 (50.0%) | 1 (50.0%) |
| 10 to 14 Year Olds | 2 (100.0%) | 0 (0.0%) |
| 15 to 17 Year Olds | 2 (33.3%) | 4 (66.7%) |
| 18 to 19 Year Olds | 0 (0.0%) | 6 (100.0%) |
| 20 to 24 Year Olds | 3 (100.0%) | 0 (0.0%) |
| 25 to 34 Year Olds | 0 (0.0%) | 0 (0.0%) |
| 35 Years and over | 0 (0.0%) | 0 (0.0%) |
| Total | 8 (42.1%) | 11 (57.9%) |
Educational Attainment by Field of Study in Horseshoe Lake
Liberal arts & history (16 | 33.3%), education (7 | 14.6%), science & technology (4 | 8.3%), business (4 | 8.3%), and literature & languages (4 | 8.3%) are the most common fields of study among 48 individuals in Horseshoe Lake who have obtained a bachelor's degree or higher.
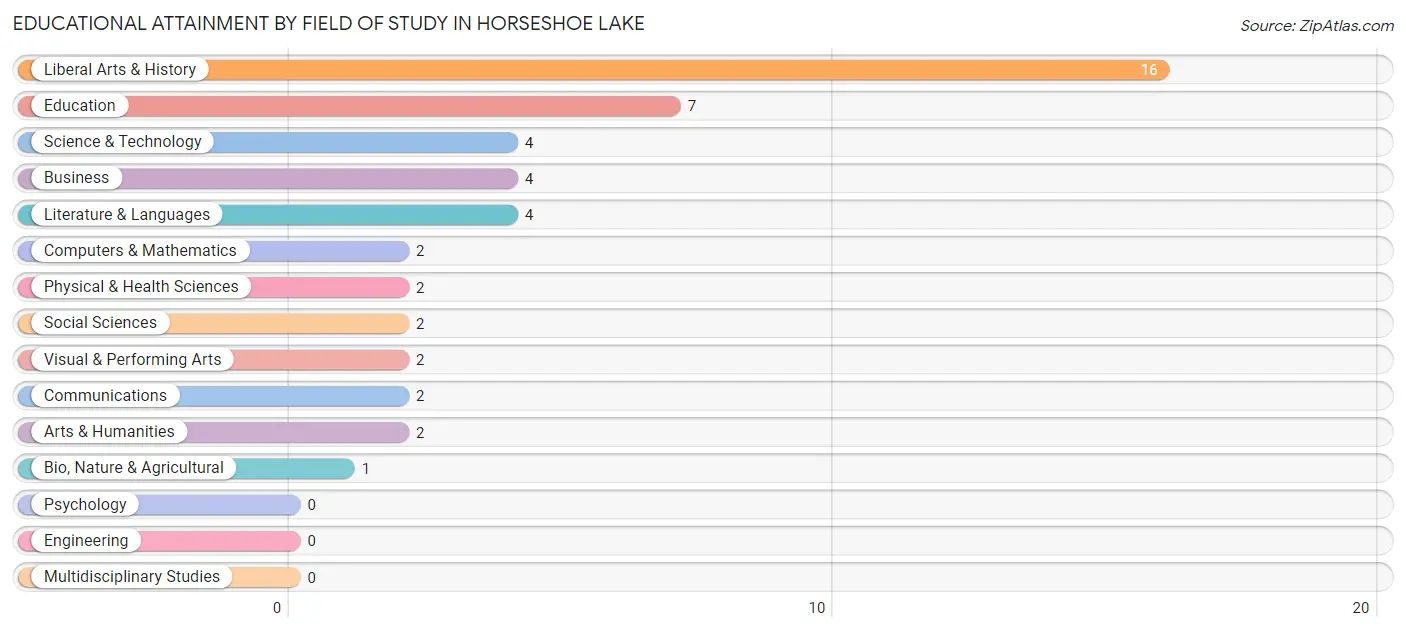
| Field of Study | # Graduates | % Graduates |
| Computers & Mathematics | 2 | 4.2% |
| Bio, Nature & Agricultural | 1 | 2.1% |
| Physical & Health Sciences | 2 | 4.2% |
| Psychology | 0 | 0.0% |
| Social Sciences | 2 | 4.2% |
| Engineering | 0 | 0.0% |
| Multidisciplinary Studies | 0 | 0.0% |
| Science & Technology | 4 | 8.3% |
| Business | 4 | 8.3% |
| Education | 7 | 14.6% |
| Literature & Languages | 4 | 8.3% |
| Liberal Arts & History | 16 | 33.3% |
| Visual & Performing Arts | 2 | 4.2% |
| Communications | 2 | 4.2% |
| Arts & Humanities | 2 | 4.2% |
| Total | 48 | 100.0% |
Transportation & Commute in Horseshoe Lake
Vehicle Availability by Sex in Horseshoe Lake
The most prevalent vehicle ownership categories in Horseshoe Lake are males with 2 vehicles (54, accounting for 49.5%) and females with 2 vehicles (35, making up 63.5%).
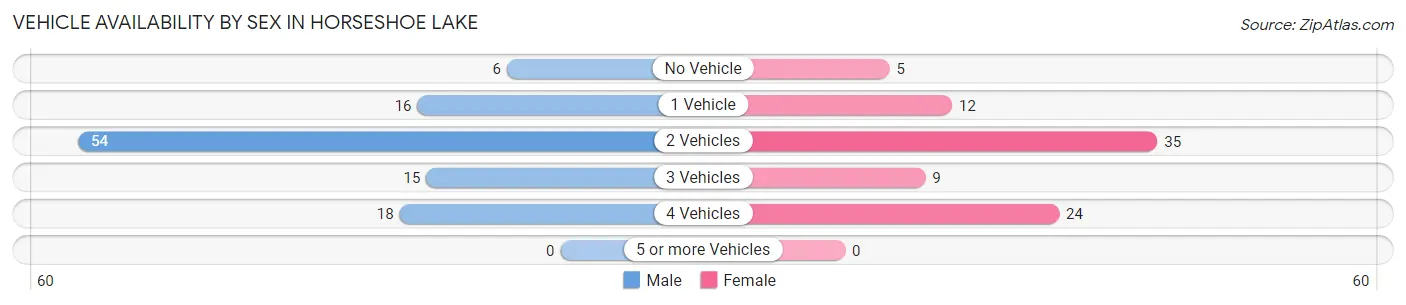
| Vehicles Available | Male | Female |
| No Vehicle | 6 (5.5%) | 5 (5.9%) |
| 1 Vehicle | 16 (14.7%) | 12 (14.1%) |
| 2 Vehicles | 54 (49.5%) | 35 (41.2%) |
| 3 Vehicles | 15 (13.8%) | 9 (10.6%) |
| 4 Vehicles | 18 (16.5%) | 24 (28.2%) |
| 5 or more Vehicles | 0 (0.0%) | 0 (0.0%) |
| Total | 109 (100.0%) | 85 (100.0%) |
Commute Time in Horseshoe Lake
The most frequently occuring commute durations in Horseshoe Lake are 45 to 59 minutes (53 commuters, 27.8%), 30 to 34 minutes (39 commuters, 20.4%), and 60 to 89 minutes (38 commuters, 19.9%).
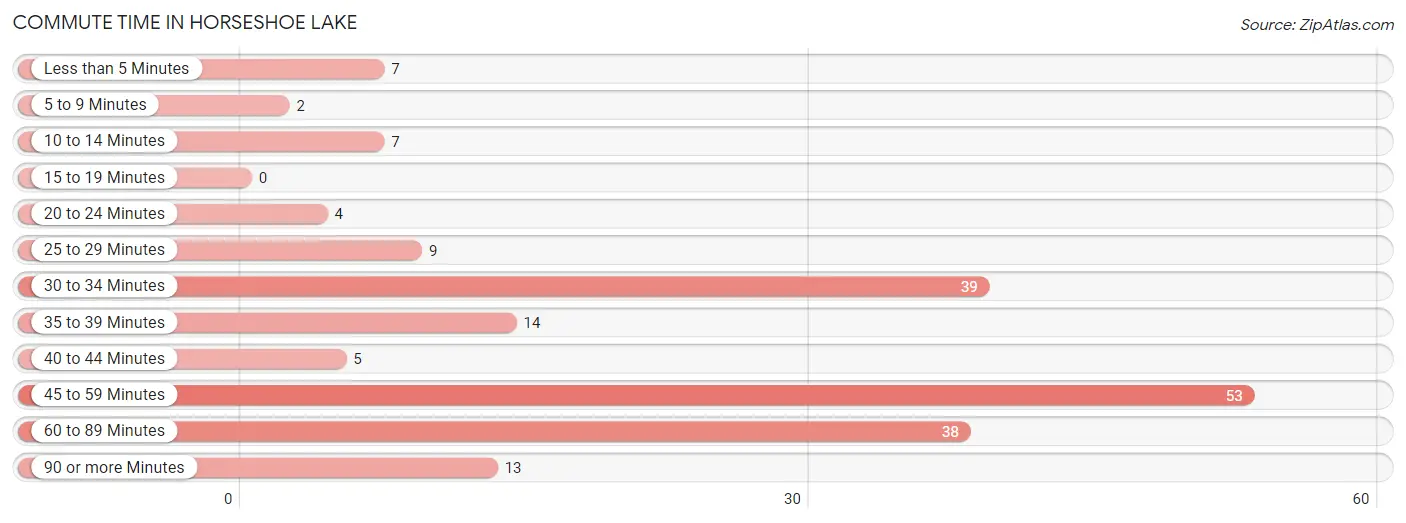
| Commute Time | # Commuters | % Commuters |
| Less than 5 Minutes | 7 | 3.7% |
| 5 to 9 Minutes | 2 | 1.1% |
| 10 to 14 Minutes | 7 | 3.7% |
| 15 to 19 Minutes | 0 | 0.0% |
| 20 to 24 Minutes | 4 | 2.1% |
| 25 to 29 Minutes | 9 | 4.7% |
| 30 to 34 Minutes | 39 | 20.4% |
| 35 to 39 Minutes | 14 | 7.3% |
| 40 to 44 Minutes | 5 | 2.6% |
| 45 to 59 Minutes | 53 | 27.8% |
| 60 to 89 Minutes | 38 | 19.9% |
| 90 or more Minutes | 13 | 6.8% |
Commute Time by Sex in Horseshoe Lake
The most common commute times in Horseshoe Lake are 45 to 59 minutes (38 commuters, 34.9%) for males and 60 to 89 minutes (30 commuters, 36.6%) for females.
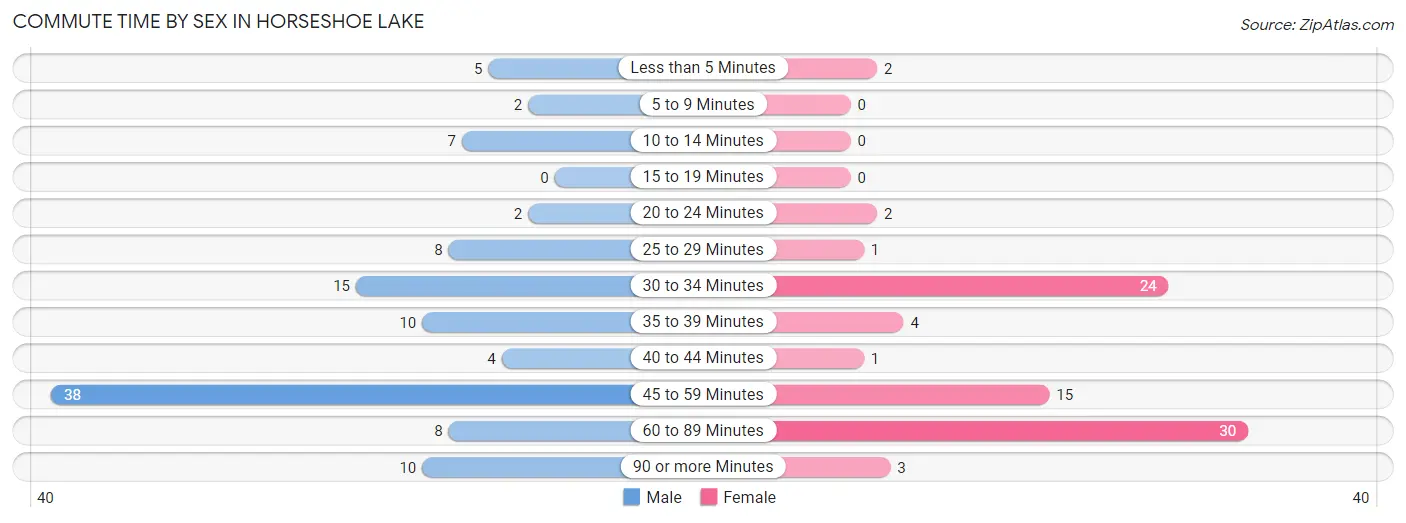
| Commute Time | Male | Female |
| Less than 5 Minutes | 5 (4.6%) | 2 (2.4%) |
| 5 to 9 Minutes | 2 (1.8%) | 0 (0.0%) |
| 10 to 14 Minutes | 7 (6.4%) | 0 (0.0%) |
| 15 to 19 Minutes | 0 (0.0%) | 0 (0.0%) |
| 20 to 24 Minutes | 2 (1.8%) | 2 (2.4%) |
| 25 to 29 Minutes | 8 (7.3%) | 1 (1.2%) |
| 30 to 34 Minutes | 15 (13.8%) | 24 (29.3%) |
| 35 to 39 Minutes | 10 (9.2%) | 4 (4.9%) |
| 40 to 44 Minutes | 4 (3.7%) | 1 (1.2%) |
| 45 to 59 Minutes | 38 (34.9%) | 15 (18.3%) |
| 60 to 89 Minutes | 8 (7.3%) | 30 (36.6%) |
| 90 or more Minutes | 10 (9.2%) | 3 (3.7%) |
Time of Departure to Work by Sex in Horseshoe Lake
The most frequent times of departure to work in Horseshoe Lake are 6:00 AM to 6:29 AM (36, 33.0%) for males and 6:30 AM to 6:59 AM (22, 26.8%) for females.
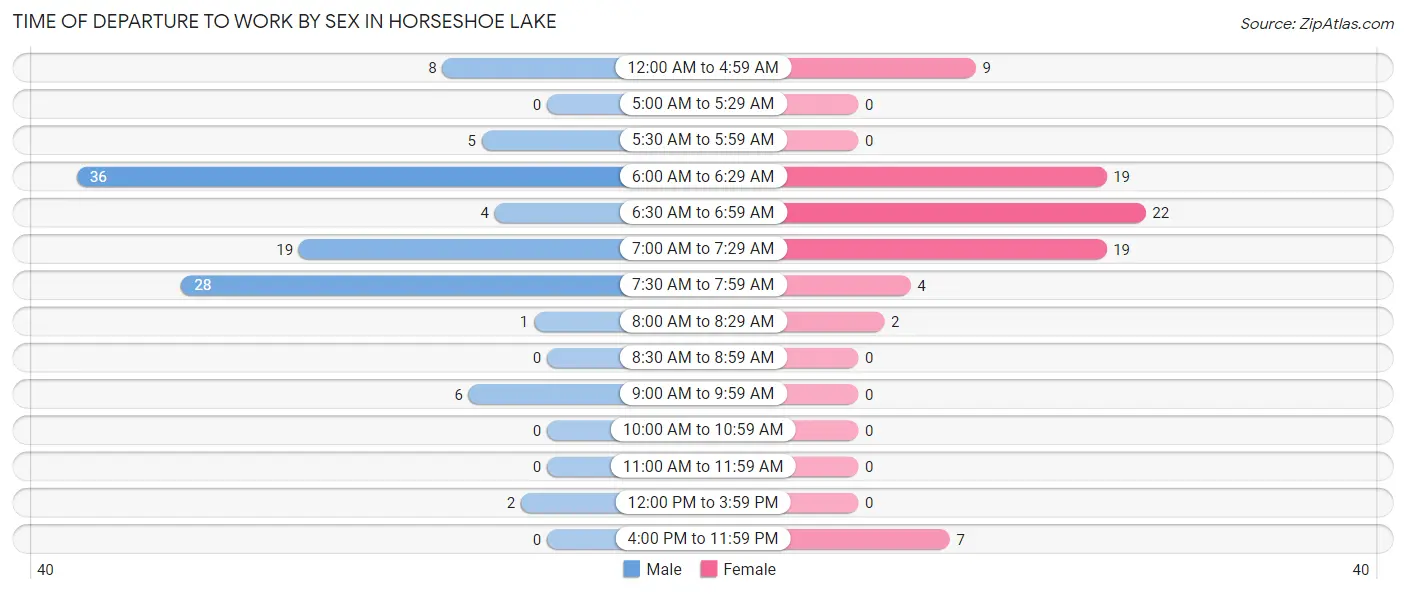
| Time of Departure | Male | Female |
| 12:00 AM to 4:59 AM | 8 (7.3%) | 9 (11.0%) |
| 5:00 AM to 5:29 AM | 0 (0.0%) | 0 (0.0%) |
| 5:30 AM to 5:59 AM | 5 (4.6%) | 0 (0.0%) |
| 6:00 AM to 6:29 AM | 36 (33.0%) | 19 (23.2%) |
| 6:30 AM to 6:59 AM | 4 (3.7%) | 22 (26.8%) |
| 7:00 AM to 7:29 AM | 19 (17.4%) | 19 (23.2%) |
| 7:30 AM to 7:59 AM | 28 (25.7%) | 4 (4.9%) |
| 8:00 AM to 8:29 AM | 1 (0.9%) | 2 (2.4%) |
| 8:30 AM to 8:59 AM | 0 (0.0%) | 0 (0.0%) |
| 9:00 AM to 9:59 AM | 6 (5.5%) | 0 (0.0%) |
| 10:00 AM to 10:59 AM | 0 (0.0%) | 0 (0.0%) |
| 11:00 AM to 11:59 AM | 0 (0.0%) | 0 (0.0%) |
| 12:00 PM to 3:59 PM | 2 (1.8%) | 0 (0.0%) |
| 4:00 PM to 11:59 PM | 0 (0.0%) | 7 (8.5%) |
| Total | 109 (100.0%) | 82 (100.0%) |
Housing Occupancy in Horseshoe Lake
Occupancy by Ownership in Horseshoe Lake
Of the total 211 dwellings in Horseshoe Lake, owner-occupied units account for 171 (81.0%), while renter-occupied units make up 40 (19.0%).
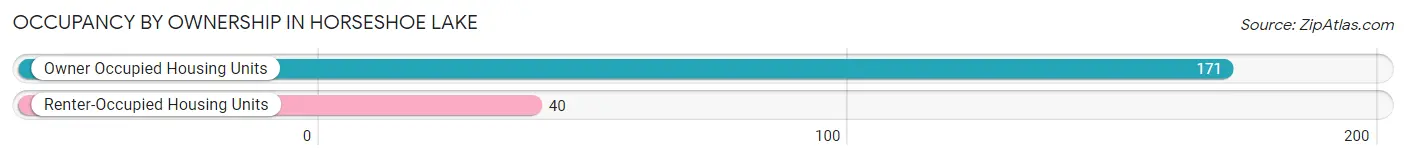
| Occupancy | # Housing Units | % Housing Units |
| Owner Occupied Housing Units | 171 | 81.0% |
| Renter-Occupied Housing Units | 40 | 19.0% |
| Total Occupied Housing Units | 211 | 100.0% |
Occupancy by Household Size in Horseshoe Lake
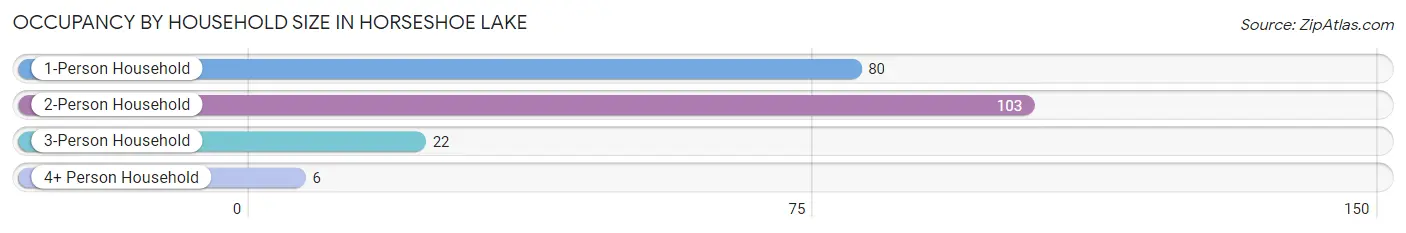
| Household Size | # Housing Units | % Housing Units |
| 1-Person Household | 80 | 37.9% |
| 2-Person Household | 103 | 48.8% |
| 3-Person Household | 22 | 10.4% |
| 4+ Person Household | 6 | 2.8% |
| Total Housing Units | 211 | 100.0% |
Occupancy by Ownership by Household Size in Horseshoe Lake
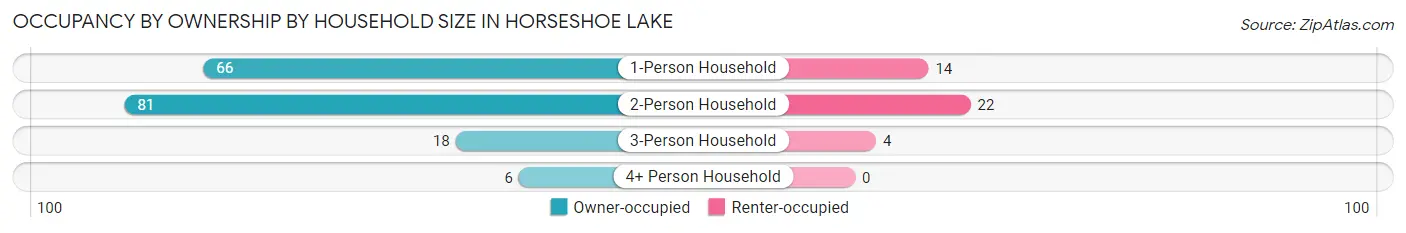
| Household Size | Owner-occupied | Renter-occupied |
| 1-Person Household | 66 (82.5%) | 14 (17.5%) |
| 2-Person Household | 81 (78.6%) | 22 (21.4%) |
| 3-Person Household | 18 (81.8%) | 4 (18.2%) |
| 4+ Person Household | 6 (100.0%) | 0 (0.0%) |
| Total Housing Units | 171 (81.0%) | 40 (19.0%) |
Occupancy by Educational Attainment in Horseshoe Lake
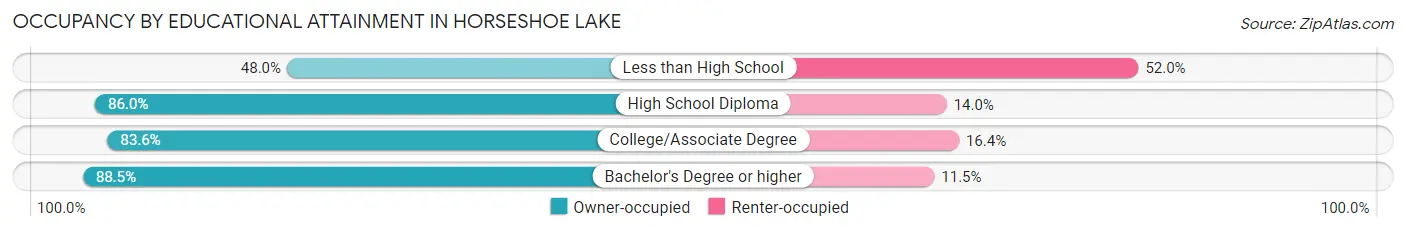
| Household Size | Owner-occupied | Renter-occupied |
| Less than High School | 12 (48.0%) | 13 (52.0%) |
| High School Diploma | 80 (86.0%) | 13 (14.0%) |
| College/Associate Degree | 56 (83.6%) | 11 (16.4%) |
| Bachelor's Degree or higher | 23 (88.5%) | 3 (11.5%) |
Occupancy by Age of Householder in Horseshoe Lake
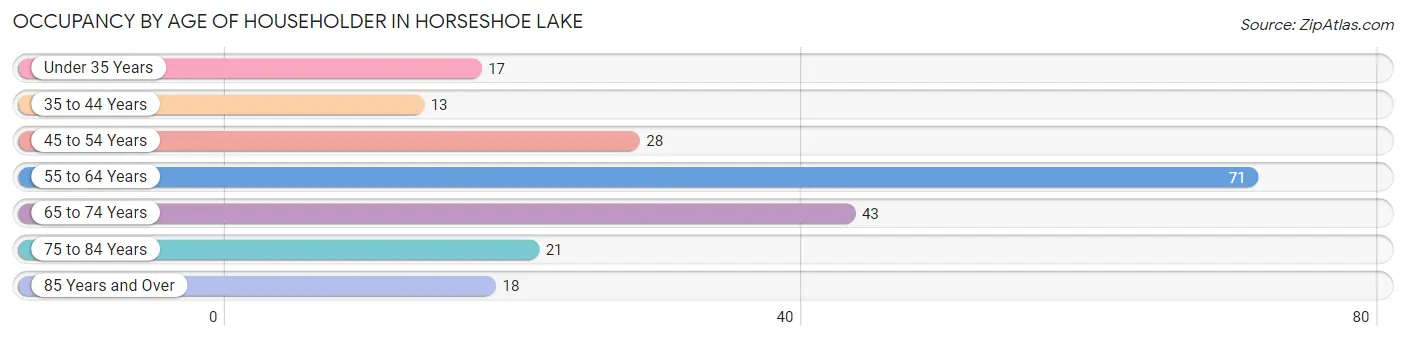
| Age Bracket | # Households | % Households |
| Under 35 Years | 17 | 8.1% |
| 35 to 44 Years | 13 | 6.2% |
| 45 to 54 Years | 28 | 13.3% |
| 55 to 64 Years | 71 | 33.7% |
| 65 to 74 Years | 43 | 20.4% |
| 75 to 84 Years | 21 | 10.0% |
| 85 Years and Over | 18 | 8.5% |
| Total | 211 | 100.0% |
Housing Finances in Horseshoe Lake
Median Income by Occupancy in Horseshoe Lake
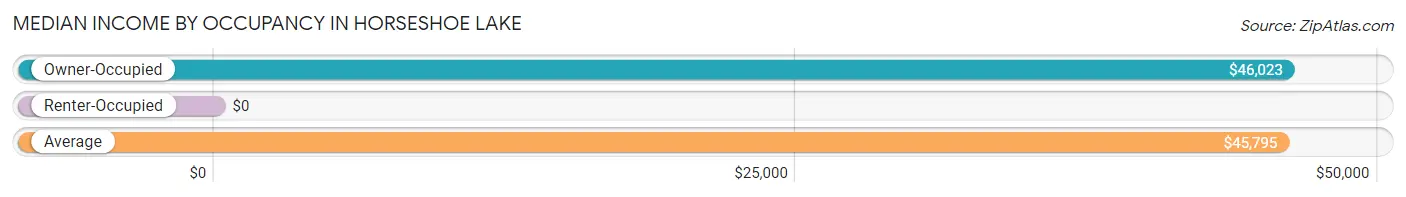
| Occupancy Type | # Households | Median Income |
| Owner-Occupied | 171 (81.0%) | $46,023 |
| Renter-Occupied | 40 (19.0%) | $0 |
| Average | 211 (100.0%) | $45,795 |
Occupancy by Householder Income Bracket in Horseshoe Lake
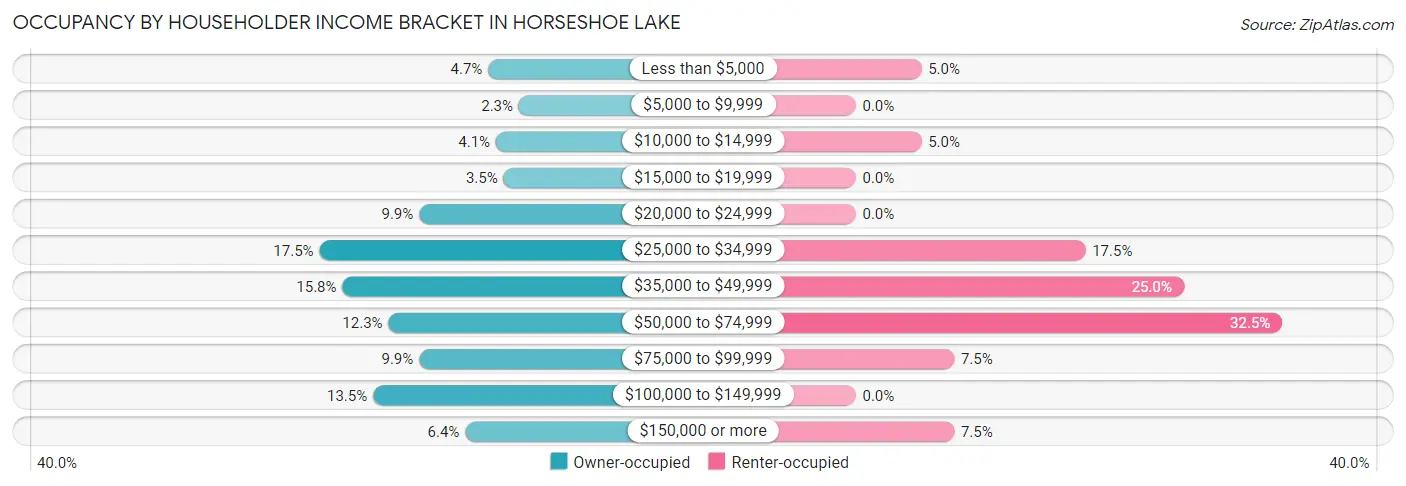
| Income Bracket | Owner-occupied | Renter-occupied |
| Less than $5,000 | 8 (4.7%) | 2 (5.0%) |
| $5,000 to $9,999 | 4 (2.3%) | 0 (0.0%) |
| $10,000 to $14,999 | 7 (4.1%) | 2 (5.0%) |
| $15,000 to $19,999 | 6 (3.5%) | 0 (0.0%) |
| $20,000 to $24,999 | 17 (9.9%) | 0 (0.0%) |
| $25,000 to $34,999 | 30 (17.5%) | 7 (17.5%) |
| $35,000 to $49,999 | 27 (15.8%) | 10 (25.0%) |
| $50,000 to $74,999 | 21 (12.3%) | 13 (32.5%) |
| $75,000 to $99,999 | 17 (9.9%) | 3 (7.5%) |
| $100,000 to $149,999 | 23 (13.5%) | 0 (0.0%) |
| $150,000 or more | 11 (6.4%) | 3 (7.5%) |
| Total | 171 (100.0%) | 40 (100.0%) |
Monthly Housing Cost Tiers in Horseshoe Lake
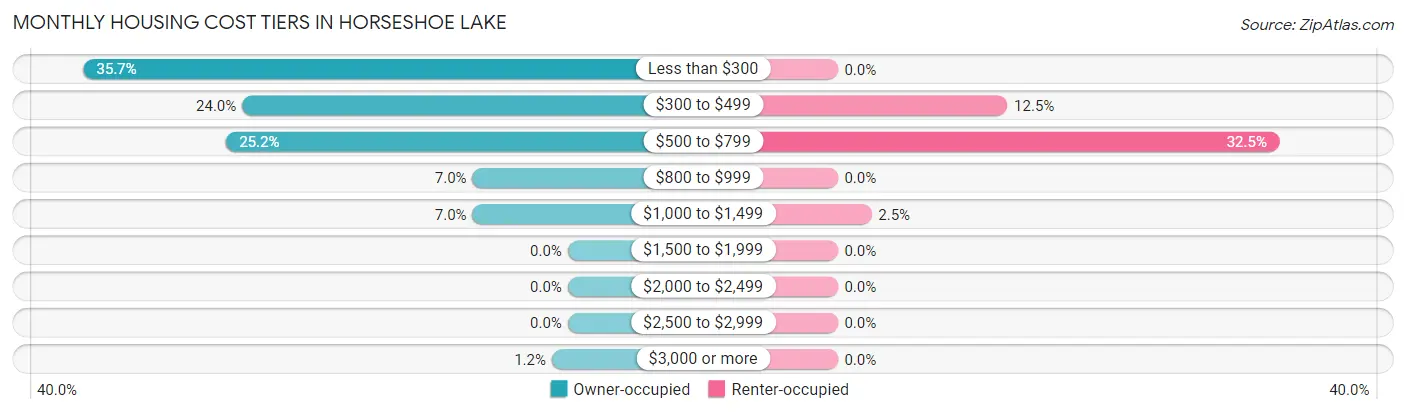
| Monthly Cost | Owner-occupied | Renter-occupied |
| Less than $300 | 61 (35.7%) | 0 (0.0%) |
| $300 to $499 | 41 (24.0%) | 5 (12.5%) |
| $500 to $799 | 43 (25.2%) | 13 (32.5%) |
| $800 to $999 | 12 (7.0%) | 0 (0.0%) |
| $1,000 to $1,499 | 12 (7.0%) | 1 (2.5%) |
| $1,500 to $1,999 | 0 (0.0%) | 0 (0.0%) |
| $2,000 to $2,499 | 0 (0.0%) | 0 (0.0%) |
| $2,500 to $2,999 | 0 (0.0%) | 0 (0.0%) |
| $3,000 or more | 2 (1.2%) | 0 (0.0%) |
| Total | 171 (100.0%) | 40 (100.0%) |
Physical Housing Characteristics in Horseshoe Lake
Housing Structures in Horseshoe Lake
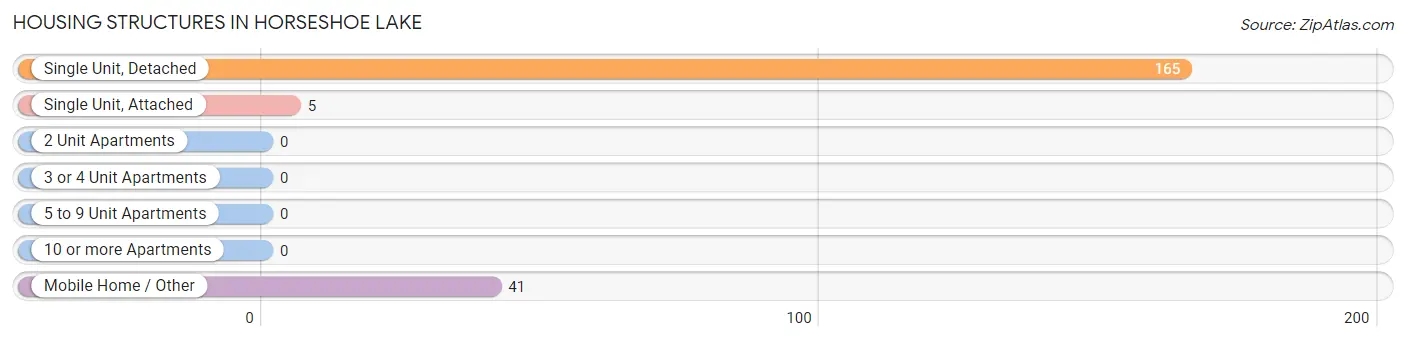
| Structure Type | # Housing Units | % Housing Units |
| Single Unit, Detached | 165 | 78.2% |
| Single Unit, Attached | 5 | 2.4% |
| 2 Unit Apartments | 0 | 0.0% |
| 3 or 4 Unit Apartments | 0 | 0.0% |
| 5 to 9 Unit Apartments | 0 | 0.0% |
| 10 or more Apartments | 0 | 0.0% |
| Mobile Home / Other | 41 | 19.4% |
| Total | 211 | 100.0% |
Housing Structures by Occupancy in Horseshoe Lake
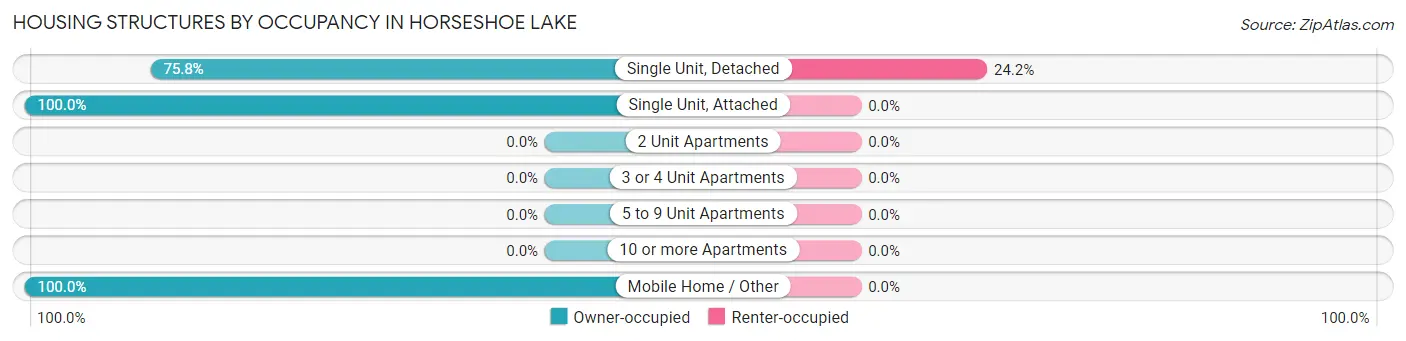
| Structure Type | Owner-occupied | Renter-occupied |
| Single Unit, Detached | 125 (75.8%) | 40 (24.2%) |
| Single Unit, Attached | 5 (100.0%) | 0 (0.0%) |
| 2 Unit Apartments | 0 (0.0%) | 0 (0.0%) |
| 3 or 4 Unit Apartments | 0 (0.0%) | 0 (0.0%) |
| 5 to 9 Unit Apartments | 0 (0.0%) | 0 (0.0%) |
| 10 or more Apartments | 0 (0.0%) | 0 (0.0%) |
| Mobile Home / Other | 41 (100.0%) | 0 (0.0%) |
| Total | 171 (81.0%) | 40 (19.0%) |
Housing Structures by Number of Rooms in Horseshoe Lake
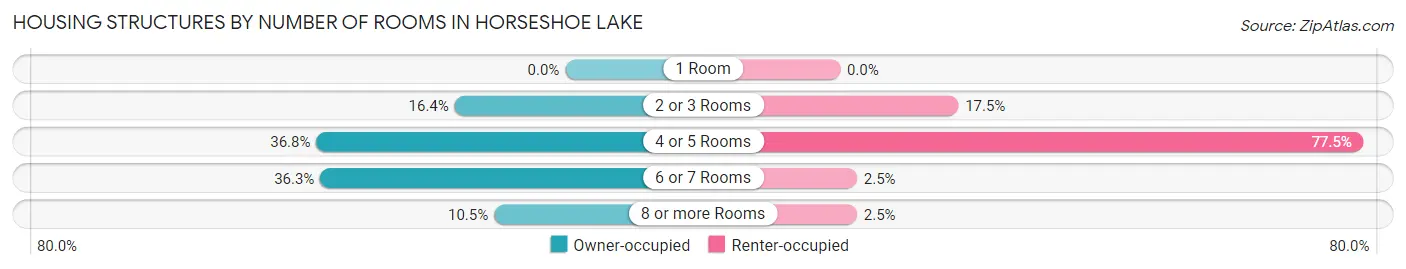
| Number of Rooms | Owner-occupied | Renter-occupied |
| 1 Room | 0 (0.0%) | 0 (0.0%) |
| 2 or 3 Rooms | 28 (16.4%) | 7 (17.5%) |
| 4 or 5 Rooms | 63 (36.8%) | 31 (77.5%) |
| 6 or 7 Rooms | 62 (36.3%) | 1 (2.5%) |
| 8 or more Rooms | 18 (10.5%) | 1 (2.5%) |
| Total | 171 (100.0%) | 40 (100.0%) |
Housing Structure by Heating Type in Horseshoe Lake
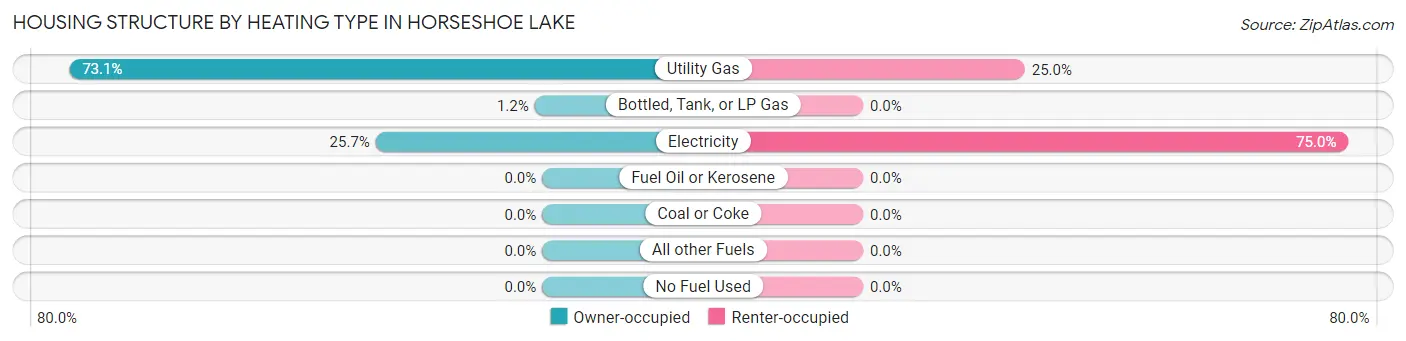
| Heating Type | Owner-occupied | Renter-occupied |
| Utility Gas | 125 (73.1%) | 10 (25.0%) |
| Bottled, Tank, or LP Gas | 2 (1.2%) | 0 (0.0%) |
| Electricity | 44 (25.7%) | 30 (75.0%) |
| Fuel Oil or Kerosene | 0 (0.0%) | 0 (0.0%) |
| Coal or Coke | 0 (0.0%) | 0 (0.0%) |
| All other Fuels | 0 (0.0%) | 0 (0.0%) |
| No Fuel Used | 0 (0.0%) | 0 (0.0%) |
| Total | 171 (100.0%) | 40 (100.0%) |
Household Vehicle Usage in Horseshoe Lake
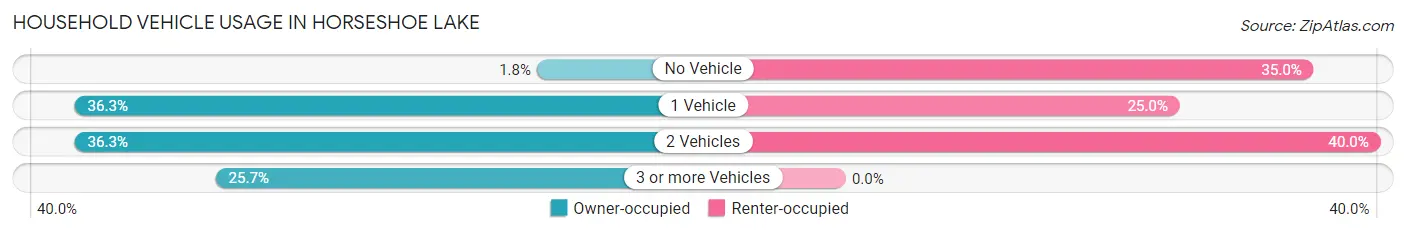
| Vehicles per Household | Owner-occupied | Renter-occupied |
| No Vehicle | 3 (1.8%) | 14 (35.0%) |
| 1 Vehicle | 62 (36.3%) | 10 (25.0%) |
| 2 Vehicles | 62 (36.3%) | 16 (40.0%) |
| 3 or more Vehicles | 44 (25.7%) | 0 (0.0%) |
| Total | 171 (100.0%) | 40 (100.0%) |
Real Estate & Mortgages in Horseshoe Lake
Real Estate and Mortgage Overview in Horseshoe Lake
| Characteristic | Without Mortgage | With Mortgage |
| Housing Units | 126 | 45 |
| Median Property Value | $83,300 | $90,600 |
| Median Household Income | $34,750 | $4 |
| Monthly Housing Costs | $308 | $2 |
| Real Estate Taxes | $465 | $7 |
Property Value by Mortgage Status in Horseshoe Lake
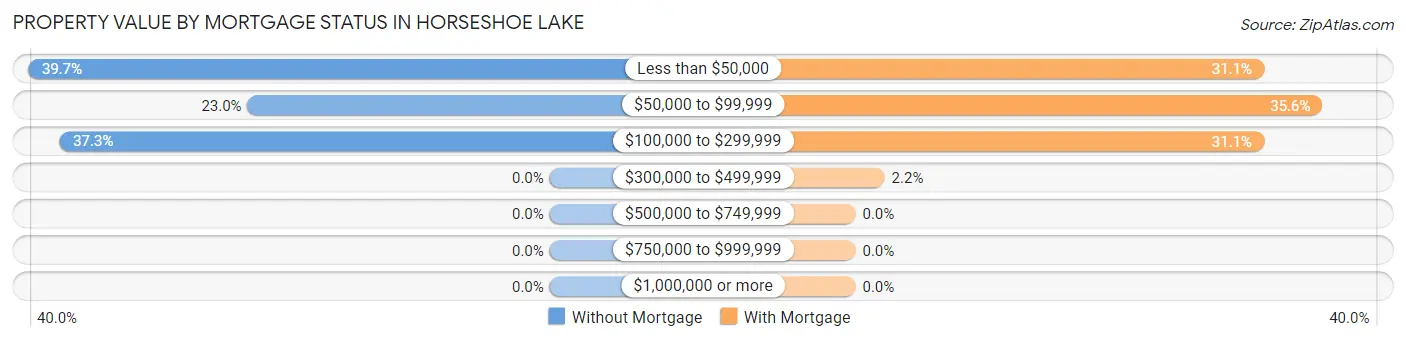
| Property Value | Without Mortgage | With Mortgage |
| Less than $50,000 | 50 (39.7%) | 14 (31.1%) |
| $50,000 to $99,999 | 29 (23.0%) | 16 (35.6%) |
| $100,000 to $299,999 | 47 (37.3%) | 14 (31.1%) |
| $300,000 to $499,999 | 0 (0.0%) | 1 (2.2%) |
| $500,000 to $749,999 | 0 (0.0%) | 0 (0.0%) |
| $750,000 to $999,999 | 0 (0.0%) | 0 (0.0%) |
| $1,000,000 or more | 0 (0.0%) | 0 (0.0%) |
| Total | 126 (100.0%) | 45 (100.0%) |
Household Income by Mortgage Status in Horseshoe Lake
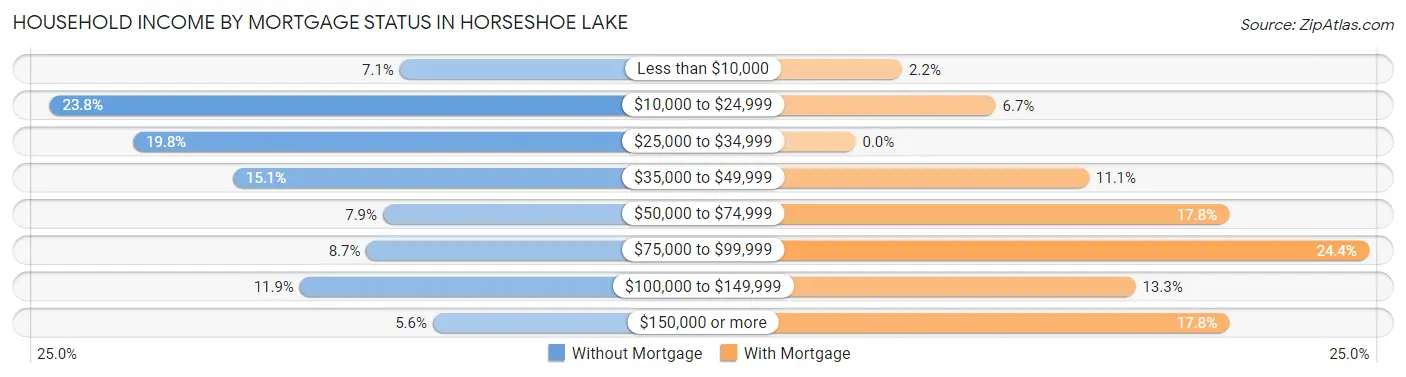
| Household Income | Without Mortgage | With Mortgage |
| Less than $10,000 | 9 (7.1%) | 1 (2.2%) |
| $10,000 to $24,999 | 30 (23.8%) | 3 (6.7%) |
| $25,000 to $34,999 | 25 (19.8%) | 0 (0.0%) |
| $35,000 to $49,999 | 19 (15.1%) | 5 (11.1%) |
| $50,000 to $74,999 | 10 (7.9%) | 8 (17.8%) |
| $75,000 to $99,999 | 11 (8.7%) | 11 (24.4%) |
| $100,000 to $149,999 | 15 (11.9%) | 6 (13.3%) |
| $150,000 or more | 7 (5.6%) | 8 (17.8%) |
| Total | 126 (100.0%) | 45 (100.0%) |
Property Value to Household Income Ratio in Horseshoe Lake
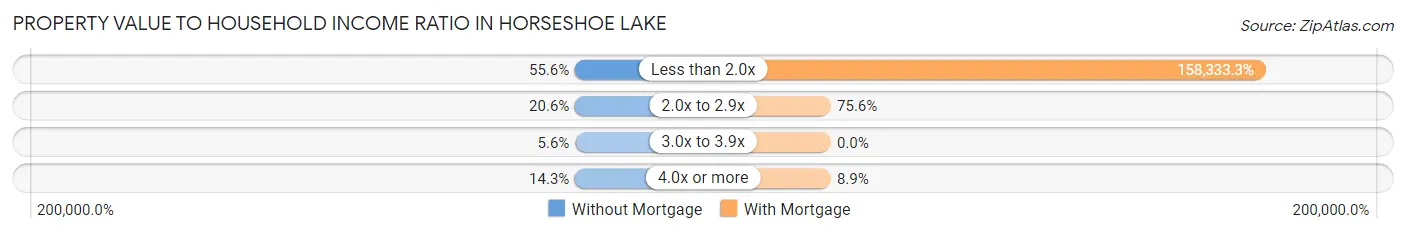
| Value-to-Income Ratio | Without Mortgage | With Mortgage |
| Less than 2.0x | 70 (55.6%) | 71,250 (158,333.3%) |
| 2.0x to 2.9x | 26 (20.6%) | 34 (75.6%) |
| 3.0x to 3.9x | 7 (5.6%) | 0 (0.0%) |
| 4.0x or more | 18 (14.3%) | 4 (8.9%) |
| Total | 126 (100.0%) | 45 (100.0%) |
Real Estate Taxes by Mortgage Status in Horseshoe Lake
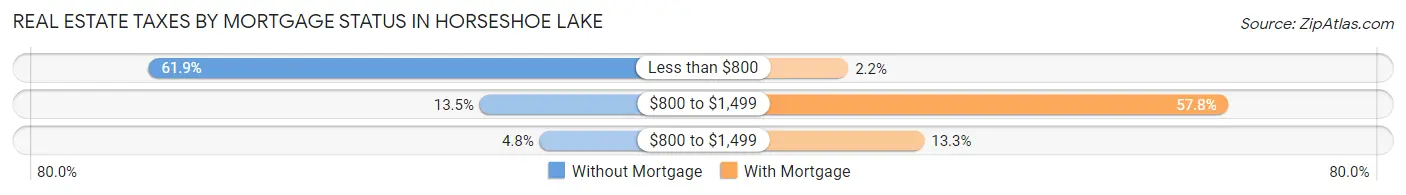
| Property Taxes | Without Mortgage | With Mortgage |
| Less than $800 | 78 (61.9%) | 1 (2.2%) |
| $800 to $1,499 | 17 (13.5%) | 26 (57.8%) |
| $800 to $1,499 | 6 (4.8%) | 6 (13.3%) |
| Total | 126 (100.0%) | 45 (100.0%) |
Health & Disability in Horseshoe Lake
Health Insurance Coverage by Age in Horseshoe Lake
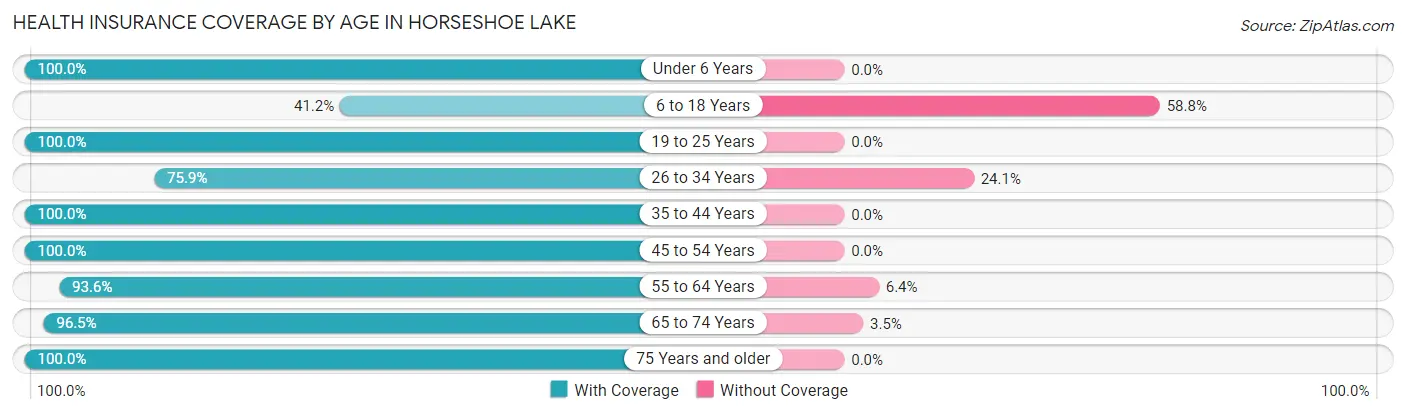
| Age Bracket | With Coverage | Without Coverage |
| Under 6 Years | 8 (100.0%) | 0 (0.0%) |
| 6 to 18 Years | 7 (41.2%) | 10 (58.8%) |
| 19 to 25 Years | 10 (100.0%) | 0 (0.0%) |
| 26 to 34 Years | 22 (75.9%) | 7 (24.1%) |
| 35 to 44 Years | 21 (100.0%) | 0 (0.0%) |
| 45 to 54 Years | 59 (100.0%) | 0 (0.0%) |
| 55 to 64 Years | 131 (93.6%) | 9 (6.4%) |
| 65 to 74 Years | 55 (96.5%) | 2 (3.5%) |
| 75 Years and older | 52 (100.0%) | 0 (0.0%) |
| Total | 365 (92.9%) | 28 (7.1%) |
Health Insurance Coverage by Citizenship Status in Horseshoe Lake
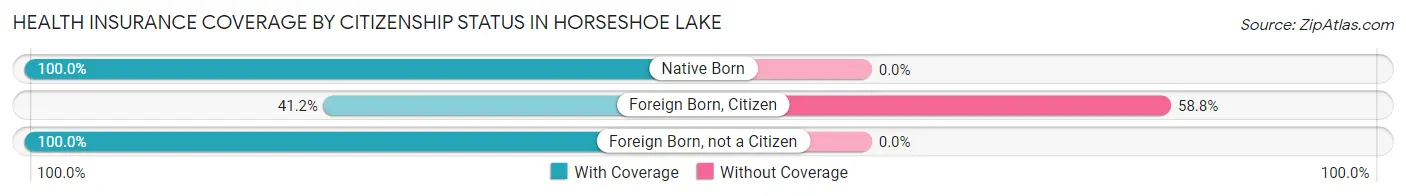
| Citizenship Status | With Coverage | Without Coverage |
| Native Born | 8 (100.0%) | 0 (0.0%) |
| Foreign Born, Citizen | 7 (41.2%) | 10 (58.8%) |
| Foreign Born, not a Citizen | 10 (100.0%) | 0 (0.0%) |
Health Insurance Coverage by Household Income in Horseshoe Lake
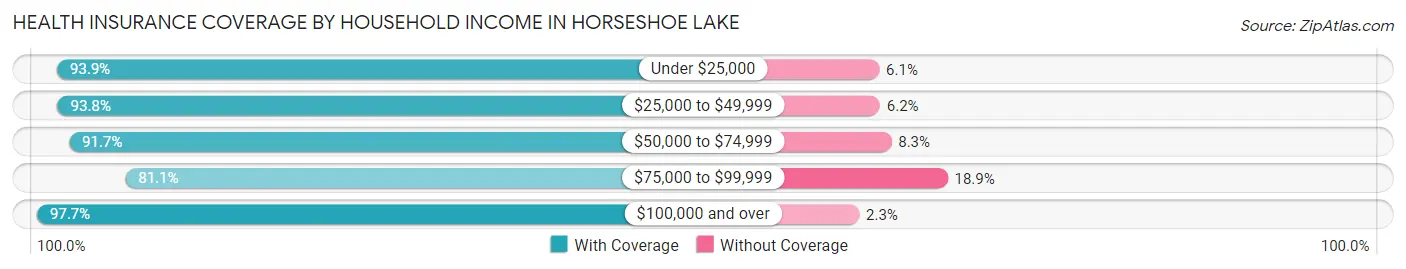
| Household Income | With Coverage | Without Coverage |
| Under $25,000 | 62 (93.9%) | 4 (6.1%) |
| $25,000 to $49,999 | 106 (93.8%) | 7 (6.2%) |
| $50,000 to $74,999 | 55 (91.7%) | 5 (8.3%) |
| $75,000 to $99,999 | 43 (81.1%) | 10 (18.9%) |
| $100,000 and over | 85 (97.7%) | 2 (2.3%) |
Public vs Private Health Insurance Coverage by Age in Horseshoe Lake
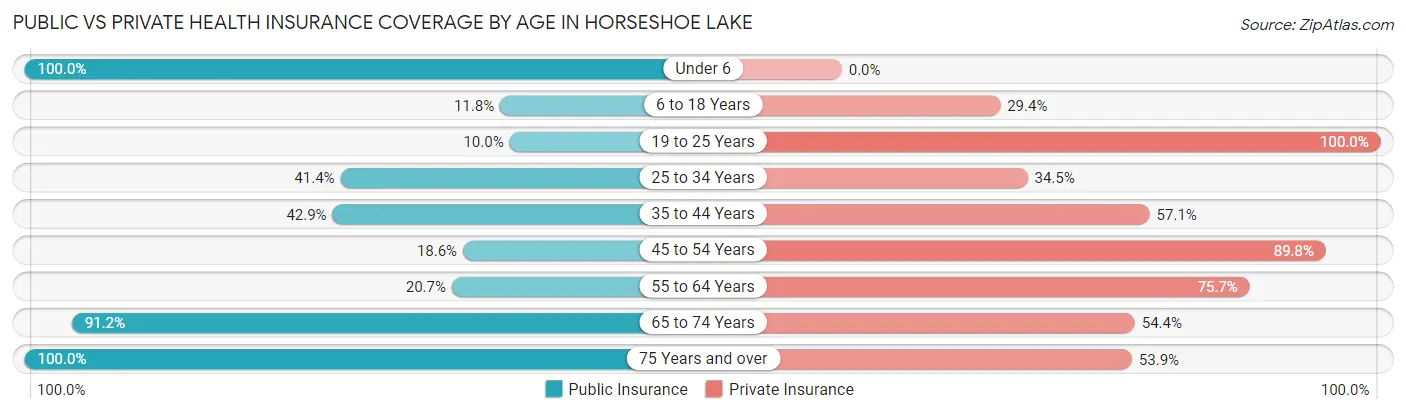
| Age Bracket | Public Insurance | Private Insurance |
| Under 6 | 8 (100.0%) | 0 (0.0%) |
| 6 to 18 Years | 2 (11.8%) | 5 (29.4%) |
| 19 to 25 Years | 1 (10.0%) | 10 (100.0%) |
| 25 to 34 Years | 12 (41.4%) | 10 (34.5%) |
| 35 to 44 Years | 9 (42.9%) | 12 (57.1%) |
| 45 to 54 Years | 11 (18.6%) | 53 (89.8%) |
| 55 to 64 Years | 29 (20.7%) | 106 (75.7%) |
| 65 to 74 Years | 52 (91.2%) | 31 (54.4%) |
| 75 Years and over | 52 (100.0%) | 28 (53.8%) |
| Total | 176 (44.8%) | 255 (64.9%) |
Disability Status by Sex by Age in Horseshoe Lake
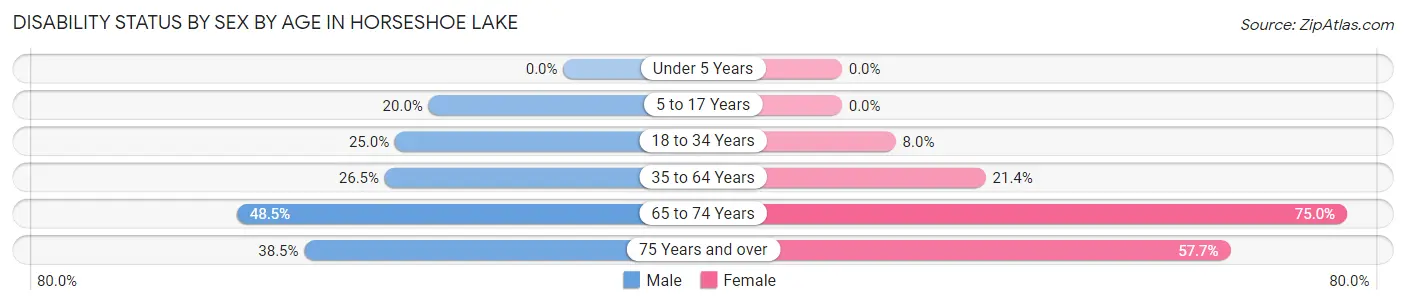
| Age Bracket | Male | Female |
| Under 5 Years | 0 (0.0%) | 0 (0.0%) |
| 5 to 17 Years | 2 (20.0%) | 0 (0.0%) |
| 18 to 34 Years | 5 (25.0%) | 2 (8.0%) |
| 35 to 64 Years | 31 (26.5%) | 22 (21.4%) |
| 65 to 74 Years | 16 (48.5%) | 18 (75.0%) |
| 75 Years and over | 10 (38.5%) | 15 (57.7%) |
Disability Class by Sex by Age in Horseshoe Lake
Disability Class: Hearing Difficulty
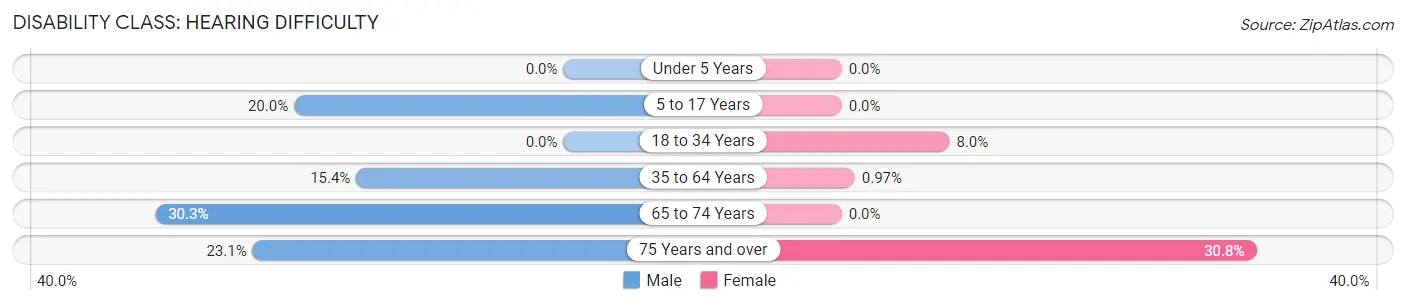
| Age Bracket | Male | Female |
| Under 5 Years | 0 (0.0%) | 0 (0.0%) |
| 5 to 17 Years | 2 (20.0%) | 0 (0.0%) |
| 18 to 34 Years | 0 (0.0%) | 2 (8.0%) |
| 35 to 64 Years | 18 (15.4%) | 1 (1.0%) |
| 65 to 74 Years | 10 (30.3%) | 0 (0.0%) |
| 75 Years and over | 6 (23.1%) | 8 (30.8%) |
Disability Class: Vision Difficulty
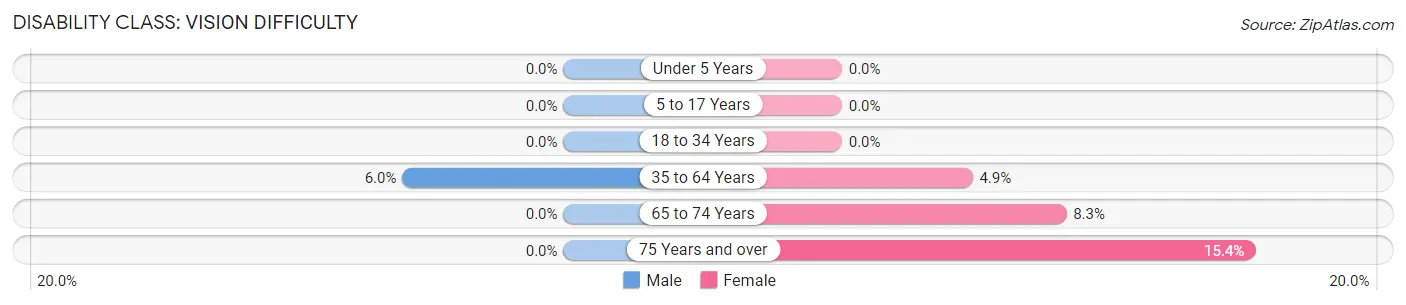
| Age Bracket | Male | Female |
| Under 5 Years | 0 (0.0%) | 0 (0.0%) |
| 5 to 17 Years | 0 (0.0%) | 0 (0.0%) |
| 18 to 34 Years | 0 (0.0%) | 0 (0.0%) |
| 35 to 64 Years | 7 (6.0%) | 5 (4.9%) |
| 65 to 74 Years | 0 (0.0%) | 2 (8.3%) |
| 75 Years and over | 0 (0.0%) | 4 (15.4%) |
Disability Class: Cognitive Difficulty
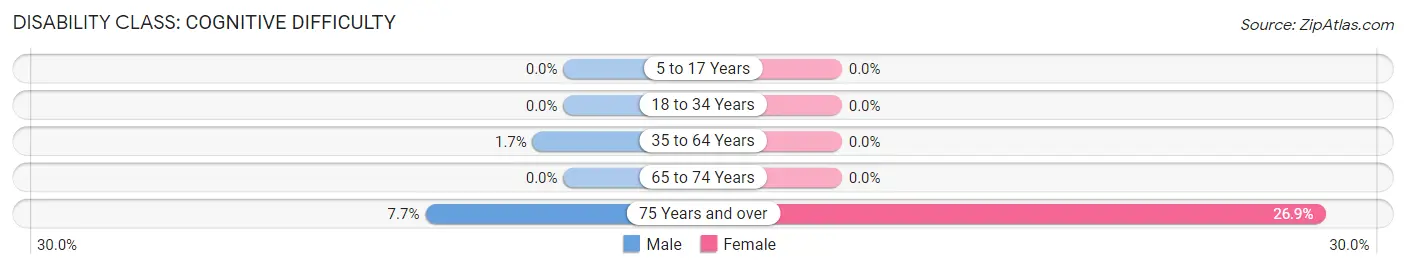
| Age Bracket | Male | Female |
| 5 to 17 Years | 0 (0.0%) | 0 (0.0%) |
| 18 to 34 Years | 0 (0.0%) | 0 (0.0%) |
| 35 to 64 Years | 2 (1.7%) | 0 (0.0%) |
| 65 to 74 Years | 0 (0.0%) | 0 (0.0%) |
| 75 Years and over | 2 (7.7%) | 7 (26.9%) |
Disability Class: Ambulatory Difficulty
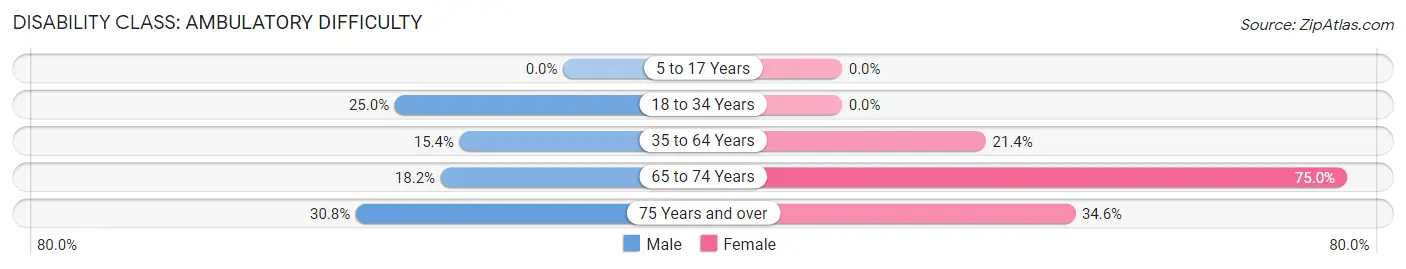
| Age Bracket | Male | Female |
| 5 to 17 Years | 0 (0.0%) | 0 (0.0%) |
| 18 to 34 Years | 5 (25.0%) | 0 (0.0%) |
| 35 to 64 Years | 18 (15.4%) | 22 (21.4%) |
| 65 to 74 Years | 6 (18.2%) | 18 (75.0%) |
| 75 Years and over | 8 (30.8%) | 9 (34.6%) |
Disability Class: Self-Care Difficulty
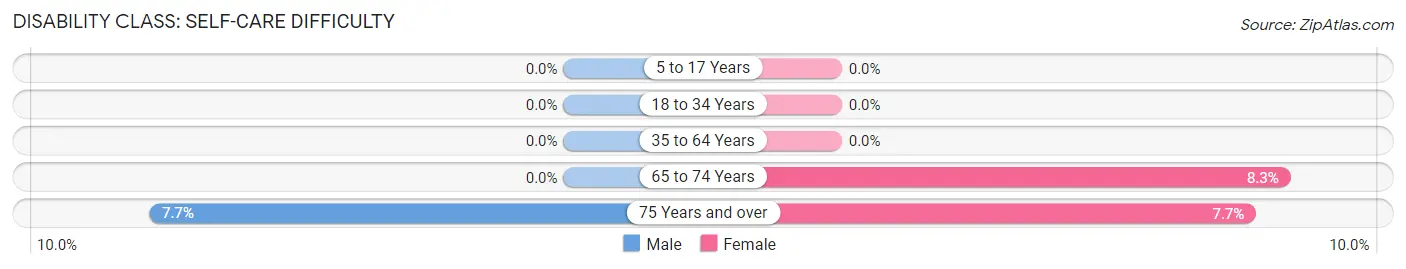
| Age Bracket | Male | Female |
| 5 to 17 Years | 0 (0.0%) | 0 (0.0%) |
| 18 to 34 Years | 0 (0.0%) | 0 (0.0%) |
| 35 to 64 Years | 0 (0.0%) | 0 (0.0%) |
| 65 to 74 Years | 0 (0.0%) | 2 (8.3%) |
| 75 Years and over | 2 (7.7%) | 2 (7.7%) |
Technology Access in Horseshoe Lake
Computing Device Access in Horseshoe Lake
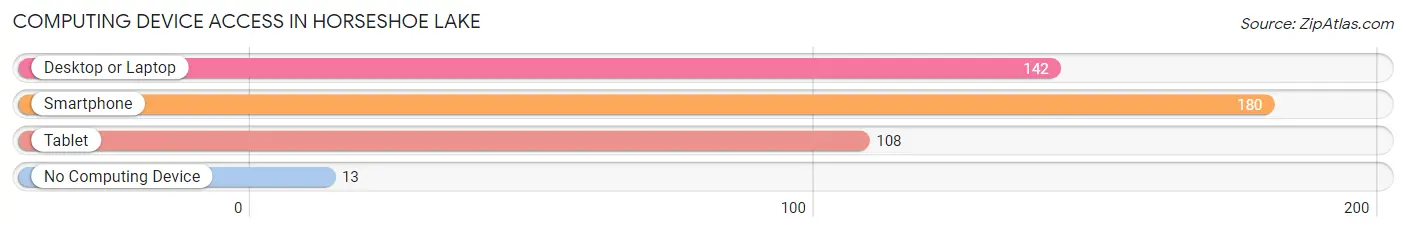
| Device Type | # Households | % Households |
| Desktop or Laptop | 142 | 67.3% |
| Smartphone | 180 | 85.3% |
| Tablet | 108 | 51.2% |
| No Computing Device | 13 | 6.2% |
| Total | 211 | 100.0% |
Internet Access in Horseshoe Lake
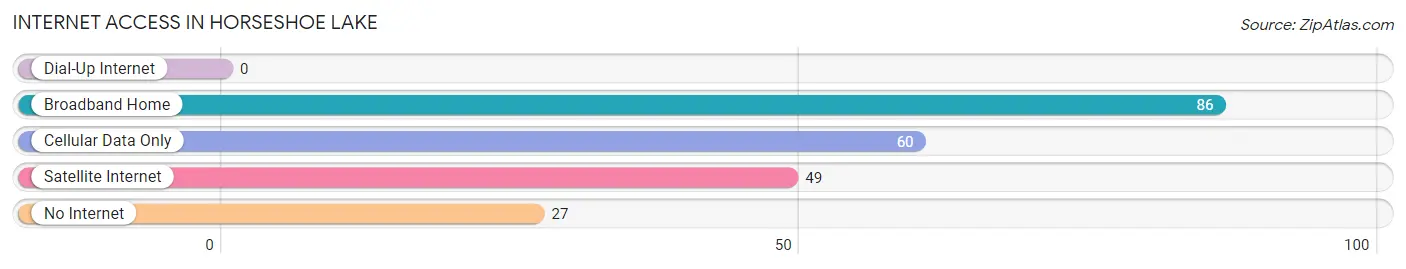
| Internet Type | # Households | % Households |
| Dial-Up Internet | 0 | 0.0% |
| Broadband Home | 86 | 40.8% |
| Cellular Data Only | 60 | 28.4% |
| Satellite Internet | 49 | 23.2% |
| No Internet | 27 | 12.8% |
| Total | 211 | 100.0% |
Horseshoe Lake Summary
Horseshoe Lake is a small unincorporated community located in Crittenden County, Arkansas. It is situated on the western shore of Horseshoe Lake, a natural oxbow lake formed by the Mississippi River. The community is located approximately 10 miles south of Memphis, Tennessee and is part of the Memphis Metropolitan Statistical Area.
History
Horseshoe Lake was first settled in the early 1800s by a group of settlers from Tennessee. The settlers were attracted to the area due to its abundance of natural resources, including timber, fish, and game. The lake was named for its shape, which resembles a horseshoe.
In the late 1800s, the area around Horseshoe Lake began to develop as a resort destination. The lake was a popular spot for fishing, boating, and swimming. Several resorts were built along the lake, including the Horseshoe Lake Hotel, which was built in 1891.
In the early 1900s, the area around Horseshoe Lake began to develop as an agricultural community. The area was known for its cotton and soybean production. The community also had a sawmill, a gristmill, and a general store.
Geography
Horseshoe Lake is located in Crittenden County, Arkansas. It is situated on the western shore of Horseshoe Lake, a natural oxbow lake formed by the Mississippi River. The lake is approximately 4,000 acres in size and is surrounded by a variety of wildlife, including bald eagles, ospreys, and great blue herons.
The community is located approximately 10 miles south of Memphis, Tennessee and is part of the Memphis Metropolitan Statistical Area. The nearest major city is West Memphis, Arkansas, which is located approximately 15 miles to the south.
Economy
The economy of Horseshoe Lake is largely based on agriculture and tourism. The area is known for its cotton and soybean production. The community also has a sawmill, a gristmill, and a general store.
Tourism is also an important part of the local economy. The lake is a popular spot for fishing, boating, and swimming. Several resorts are located along the lake, including the Horseshoe Lake Hotel, which was built in 1891.
Demographics
As of the 2010 census, the population of Horseshoe Lake was 1,072. The racial makeup of the community was 95.3% White, 1.7% African American, 0.3% Native American, 0.2% Asian, 0.1% Pacific Islander, and 2.4% from other races.
The median household income in Horseshoe Lake was $37,500, and the median family income was $41,250. The per capita income was $17,845. Approximately 11.3% of the population was below the poverty line.
Conclusion
Horseshoe Lake is a small unincorporated community located in Crittenden County, Arkansas. It is situated on the western shore of Horseshoe Lake, a natural oxbow lake formed by the Mississippi River. The community is located approximately 10 miles south of Memphis, Tennessee and is part of the Memphis Metropolitan Statistical Area. The economy of Horseshoe Lake is largely based on agriculture and tourism. The area is known for its cotton and soybean production, and the lake is a popular spot for fishing, boating, and swimming. As of the 2010 census, the population of Horseshoe Lake was 1,072. The median household income in Horseshoe Lake was $37,500, and the median family income was $41,250. The per capita income was $17,845. Approximately 11.3% of the population was below the poverty line.
Common Questions
What is Per Capita Income in Horseshoe Lake?
Per Capita income in Horseshoe Lake is $35,029.
What is the Median Family Income in Horseshoe Lake?
Median Family Income in Horseshoe Lake is $67,500.
What is the Median Household income in Horseshoe Lake?
Median Household Income in Horseshoe Lake is $45,795.
What is Income or Wage Gap in Horseshoe Lake?
Income or Wage Gap in Horseshoe Lake is 5.8%.
Women in Horseshoe Lake earn 94.2 cents for every dollar earned by a man.
What is Inequality or Gini Index in Horseshoe Lake?
Inequality or Gini Index in Horseshoe Lake is 0.42.
What is the Total Population of Horseshoe Lake?
Total Population of Horseshoe Lake is 393.
What is the Total Male Population of Horseshoe Lake?
Total Male Population of Horseshoe Lake is 211.
What is the Total Female Population of Horseshoe Lake?
Total Female Population of Horseshoe Lake is 182.
What is the Ratio of Males per 100 Females in Horseshoe Lake?
There are 115.93 Males per 100 Females in Horseshoe Lake.
What is the Ratio of Females per 100 Males in Horseshoe Lake?
There are 86.26 Females per 100 Males in Horseshoe Lake.
What is the Median Population Age in Horseshoe Lake?
Median Population Age in Horseshoe Lake is 59.0 Years.
What is the Average Family Size in Horseshoe Lake
Average Family Size in Horseshoe Lake is 2.3 People.
What is the Average Household Size in Horseshoe Lake
Average Household Size in Horseshoe Lake is 1.8 People.
How Large is the Labor Force in Horseshoe Lake?
There are 222 People in the Labor Forcein in Horseshoe Lake.
What is the Percentage of People in the Labor Force in Horseshoe Lake?
58.1% of People are in the Labor Force in Horseshoe Lake.
What is the Unemployment Rate in Horseshoe Lake?
Unemployment Rate in Horseshoe Lake is 7.7%.