Avilla, AR Map & Demographics
Avilla Map
Avilla Overview
$60,546
PER CAPITA INCOME
$135,294
AVG FAMILY INCOME
$131,250
AVG HOUSEHOLD INCOME
42.7%
WAGE / INCOME GAP [ % ]
57.3¢/ $1
WAGE / INCOME GAP [ $ ]
0.41
INEQUALITY / GINI INDEX
1,461
TOTAL POPULATION
794
MALE POPULATION
667
FEMALE POPULATION
119.04
MALES / 100 FEMALES
84.01
FEMALES / 100 MALES
43.9
MEDIAN AGE
2.9
AVG FAMILY SIZE
2.7
AVG HOUSEHOLD SIZE
833
LABOR FORCE [ PEOPLE ]
66.1%
PERCENT IN LABOR FORCE
Income in Avilla
Income Overview in Avilla
Per Capita Income in Avilla is $60,546, while median incomes of families and households are $135,294 and $131,250 respectively.
| Characteristic | Number | Measure |
| Per Capita Income | 1,461 | $60,546 |
| Median Family Income | 478 | $135,294 |
| Mean Family Income | 478 | $171,663 |
| Median Household Income | 537 | $131,250 |
| Mean Household Income | 537 | $163,406 |
| Income Deficit | 478 | $0 |
| Wage / Income Gap (%) | 1,461 | 42.67% |
| Wage / Income Gap ($) | 1,461 | 57.33¢ per $1 |
| Gini / Inequality Index | 1,461 | 0.41 |
Earnings by Sex in Avilla
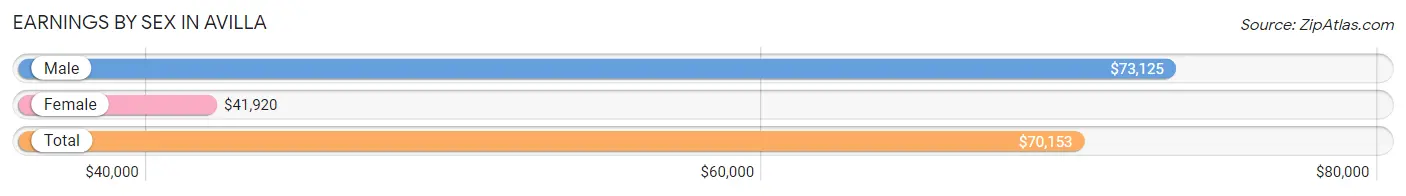
Average Earnings in Avilla are $70,153, $73,125 for men and $41,920 for women, a difference of 42.7%.
| Sex | Number | Average Earnings |
| Male | 475 (55.2%) | $73,125 |
| Female | 385 (44.8%) | $41,920 |
| Total | 860 (100.0%) | $70,153 |
Earnings by Sex by Income Bracket in Avilla
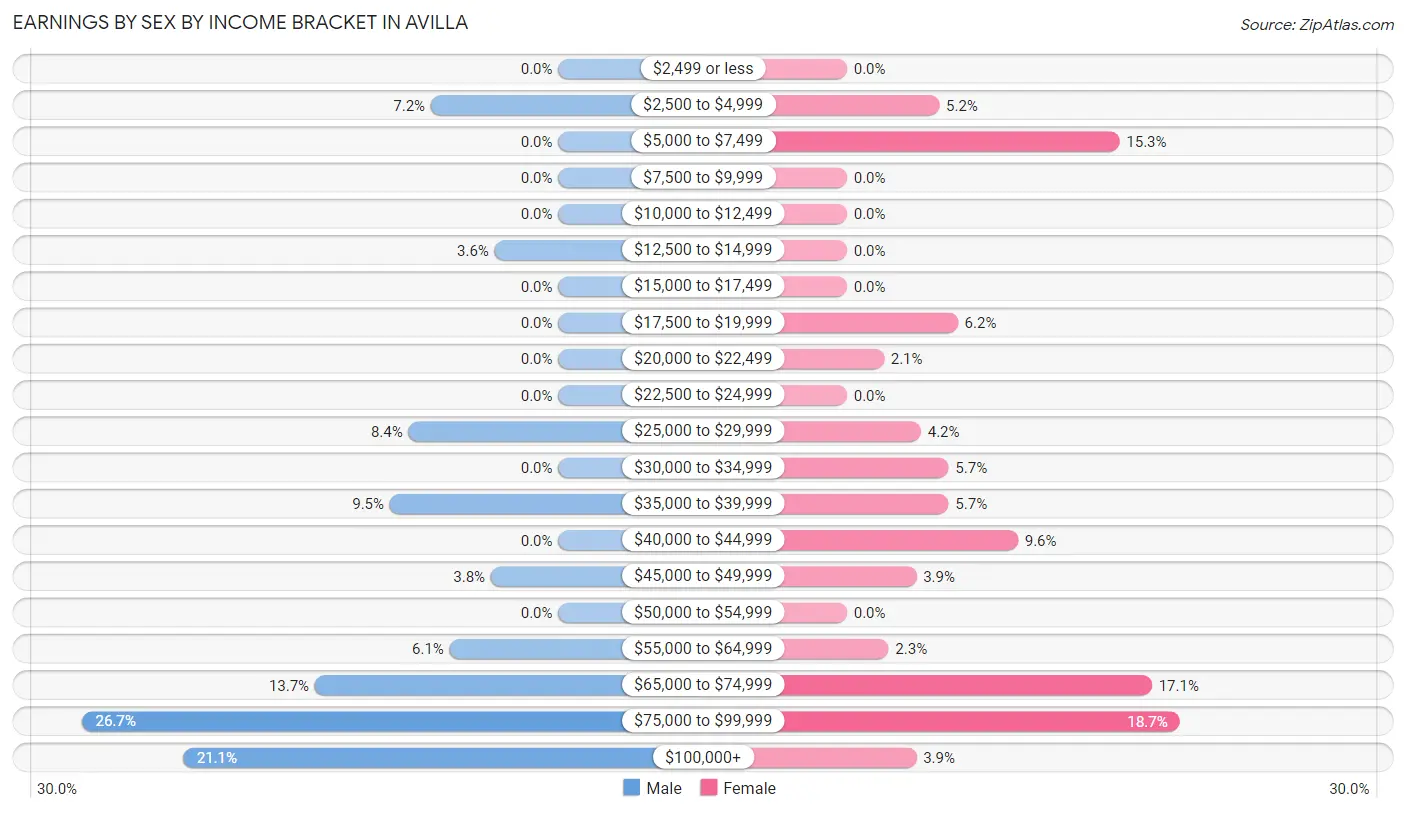
The most common earnings brackets in Avilla are $75,000 to $99,999 for men (127 | 26.7%) and $75,000 to $99,999 for women (72 | 18.7%).
| Income | Male | Female |
| $2,499 or less | 0 (0.0%) | 0 (0.0%) |
| $2,500 to $4,999 | 34 (7.2%) | 20 (5.2%) |
| $5,000 to $7,499 | 0 (0.0%) | 59 (15.3%) |
| $7,500 to $9,999 | 0 (0.0%) | 0 (0.0%) |
| $10,000 to $12,499 | 0 (0.0%) | 0 (0.0%) |
| $12,500 to $14,999 | 17 (3.6%) | 0 (0.0%) |
| $15,000 to $17,499 | 0 (0.0%) | 0 (0.0%) |
| $17,500 to $19,999 | 0 (0.0%) | 24 (6.2%) |
| $20,000 to $22,499 | 0 (0.0%) | 8 (2.1%) |
| $22,500 to $24,999 | 0 (0.0%) | 0 (0.0%) |
| $25,000 to $29,999 | 40 (8.4%) | 16 (4.2%) |
| $30,000 to $34,999 | 0 (0.0%) | 22 (5.7%) |
| $35,000 to $39,999 | 45 (9.5%) | 22 (5.7%) |
| $40,000 to $44,999 | 0 (0.0%) | 37 (9.6%) |
| $45,000 to $49,999 | 18 (3.8%) | 15 (3.9%) |
| $50,000 to $54,999 | 0 (0.0%) | 0 (0.0%) |
| $55,000 to $64,999 | 29 (6.1%) | 9 (2.3%) |
| $65,000 to $74,999 | 65 (13.7%) | 66 (17.1%) |
| $75,000 to $99,999 | 127 (26.7%) | 72 (18.7%) |
| $100,000+ | 100 (21.0%) | 15 (3.9%) |
| Total | 475 (100.0%) | 385 (100.0%) |
Earnings by Sex by Educational Attainment in Avilla
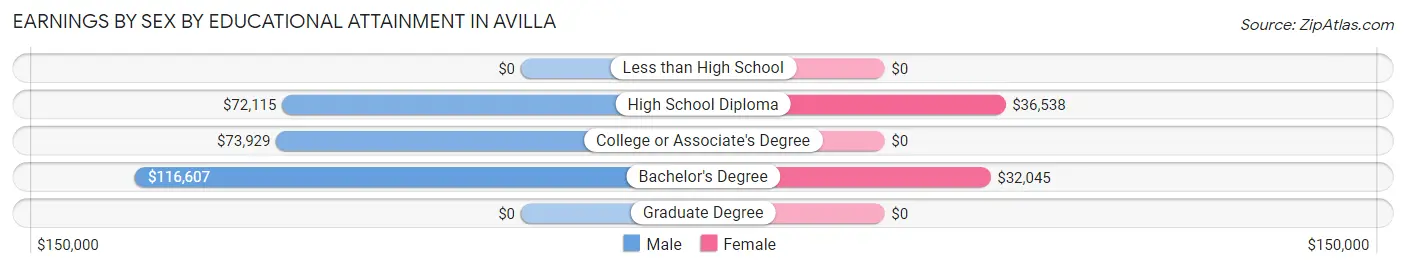
Average earnings in Avilla are $78,393 for men and $44,444 for women, a difference of 43.3%. Men with an educational attainment of bachelor's degree enjoy the highest average annual earnings of $116,607, while those with high school diploma education earn the least with $72,115. Women with an educational attainment of high school diploma earn the most with the average annual earnings of $36,538, while those with bachelor's degree education have the smallest earnings of $32,045.
| Educational Attainment | Male Income | Female Income |
| Less than High School | - | - |
| High School Diploma | $72,115 | $36,538 |
| College or Associate's Degree | $73,929 | $0 |
| Bachelor's Degree | $116,607 | $32,045 |
| Graduate Degree | - | - |
| Total | $78,393 | $44,444 |
Family Income in Avilla
Family Income Brackets in Avilla
According to the Avilla family income data, there are 120 families falling into the $150,000 to $199,999 income range, which is the most common income bracket and makes up 25.1% of all families.
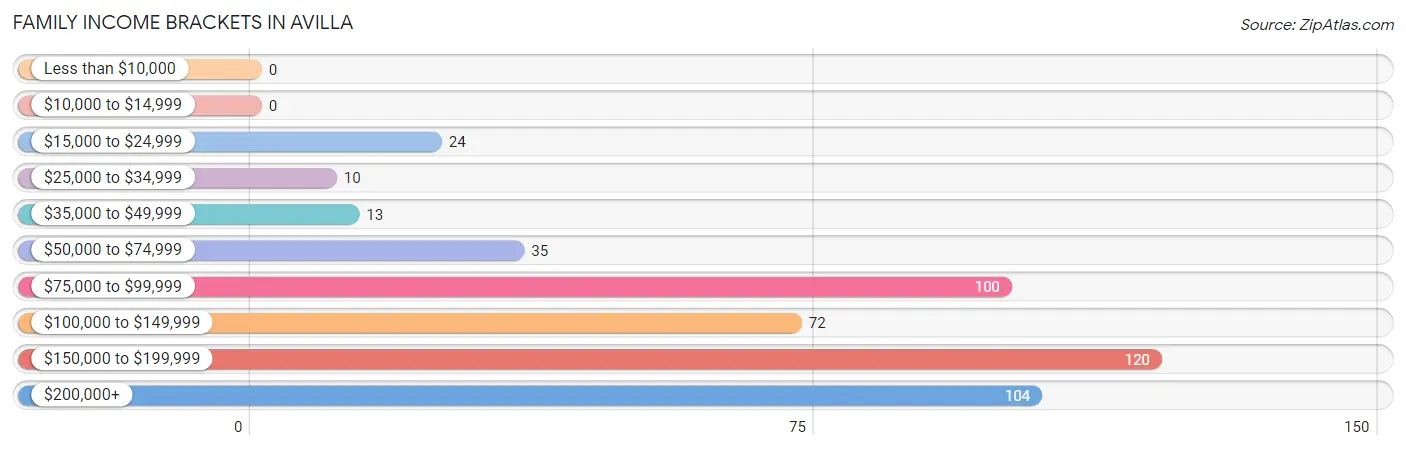
| Income Bracket | # Families | % Families |
| Less than $10,000 | 0 | 0.0% |
| $10,000 to $14,999 | 0 | 0.0% |
| $15,000 to $24,999 | 24 | 5.0% |
| $25,000 to $34,999 | 10 | 2.1% |
| $35,000 to $49,999 | 13 | 2.7% |
| $50,000 to $74,999 | 35 | 7.3% |
| $75,000 to $99,999 | 100 | 20.9% |
| $100,000 to $149,999 | 72 | 15.1% |
| $150,000 to $199,999 | 120 | 25.1% |
| $200,000+ | 104 | 21.8% |
Family Income by Famaliy Size in Avilla
4-person families (100 | 20.9%) account for the highest median family income in Avilla with $184,489 per family, while 2-person families (244 | 51.0%) have the highest median income of $57,298 per family member.
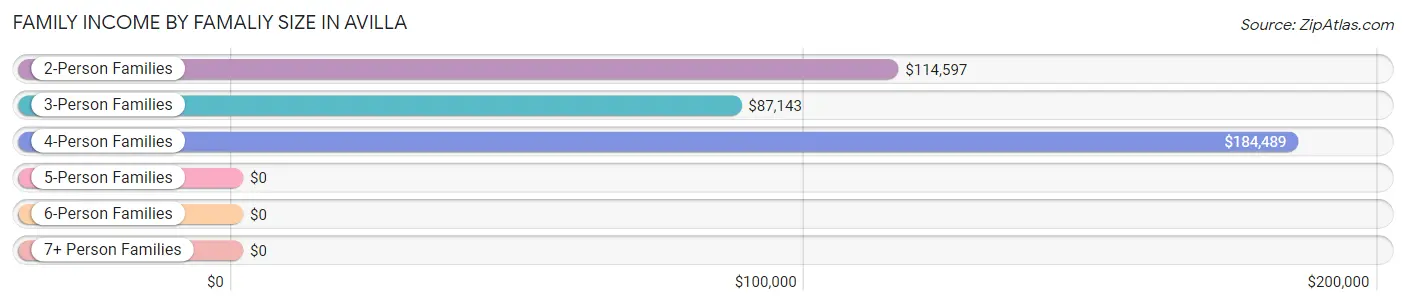
| Income Bracket | # Families | Median Income |
| 2-Person Families | 244 (51.0%) | $114,597 |
| 3-Person Families | 86 (18.0%) | $87,143 |
| 4-Person Families | 100 (20.9%) | $184,489 |
| 5-Person Families | 48 (10.0%) | $0 |
| 6-Person Families | 0 (0.0%) | $0 |
| 7+ Person Families | 0 (0.0%) | $0 |
| Total | 478 (100.0%) | $135,294 |
Family Income by Number of Earners in Avilla
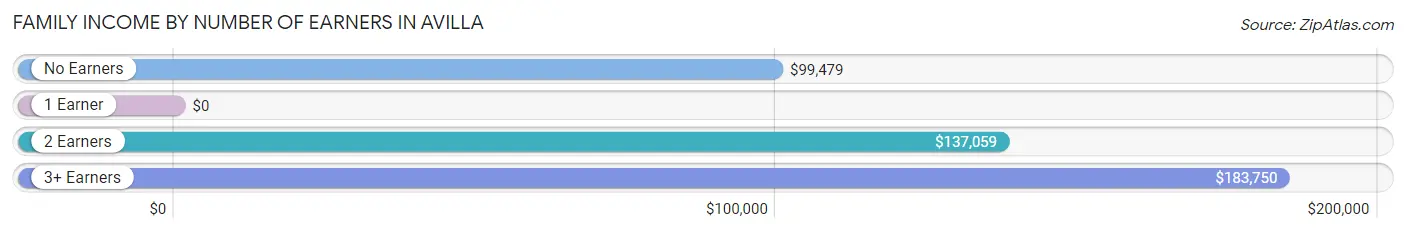
| Number of Earners | # Families | Median Income |
| No Earners | 39 (8.2%) | $99,479 |
| 1 Earner | 207 (43.3%) | $0 |
| 2 Earners | 164 (34.3%) | $137,059 |
| 3+ Earners | 68 (14.2%) | $183,750 |
| Total | 478 (100.0%) | $135,294 |
Household Income in Avilla
Household Income Brackets in Avilla
With 144 households falling in the category, the $150,000 to $199,999 income range is the most frequent in Avilla, accounting for 26.8% of all households.
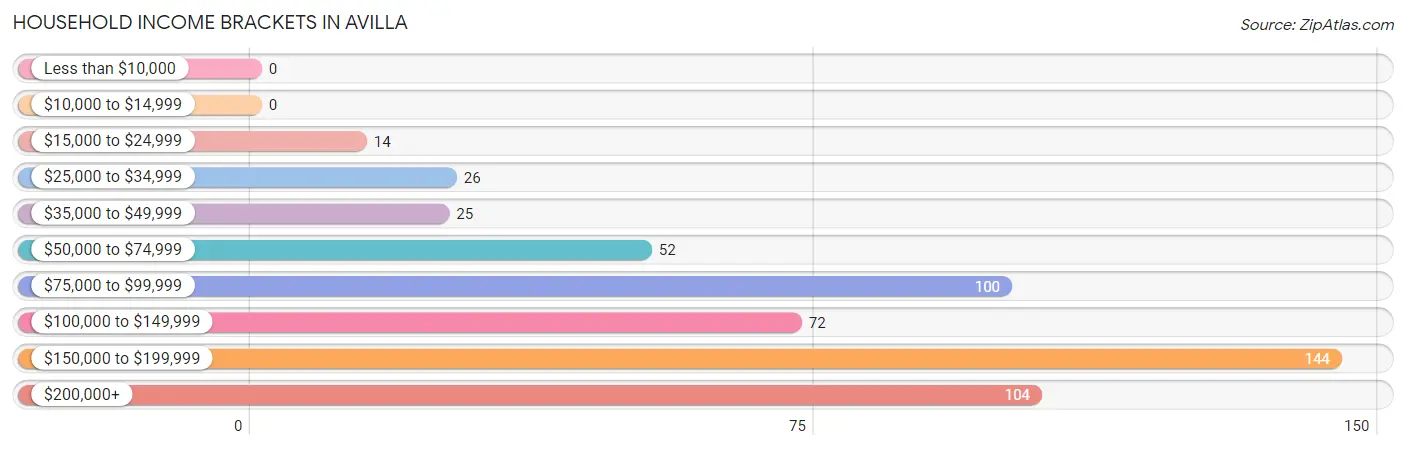
| Income Bracket | # Households | % Households |
| Less than $10,000 | 0 | 0.0% |
| $10,000 to $14,999 | 0 | 0.0% |
| $15,000 to $24,999 | 14 | 2.6% |
| $25,000 to $34,999 | 26 | 4.8% |
| $35,000 to $49,999 | 25 | 4.7% |
| $50,000 to $74,999 | 52 | 9.7% |
| $75,000 to $99,999 | 100 | 18.6% |
| $100,000 to $149,999 | 72 | 13.4% |
| $150,000 to $199,999 | 144 | 26.8% |
| $200,000+ | 104 | 19.4% |
Household Income by Householder Age in Avilla
The median household income in Avilla is $131,250, with the highest median household income of $166,250 found in the 45 to 64 years age bracket for the primary householder. A total of 246 households (45.8%) fall into this category.
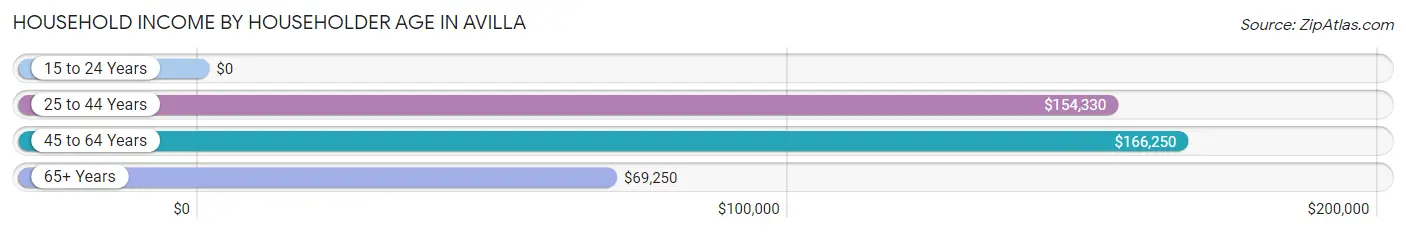
| Income Bracket | # Households | Median Income |
| 15 to 24 Years | 0 (0.0%) | $0 |
| 25 to 44 Years | 175 (32.6%) | $154,330 |
| 45 to 64 Years | 246 (45.8%) | $166,250 |
| 65+ Years | 116 (21.6%) | $69,250 |
| Total | 537 (100.0%) | $131,250 |
Poverty in Avilla
Income Below Poverty by Sex and Age in Avilla
With 7.7% poverty level for males and 6.9% for females among the residents of Avilla, 6 to 11 year old males and 12 to 14 year old females are the most vulnerable to poverty, with 21 males (42.0%) and 22 females (59.5%) in their respective age groups living below the poverty level.
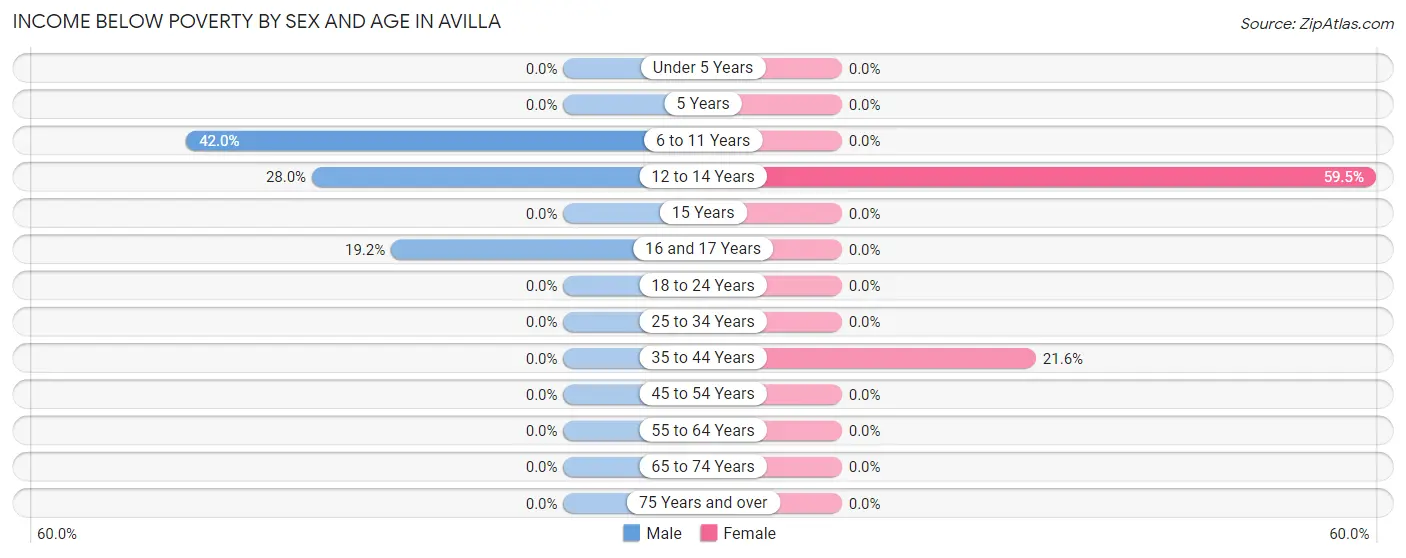
| Age Bracket | Male | Female |
| Under 5 Years | 0 (0.0%) | 0 (0.0%) |
| 5 Years | 0 (0.0%) | 0 (0.0%) |
| 6 to 11 Years | 21 (42.0%) | 0 (0.0%) |
| 12 to 14 Years | 21 (28.0%) | 22 (59.5%) |
| 15 Years | 0 (0.0%) | 0 (0.0%) |
| 16 and 17 Years | 19 (19.2%) | 0 (0.0%) |
| 18 to 24 Years | 0 (0.0%) | 0 (0.0%) |
| 25 to 34 Years | 0 (0.0%) | 0 (0.0%) |
| 35 to 44 Years | 0 (0.0%) | 24 (21.6%) |
| 45 to 54 Years | 0 (0.0%) | 0 (0.0%) |
| 55 to 64 Years | 0 (0.0%) | 0 (0.0%) |
| 65 to 74 Years | 0 (0.0%) | 0 (0.0%) |
| 75 Years and over | 0 (0.0%) | 0 (0.0%) |
| Total | 61 (7.7%) | 46 (6.9%) |
Income Above Poverty by Sex and Age in Avilla
According to the poverty statistics in Avilla, males aged 18 to 24 years and females aged 6 to 11 years are the age groups that are most secure financially, with 100.0% of males and 100.0% of females in these age groups living above the poverty line.
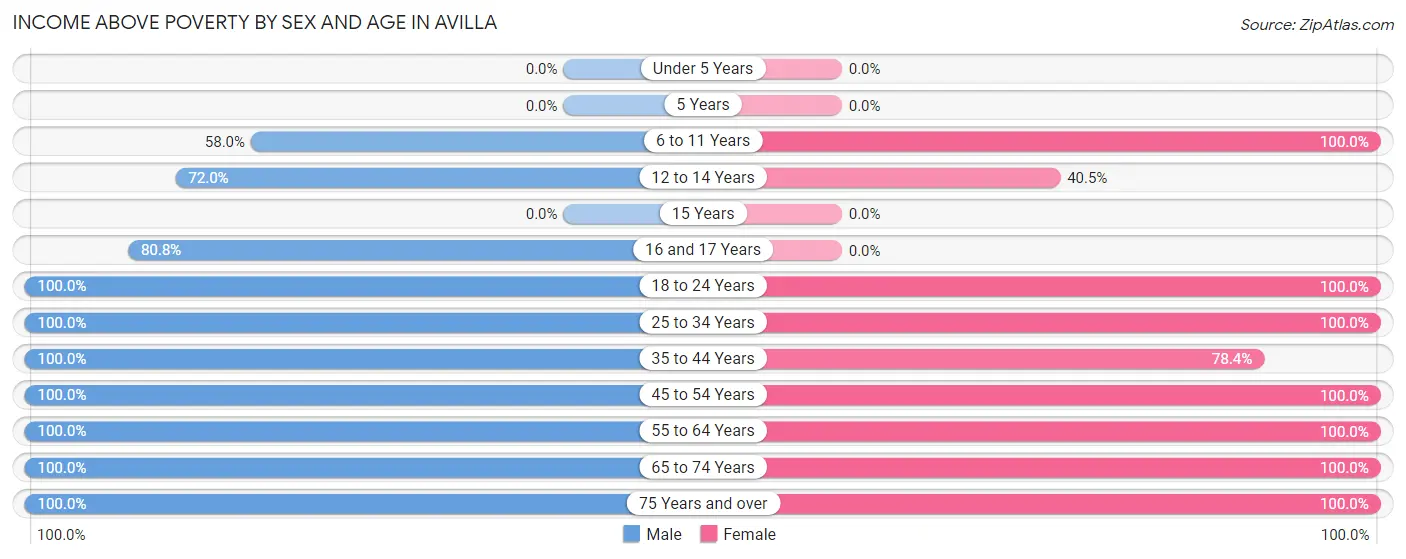
| Age Bracket | Male | Female |
| Under 5 Years | 0 (0.0%) | 0 (0.0%) |
| 5 Years | 0 (0.0%) | 0 (0.0%) |
| 6 to 11 Years | 29 (58.0%) | 39 (100.0%) |
| 12 to 14 Years | 54 (72.0%) | 15 (40.5%) |
| 15 Years | 0 (0.0%) | 0 (0.0%) |
| 16 and 17 Years | 80 (80.8%) | 0 (0.0%) |
| 18 to 24 Years | 76 (100.0%) | 27 (100.0%) |
| 25 to 34 Years | 79 (100.0%) | 69 (100.0%) |
| 35 to 44 Years | 81 (100.0%) | 87 (78.4%) |
| 45 to 54 Years | 138 (100.0%) | 90 (100.0%) |
| 55 to 64 Years | 111 (100.0%) | 174 (100.0%) |
| 65 to 74 Years | 47 (100.0%) | 43 (100.0%) |
| 75 Years and over | 38 (100.0%) | 77 (100.0%) |
| Total | 733 (92.3%) | 621 (93.1%) |
Income Below Poverty Among Married-Couple Families in Avilla
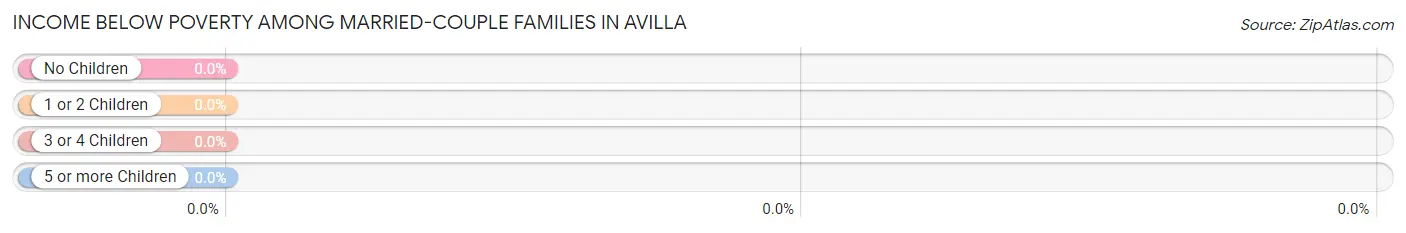
| Children | Above Poverty | Below Poverty |
| No Children | 286 (100.0%) | 0 (0.0%) |
| 1 or 2 Children | 117 (100.0%) | 0 (0.0%) |
| 3 or 4 Children | 7 (100.0%) | 0 (0.0%) |
| 5 or more Children | 0 (0.0%) | 0 (0.0%) |
| Total | 410 (100.0%) | 0 (0.0%) |
Income Below Poverty Among Single-Parent Households in Avilla
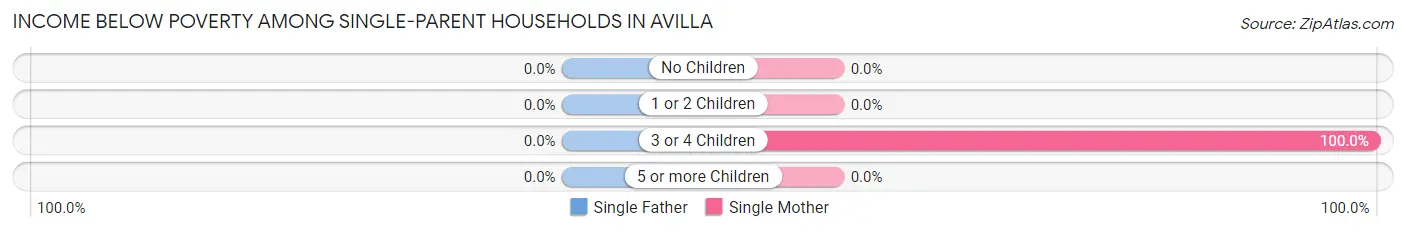
| Children | Single Father | Single Mother |
| No Children | 0 (0.0%) | 0 (0.0%) |
| 1 or 2 Children | 0 (0.0%) | 0 (0.0%) |
| 3 or 4 Children | 0 (0.0%) | 24 (100.0%) |
| 5 or more Children | 0 (0.0%) | 0 (0.0%) |
| Total | 0 (0.0%) | 24 (45.3%) |
Income Below Poverty Among Married-Couple vs Single-Parent Households in Avilla
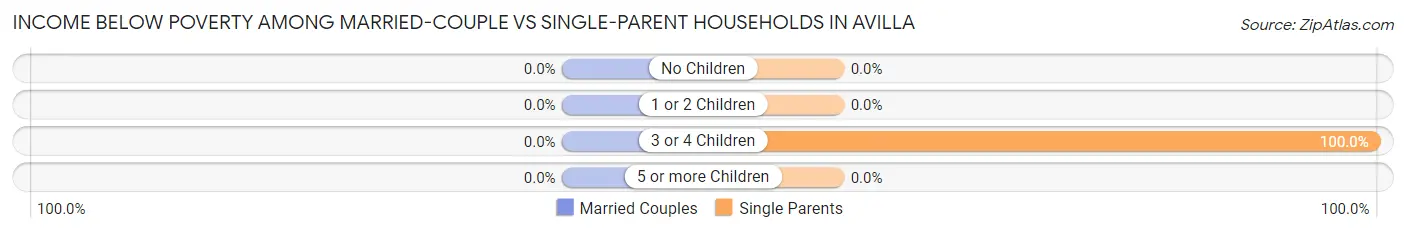
| Children | Married-Couple Families | Single-Parent Households |
| No Children | 0 (0.0%) | 0 (0.0%) |
| 1 or 2 Children | 0 (0.0%) | 0 (0.0%) |
| 3 or 4 Children | 0 (0.0%) | 24 (100.0%) |
| 5 or more Children | 0 (0.0%) | 0 (0.0%) |
| Total | 0 (0.0%) | 24 (35.3%) |
Race in Avilla
The most populous races in Avilla are White / Caucasian (1,299 | 88.9%), Some other Race (162 | 11.1%), and Hispanic or Latino (90 | 6.2%).
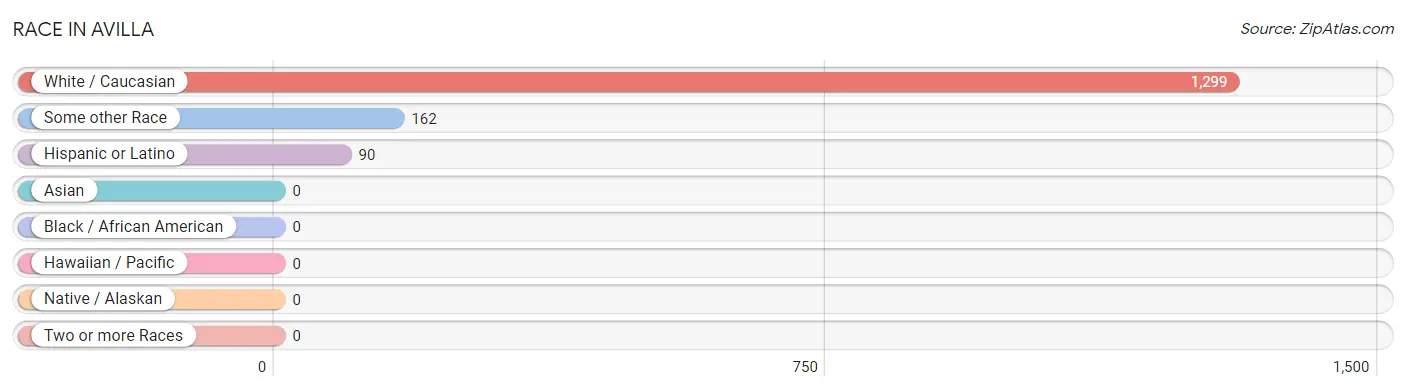
| Race | # Population | % Population |
| Asian | 0 | 0.0% |
| Black / African American | 0 | 0.0% |
| Hawaiian / Pacific | 0 | 0.0% |
| Hispanic or Latino | 90 | 6.2% |
| Native / Alaskan | 0 | 0.0% |
| White / Caucasian | 1,299 | 88.9% |
| Two or more Races | 0 | 0.0% |
| Some other Race | 162 | 11.1% |
| Total | 1,461 | 100.0% |
Ancestry in Avilla
The most populous ancestries reported in Avilla are English (361 | 24.7%), American (256 | 17.5%), German (127 | 8.7%), Italian (114 | 7.8%), and Irish (105 | 7.2%), together accounting for 65.9% of all Avilla residents.
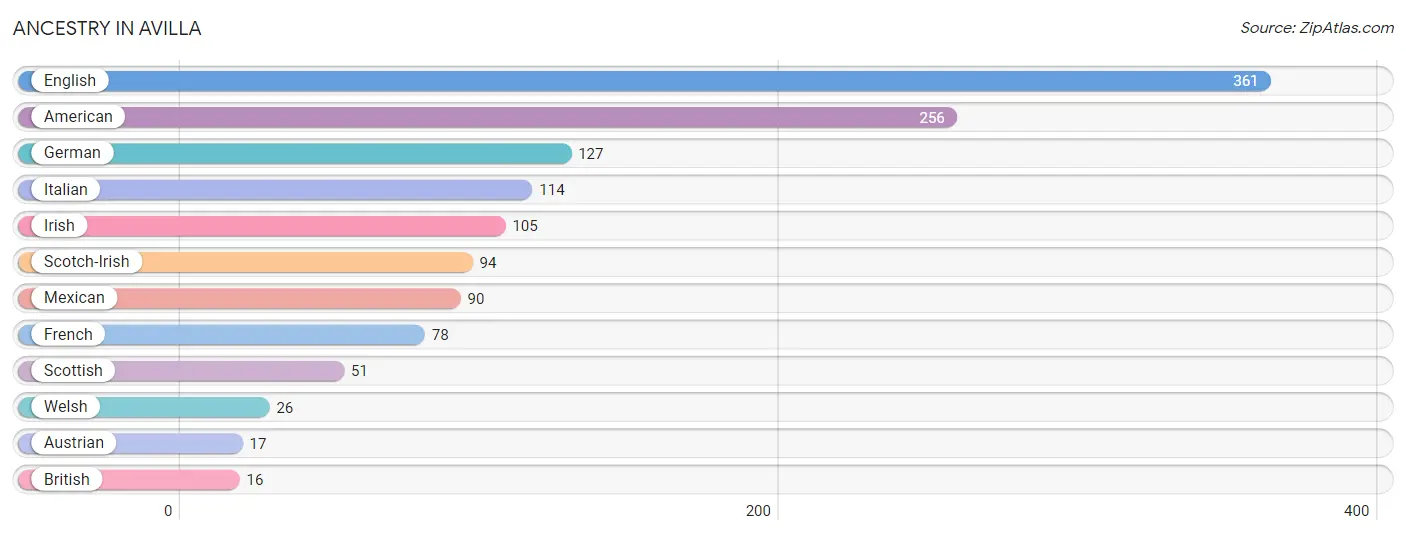
| Ancestry | # Population | % Population |
| American | 256 | 17.5% |
| Austrian | 17 | 1.2% |
| British | 16 | 1.1% |
| English | 361 | 24.7% |
| French | 78 | 5.3% |
| German | 127 | 8.7% |
| Irish | 105 | 7.2% |
| Italian | 114 | 7.8% |
| Mexican | 90 | 6.2% |
| Scotch-Irish | 94 | 6.4% |
| Scottish | 51 | 3.5% |
| Welsh | 26 | 1.8% | View All 12 Rows |
Immigrants in Avilla
The most numerous immigrant groups reported in Avilla came from Central America (90 | 6.2%), Latin America (90 | 6.2%), and Mexico (90 | 6.2%), together accounting for 18.5% of all Avilla residents.
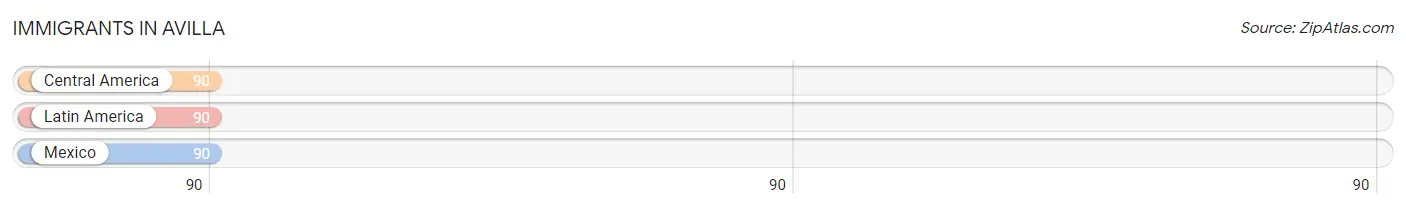
| Immigration Origin | # Population | % Population |
| Central America | 90 | 6.2% |
| Latin America | 90 | 6.2% |
| Mexico | 90 | 6.2% | View All 3 Rows |
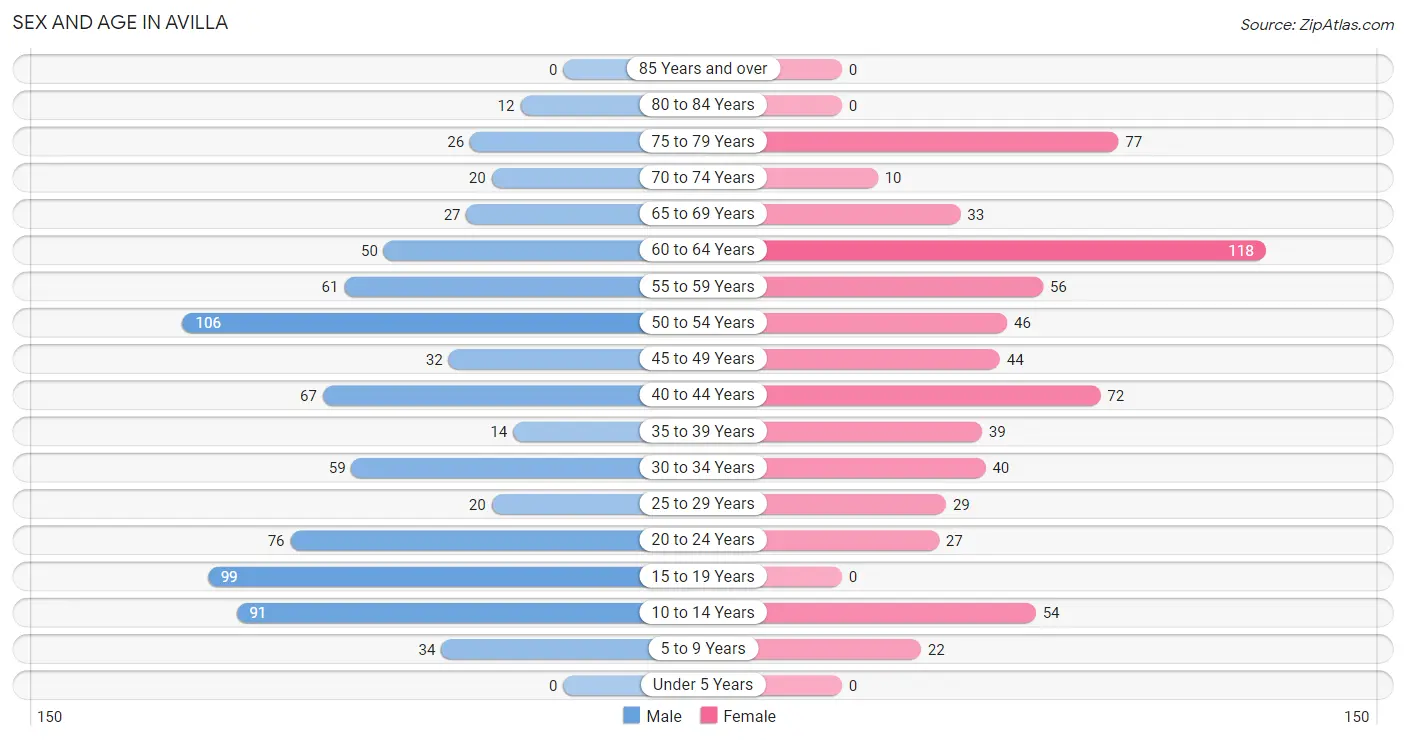
Sex and Age in Avilla
Sex and Age in Avilla
The most populous age groups in Avilla are 50 to 54 Years (106 | 13.4%) for men and 60 to 64 Years (118 | 17.7%) for women.
| Age Bracket | Male | Female |
| Under 5 Years | 0 (0.0%) | 0 (0.0%) |
| 5 to 9 Years | 34 (4.3%) | 22 (3.3%) |
| 10 to 14 Years | 91 (11.5%) | 54 (8.1%) |
| 15 to 19 Years | 99 (12.5%) | 0 (0.0%) |
| 20 to 24 Years | 76 (9.6%) | 27 (4.1%) |
| 25 to 29 Years | 20 (2.5%) | 29 (4.3%) |
| 30 to 34 Years | 59 (7.4%) | 40 (6.0%) |
| 35 to 39 Years | 14 (1.8%) | 39 (5.9%) |
| 40 to 44 Years | 67 (8.4%) | 72 (10.8%) |
| 45 to 49 Years | 32 (4.0%) | 44 (6.6%) |
| 50 to 54 Years | 106 (13.4%) | 46 (6.9%) |
| 55 to 59 Years | 61 (7.7%) | 56 (8.4%) |
| 60 to 64 Years | 50 (6.3%) | 118 (17.7%) |
| 65 to 69 Years | 27 (3.4%) | 33 (5.0%) |
| 70 to 74 Years | 20 (2.5%) | 10 (1.5%) |
| 75 to 79 Years | 26 (3.3%) | 77 (11.5%) |
| 80 to 84 Years | 12 (1.5%) | 0 (0.0%) |
| 85 Years and over | 0 (0.0%) | 0 (0.0%) |
| Total | 794 (100.0%) | 667 (100.0%) |
Families and Households in Avilla
Median Family Size in Avilla
The median family size in Avilla is 2.89 persons per family, with single female/mother families (53 | 11.1%) accounting for the largest median family size of 3.49 persons per family. On the other hand, single male/father families (15 | 3.1%) represent the smallest median family size with 2.33 persons per family.
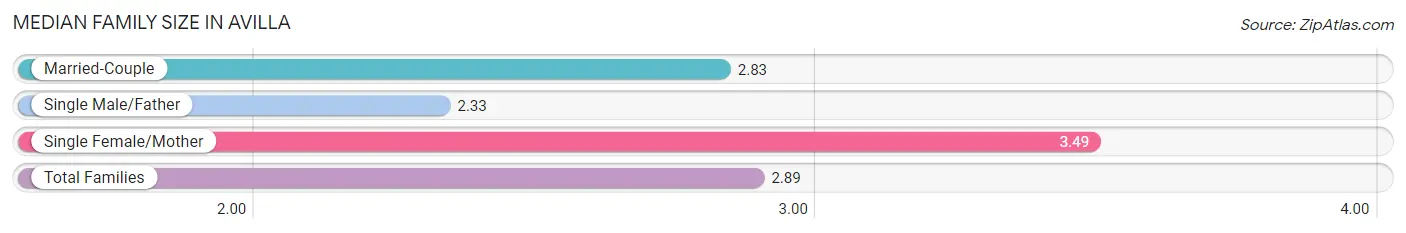
| Family Type | # Families | Family Size |
| Married-Couple | 410 (85.8%) | 2.83 |
| Single Male/Father | 15 (3.1%) | 2.33 |
| Single Female/Mother | 53 (11.1%) | 3.49 |
| Total Families | 478 (100.0%) | 2.89 |
Median Household Size in Avilla
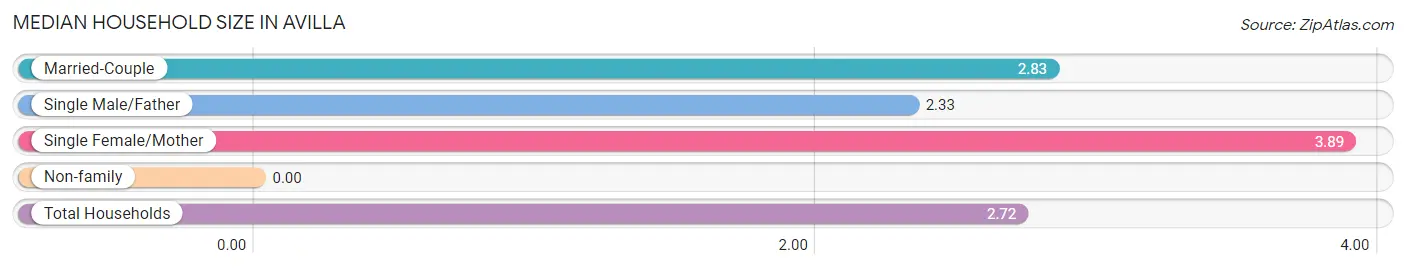
| Household Type | # Households | Household Size |
| Married-Couple | 410 (76.3%) | 2.83 |
| Single Male/Father | 15 (2.8%) | 2.33 |
| Single Female/Mother | 53 (9.9%) | 3.89 |
| Non-family | 59 (11.0%) | - |
| Total Households | 537 (100.0%) | 2.72 |
Household Size by Marriage Status in Avilla
Out of a total of 537 households in Avilla, 478 (89.0%) are family households, while 59 (11.0%) are nonfamily households. The most numerous type of family households are 2-person households, comprising 244, and the most common type of nonfamily households are 1-person households, comprising 59.
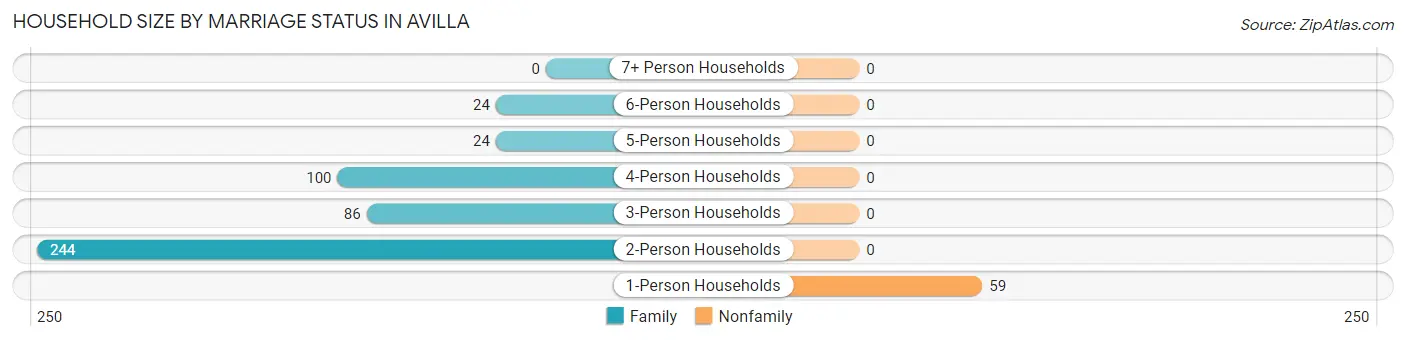
| Household Size | Family Households | Nonfamily Households |
| 1-Person Households | - | 59 (11.0%) |
| 2-Person Households | 244 (45.4%) | 0 (0.0%) |
| 3-Person Households | 86 (16.0%) | 0 (0.0%) |
| 4-Person Households | 100 (18.6%) | 0 (0.0%) |
| 5-Person Households | 24 (4.5%) | 0 (0.0%) |
| 6-Person Households | 24 (4.5%) | 0 (0.0%) |
| 7+ Person Households | 0 (0.0%) | 0 (0.0%) |
| Total | 478 (89.0%) | 59 (11.0%) |
Female Fertility in Avilla
Fertility by Age in Avilla
Average fertility rate in Avilla is 53.0 births per 1,000 women. Women in the age bracket of 35 to 50 years have the highest fertility rate with 81.0 births per 1,000 women. Women in the age bracket of 35 to 50 years acount for 100.0% of all women with births.
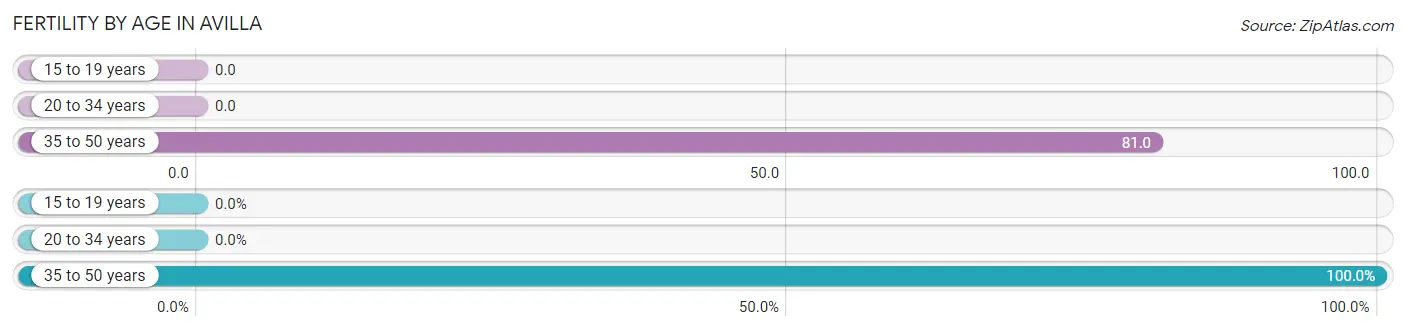
| Age Bracket | Women with Births | Births / 1,000 Women |
| 15 to 19 years | 0 (0.0%) | 0.0 |
| 20 to 34 years | 0 (0.0%) | 0.0 |
| 35 to 50 years | 15 (100.0%) | 81.0 |
| Total | 15 (100.0%) | 53.0 |
Fertility by Age by Marriage Status in Avilla
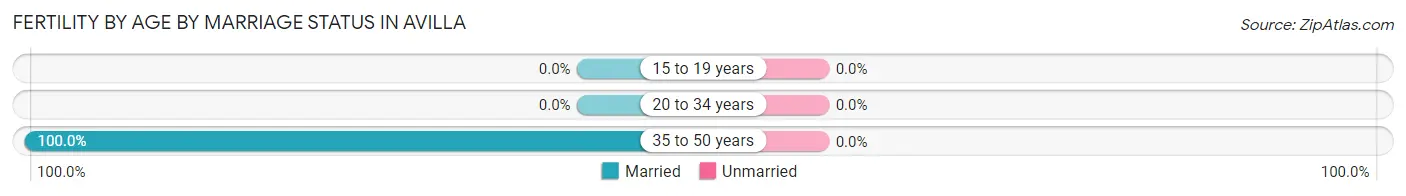
| Age Bracket | Married | Unmarried |
| 15 to 19 years | 0 (0.0%) | 0 (0.0%) |
| 20 to 34 years | 0 (0.0%) | 0 (0.0%) |
| 35 to 50 years | 15 (100.0%) | 0 (0.0%) |
| Total | 15 (100.0%) | 0 (0.0%) |
Fertility by Education in Avilla
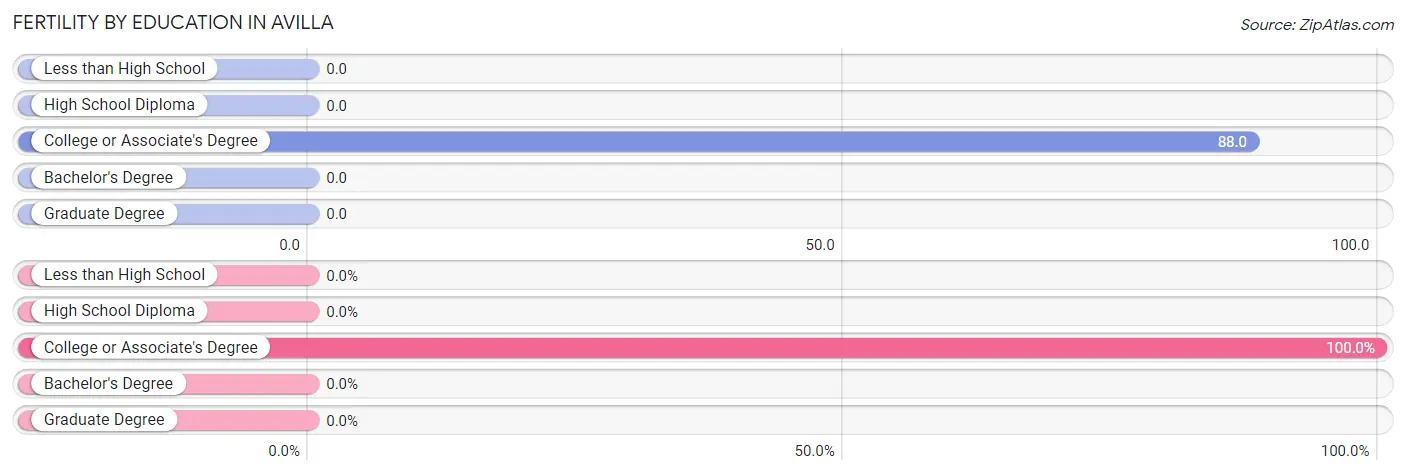
| Educational Attainment | Women with Births | Births / 1,000 Women |
| Less than High School | 0 (0.0%) | 0.0 |
| High School Diploma | 0 (0.0%) | 0.0 |
| College or Associate's Degree | 15 (100.0%) | 88.0 |
| Bachelor's Degree | 0 (0.0%) | 0.0 |
| Graduate Degree | 0 (0.0%) | 0.0 |
| Total | 15 (100.0%) | 53.0 |
Fertility by Education by Marriage Status in Avilla
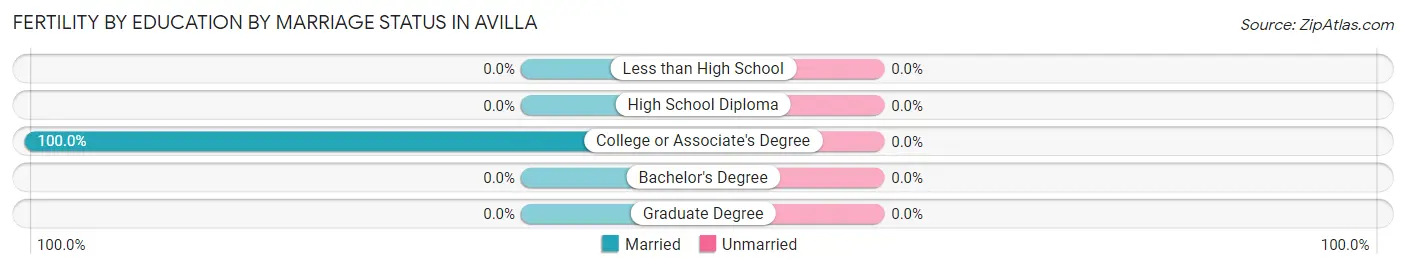
| Educational Attainment | Married | Unmarried |
| Less than High School | 0 (0.0%) | 0 (0.0%) |
| High School Diploma | 0 (0.0%) | 0 (0.0%) |
| College or Associate's Degree | 15 (100.0%) | 0 (0.0%) |
| Bachelor's Degree | 0 (0.0%) | 0 (0.0%) |
| Graduate Degree | 0 (0.0%) | 0 (0.0%) |
| Total | 15 (100.0%) | 0 (0.0%) |
Employment Characteristics in Avilla
Employment by Class of Employer in Avilla
Among the 833 employed individuals in Avilla, private company employees (523 | 62.8%), self-employed (incorporated) (115 | 13.8%), and self-employed (not incorporated) (85 | 10.2%) make up the most common classes of employment.
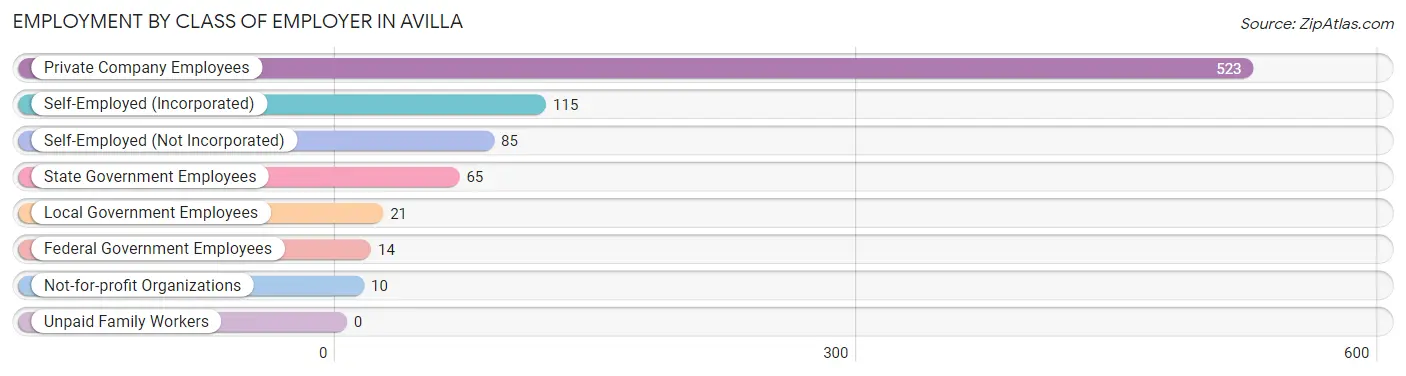
| Employer Class | # Employees | % Employees |
| Private Company Employees | 523 | 62.8% |
| Self-Employed (Incorporated) | 115 | 13.8% |
| Self-Employed (Not Incorporated) | 85 | 10.2% |
| Not-for-profit Organizations | 10 | 1.2% |
| Local Government Employees | 21 | 2.5% |
| State Government Employees | 65 | 7.8% |
| Federal Government Employees | 14 | 1.7% |
| Unpaid Family Workers | 0 | 0.0% |
| Total | 833 | 100.0% |
Employment Status by Age in Avilla
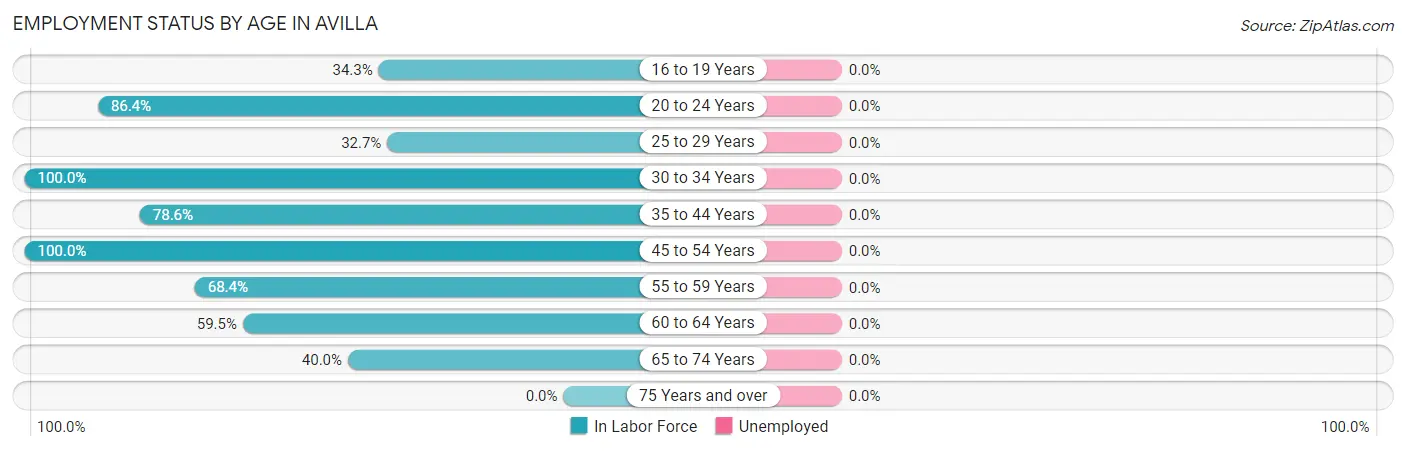
| Age Bracket | In Labor Force | Unemployed |
| 16 to 19 Years | 34 (34.3%) | 0 (0.0%) |
| 20 to 24 Years | 89 (86.4%) | 0 (0.0%) |
| 25 to 29 Years | 16 (32.7%) | 0 (0.0%) |
| 30 to 34 Years | 99 (100.0%) | 0 (0.0%) |
| 35 to 44 Years | 151 (78.6%) | 0 (0.0%) |
| 45 to 54 Years | 228 (100.0%) | 0 (0.0%) |
| 55 to 59 Years | 80 (68.4%) | 0 (0.0%) |
| 60 to 64 Years | 100 (59.5%) | 0 (0.0%) |
| 65 to 74 Years | 36 (40.0%) | 0 (0.0%) |
| 75 Years and over | 0 (0.0%) | 0 (0.0%) |
| Total | 833 (66.1%) | 0 (0.0%) |
Employment Status by Educational Attainment in Avilla
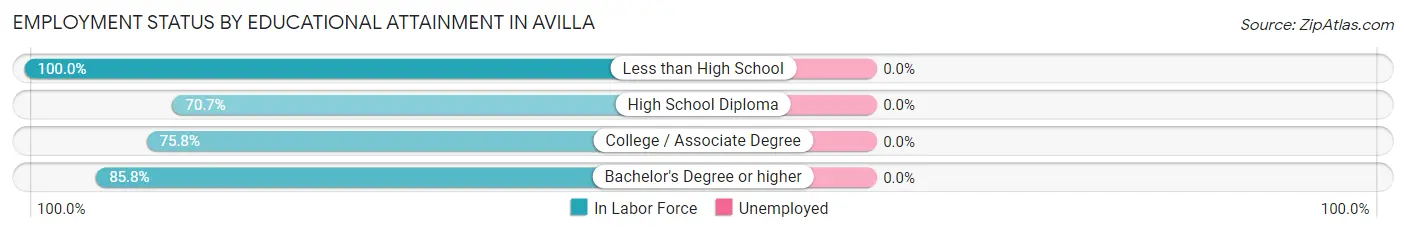
| Educational Attainment | In Labor Force | Unemployed |
| Less than High School | 61 (100.0%) | 0 (0.0%) |
| High School Diploma | 171 (70.7%) | 0 (0.0%) |
| College / Associate Degree | 225 (75.8%) | 0 (0.0%) |
| Bachelor's Degree or higher | 217 (85.8%) | 0 (0.0%) |
| Total | 674 (79.0%) | 0 (0.0%) |
Employment Occupations by Sex in Avilla
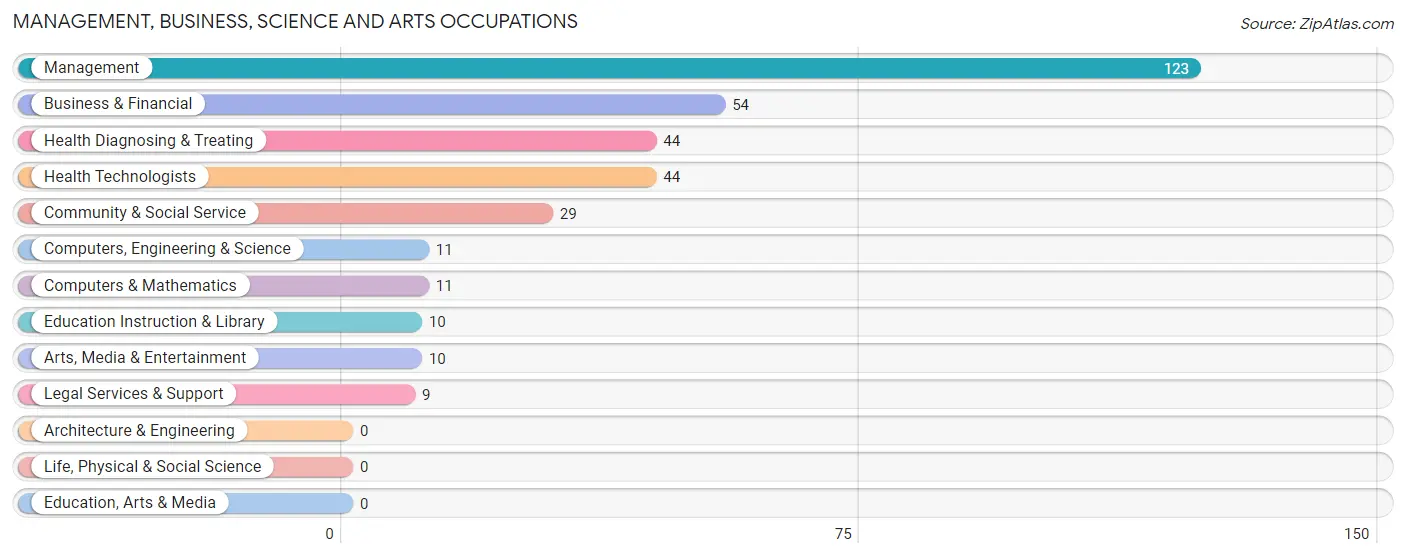
Management, Business, Science and Arts Occupations
The most common Management, Business, Science and Arts occupations in Avilla are Management (123 | 14.8%), Business & Financial (54 | 6.5%), Health Diagnosing & Treating (44 | 5.3%), Health Technologists (44 | 5.3%), and Community & Social Service (29 | 3.5%).
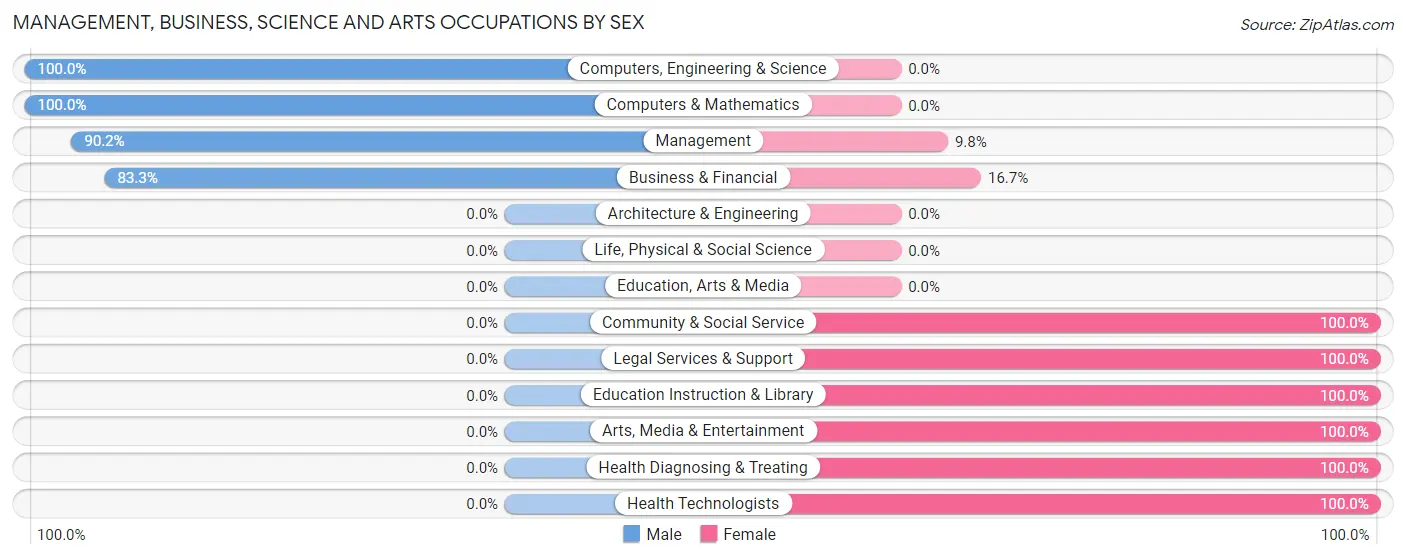
Management, Business, Science and Arts Occupations by Sex
Within the Management, Business, Science and Arts occupations in Avilla, the most male-oriented occupations are Computers, Engineering & Science (100.0%), Computers & Mathematics (100.0%), and Management (90.2%), while the most female-oriented occupations are Community & Social Service (100.0%), Legal Services & Support (100.0%), and Education Instruction & Library (100.0%).
| Occupation | Male | Female |
| Management | 111 (90.2%) | 12 (9.8%) |
| Business & Financial | 45 (83.3%) | 9 (16.7%) |
| Computers, Engineering & Science | 11 (100.0%) | 0 (0.0%) |
| Computers & Mathematics | 11 (100.0%) | 0 (0.0%) |
| Architecture & Engineering | 0 (0.0%) | 0 (0.0%) |
| Life, Physical & Social Science | 0 (0.0%) | 0 (0.0%) |
| Community & Social Service | 0 (0.0%) | 29 (100.0%) |
| Education, Arts & Media | 0 (0.0%) | 0 (0.0%) |
| Legal Services & Support | 0 (0.0%) | 9 (100.0%) |
| Education Instruction & Library | 0 (0.0%) | 10 (100.0%) |
| Arts, Media & Entertainment | 0 (0.0%) | 10 (100.0%) |
| Health Diagnosing & Treating | 0 (0.0%) | 44 (100.0%) |
| Health Technologists | 0 (0.0%) | 44 (100.0%) |
| Total (Category) | 167 (64.0%) | 94 (36.0%) |
| Total (Overall) | 461 (55.3%) | 372 (44.7%) |
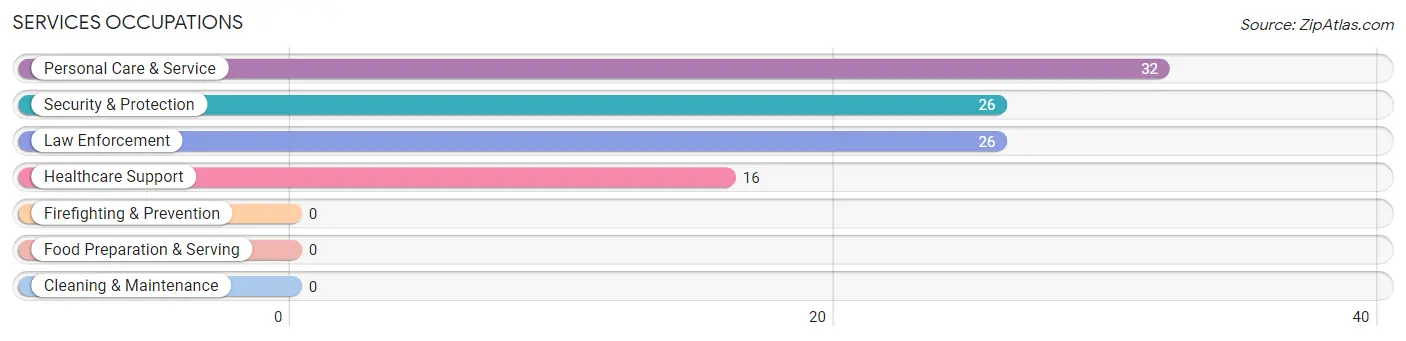
Services Occupations
The most common Services occupations in Avilla are Personal Care & Service (32 | 3.8%), Security & Protection (26 | 3.1%), Law Enforcement (26 | 3.1%), and Healthcare Support (16 | 1.9%).
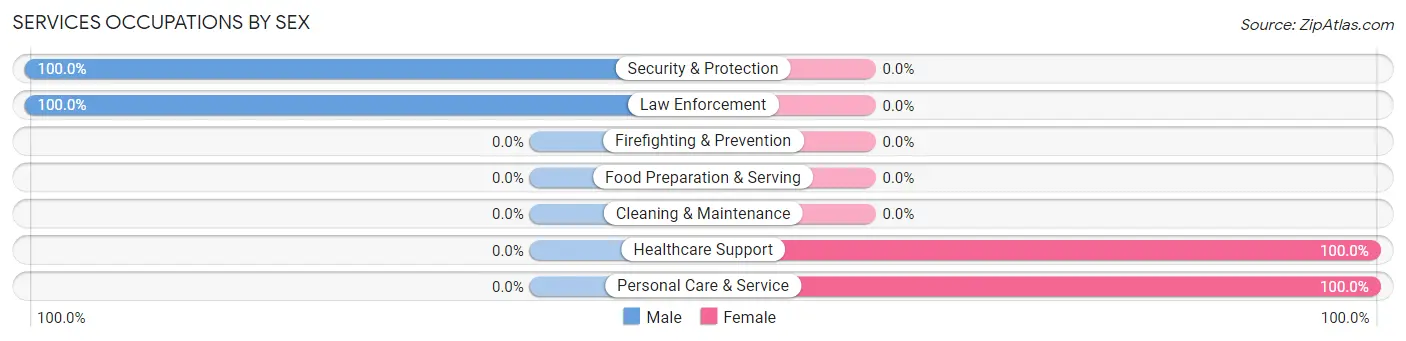
Services Occupations by Sex
Within the Services occupations in Avilla, the most male-oriented occupations are Security & Protection (100.0%), and Law Enforcement (100.0%), while the most female-oriented occupations are Healthcare Support (100.0%), and Personal Care & Service (100.0%).
| Occupation | Male | Female |
| Healthcare Support | 0 (0.0%) | 16 (100.0%) |
| Security & Protection | 26 (100.0%) | 0 (0.0%) |
| Firefighting & Prevention | 0 (0.0%) | 0 (0.0%) |
| Law Enforcement | 26 (100.0%) | 0 (0.0%) |
| Food Preparation & Serving | 0 (0.0%) | 0 (0.0%) |
| Cleaning & Maintenance | 0 (0.0%) | 0 (0.0%) |
| Personal Care & Service | 0 (0.0%) | 32 (100.0%) |
| Total (Category) | 26 (35.1%) | 48 (64.9%) |
| Total (Overall) | 461 (55.3%) | 372 (44.7%) |
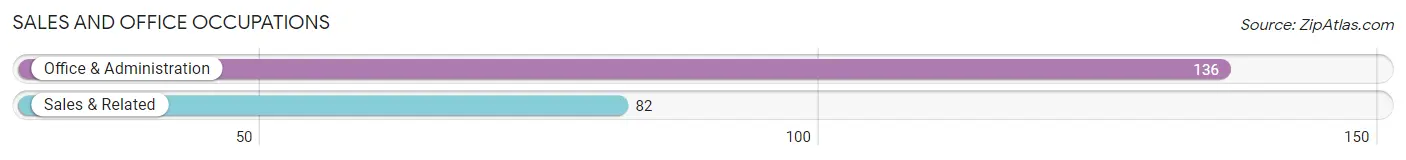
Sales and Office Occupations
The most common Sales and Office occupations in Avilla are Office & Administration (136 | 16.3%), and Sales & Related (82 | 9.8%).
Sales and Office Occupations by Sex
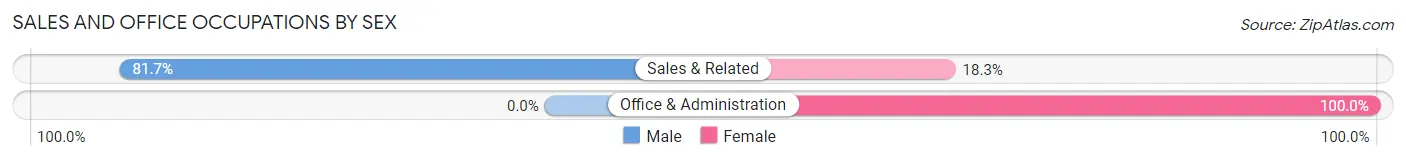
| Occupation | Male | Female |
| Sales & Related | 67 (81.7%) | 15 (18.3%) |
| Office & Administration | 0 (0.0%) | 136 (100.0%) |
| Total (Category) | 67 (30.7%) | 151 (69.3%) |
| Total (Overall) | 461 (55.3%) | 372 (44.7%) |
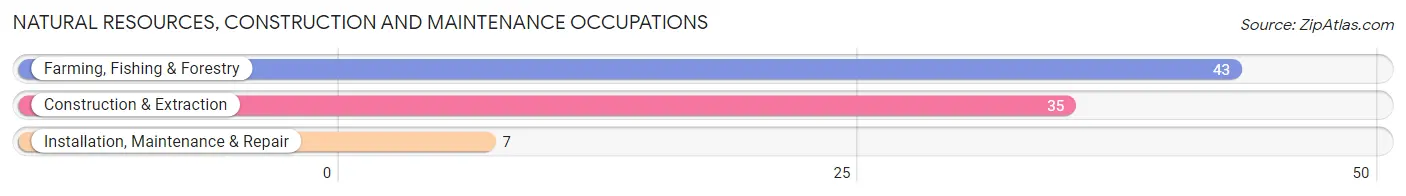
Natural Resources, Construction and Maintenance Occupations
The most common Natural Resources, Construction and Maintenance occupations in Avilla are Farming, Fishing & Forestry (43 | 5.2%), Construction & Extraction (35 | 4.2%), and Installation, Maintenance & Repair (7 | 0.8%).
Natural Resources, Construction and Maintenance Occupations by Sex
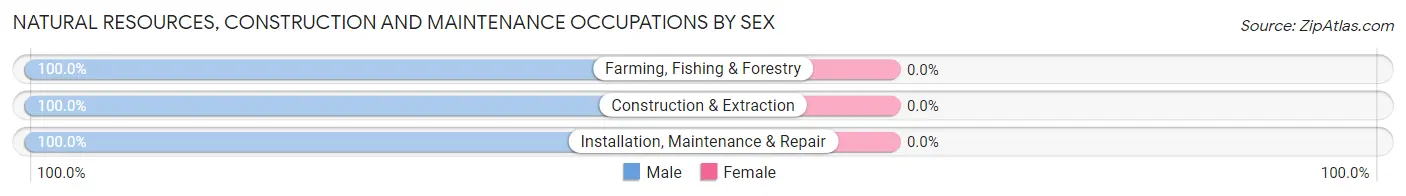
| Occupation | Male | Female |
| Farming, Fishing & Forestry | 43 (100.0%) | 0 (0.0%) |
| Construction & Extraction | 35 (100.0%) | 0 (0.0%) |
| Installation, Maintenance & Repair | 7 (100.0%) | 0 (0.0%) |
| Total (Category) | 85 (100.0%) | 0 (0.0%) |
| Total (Overall) | 461 (55.3%) | 372 (44.7%) |
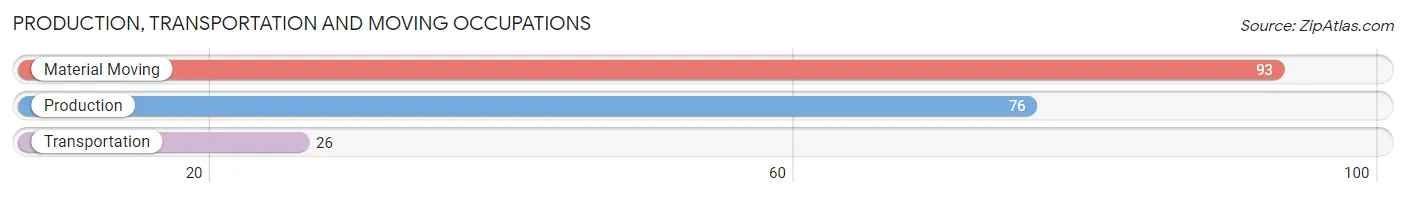
Production, Transportation and Moving Occupations
The most common Production, Transportation and Moving occupations in Avilla are Material Moving (93 | 11.2%), Production (76 | 9.1%), and Transportation (26 | 3.1%).
Production, Transportation and Moving Occupations by Sex
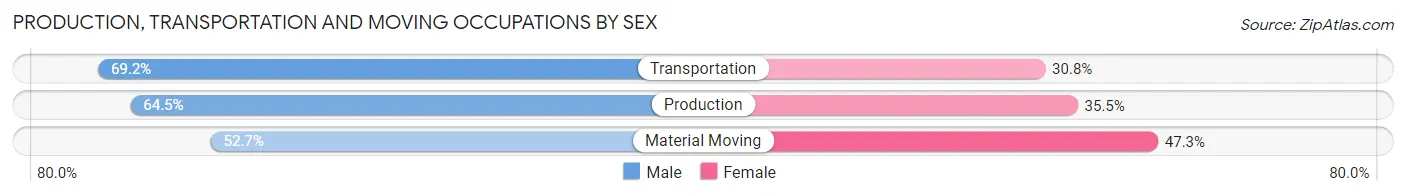
| Occupation | Male | Female |
| Production | 49 (64.5%) | 27 (35.5%) |
| Transportation | 18 (69.2%) | 8 (30.8%) |
| Material Moving | 49 (52.7%) | 44 (47.3%) |
| Total (Category) | 116 (59.5%) | 79 (40.5%) |
| Total (Overall) | 461 (55.3%) | 372 (44.7%) |
Employment Industries by Sex in Avilla
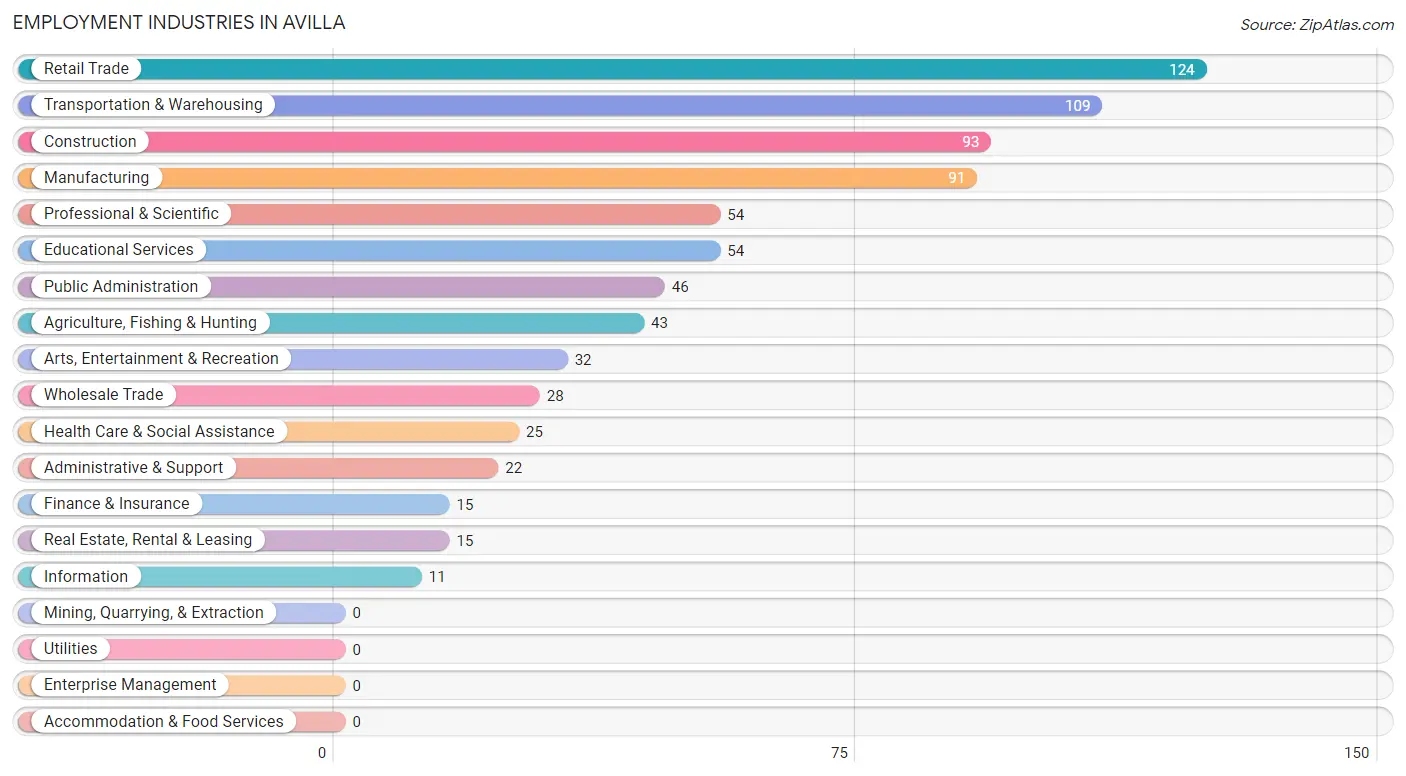
Employment Industries in Avilla
The major employment industries in Avilla include Retail Trade (124 | 14.9%), Transportation & Warehousing (109 | 13.1%), Construction (93 | 11.2%), Manufacturing (91 | 10.9%), and Professional & Scientific (54 | 6.5%).
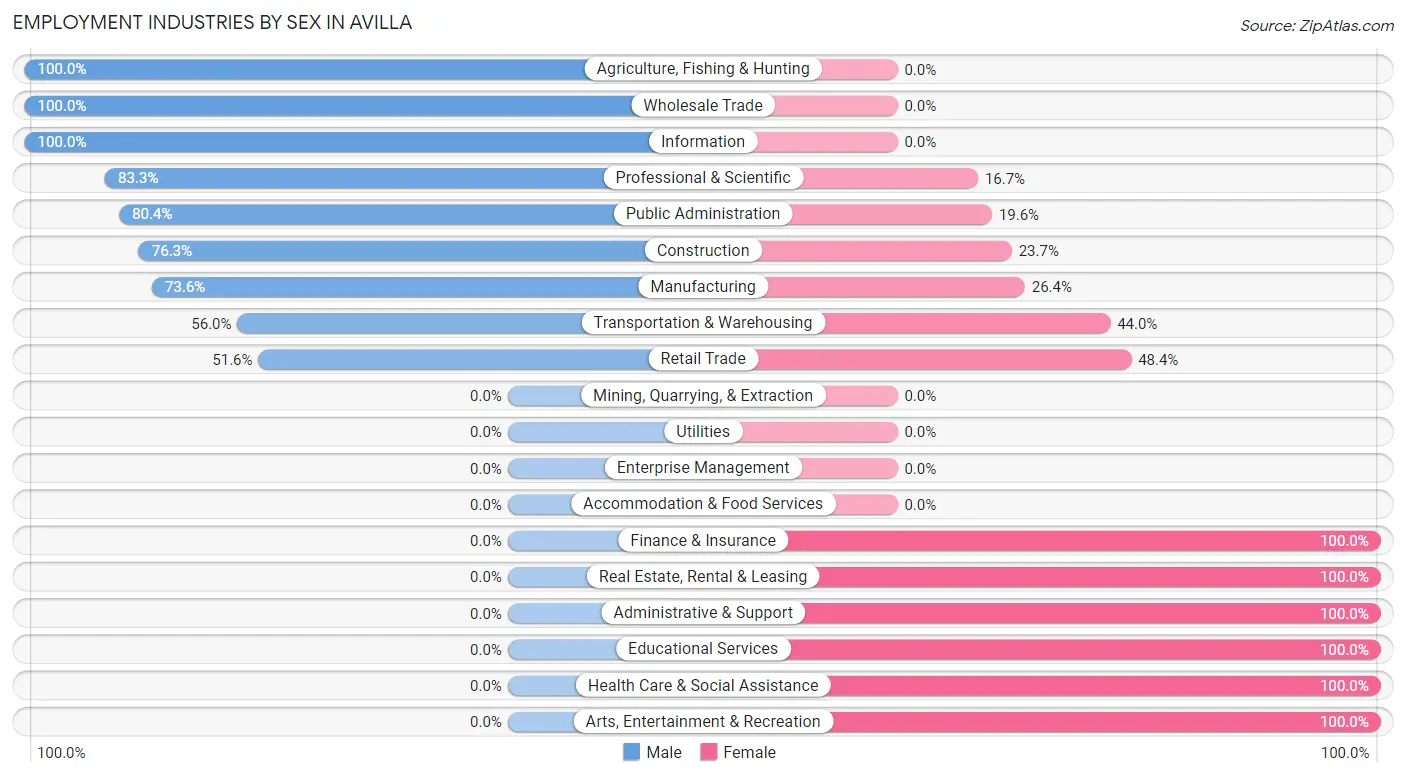
Employment Industries by Sex in Avilla
The Avilla industries that see more men than women are Agriculture, Fishing & Hunting (100.0%), Wholesale Trade (100.0%), and Information (100.0%), whereas the industries that tend to have a higher number of women are Finance & Insurance (100.0%), Real Estate, Rental & Leasing (100.0%), and Administrative & Support (100.0%).
| Industry | Male | Female |
| Agriculture, Fishing & Hunting | 43 (100.0%) | 0 (0.0%) |
| Mining, Quarrying, & Extraction | 0 (0.0%) | 0 (0.0%) |
| Construction | 71 (76.3%) | 22 (23.7%) |
| Manufacturing | 67 (73.6%) | 24 (26.4%) |
| Wholesale Trade | 28 (100.0%) | 0 (0.0%) |
| Retail Trade | 64 (51.6%) | 60 (48.4%) |
| Transportation & Warehousing | 61 (56.0%) | 48 (44.0%) |
| Utilities | 0 (0.0%) | 0 (0.0%) |
| Information | 11 (100.0%) | 0 (0.0%) |
| Finance & Insurance | 0 (0.0%) | 15 (100.0%) |
| Real Estate, Rental & Leasing | 0 (0.0%) | 15 (100.0%) |
| Professional & Scientific | 45 (83.3%) | 9 (16.7%) |
| Enterprise Management | 0 (0.0%) | 0 (0.0%) |
| Administrative & Support | 0 (0.0%) | 22 (100.0%) |
| Educational Services | 0 (0.0%) | 54 (100.0%) |
| Health Care & Social Assistance | 0 (0.0%) | 25 (100.0%) |
| Arts, Entertainment & Recreation | 0 (0.0%) | 32 (100.0%) |
| Accommodation & Food Services | 0 (0.0%) | 0 (0.0%) |
| Public Administration | 37 (80.4%) | 9 (19.6%) |
| Total | 461 (55.3%) | 372 (44.7%) |
Education in Avilla
School Enrollment in Avilla
The most common levels of schooling among the 349 students in Avilla are middle school (130 | 37.2%), high school (114 | 32.7%), and elementary school (56 | 16.1%).
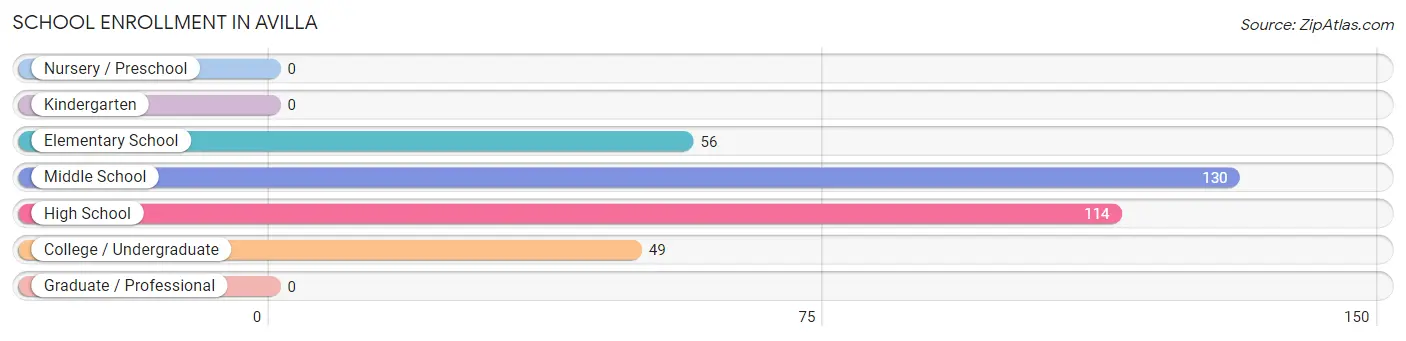
| School Level | # Students | % Students |
| Nursery / Preschool | 0 | 0.0% |
| Kindergarten | 0 | 0.0% |
| Elementary School | 56 | 16.1% |
| Middle School | 130 | 37.2% |
| High School | 114 | 32.7% |
| College / Undergraduate | 49 | 14.0% |
| Graduate / Professional | 0 | 0.0% |
| Total | 349 | 100.0% |
School Enrollment by Age by Funding Source in Avilla
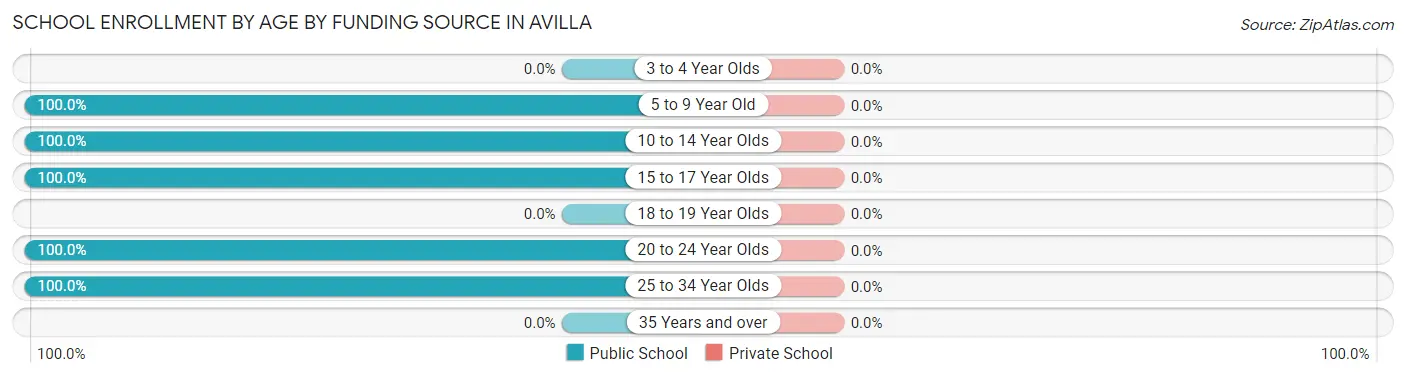
| Age Bracket | Public School | Private School |
| 3 to 4 Year Olds | 0 (0.0%) | 0 (0.0%) |
| 5 to 9 Year Old | 56 (100.0%) | 0 (0.0%) |
| 10 to 14 Year Olds | 145 (100.0%) | 0 (0.0%) |
| 15 to 17 Year Olds | 99 (100.0%) | 0 (0.0%) |
| 18 to 19 Year Olds | 0 (0.0%) | 0 (0.0%) |
| 20 to 24 Year Olds | 41 (100.0%) | 0 (0.0%) |
| 25 to 34 Year Olds | 8 (100.0%) | 0 (0.0%) |
| 35 Years and over | 0 (0.0%) | 0 (0.0%) |
| Total | 349 (100.0%) | 0 (0.0%) |
Educational Attainment by Field of Study in Avilla
Business (118 | 32.3%), communications (100 | 27.4%), bio, nature & agricultural (48 | 13.2%), science & technology (31 | 8.5%), and arts & humanities (20 | 5.5%) are the most common fields of study among 365 individuals in Avilla who have obtained a bachelor's degree or higher.
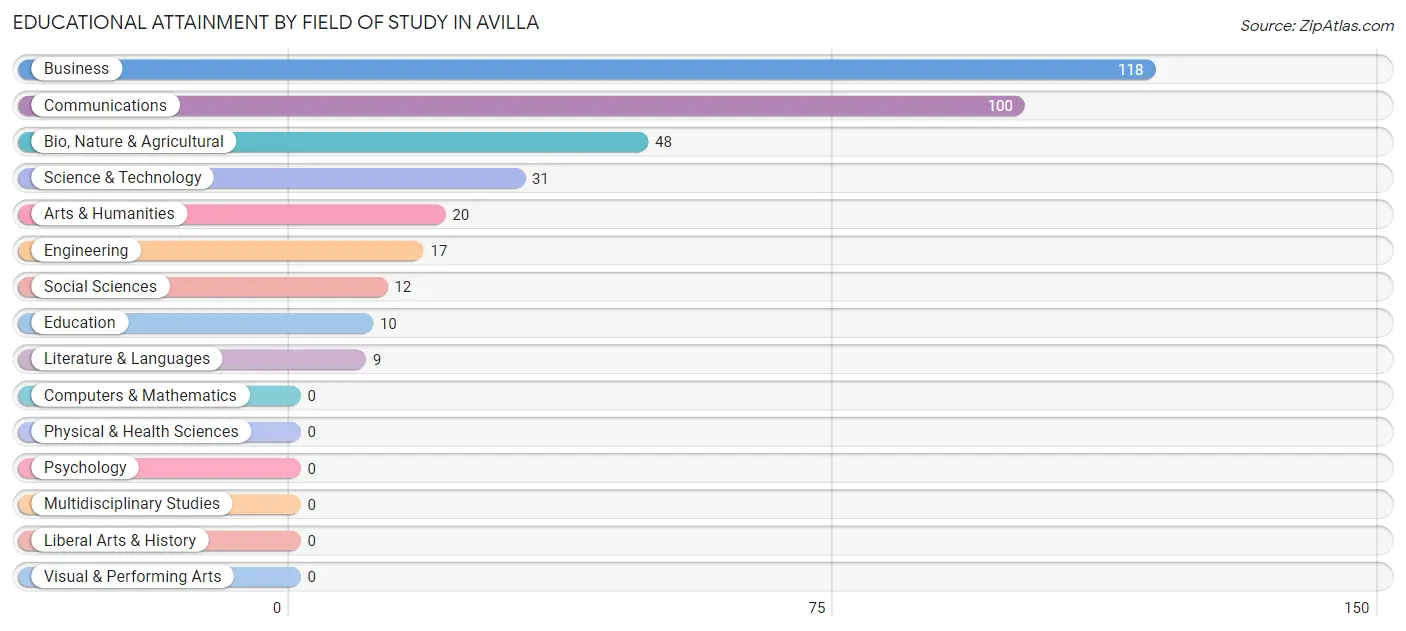
| Field of Study | # Graduates | % Graduates |
| Computers & Mathematics | 0 | 0.0% |
| Bio, Nature & Agricultural | 48 | 13.2% |
| Physical & Health Sciences | 0 | 0.0% |
| Psychology | 0 | 0.0% |
| Social Sciences | 12 | 3.3% |
| Engineering | 17 | 4.7% |
| Multidisciplinary Studies | 0 | 0.0% |
| Science & Technology | 31 | 8.5% |
| Business | 118 | 32.3% |
| Education | 10 | 2.7% |
| Literature & Languages | 9 | 2.5% |
| Liberal Arts & History | 0 | 0.0% |
| Visual & Performing Arts | 0 | 0.0% |
| Communications | 100 | 27.4% |
| Arts & Humanities | 20 | 5.5% |
| Total | 365 | 100.0% |
Transportation & Commute in Avilla
Vehicle Availability by Sex in Avilla
The most prevalent vehicle ownership categories in Avilla are males with 3 vehicles (167, accounting for 36.2%) and females with 3 vehicles (210, making up 44.9%).
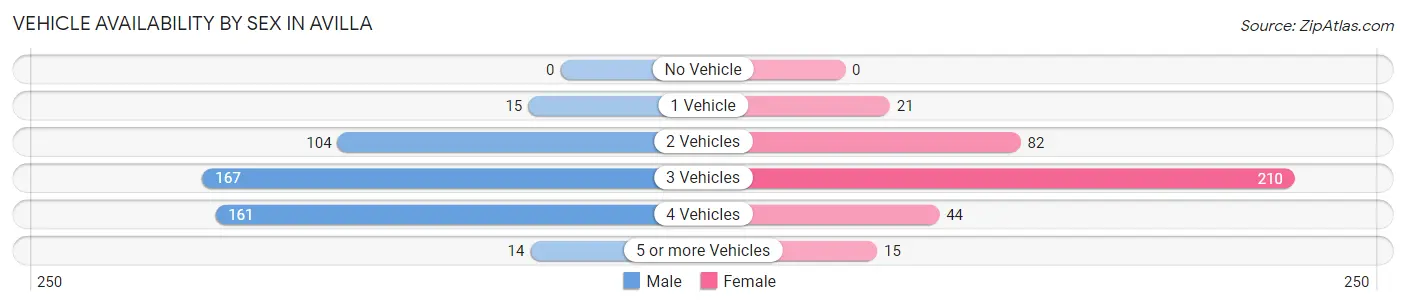
| Vehicles Available | Male | Female |
| No Vehicle | 0 (0.0%) | 0 (0.0%) |
| 1 Vehicle | 15 (3.3%) | 21 (5.7%) |
| 2 Vehicles | 104 (22.6%) | 82 (22.0%) |
| 3 Vehicles | 167 (36.2%) | 210 (56.5%) |
| 4 Vehicles | 161 (34.9%) | 44 (11.8%) |
| 5 or more Vehicles | 14 (3.0%) | 15 (4.0%) |
| Total | 461 (100.0%) | 372 (100.0%) |
Commute Time in Avilla
The most frequently occuring commute durations in Avilla are 20 to 24 minutes (244 commuters, 32.8%), 30 to 34 minutes (130 commuters, 17.5%), and 25 to 29 minutes (100 commuters, 13.4%).
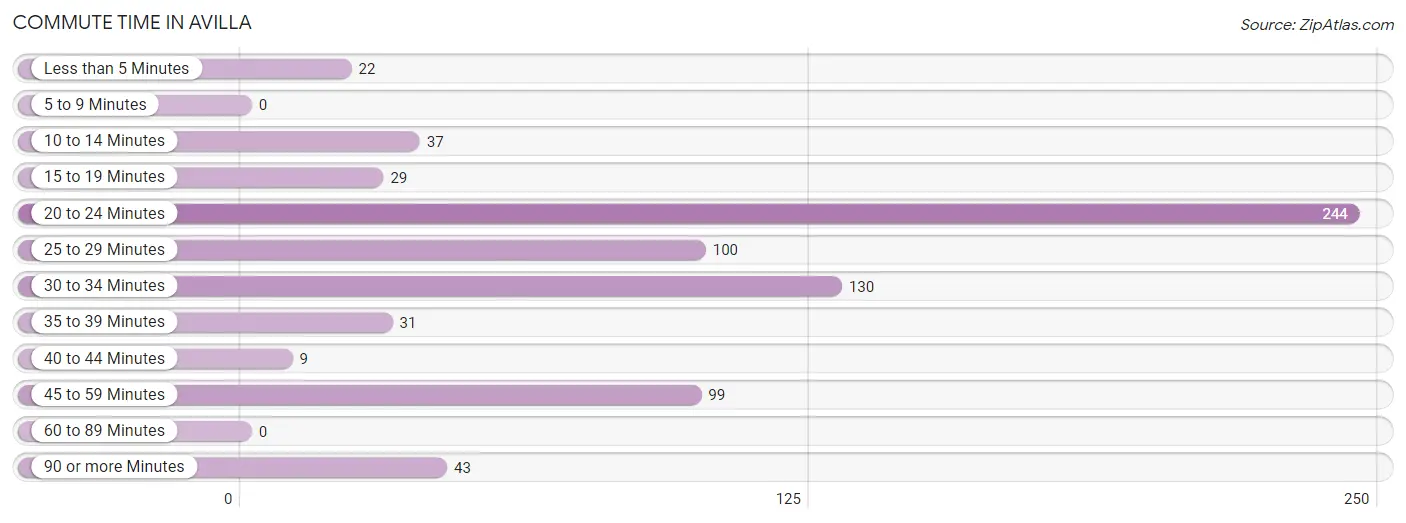
| Commute Time | # Commuters | % Commuters |
| Less than 5 Minutes | 22 | 3.0% |
| 5 to 9 Minutes | 0 | 0.0% |
| 10 to 14 Minutes | 37 | 5.0% |
| 15 to 19 Minutes | 29 | 3.9% |
| 20 to 24 Minutes | 244 | 32.8% |
| 25 to 29 Minutes | 100 | 13.4% |
| 30 to 34 Minutes | 130 | 17.5% |
| 35 to 39 Minutes | 31 | 4.2% |
| 40 to 44 Minutes | 9 | 1.2% |
| 45 to 59 Minutes | 99 | 13.3% |
| 60 to 89 Minutes | 0 | 0.0% |
| 90 or more Minutes | 43 | 5.8% |
Commute Time by Sex in Avilla
The most common commute times in Avilla are 30 to 34 minutes (102 commuters, 22.7%) for males and 20 to 24 minutes (147 commuters, 50.0%) for females.
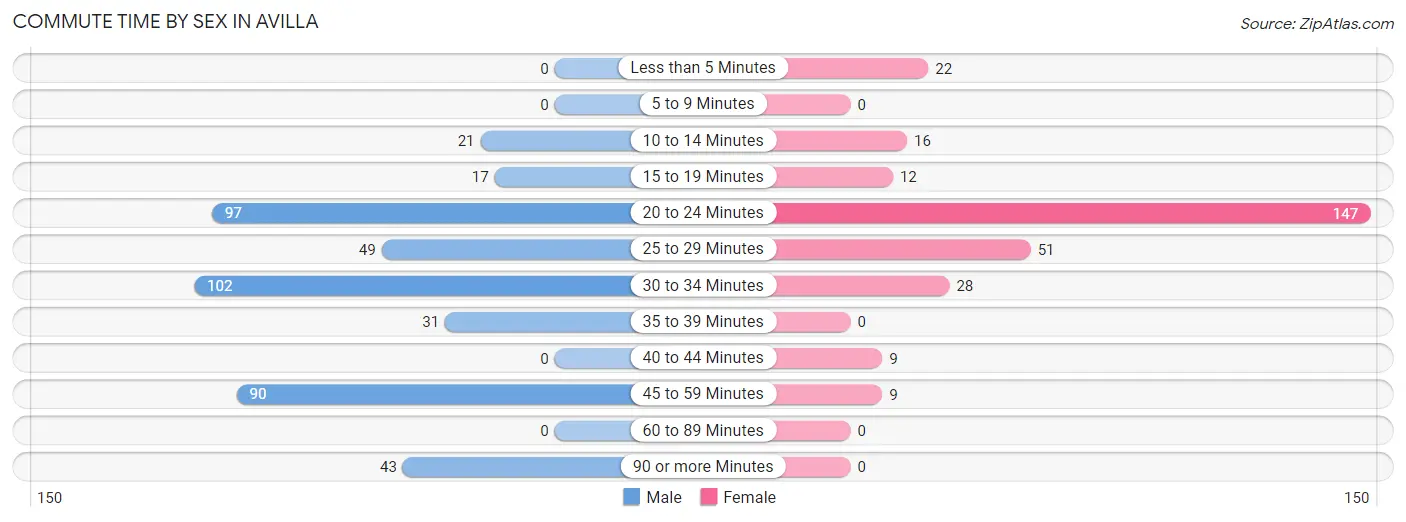
| Commute Time | Male | Female |
| Less than 5 Minutes | 0 (0.0%) | 22 (7.5%) |
| 5 to 9 Minutes | 0 (0.0%) | 0 (0.0%) |
| 10 to 14 Minutes | 21 (4.7%) | 16 (5.4%) |
| 15 to 19 Minutes | 17 (3.8%) | 12 (4.1%) |
| 20 to 24 Minutes | 97 (21.6%) | 147 (50.0%) |
| 25 to 29 Minutes | 49 (10.9%) | 51 (17.3%) |
| 30 to 34 Minutes | 102 (22.7%) | 28 (9.5%) |
| 35 to 39 Minutes | 31 (6.9%) | 0 (0.0%) |
| 40 to 44 Minutes | 0 (0.0%) | 9 (3.1%) |
| 45 to 59 Minutes | 90 (20.0%) | 9 (3.1%) |
| 60 to 89 Minutes | 0 (0.0%) | 0 (0.0%) |
| 90 or more Minutes | 43 (9.6%) | 0 (0.0%) |
Time of Departure to Work by Sex in Avilla
The most frequent times of departure to work in Avilla are 7:00 AM to 7:29 AM (129, 28.7%) for males and 6:30 AM to 6:59 AM (84, 28.6%) for females.
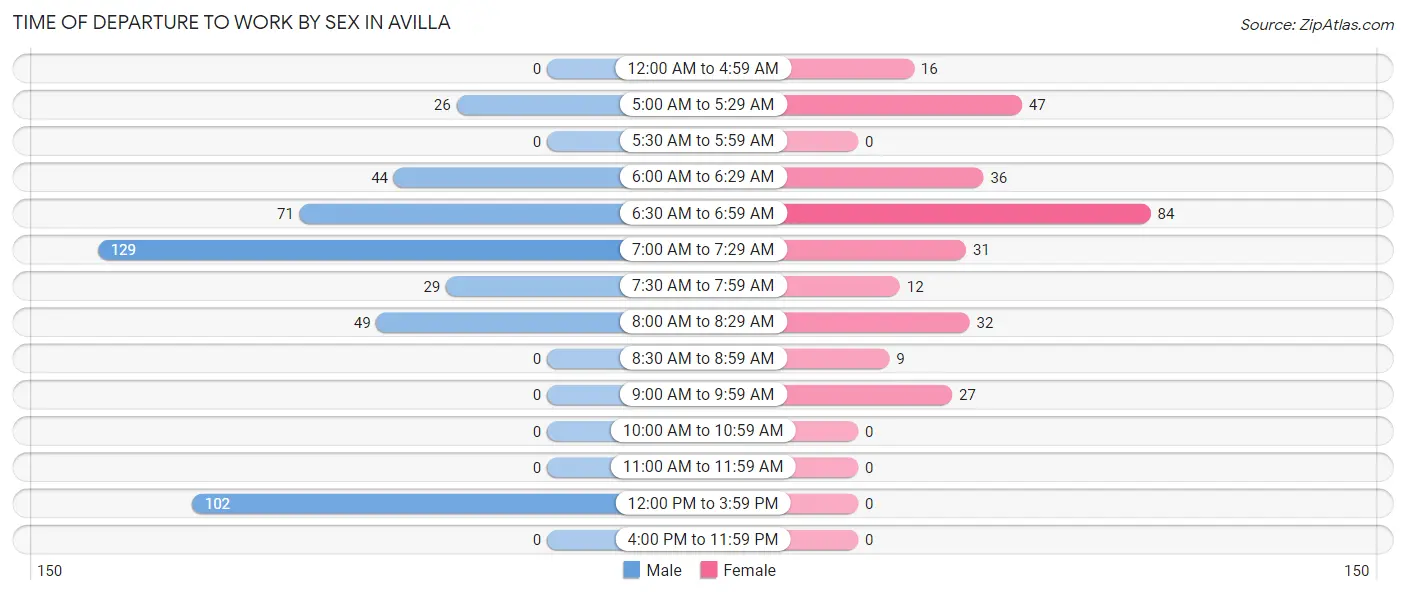
| Time of Departure | Male | Female |
| 12:00 AM to 4:59 AM | 0 (0.0%) | 16 (5.4%) |
| 5:00 AM to 5:29 AM | 26 (5.8%) | 47 (16.0%) |
| 5:30 AM to 5:59 AM | 0 (0.0%) | 0 (0.0%) |
| 6:00 AM to 6:29 AM | 44 (9.8%) | 36 (12.2%) |
| 6:30 AM to 6:59 AM | 71 (15.8%) | 84 (28.6%) |
| 7:00 AM to 7:29 AM | 129 (28.7%) | 31 (10.5%) |
| 7:30 AM to 7:59 AM | 29 (6.4%) | 12 (4.1%) |
| 8:00 AM to 8:29 AM | 49 (10.9%) | 32 (10.9%) |
| 8:30 AM to 8:59 AM | 0 (0.0%) | 9 (3.1%) |
| 9:00 AM to 9:59 AM | 0 (0.0%) | 27 (9.2%) |
| 10:00 AM to 10:59 AM | 0 (0.0%) | 0 (0.0%) |
| 11:00 AM to 11:59 AM | 0 (0.0%) | 0 (0.0%) |
| 12:00 PM to 3:59 PM | 102 (22.7%) | 0 (0.0%) |
| 4:00 PM to 11:59 PM | 0 (0.0%) | 0 (0.0%) |
| Total | 450 (100.0%) | 294 (100.0%) |
Housing Occupancy in Avilla
Occupancy by Ownership in Avilla
Of the total 537 dwellings in Avilla, owner-occupied units account for 502 (93.5%), while renter-occupied units make up 35 (6.5%).
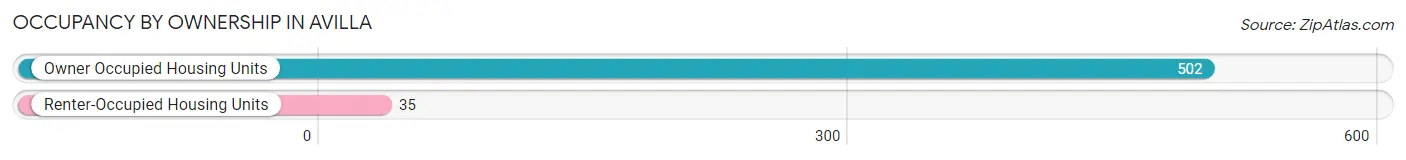
| Occupancy | # Housing Units | % Housing Units |
| Owner Occupied Housing Units | 502 | 93.5% |
| Renter-Occupied Housing Units | 35 | 6.5% |
| Total Occupied Housing Units | 537 | 100.0% |
Occupancy by Household Size in Avilla
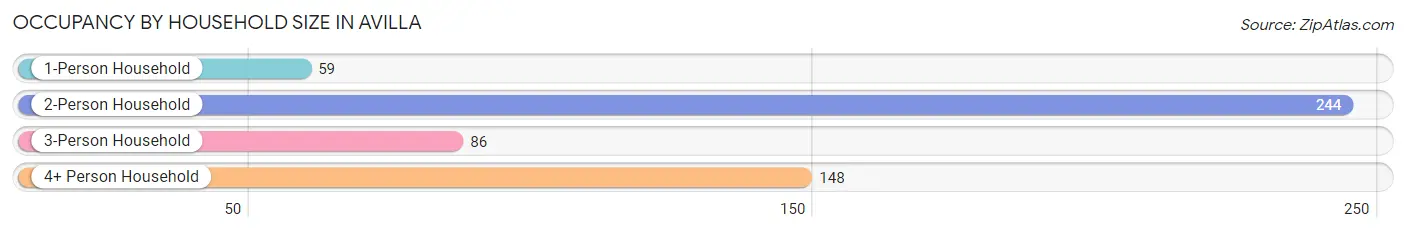
| Household Size | # Housing Units | % Housing Units |
| 1-Person Household | 59 | 11.0% |
| 2-Person Household | 244 | 45.4% |
| 3-Person Household | 86 | 16.0% |
| 4+ Person Household | 148 | 27.6% |
| Total Housing Units | 537 | 100.0% |
Occupancy by Ownership by Household Size in Avilla
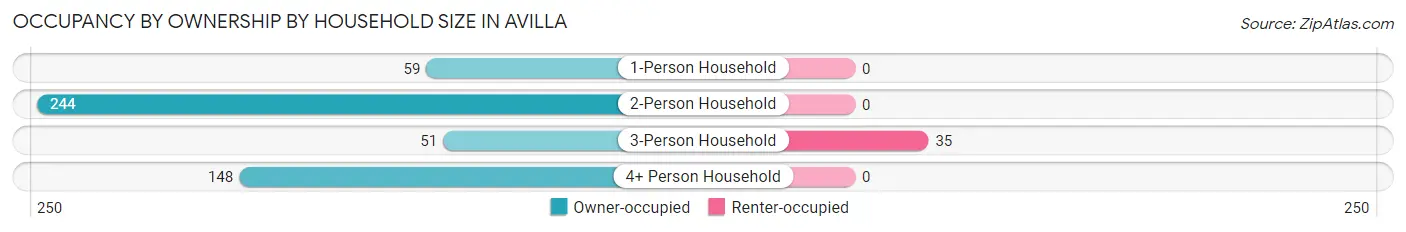
| Household Size | Owner-occupied | Renter-occupied |
| 1-Person Household | 59 (100.0%) | 0 (0.0%) |
| 2-Person Household | 244 (100.0%) | 0 (0.0%) |
| 3-Person Household | 51 (59.3%) | 35 (40.7%) |
| 4+ Person Household | 148 (100.0%) | 0 (0.0%) |
| Total Housing Units | 502 (93.5%) | 35 (6.5%) |
Occupancy by Educational Attainment in Avilla
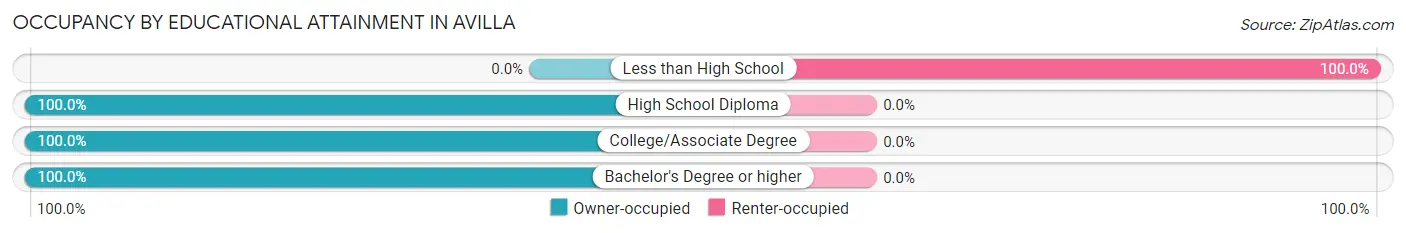
| Household Size | Owner-occupied | Renter-occupied |
| Less than High School | 0 (0.0%) | 35 (100.0%) |
| High School Diploma | 67 (100.0%) | 0 (0.0%) |
| College/Associate Degree | 274 (100.0%) | 0 (0.0%) |
| Bachelor's Degree or higher | 161 (100.0%) | 0 (0.0%) |
Occupancy by Age of Householder in Avilla
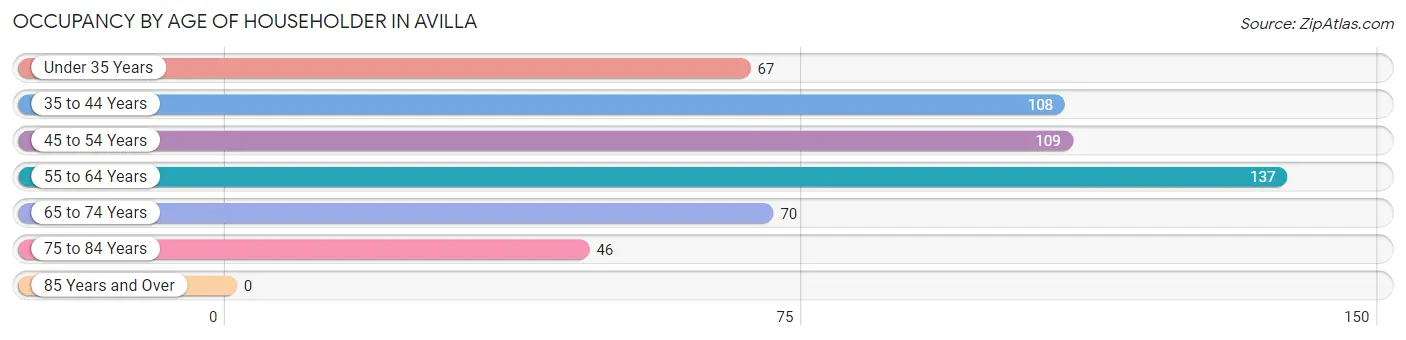
| Age Bracket | # Households | % Households |
| Under 35 Years | 67 | 12.5% |
| 35 to 44 Years | 108 | 20.1% |
| 45 to 54 Years | 109 | 20.3% |
| 55 to 64 Years | 137 | 25.5% |
| 65 to 74 Years | 70 | 13.0% |
| 75 to 84 Years | 46 | 8.6% |
| 85 Years and Over | 0 | 0.0% |
| Total | 537 | 100.0% |
Housing Finances in Avilla
Median Income by Occupancy in Avilla
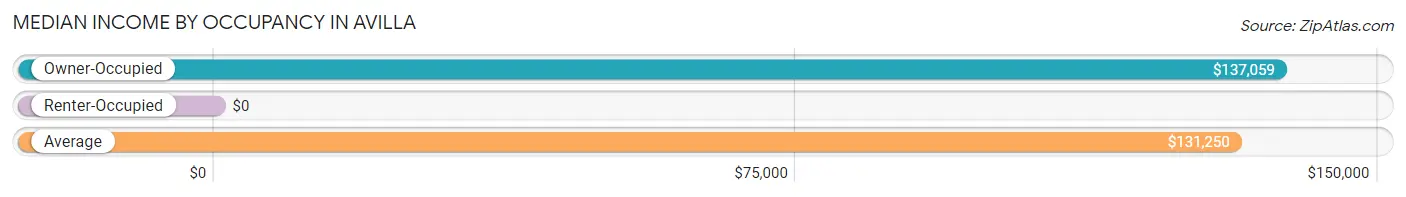
| Occupancy Type | # Households | Median Income |
| Owner-Occupied | 502 (93.5%) | $137,059 |
| Renter-Occupied | 35 (6.5%) | $0 |
| Average | 537 (100.0%) | $131,250 |
Occupancy by Householder Income Bracket in Avilla
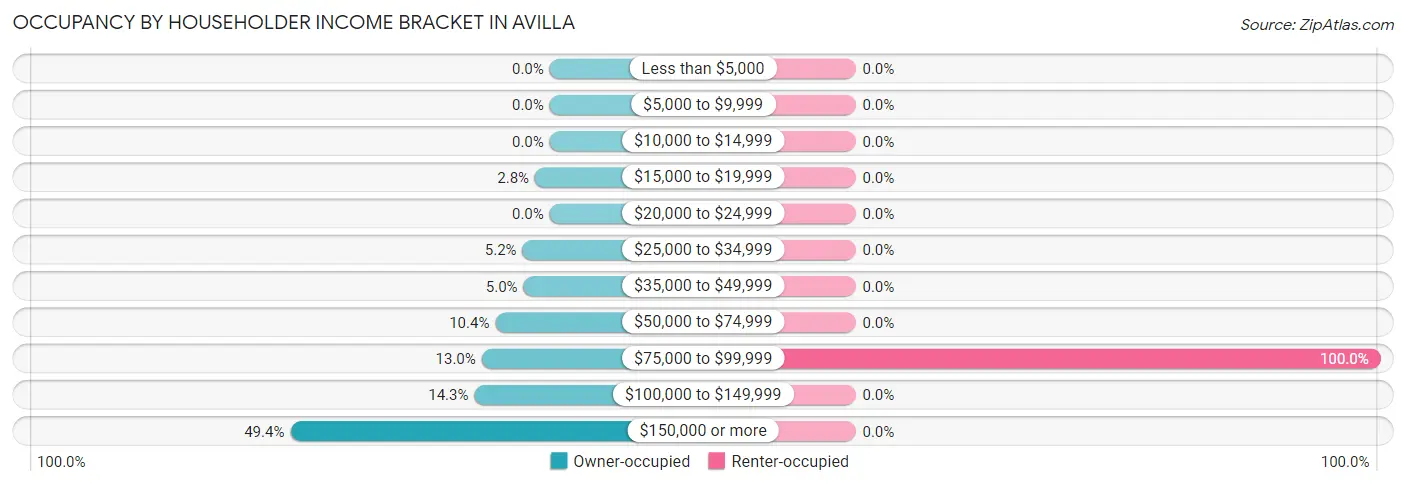
| Income Bracket | Owner-occupied | Renter-occupied |
| Less than $5,000 | 0 (0.0%) | 0 (0.0%) |
| $5,000 to $9,999 | 0 (0.0%) | 0 (0.0%) |
| $10,000 to $14,999 | 0 (0.0%) | 0 (0.0%) |
| $15,000 to $19,999 | 14 (2.8%) | 0 (0.0%) |
| $20,000 to $24,999 | 0 (0.0%) | 0 (0.0%) |
| $25,000 to $34,999 | 26 (5.2%) | 0 (0.0%) |
| $35,000 to $49,999 | 25 (5.0%) | 0 (0.0%) |
| $50,000 to $74,999 | 52 (10.4%) | 0 (0.0%) |
| $75,000 to $99,999 | 65 (13.0%) | 35 (100.0%) |
| $100,000 to $149,999 | 72 (14.3%) | 0 (0.0%) |
| $150,000 or more | 248 (49.4%) | 0 (0.0%) |
| Total | 502 (100.0%) | 35 (100.0%) |
Monthly Housing Cost Tiers in Avilla
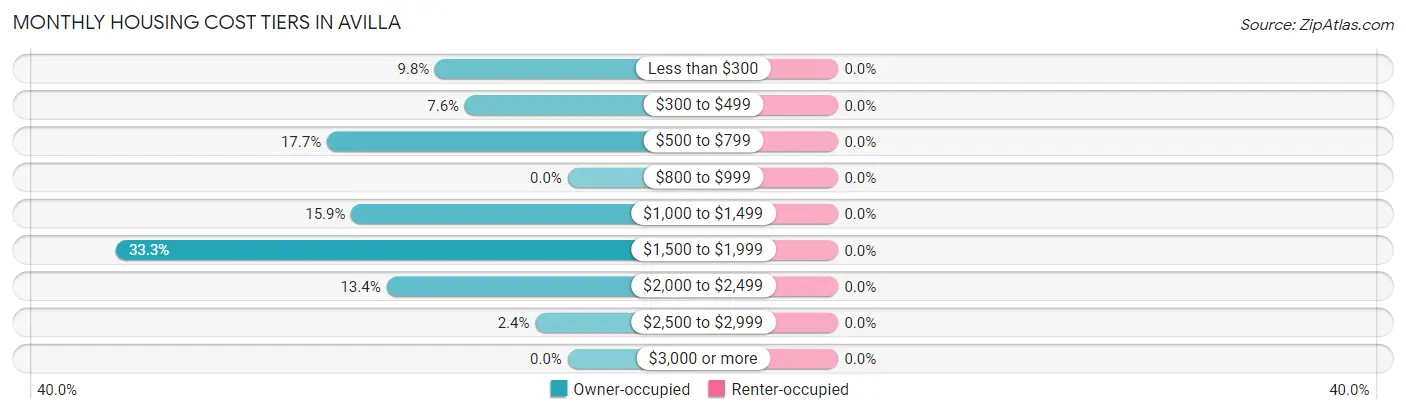
| Monthly Cost | Owner-occupied | Renter-occupied |
| Less than $300 | 49 (9.8%) | 0 (0.0%) |
| $300 to $499 | 38 (7.6%) | 0 (0.0%) |
| $500 to $799 | 89 (17.7%) | 0 (0.0%) |
| $800 to $999 | 0 (0.0%) | 0 (0.0%) |
| $1,000 to $1,499 | 80 (15.9%) | 0 (0.0%) |
| $1,500 to $1,999 | 167 (33.3%) | 0 (0.0%) |
| $2,000 to $2,499 | 67 (13.4%) | 0 (0.0%) |
| $2,500 to $2,999 | 12 (2.4%) | 0 (0.0%) |
| $3,000 or more | 0 (0.0%) | 0 (0.0%) |
| Total | 502 (100.0%) | 35 (100.0%) |
Physical Housing Characteristics in Avilla
Housing Structures in Avilla
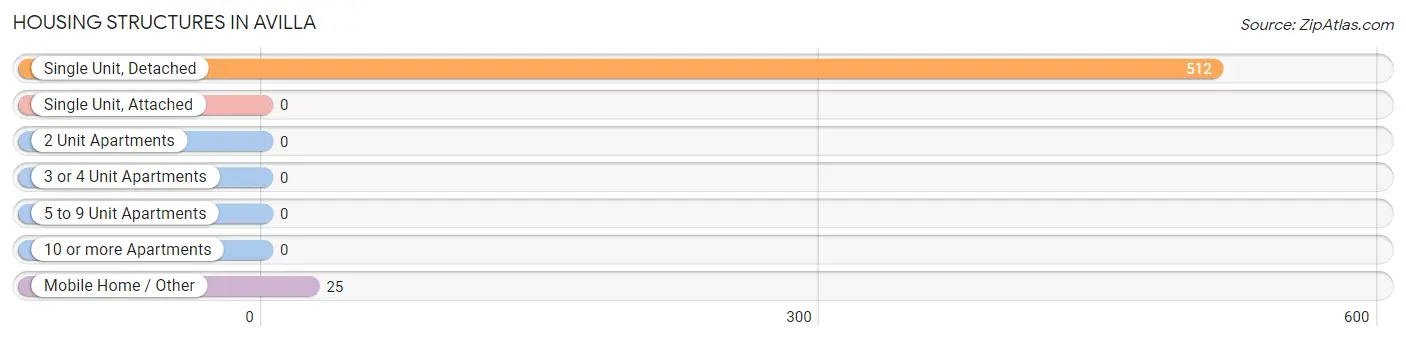
| Structure Type | # Housing Units | % Housing Units |
| Single Unit, Detached | 512 | 95.3% |
| Single Unit, Attached | 0 | 0.0% |
| 2 Unit Apartments | 0 | 0.0% |
| 3 or 4 Unit Apartments | 0 | 0.0% |
| 5 to 9 Unit Apartments | 0 | 0.0% |
| 10 or more Apartments | 0 | 0.0% |
| Mobile Home / Other | 25 | 4.7% |
| Total | 537 | 100.0% |
Housing Structures by Occupancy in Avilla
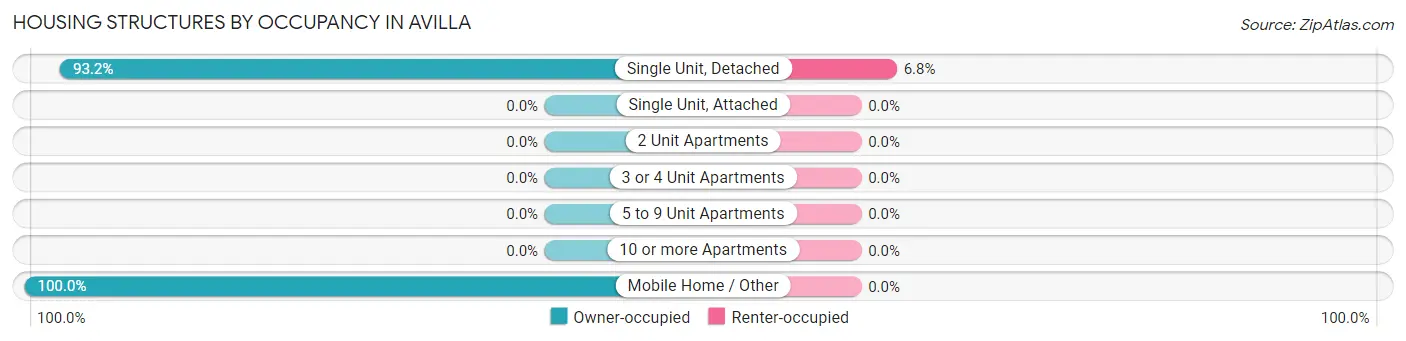
| Structure Type | Owner-occupied | Renter-occupied |
| Single Unit, Detached | 477 (93.2%) | 35 (6.8%) |
| Single Unit, Attached | 0 (0.0%) | 0 (0.0%) |
| 2 Unit Apartments | 0 (0.0%) | 0 (0.0%) |
| 3 or 4 Unit Apartments | 0 (0.0%) | 0 (0.0%) |
| 5 to 9 Unit Apartments | 0 (0.0%) | 0 (0.0%) |
| 10 or more Apartments | 0 (0.0%) | 0 (0.0%) |
| Mobile Home / Other | 25 (100.0%) | 0 (0.0%) |
| Total | 502 (93.5%) | 35 (6.5%) |
Housing Structures by Number of Rooms in Avilla
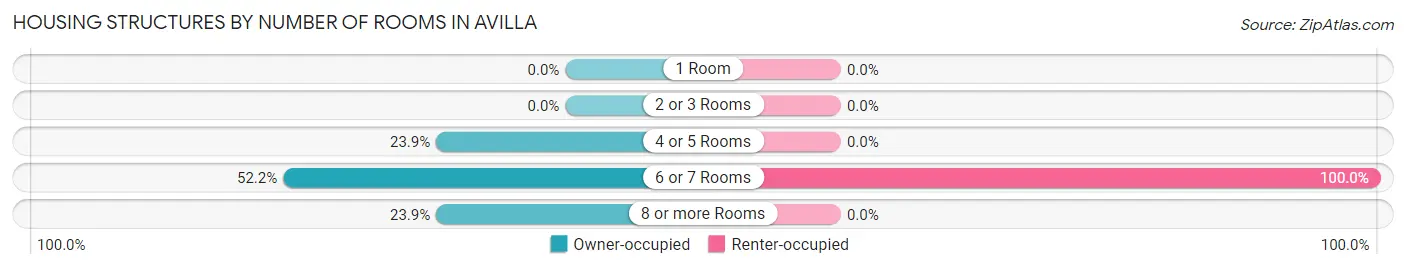
| Number of Rooms | Owner-occupied | Renter-occupied |
| 1 Room | 0 (0.0%) | 0 (0.0%) |
| 2 or 3 Rooms | 0 (0.0%) | 0 (0.0%) |
| 4 or 5 Rooms | 120 (23.9%) | 0 (0.0%) |
| 6 or 7 Rooms | 262 (52.2%) | 35 (100.0%) |
| 8 or more Rooms | 120 (23.9%) | 0 (0.0%) |
| Total | 502 (100.0%) | 35 (100.0%) |
Housing Structure by Heating Type in Avilla
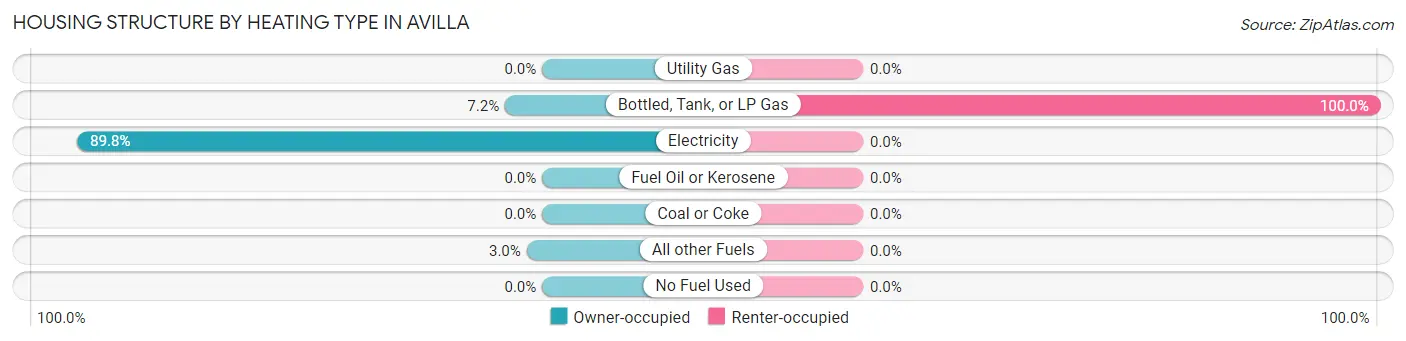
| Heating Type | Owner-occupied | Renter-occupied |
| Utility Gas | 0 (0.0%) | 0 (0.0%) |
| Bottled, Tank, or LP Gas | 36 (7.2%) | 35 (100.0%) |
| Electricity | 451 (89.8%) | 0 (0.0%) |
| Fuel Oil or Kerosene | 0 (0.0%) | 0 (0.0%) |
| Coal or Coke | 0 (0.0%) | 0 (0.0%) |
| All other Fuels | 15 (3.0%) | 0 (0.0%) |
| No Fuel Used | 0 (0.0%) | 0 (0.0%) |
| Total | 502 (100.0%) | 35 (100.0%) |
Household Vehicle Usage in Avilla
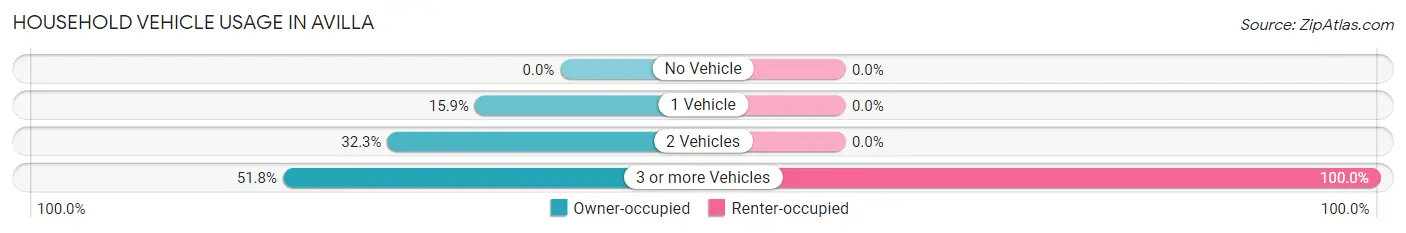
| Vehicles per Household | Owner-occupied | Renter-occupied |
| No Vehicle | 0 (0.0%) | 0 (0.0%) |
| 1 Vehicle | 80 (15.9%) | 0 (0.0%) |
| 2 Vehicles | 162 (32.3%) | 0 (0.0%) |
| 3 or more Vehicles | 260 (51.8%) | 35 (100.0%) |
| Total | 502 (100.0%) | 35 (100.0%) |
Real Estate & Mortgages in Avilla
Real Estate and Mortgage Overview in Avilla
| Characteristic | Without Mortgage | With Mortgage |
| Housing Units | 176 | 326 |
| Median Property Value | $183,300 | $297,200 |
| Median Household Income | $79,219 | $220 |
| Monthly Housing Costs | $502 | $0 |
| Real Estate Taxes | $929 | $72 |
Property Value by Mortgage Status in Avilla
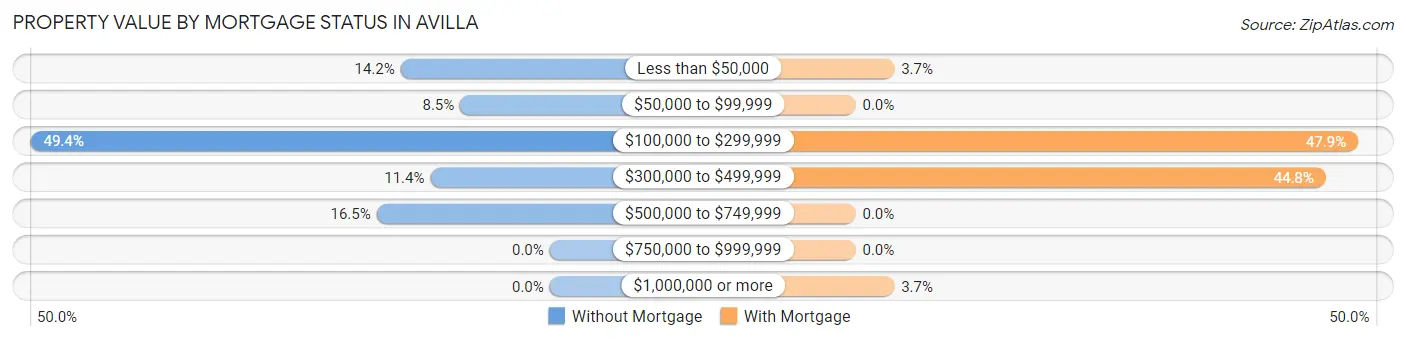
| Property Value | Without Mortgage | With Mortgage |
| Less than $50,000 | 25 (14.2%) | 12 (3.7%) |
| $50,000 to $99,999 | 15 (8.5%) | 0 (0.0%) |
| $100,000 to $299,999 | 87 (49.4%) | 156 (47.8%) |
| $300,000 to $499,999 | 20 (11.4%) | 146 (44.8%) |
| $500,000 to $749,999 | 29 (16.5%) | 0 (0.0%) |
| $750,000 to $999,999 | 0 (0.0%) | 0 (0.0%) |
| $1,000,000 or more | 0 (0.0%) | 12 (3.7%) |
| Total | 176 (100.0%) | 326 (100.0%) |
Household Income by Mortgage Status in Avilla
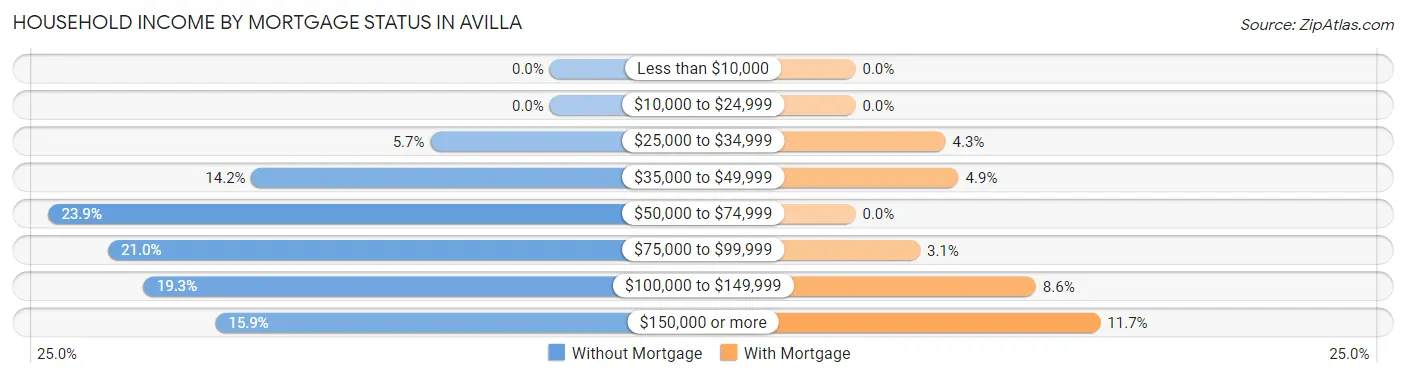
| Household Income | Without Mortgage | With Mortgage |
| Less than $10,000 | 0 (0.0%) | 0 (0.0%) |
| $10,000 to $24,999 | 0 (0.0%) | 0 (0.0%) |
| $25,000 to $34,999 | 10 (5.7%) | 14 (4.3%) |
| $35,000 to $49,999 | 25 (14.2%) | 16 (4.9%) |
| $50,000 to $74,999 | 42 (23.9%) | 0 (0.0%) |
| $75,000 to $99,999 | 37 (21.0%) | 10 (3.1%) |
| $100,000 to $149,999 | 34 (19.3%) | 28 (8.6%) |
| $150,000 or more | 28 (15.9%) | 38 (11.7%) |
| Total | 176 (100.0%) | 326 (100.0%) |
Property Value to Household Income Ratio in Avilla
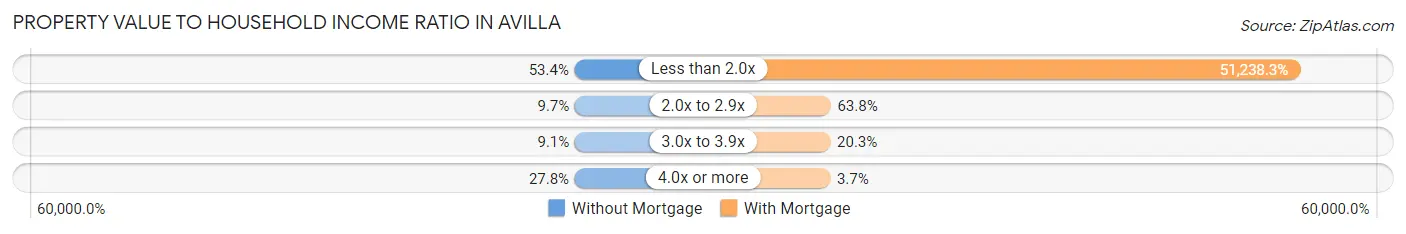
| Value-to-Income Ratio | Without Mortgage | With Mortgage |
| Less than 2.0x | 94 (53.4%) | 167,037 (51,238.3%) |
| 2.0x to 2.9x | 17 (9.7%) | 208 (63.8%) |
| 3.0x to 3.9x | 16 (9.1%) | 66 (20.3%) |
| 4.0x or more | 49 (27.8%) | 12 (3.7%) |
| Total | 176 (100.0%) | 326 (100.0%) |
Real Estate Taxes by Mortgage Status in Avilla
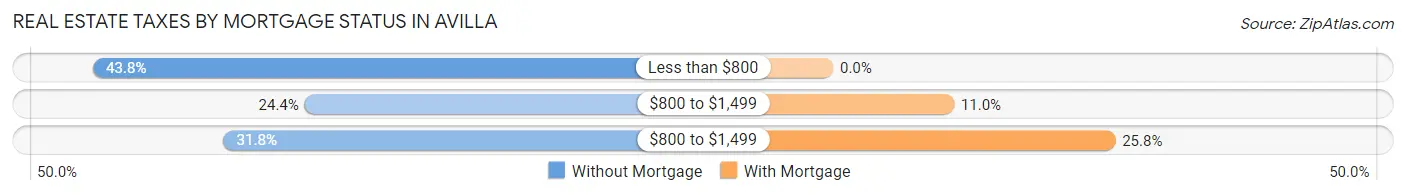
| Property Taxes | Without Mortgage | With Mortgage |
| Less than $800 | 77 (43.8%) | 0 (0.0%) |
| $800 to $1,499 | 43 (24.4%) | 36 (11.0%) |
| $800 to $1,499 | 56 (31.8%) | 84 (25.8%) |
| Total | 176 (100.0%) | 326 (100.0%) |
Health & Disability in Avilla
Health Insurance Coverage by Age in Avilla
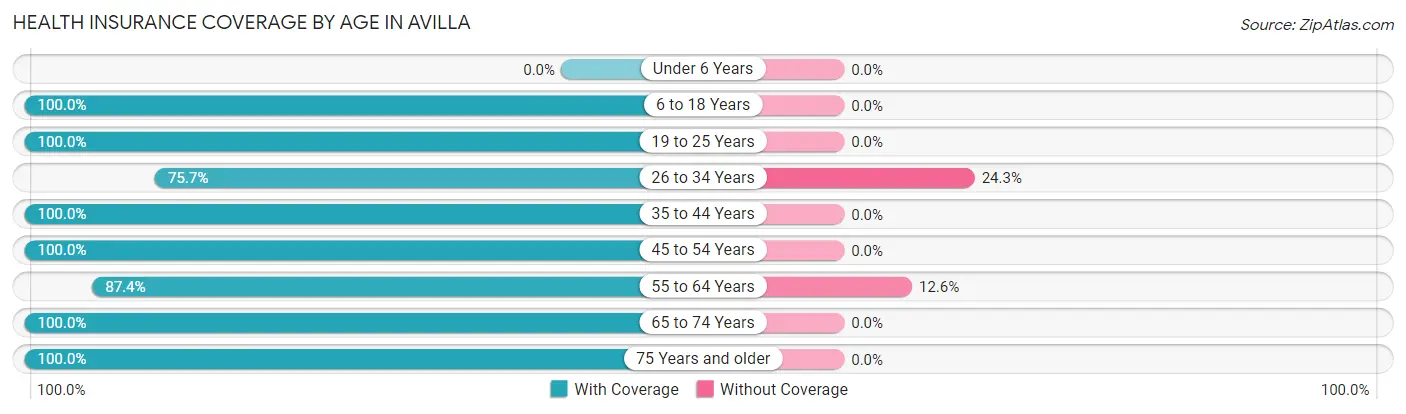
| Age Bracket | With Coverage | Without Coverage |
| Under 6 Years | 0 (0.0%) | 0 (0.0%) |
| 6 to 18 Years | 300 (100.0%) | 0 (0.0%) |
| 19 to 25 Years | 103 (100.0%) | 0 (0.0%) |
| 26 to 34 Years | 112 (75.7%) | 36 (24.3%) |
| 35 to 44 Years | 192 (100.0%) | 0 (0.0%) |
| 45 to 54 Years | 228 (100.0%) | 0 (0.0%) |
| 55 to 64 Years | 249 (87.4%) | 36 (12.6%) |
| 65 to 74 Years | 90 (100.0%) | 0 (0.0%) |
| 75 Years and older | 115 (100.0%) | 0 (0.0%) |
| Total | 1,389 (95.1%) | 72 (4.9%) |
Health Insurance Coverage by Citizenship Status in Avilla
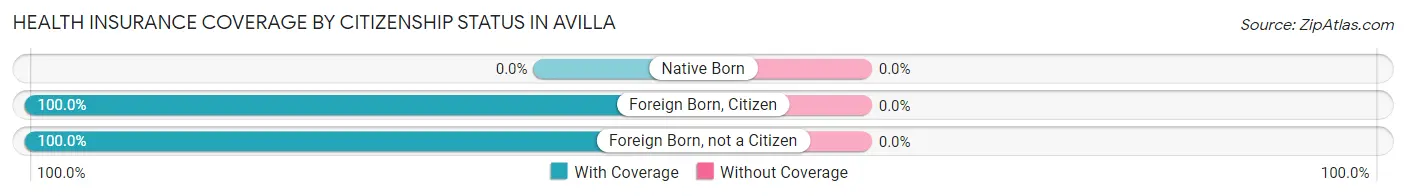
| Citizenship Status | With Coverage | Without Coverage |
| Native Born | 0 (0.0%) | 0 (0.0%) |
| Foreign Born, Citizen | 300 (100.0%) | 0 (0.0%) |
| Foreign Born, not a Citizen | 103 (100.0%) | 0 (0.0%) |
Health Insurance Coverage by Household Income in Avilla
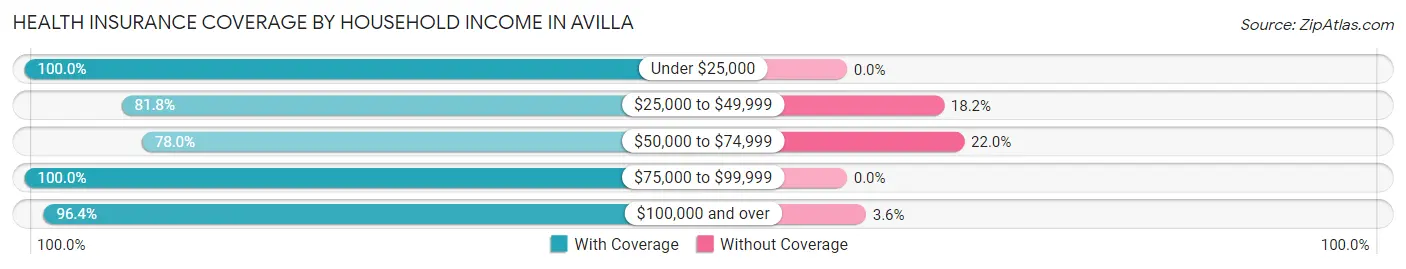
| Household Income | With Coverage | Without Coverage |
| Under $25,000 | 14 (100.0%) | 0 (0.0%) |
| $25,000 to $49,999 | 72 (81.8%) | 16 (18.2%) |
| $50,000 to $74,999 | 71 (78.0%) | 20 (22.0%) |
| $75,000 to $99,999 | 256 (100.0%) | 0 (0.0%) |
| $100,000 and over | 976 (96.4%) | 36 (3.6%) |
Public vs Private Health Insurance Coverage by Age in Avilla
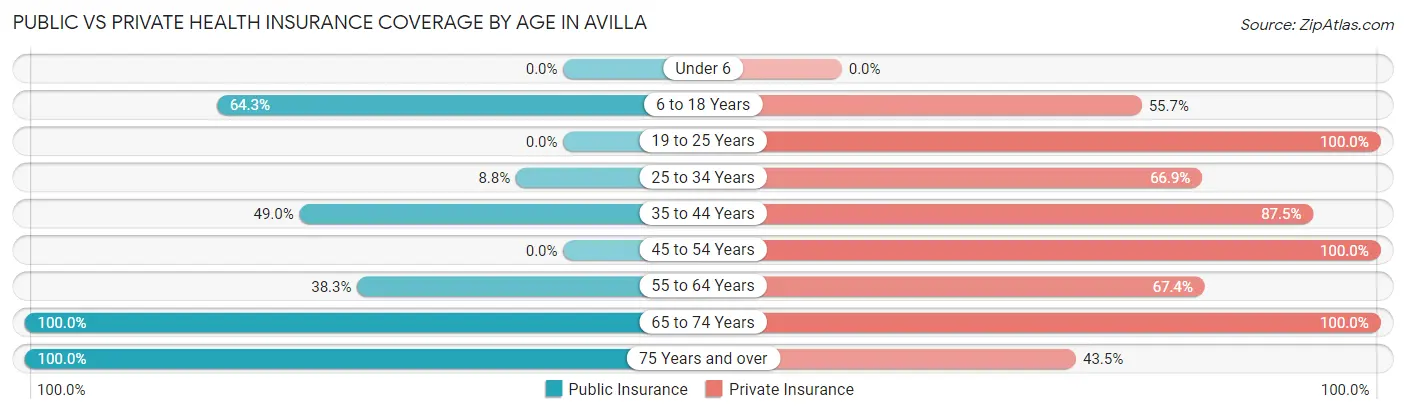
| Age Bracket | Public Insurance | Private Insurance |
| Under 6 | 0 (0.0%) | 0 (0.0%) |
| 6 to 18 Years | 193 (64.3%) | 167 (55.7%) |
| 19 to 25 Years | 0 (0.0%) | 103 (100.0%) |
| 25 to 34 Years | 13 (8.8%) | 99 (66.9%) |
| 35 to 44 Years | 94 (49.0%) | 168 (87.5%) |
| 45 to 54 Years | 0 (0.0%) | 228 (100.0%) |
| 55 to 64 Years | 109 (38.3%) | 192 (67.4%) |
| 65 to 74 Years | 90 (100.0%) | 90 (100.0%) |
| 75 Years and over | 115 (100.0%) | 50 (43.5%) |
| Total | 614 (42.0%) | 1,097 (75.1%) |
Disability Status by Sex by Age in Avilla
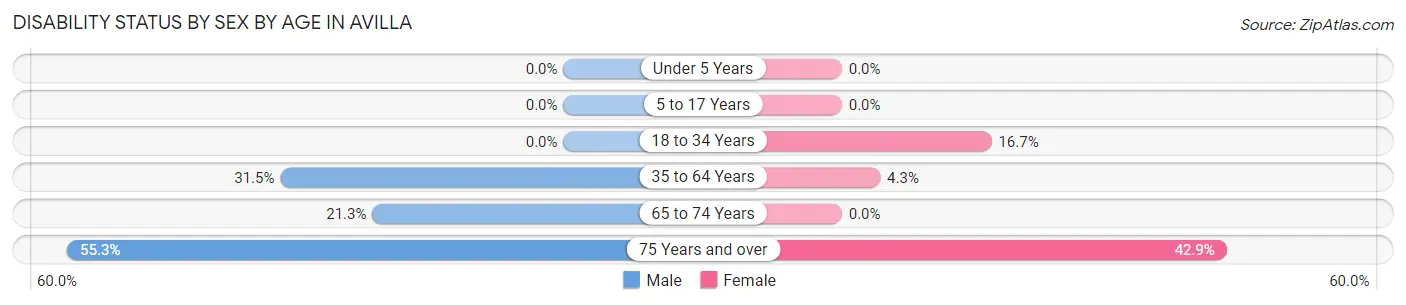
| Age Bracket | Male | Female |
| Under 5 Years | 0 (0.0%) | 0 (0.0%) |
| 5 to 17 Years | 0 (0.0%) | 0 (0.0%) |
| 18 to 34 Years | 0 (0.0%) | 16 (16.7%) |
| 35 to 64 Years | 104 (31.5%) | 16 (4.3%) |
| 65 to 74 Years | 10 (21.3%) | 0 (0.0%) |
| 75 Years and over | 21 (55.3%) | 33 (42.9%) |
Disability Class by Sex by Age in Avilla
Disability Class: Hearing Difficulty
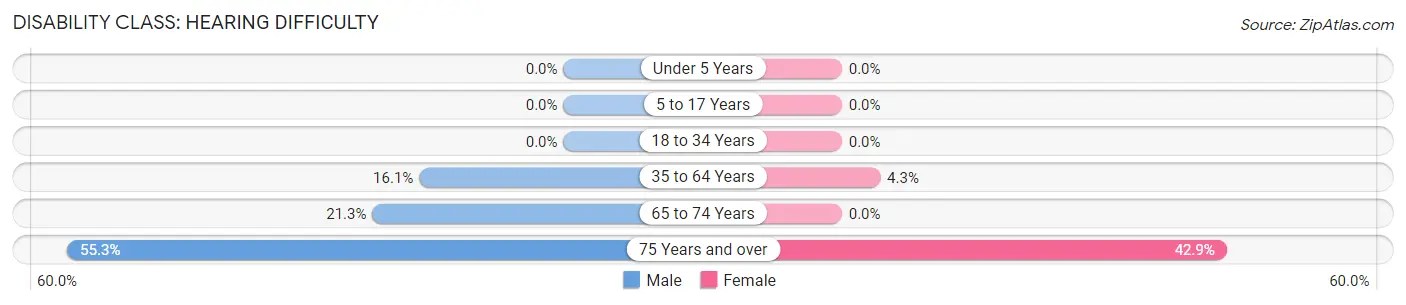
| Age Bracket | Male | Female |
| Under 5 Years | 0 (0.0%) | 0 (0.0%) |
| 5 to 17 Years | 0 (0.0%) | 0 (0.0%) |
| 18 to 34 Years | 0 (0.0%) | 0 (0.0%) |
| 35 to 64 Years | 53 (16.1%) | 16 (4.3%) |
| 65 to 74 Years | 10 (21.3%) | 0 (0.0%) |
| 75 Years and over | 21 (55.3%) | 33 (42.9%) |
Disability Class: Vision Difficulty

| Age Bracket | Male | Female |
| Under 5 Years | 0 (0.0%) | 0 (0.0%) |
| 5 to 17 Years | 0 (0.0%) | 0 (0.0%) |
| 18 to 34 Years | 0 (0.0%) | 0 (0.0%) |
| 35 to 64 Years | 51 (15.4%) | 0 (0.0%) |
| 65 to 74 Years | 0 (0.0%) | 0 (0.0%) |
| 75 Years and over | 9 (23.7%) | 0 (0.0%) |
Disability Class: Cognitive Difficulty
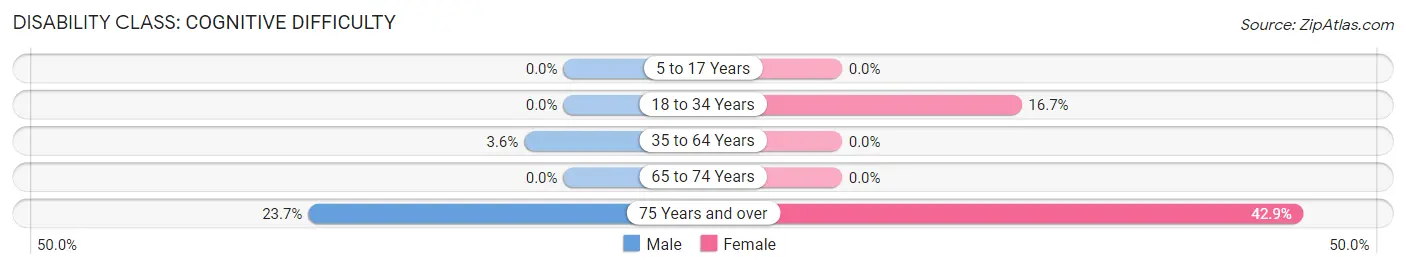
| Age Bracket | Male | Female |
| 5 to 17 Years | 0 (0.0%) | 0 (0.0%) |
| 18 to 34 Years | 0 (0.0%) | 16 (16.7%) |
| 35 to 64 Years | 12 (3.6%) | 0 (0.0%) |
| 65 to 74 Years | 0 (0.0%) | 0 (0.0%) |
| 75 Years and over | 9 (23.7%) | 33 (42.9%) |
Disability Class: Ambulatory Difficulty
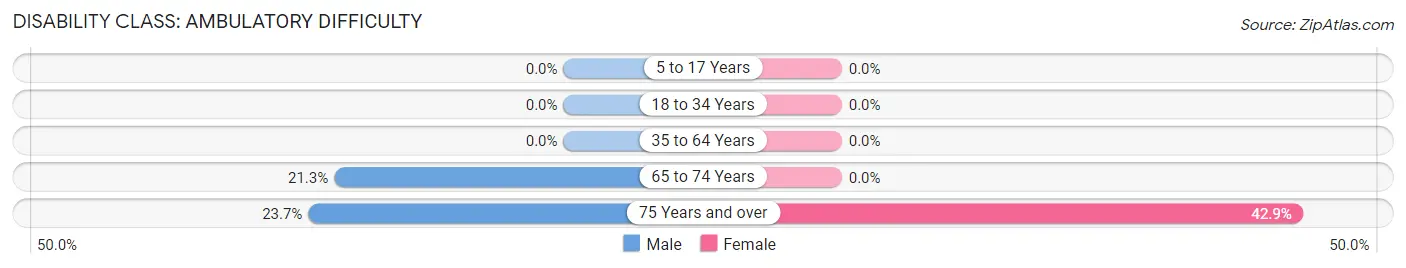
| Age Bracket | Male | Female |
| 5 to 17 Years | 0 (0.0%) | 0 (0.0%) |
| 18 to 34 Years | 0 (0.0%) | 0 (0.0%) |
| 35 to 64 Years | 0 (0.0%) | 0 (0.0%) |
| 65 to 74 Years | 10 (21.3%) | 0 (0.0%) |
| 75 Years and over | 9 (23.7%) | 33 (42.9%) |
Disability Class: Self-Care Difficulty
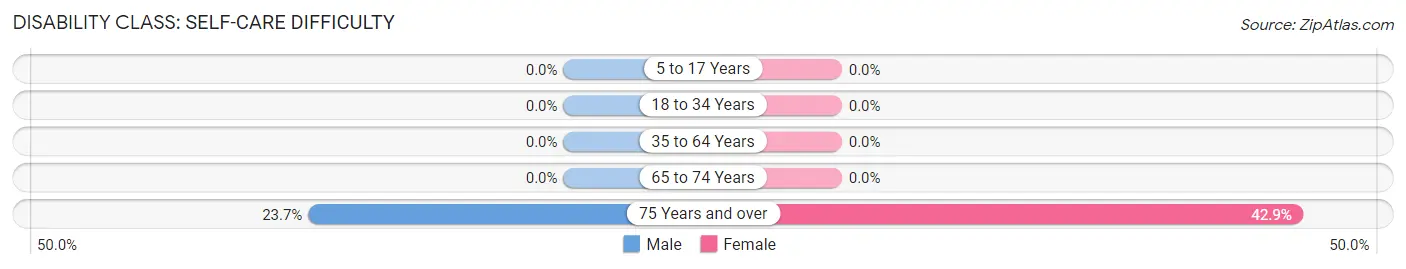
| Age Bracket | Male | Female |
| 5 to 17 Years | 0 (0.0%) | 0 (0.0%) |
| 18 to 34 Years | 0 (0.0%) | 0 (0.0%) |
| 35 to 64 Years | 0 (0.0%) | 0 (0.0%) |
| 65 to 74 Years | 0 (0.0%) | 0 (0.0%) |
| 75 Years and over | 9 (23.7%) | 33 (42.9%) |
Technology Access in Avilla
Computing Device Access in Avilla
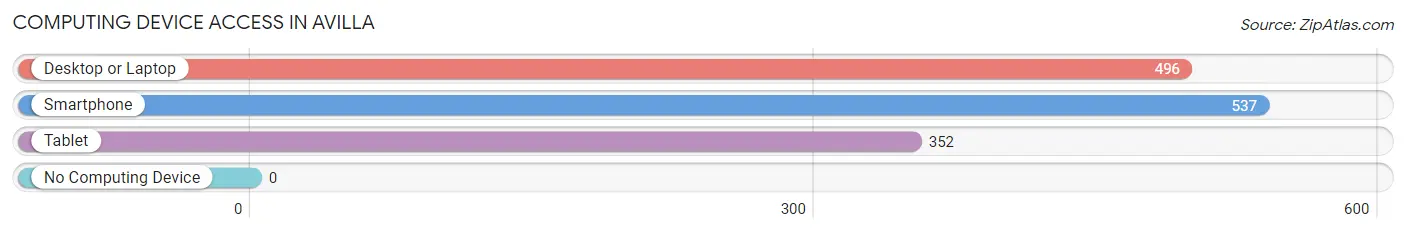
| Device Type | # Households | % Households |
| Desktop or Laptop | 496 | 92.4% |
| Smartphone | 537 | 100.0% |
| Tablet | 352 | 65.5% |
| No Computing Device | 0 | 0.0% |
| Total | 537 | 100.0% |
Internet Access in Avilla
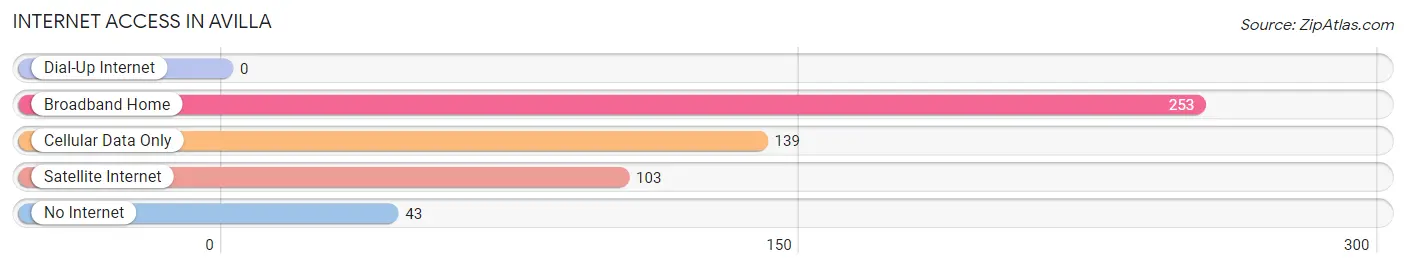
| Internet Type | # Households | % Households |
| Dial-Up Internet | 0 | 0.0% |
| Broadband Home | 253 | 47.1% |
| Cellular Data Only | 139 | 25.9% |
| Satellite Internet | 103 | 19.2% |
| No Internet | 43 | 8.0% |
| Total | 537 | 100.0% |
Avilla Summary
Avilla, Arkansas is a small town located in the northwest corner of the state, near the Oklahoma border. It is part of the Fort Smith metropolitan area and is situated in the Ozark Mountains. The town has a population of just over 1,000 people and is known for its rural charm and friendly atmosphere.
History
Avilla was founded in 1887 by a group of settlers from Missouri. The town was named after the nearby Avilla Creek, which was named after a Native American chief. The town was originally a farming community, but it soon became a center for timber production. The timber industry was the main source of income for the town until the early 20th century, when the railroad arrived and the town began to grow.
In the early 1900s, Avilla was a bustling town with a variety of businesses, including a bank, a hotel, a general store, and a sawmill. The town also had a school, a post office, and a newspaper. The town continued to grow until the Great Depression, when the timber industry declined and many of the businesses closed.
Geography
Avilla is located in the northwest corner of Arkansas, near the Oklahoma border. It is part of the Fort Smith metropolitan area and is situated in the Ozark Mountains. The town is located on the banks of the Arkansas River and is surrounded by rolling hills and forests. The climate is mild and humid, with hot summers and cold winters.
Economy
Avilla’s economy is largely based on agriculture and timber production. The town is home to several farms, which produce a variety of crops, including corn, soybeans, and wheat. The timber industry is also an important part of the local economy, with several sawmills located in the area.
In addition to agriculture and timber production, Avilla is home to several small businesses, including a grocery store, a hardware store, and a restaurant. The town also has a few tourist attractions, including a museum and a historic district.
Demographics
As of the 2010 census, Avilla had a population of 1,072 people. The racial makeup of the town was 95.3% White, 0.9% African American, 0.3% Native American, 0.2% Asian, 0.1% Pacific Islander, and 2.2% from other races. The median household income was $31,250, and the median family income was $37,500.
Avilla is a small, rural town with a friendly atmosphere and a strong sense of community. The town is known for its rural charm and its close-knit community. The town is home to a variety of businesses and attractions, and it is a popular destination for tourists and outdoor enthusiasts.
Common Questions
What is Per Capita Income in Avilla?
Per Capita income in Avilla is $60,546.
What is the Median Family Income in Avilla?
Median Family Income in Avilla is $135,294.
What is the Median Household income in Avilla?
Median Household Income in Avilla is $131,250.
What is Income or Wage Gap in Avilla?
Income or Wage Gap in Avilla is 42.7%.
Women in Avilla earn 57.3 cents for every dollar earned by a man.
What is Inequality or Gini Index in Avilla?
Inequality or Gini Index in Avilla is 0.41.
What is the Total Population of Avilla?
Total Population of Avilla is 1,461.
What is the Total Male Population of Avilla?
Total Male Population of Avilla is 794.
What is the Total Female Population of Avilla?
Total Female Population of Avilla is 667.
What is the Ratio of Males per 100 Females in Avilla?
There are 119.04 Males per 100 Females in Avilla.
What is the Ratio of Females per 100 Males in Avilla?
There are 84.01 Females per 100 Males in Avilla.
What is the Median Population Age in Avilla?
Median Population Age in Avilla is 43.9 Years.
What is the Average Family Size in Avilla
Average Family Size in Avilla is 2.9 People.
What is the Average Household Size in Avilla
Average Household Size in Avilla is 2.7 People.
How Large is the Labor Force in Avilla?
There are 833 People in the Labor Forcein in Avilla.
What is the Percentage of People in the Labor Force in Avilla?
66.1% of People are in the Labor Force in Avilla.