Zip Codes with the Highest Percentage of Population Employed in Legal Services & Support in Conway, AR
RELATED REPORTS & OPTIONS
Legal Services & Support
Conway
Compare Zip Codes
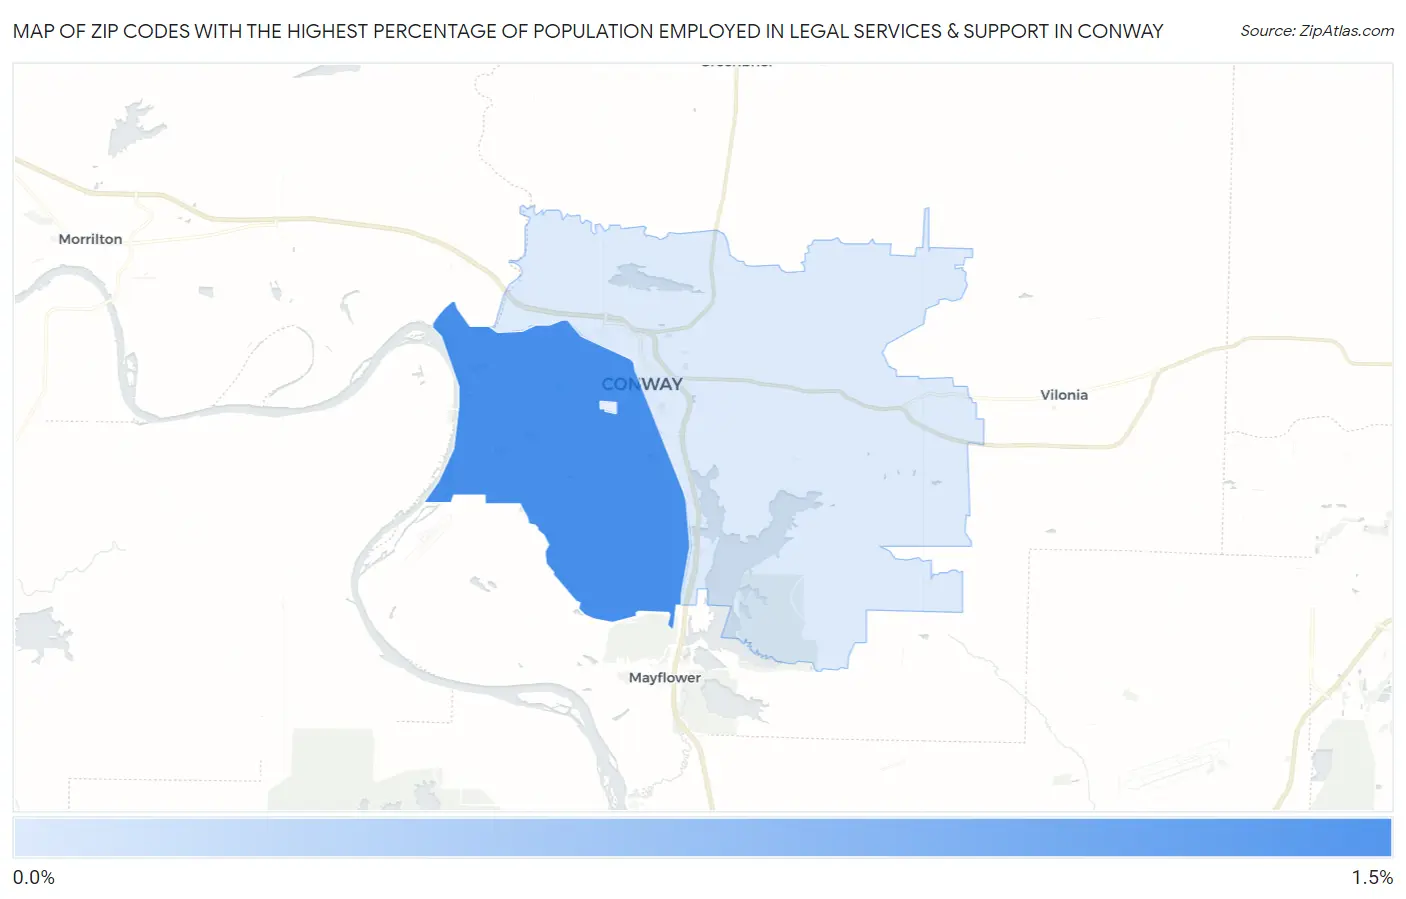
Map of Zip Codes with the Highest Percentage of Population Employed in Legal Services & Support in Conway
0.50%
1.1%
Zip Codes with the Highest Percentage of Population Employed in Legal Services & Support in Conway, AR
| Zip Code | % Employed | vs State | vs National | |
| 1. | 72034 | 1.1% | 0.79%(+0.296)#64 | 1.2%(-0.102)#7,294 |
| 2. | 72032 | 0.50% | 0.79%(-0.288)#131 | 1.2%(-0.686)#12,666 |
1
Common Questions
What are the Top Zip Codes with the Highest Percentage of Population Employed in Legal Services & Support in Conway, AR?
Top Zip Codes with the Highest Percentage of Population Employed in Legal Services & Support in Conway, AR are:
What zip code has the Highest Percentage of Population Employed in Legal Services & Support in Conway, AR?
72034 has the Highest Percentage of Population Employed in Legal Services & Support in Conway, AR with 1.1%.
What is the Percentage of Population Employed in Legal Services & Support in Conway, AR?
Percentage of Population Employed in Legal Services & Support in Conway is 0.98%.
What is the Percentage of Population Employed in Legal Services & Support in Arkansas?
Percentage of Population Employed in Legal Services & Support in Arkansas is 0.79%.
What is the Percentage of Population Employed in Legal Services & Support in the United States?
Percentage of Population Employed in Legal Services & Support in the United States is 1.2%.