East End, AR Map & Demographics
East End Map
East End Overview
$35,347
PER CAPITA INCOME
$86,540
AVG FAMILY INCOME
$76,902
AVG HOUSEHOLD INCOME
13.7%
WAGE / INCOME GAP [ % ]
86.3¢/ $1
WAGE / INCOME GAP [ $ ]
0.41
INEQUALITY / GINI INDEX
6,147
TOTAL POPULATION
2,921
MALE POPULATION
3,226
FEMALE POPULATION
90.55
MALES / 100 FEMALES
110.44
FEMALES / 100 MALES
44.6
MEDIAN AGE
3.0
AVG FAMILY SIZE
2.7
AVG HOUSEHOLD SIZE
3,318
LABOR FORCE [ PEOPLE ]
63.3%
PERCENT IN LABOR FORCE
4.7%
UNEMPLOYMENT RATE
Income in East End
Income Overview in East End
Per Capita Income in East End is $35,347, while median incomes of families and households are $86,540 and $76,902 respectively.
| Characteristic | Number | Measure |
| Per Capita Income | 6,147 | $35,347 |
| Median Family Income | 1,839 | $86,540 |
| Mean Family Income | 1,839 | $98,513 |
| Median Household Income | 2,279 | $76,902 |
| Mean Household Income | 2,279 | $91,330 |
| Income Deficit | 1,839 | $0 |
| Wage / Income Gap (%) | 6,147 | 13.71% |
| Wage / Income Gap ($) | 6,147 | 86.29¢ per $1 |
| Gini / Inequality Index | 6,147 | 0.41 |
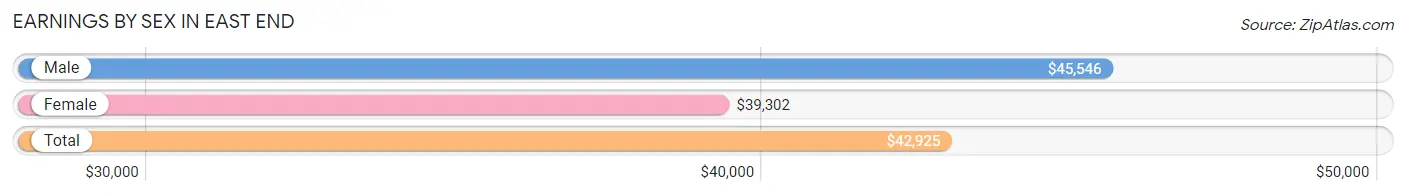
Earnings by Sex in East End
Average Earnings in East End are $42,925, $45,546 for men and $39,302 for women, a difference of 13.7%.
| Sex | Number | Average Earnings |
| Male | 1,691 (50.8%) | $45,546 |
| Female | 1,638 (49.2%) | $39,302 |
| Total | 3,329 (100.0%) | $42,925 |
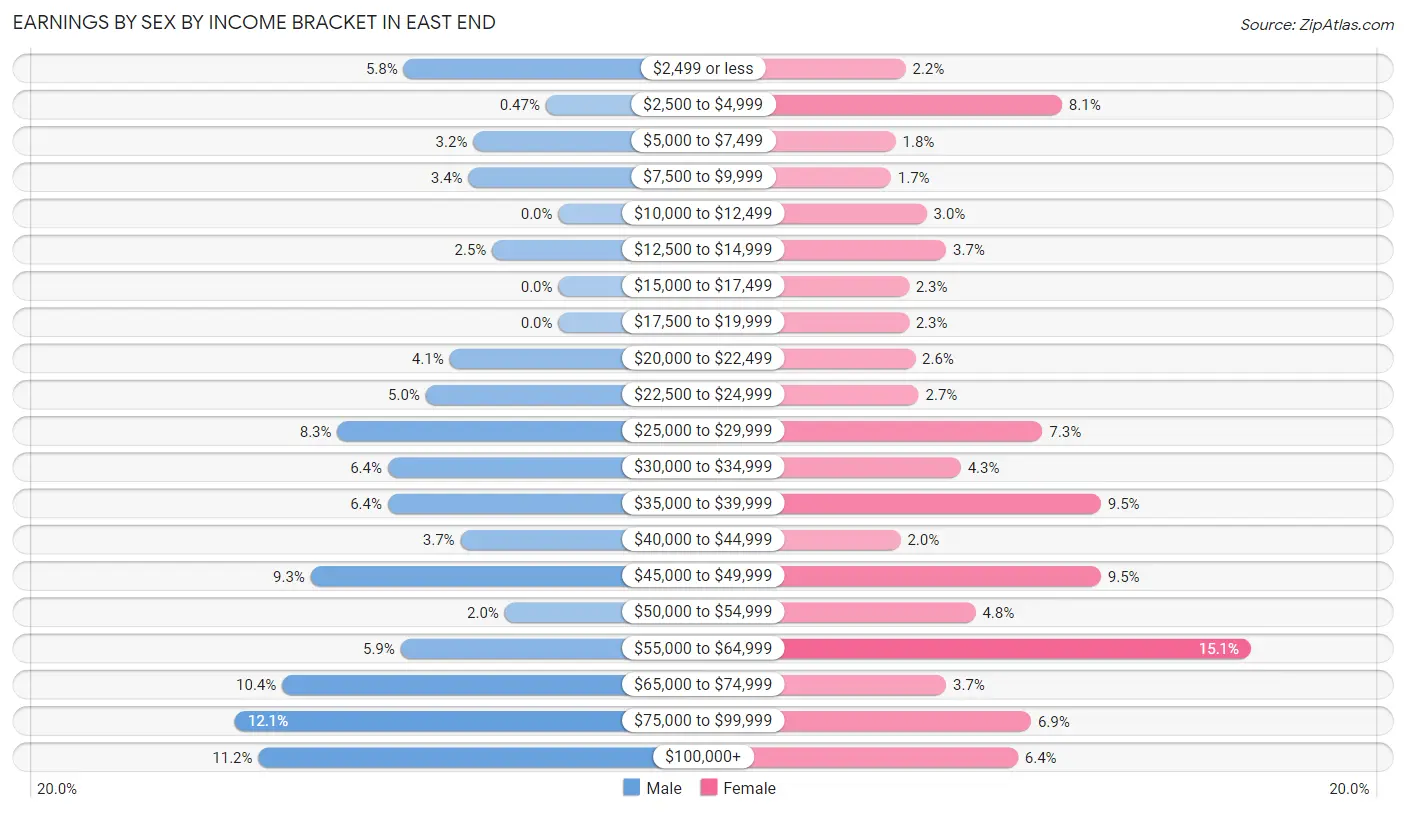
Earnings by Sex by Income Bracket in East End
The most common earnings brackets in East End are $75,000 to $99,999 for men (205 | 12.1%) and $55,000 to $64,999 for women (248 | 15.1%).
| Income | Male | Female |
| $2,499 or less | 98 (5.8%) | 36 (2.2%) |
| $2,500 to $4,999 | 8 (0.5%) | 132 (8.1%) |
| $5,000 to $7,499 | 54 (3.2%) | 30 (1.8%) |
| $7,500 to $9,999 | 57 (3.4%) | 27 (1.7%) |
| $10,000 to $12,499 | 0 (0.0%) | 49 (3.0%) |
| $12,500 to $14,999 | 42 (2.5%) | 61 (3.7%) |
| $15,000 to $17,499 | 0 (0.0%) | 38 (2.3%) |
| $17,500 to $19,999 | 0 (0.0%) | 38 (2.3%) |
| $20,000 to $22,499 | 69 (4.1%) | 42 (2.6%) |
| $22,500 to $24,999 | 84 (5.0%) | 44 (2.7%) |
| $25,000 to $29,999 | 140 (8.3%) | 120 (7.3%) |
| $30,000 to $34,999 | 108 (6.4%) | 70 (4.3%) |
| $35,000 to $39,999 | 108 (6.4%) | 156 (9.5%) |
| $40,000 to $44,999 | 62 (3.7%) | 33 (2.0%) |
| $45,000 to $49,999 | 157 (9.3%) | 156 (9.5%) |
| $50,000 to $54,999 | 34 (2.0%) | 79 (4.8%) |
| $55,000 to $64,999 | 100 (5.9%) | 248 (15.1%) |
| $65,000 to $74,999 | 175 (10.3%) | 61 (3.7%) |
| $75,000 to $99,999 | 205 (12.1%) | 113 (6.9%) |
| $100,000+ | 190 (11.2%) | 105 (6.4%) |
| Total | 1,691 (100.0%) | 1,638 (100.0%) |
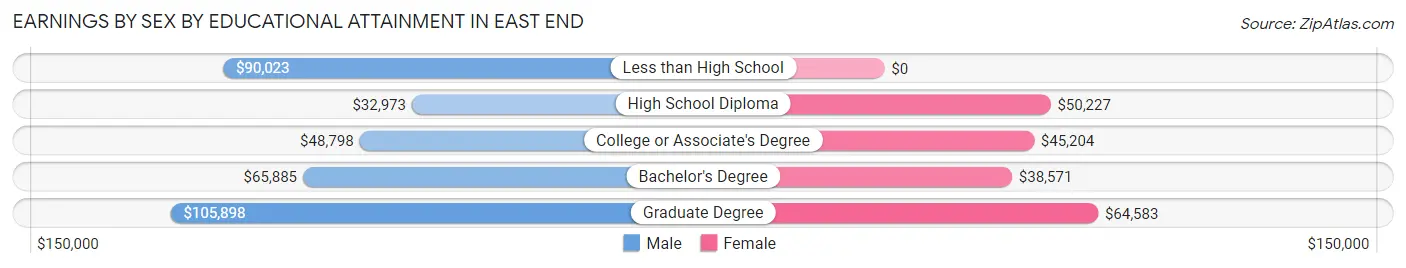
Earnings by Sex by Educational Attainment in East End
Average earnings in East End are $47,674 for men and $47,801 for women, a difference of 0.3%. Men with an educational attainment of graduate degree enjoy the highest average annual earnings of $105,898, while those with high school diploma education earn the least with $32,973. Women with an educational attainment of graduate degree earn the most with the average annual earnings of $64,583, while those with bachelor's degree education have the smallest earnings of $38,571.
| Educational Attainment | Male Income | Female Income |
| Less than High School | $90,023 | $0 |
| High School Diploma | $32,973 | $50,227 |
| College or Associate's Degree | $48,798 | $45,204 |
| Bachelor's Degree | $65,885 | $38,571 |
| Graduate Degree | $105,898 | $64,583 |
| Total | $47,674 | $47,801 |
Family Income in East End
Family Income Brackets in East End
According to the East End family income data, there are 487 families falling into the $100,000 to $149,999 income range, which is the most common income bracket and makes up 26.5% of all families. Conversely, the less than $10,000 income bracket is the least frequent group with only 39 families (2.1%) belonging to this category.
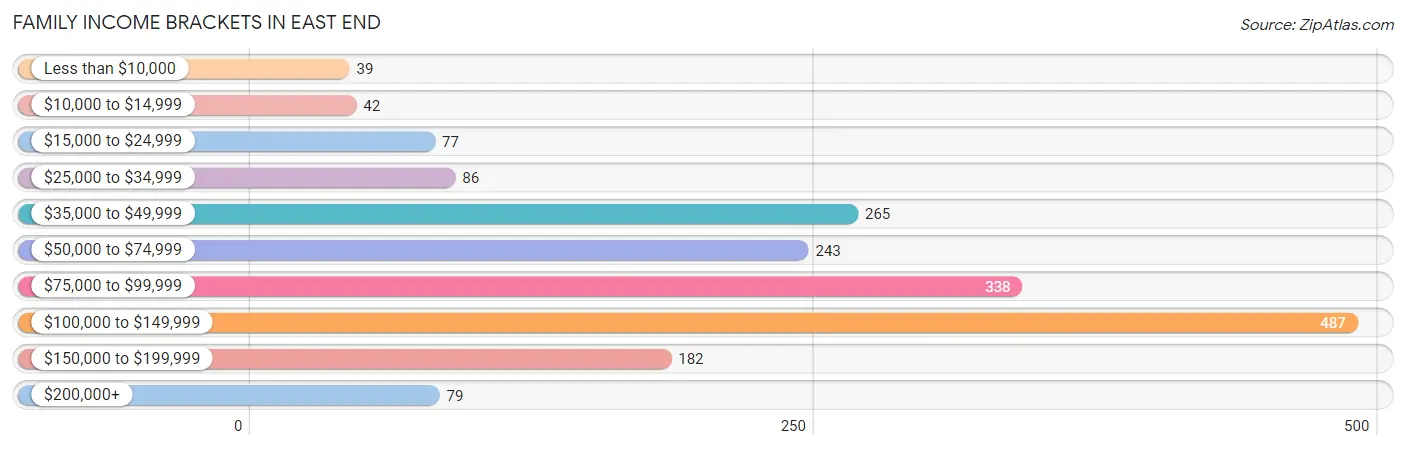
| Income Bracket | # Families | % Families |
| Less than $10,000 | 39 | 2.1% |
| $10,000 to $14,999 | 42 | 2.3% |
| $15,000 to $24,999 | 77 | 4.2% |
| $25,000 to $34,999 | 86 | 4.7% |
| $35,000 to $49,999 | 265 | 14.4% |
| $50,000 to $74,999 | 243 | 13.2% |
| $75,000 to $99,999 | 338 | 18.4% |
| $100,000 to $149,999 | 487 | 26.5% |
| $150,000 to $199,999 | 182 | 9.9% |
| $200,000+ | 79 | 4.3% |
Family Income by Famaliy Size in East End
3-person families (551 | 30.0%) account for the highest median family income in East End with $107,614 per family, while 3-person families (551 | 30.0%) have the highest median income of $35,871 per family member.
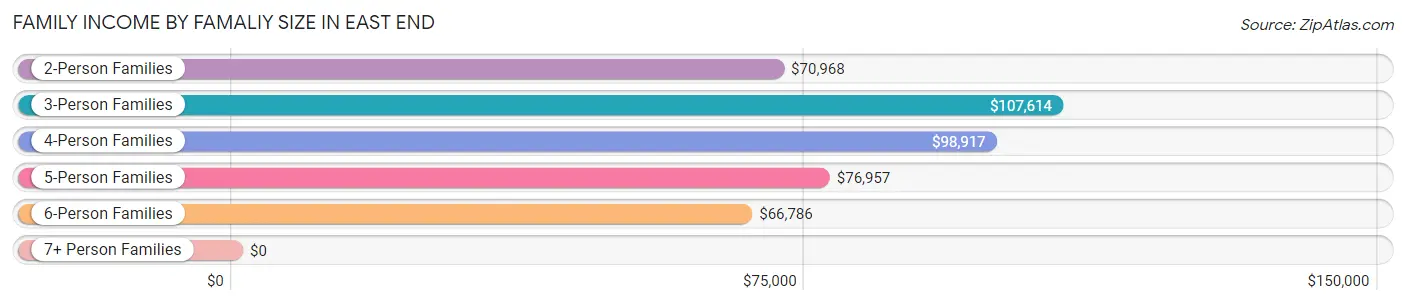
| Income Bracket | # Families | Median Income |
| 2-Person Families | 940 (51.1%) | $70,968 |
| 3-Person Families | 551 (30.0%) | $107,614 |
| 4-Person Families | 194 (10.5%) | $98,917 |
| 5-Person Families | 110 (6.0%) | $76,957 |
| 6-Person Families | 44 (2.4%) | $66,786 |
| 7+ Person Families | 0 (0.0%) | $0 |
| Total | 1,839 (100.0%) | $86,540 |
Family Income by Number of Earners in East End
The median family income in East End is $86,540, with families comprising 2 earners (755) having the highest median family income of $116,250, while families with no earners (332) have the lowest median family income of $53,750, accounting for 41.0% and 18.0% of families, respectively.
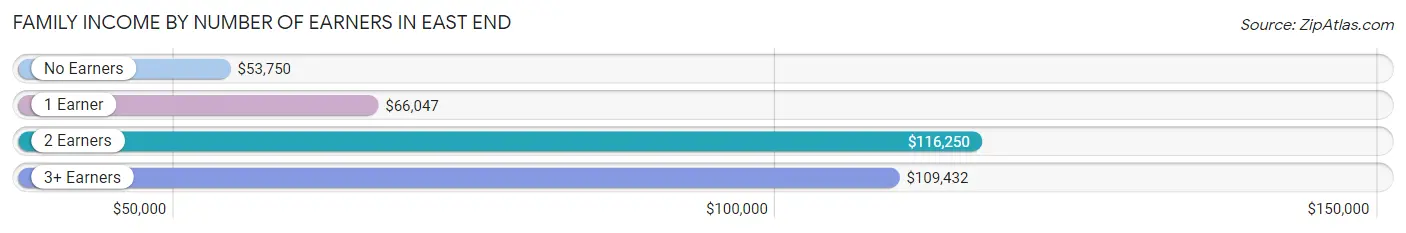
| Number of Earners | # Families | Median Income |
| No Earners | 332 (18.0%) | $53,750 |
| 1 Earner | 595 (32.4%) | $66,047 |
| 2 Earners | 755 (41.0%) | $116,250 |
| 3+ Earners | 157 (8.5%) | $109,432 |
| Total | 1,839 (100.0%) | $86,540 |
Household Income in East End
Household Income Brackets in East End
With 483 households falling in the category, the $100,000 to $149,999 income range is the most frequent in East End, accounting for 21.2% of all households. In contrast, only 41 households (1.8%) fall into the $10,000 to $14,999 income bracket, making it the least populous group.
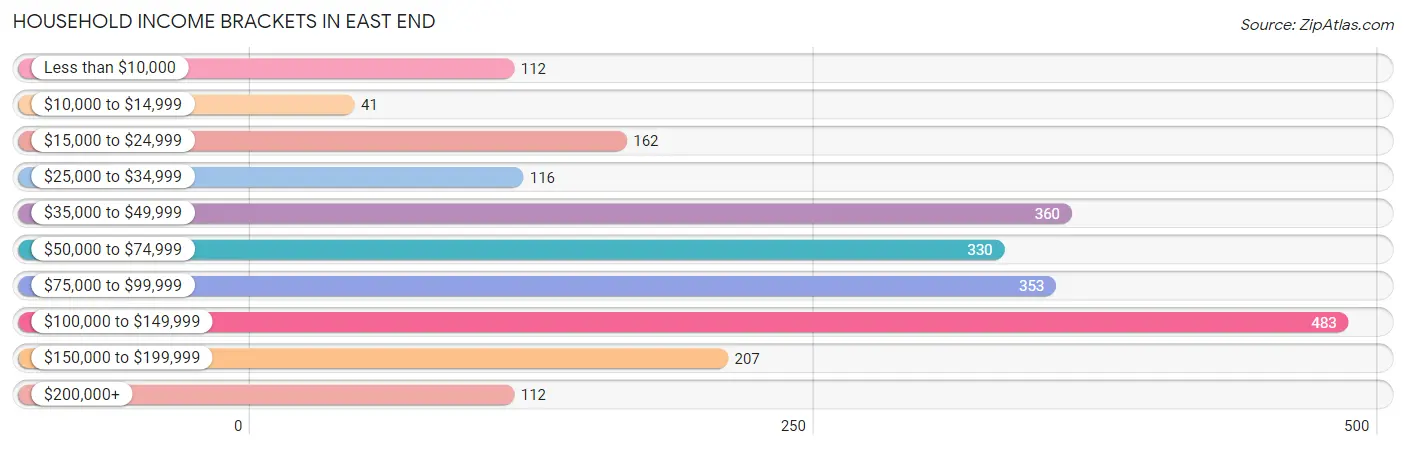
| Income Bracket | # Households | % Households |
| Less than $10,000 | 112 | 4.9% |
| $10,000 to $14,999 | 41 | 1.8% |
| $15,000 to $24,999 | 162 | 7.1% |
| $25,000 to $34,999 | 116 | 5.1% |
| $35,000 to $49,999 | 360 | 15.8% |
| $50,000 to $74,999 | 330 | 14.5% |
| $75,000 to $99,999 | 353 | 15.5% |
| $100,000 to $149,999 | 483 | 21.2% |
| $150,000 to $199,999 | 207 | 9.1% |
| $200,000+ | 112 | 4.9% |
Household Income by Householder Age in East End
The median household income in East End is $76,902, with the highest median household income of $99,118 found in the 45 to 64 years age bracket for the primary householder. A total of 1,104 households (48.4%) fall into this category. Meanwhile, the 15 to 24 years age bracket for the primary householder has the lowest median household income of $0, with 87 households (3.8%) in this group.
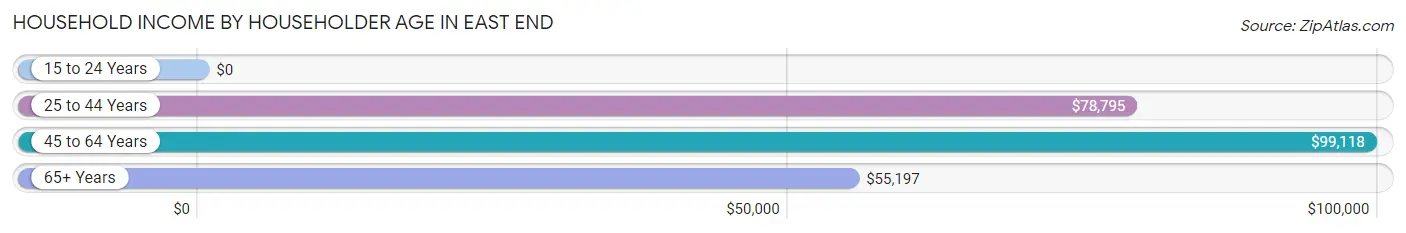
| Income Bracket | # Households | Median Income |
| 15 to 24 Years | 87 (3.8%) | $0 |
| 25 to 44 Years | 555 (24.3%) | $78,795 |
| 45 to 64 Years | 1,104 (48.4%) | $99,118 |
| 65+ Years | 533 (23.4%) | $55,197 |
| Total | 2,279 (100.0%) | $76,902 |
Poverty in East End
Income Below Poverty by Sex and Age in East End
With 9.1% poverty level for males and 4.6% for females among the residents of East End, 18 to 24 year old males and 35 to 44 year old females are the most vulnerable to poverty, with 128 males (48.7%) and 51 females (18.4%) in their respective age groups living below the poverty level.
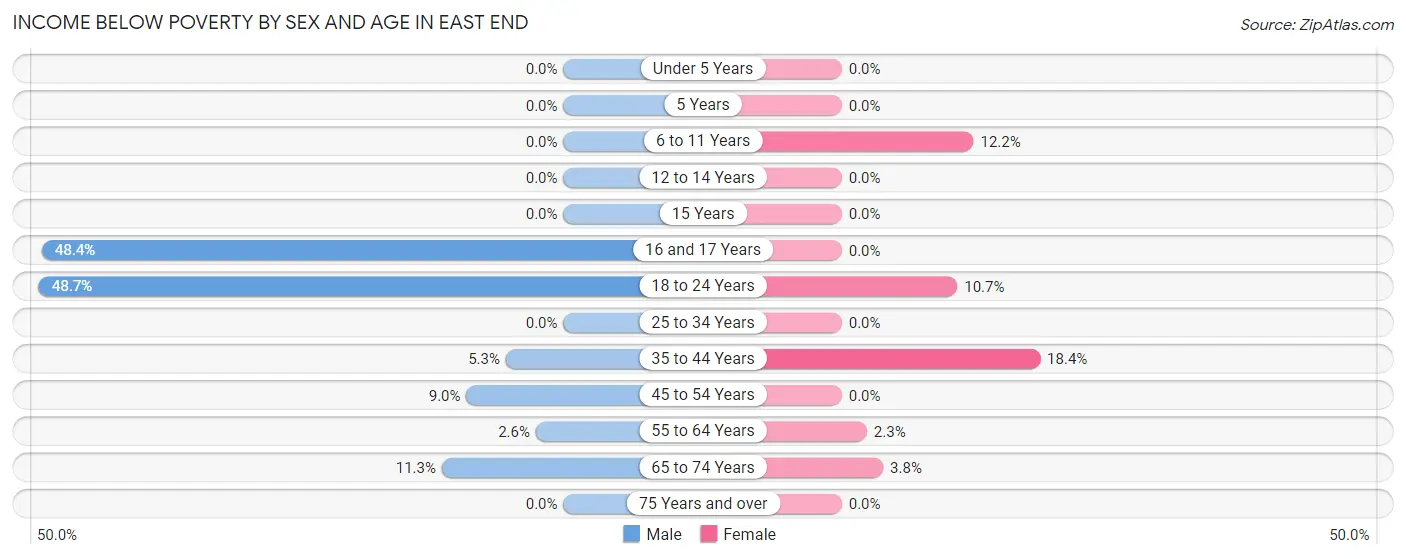
| Age Bracket | Male | Female |
| Under 5 Years | 0 (0.0%) | 0 (0.0%) |
| 5 Years | 0 (0.0%) | 0 (0.0%) |
| 6 to 11 Years | 0 (0.0%) | 34 (12.2%) |
| 12 to 14 Years | 0 (0.0%) | 0 (0.0%) |
| 15 Years | 0 (0.0%) | 0 (0.0%) |
| 16 and 17 Years | 30 (48.4%) | 0 (0.0%) |
| 18 to 24 Years | 128 (48.7%) | 37 (10.7%) |
| 25 to 34 Years | 0 (0.0%) | 0 (0.0%) |
| 35 to 44 Years | 21 (5.3%) | 51 (18.4%) |
| 45 to 54 Years | 43 (9.0%) | 0 (0.0%) |
| 55 to 64 Years | 15 (2.6%) | 10 (2.3%) |
| 65 to 74 Years | 29 (11.3%) | 16 (3.8%) |
| 75 Years and over | 0 (0.0%) | 0 (0.0%) |
| Total | 266 (9.1%) | 148 (4.6%) |
Income Above Poverty by Sex and Age in East End
According to the poverty statistics in East End, males aged under 5 years and females aged under 5 years are the age groups that are most secure financially, with 100.0% of males and 100.0% of females in these age groups living above the poverty line.
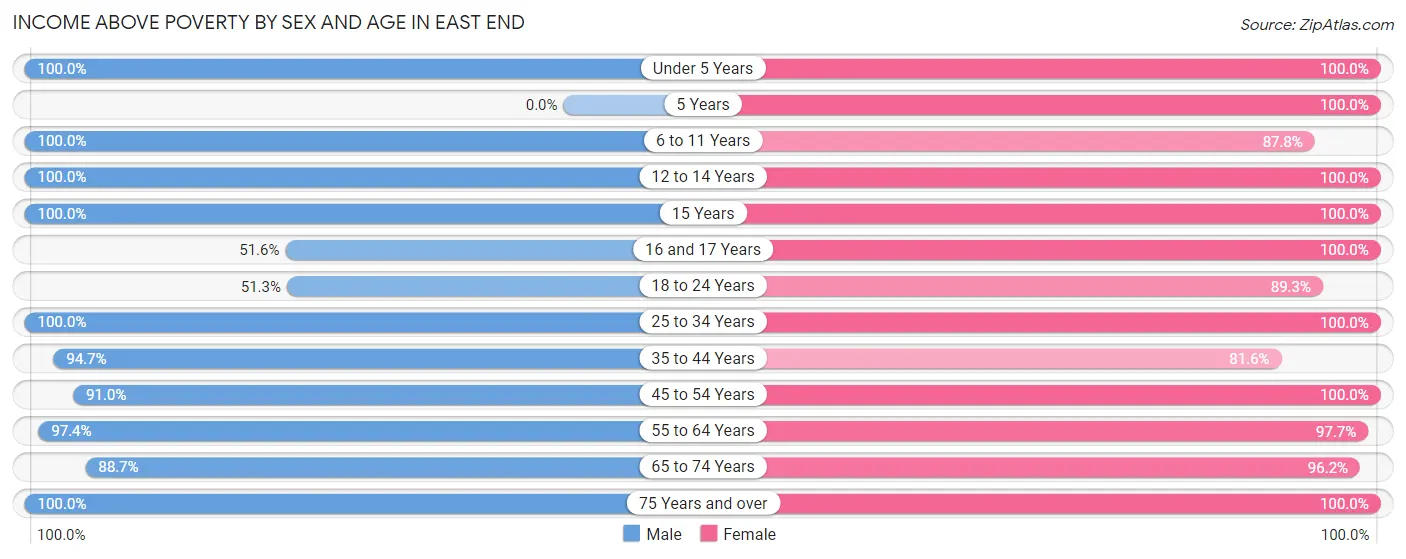
| Age Bracket | Male | Female |
| Under 5 Years | 87 (100.0%) | 35 (100.0%) |
| 5 Years | 0 (0.0%) | 35 (100.0%) |
| 6 to 11 Years | 143 (100.0%) | 244 (87.8%) |
| 12 to 14 Years | 77 (100.0%) | 143 (100.0%) |
| 15 Years | 31 (100.0%) | 65 (100.0%) |
| 16 and 17 Years | 32 (51.6%) | 86 (100.0%) |
| 18 to 24 Years | 135 (51.3%) | 308 (89.3%) |
| 25 to 34 Years | 418 (100.0%) | 359 (100.0%) |
| 35 to 44 Years | 372 (94.7%) | 226 (81.6%) |
| 45 to 54 Years | 435 (91.0%) | 586 (100.0%) |
| 55 to 64 Years | 572 (97.4%) | 420 (97.7%) |
| 65 to 74 Years | 228 (88.7%) | 401 (96.2%) |
| 75 Years and over | 125 (100.0%) | 158 (100.0%) |
| Total | 2,655 (90.9%) | 3,066 (95.4%) |
Income Below Poverty Among Married-Couple Families in East End
The poverty statistics for married-couple families in East End show that 2.2% or 28 of the total 1,244 families live below the poverty line. Families with no children have the highest poverty rate of 3.1%, comprising of 28 families. On the other hand, families with 1 or 2 children have the lowest poverty rate of 0.0%, which includes 0 families.
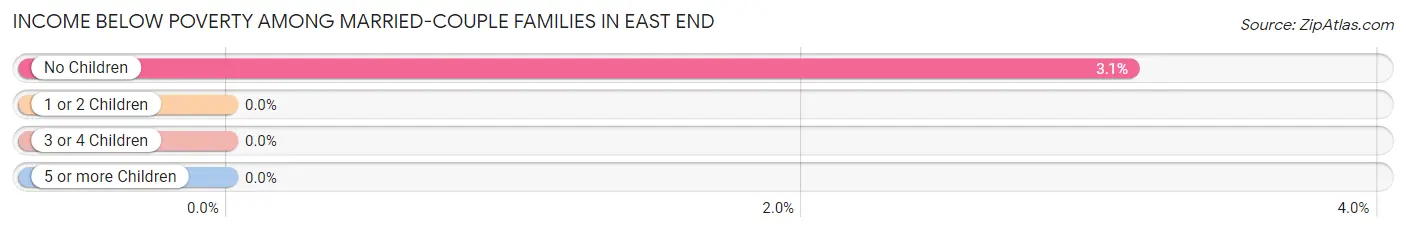
| Children | Above Poverty | Below Poverty |
| No Children | 865 (96.9%) | 28 (3.1%) |
| 1 or 2 Children | 279 (100.0%) | 0 (0.0%) |
| 3 or 4 Children | 72 (100.0%) | 0 (0.0%) |
| 5 or more Children | 0 (0.0%) | 0 (0.0%) |
| Total | 1,216 (97.8%) | 28 (2.2%) |
Income Below Poverty Among Single-Parent Households in East End
According to the poverty data in East End, 18.5% or 42 single-father households and 7.3% or 27 single-mother households are living below the poverty line. Among single-father households, those with 1 or 2 children have the highest poverty rate, with 42 households (34.7%) experiencing poverty. Likewise, among single-mother households, those with no children have the highest poverty rate, with 27 households (14.1%) falling below the poverty line.
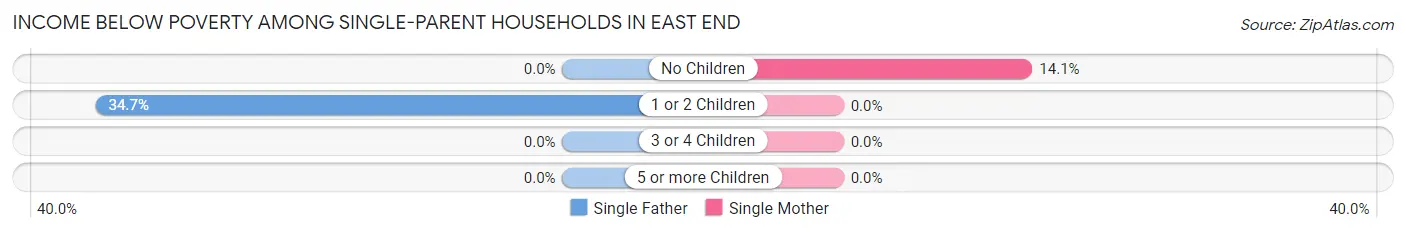
| Children | Single Father | Single Mother |
| No Children | 0 (0.0%) | 27 (14.1%) |
| 1 or 2 Children | 42 (34.7%) | 0 (0.0%) |
| 3 or 4 Children | 0 (0.0%) | 0 (0.0%) |
| 5 or more Children | 0 (0.0%) | 0 (0.0%) |
| Total | 42 (18.5%) | 27 (7.3%) |
Income Below Poverty Among Married-Couple vs Single-Parent Households in East End
The poverty data for East End shows that 28 of the married-couple family households (2.2%) and 69 of the single-parent households (11.6%) are living below the poverty level. Within the married-couple family households, those with no children have the highest poverty rate, with 28 households (3.1%) falling below the poverty line. Among the single-parent households, those with 1 or 2 children have the highest poverty rate, with 42 household (14.1%) living below poverty.
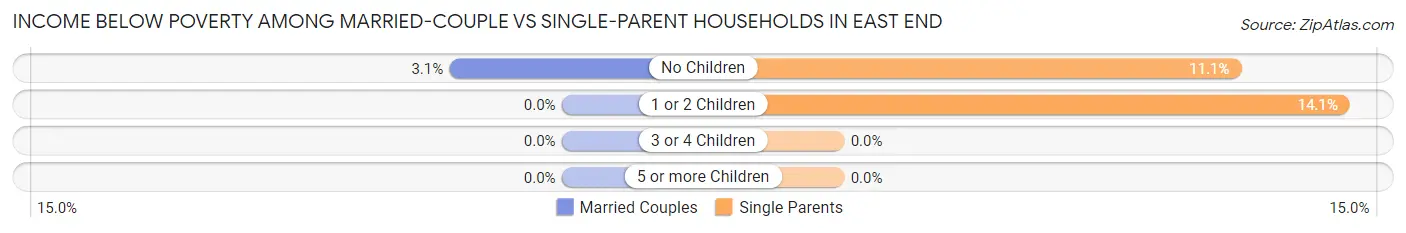
| Children | Married-Couple Families | Single-Parent Households |
| No Children | 28 (3.1%) | 27 (11.1%) |
| 1 or 2 Children | 0 (0.0%) | 42 (14.1%) |
| 3 or 4 Children | 0 (0.0%) | 0 (0.0%) |
| 5 or more Children | 0 (0.0%) | 0 (0.0%) |
| Total | 28 (2.2%) | 69 (11.6%) |
Race in East End
The most populous races in East End are White / Caucasian (5,348 | 87.0%), Two or more Races (368 | 6.0%), and Hispanic or Latino (341 | 5.6%).
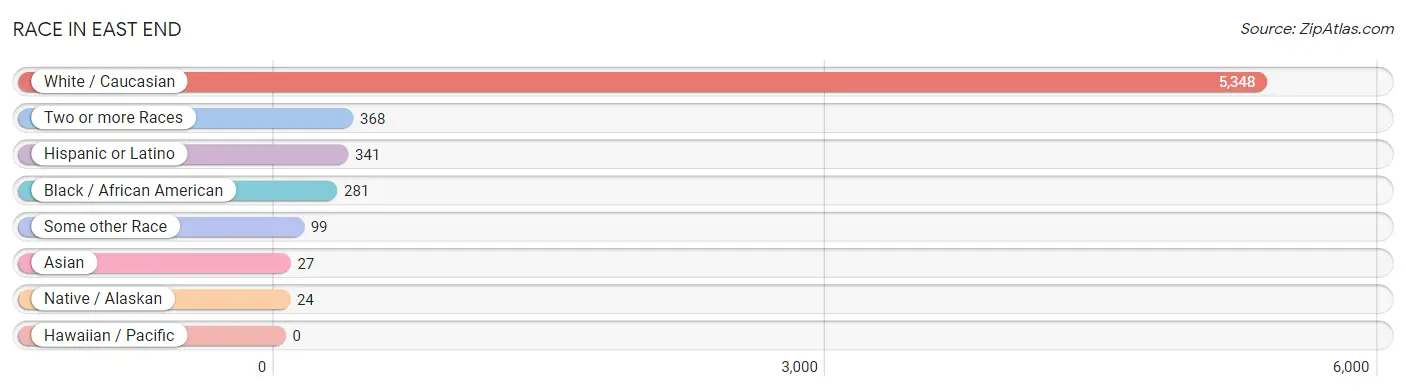
| Race | # Population | % Population |
| Asian | 27 | 0.4% |
| Black / African American | 281 | 4.6% |
| Hawaiian / Pacific | 0 | 0.0% |
| Hispanic or Latino | 341 | 5.6% |
| Native / Alaskan | 24 | 0.4% |
| White / Caucasian | 5,348 | 87.0% |
| Two or more Races | 368 | 6.0% |
| Some other Race | 99 | 1.6% |
| Total | 6,147 | 100.0% |
Ancestry in East End
The most populous ancestries reported in East End are English (942 | 15.3%), German (814 | 13.2%), American (758 | 12.3%), Irish (703 | 11.4%), and Mexican (331 | 5.4%), together accounting for 57.7% of all East End residents.
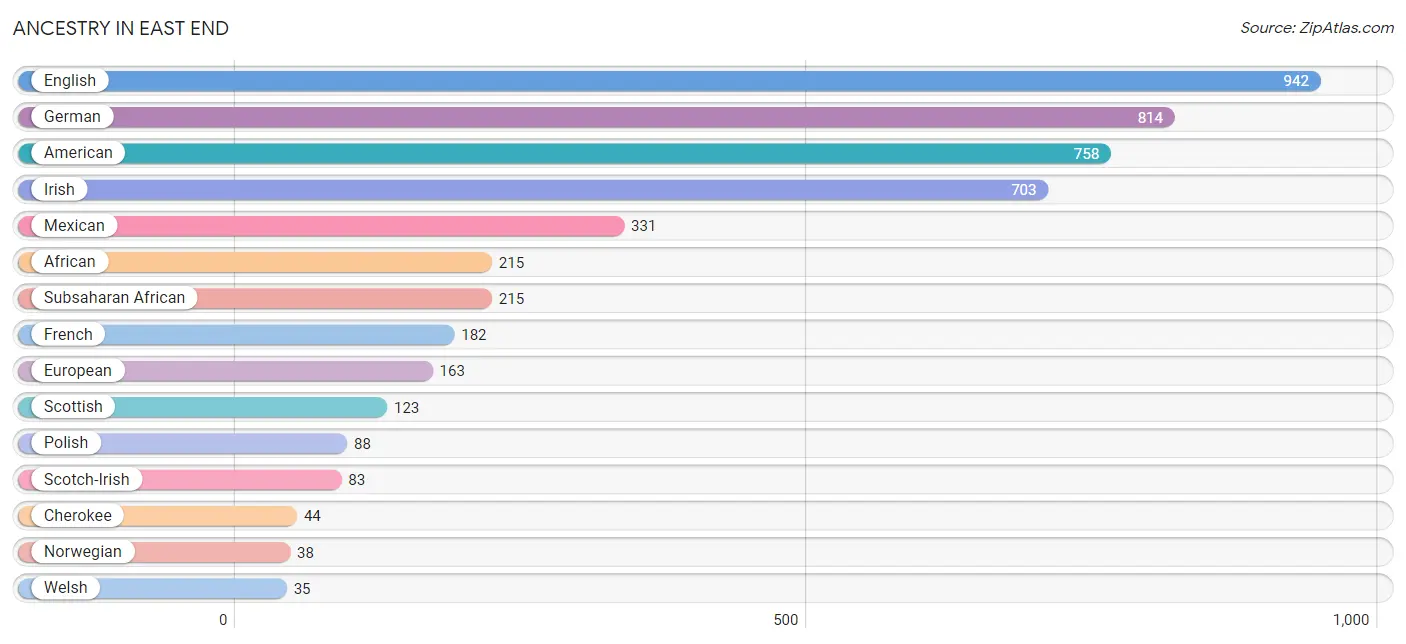
| Ancestry | # Population | % Population |
| African | 215 | 3.5% |
| American | 758 | 12.3% |
| Arab | 6 | 0.1% |
| British | 8 | 0.1% |
| Canadian | 13 | 0.2% |
| Cherokee | 44 | 0.7% |
| English | 942 | 15.3% |
| European | 163 | 2.6% |
| French | 182 | 3.0% |
| French American Indian | 22 | 0.4% |
| German | 814 | 13.2% |
| Irish | 703 | 11.4% |
| Korean | 11 | 0.2% |
| Lebanese | 6 | 0.1% |
| Malaysian | 16 | 0.3% |
| Mexican | 331 | 5.4% |
| Norwegian | 38 | 0.6% |
| Polish | 88 | 1.4% |
| Scandinavian | 25 | 0.4% |
| Scotch-Irish | 83 | 1.3% |
| Scottish | 123 | 2.0% |
| Spaniard | 10 | 0.2% |
| Subsaharan African | 215 | 3.5% |
| Swedish | 25 | 0.4% |
| Ukrainian | 17 | 0.3% |
| Welsh | 35 | 0.6% | View All 26 Rows |
Immigrants in East End
The most numerous immigrant groups reported in East End came from Central America (188 | 3.1%), Latin America (188 | 3.1%), Mexico (188 | 3.1%), Asia (27 | 0.4%), and South Eastern Asia (27 | 0.4%), together accounting for 10.1% of all East End residents.
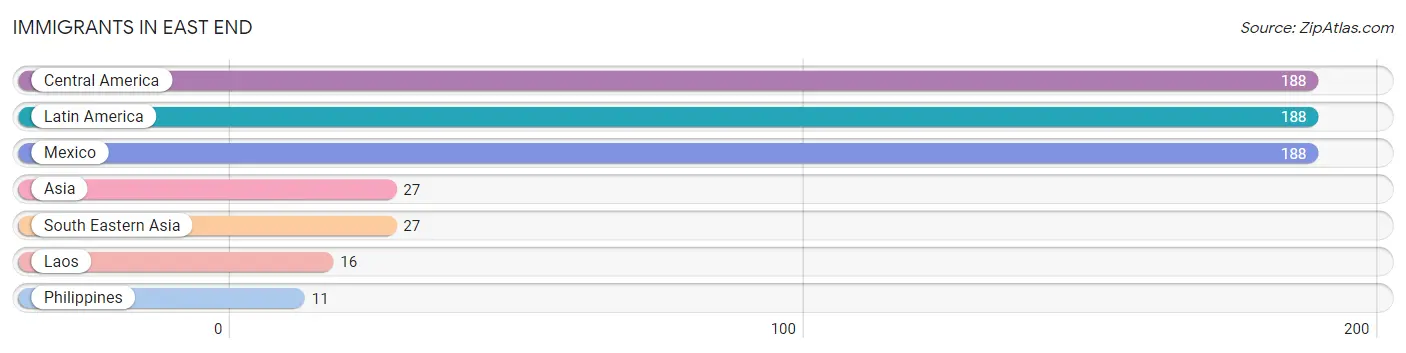
| Immigration Origin | # Population | % Population |
| Asia | 27 | 0.4% |
| Central America | 188 | 3.1% |
| Laos | 16 | 0.3% |
| Latin America | 188 | 3.1% |
| Mexico | 188 | 3.1% |
| Philippines | 11 | 0.2% |
| South Eastern Asia | 27 | 0.4% | View All 7 Rows |
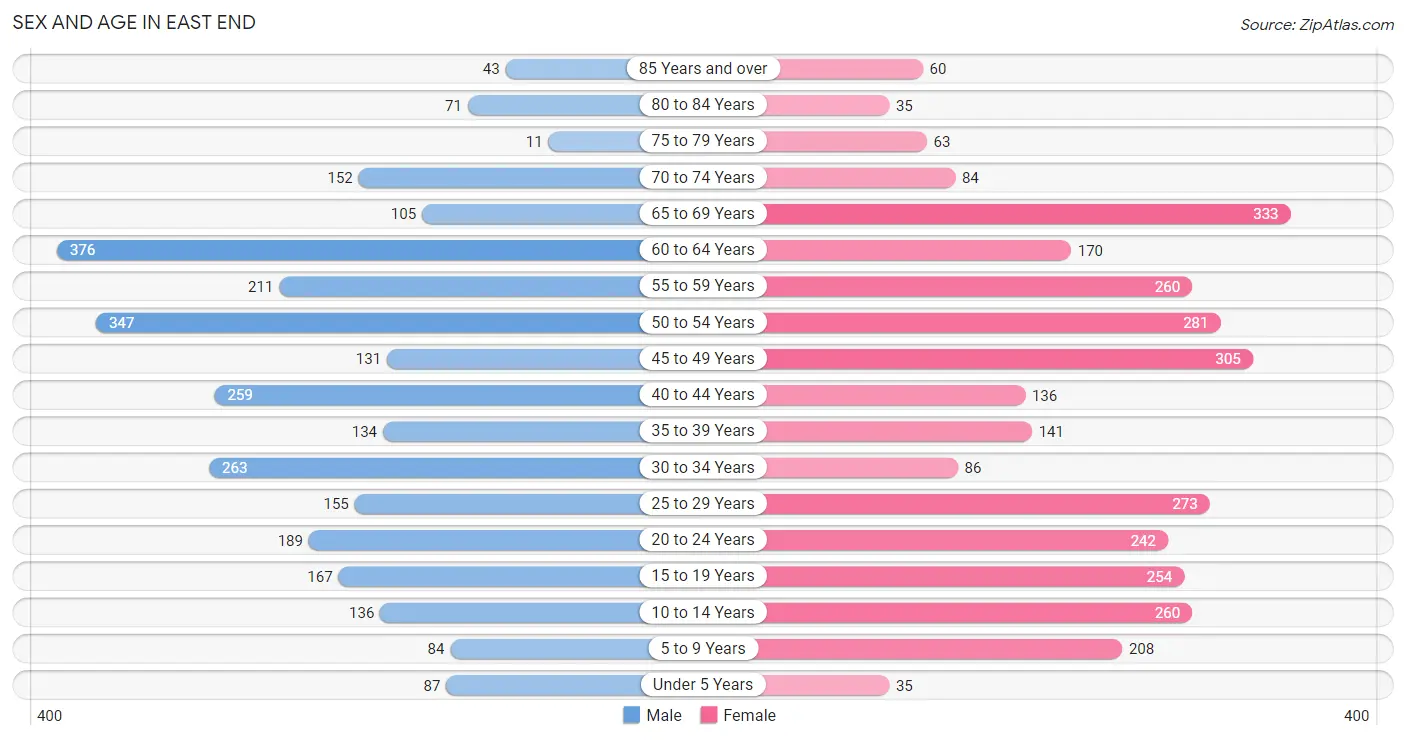
Sex and Age in East End
Sex and Age in East End
The most populous age groups in East End are 60 to 64 Years (376 | 12.9%) for men and 65 to 69 Years (333 | 10.3%) for women.
| Age Bracket | Male | Female |
| Under 5 Years | 87 (3.0%) | 35 (1.1%) |
| 5 to 9 Years | 84 (2.9%) | 208 (6.5%) |
| 10 to 14 Years | 136 (4.7%) | 260 (8.1%) |
| 15 to 19 Years | 167 (5.7%) | 254 (7.9%) |
| 20 to 24 Years | 189 (6.5%) | 242 (7.5%) |
| 25 to 29 Years | 155 (5.3%) | 273 (8.5%) |
| 30 to 34 Years | 263 (9.0%) | 86 (2.7%) |
| 35 to 39 Years | 134 (4.6%) | 141 (4.4%) |
| 40 to 44 Years | 259 (8.9%) | 136 (4.2%) |
| 45 to 49 Years | 131 (4.5%) | 305 (9.5%) |
| 50 to 54 Years | 347 (11.9%) | 281 (8.7%) |
| 55 to 59 Years | 211 (7.2%) | 260 (8.1%) |
| 60 to 64 Years | 376 (12.9%) | 170 (5.3%) |
| 65 to 69 Years | 105 (3.6%) | 333 (10.3%) |
| 70 to 74 Years | 152 (5.2%) | 84 (2.6%) |
| 75 to 79 Years | 11 (0.4%) | 63 (1.9%) |
| 80 to 84 Years | 71 (2.4%) | 35 (1.1%) |
| 85 Years and over | 43 (1.5%) | 60 (1.9%) |
| Total | 2,921 (100.0%) | 3,226 (100.0%) |
Families and Households in East End
Median Family Size in East End
The median family size in East End is 2.95 persons per family, with single female/mother families (368 | 20.0%) accounting for the largest median family size of 3.26 persons per family. On the other hand, married-couple families (1,244 | 67.6%) represent the smallest median family size with 2.86 persons per family.
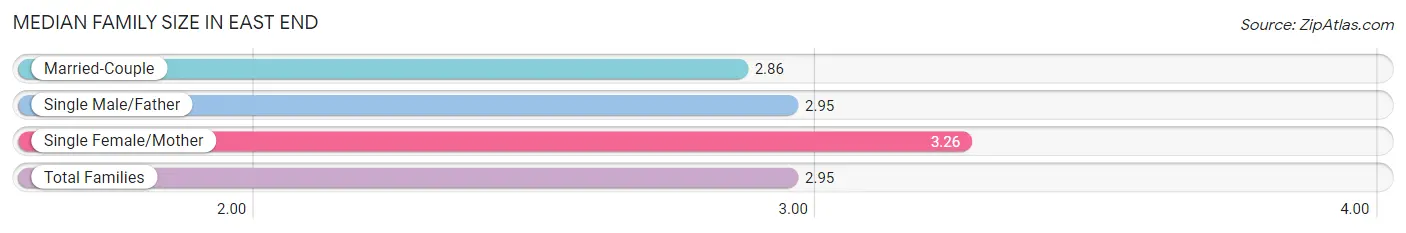
| Family Type | # Families | Family Size |
| Married-Couple | 1,244 (67.6%) | 2.86 |
| Single Male/Father | 227 (12.3%) | 2.95 |
| Single Female/Mother | 368 (20.0%) | 3.26 |
| Total Families | 1,839 (100.0%) | 2.95 |
Median Household Size in East End
The median household size in East End is 2.70 persons per household, with single female/mother households (368 | 16.2%) accounting for the largest median household size of 3.54 persons per household. non-family households (440 | 19.3%) represent the smallest median household size with 1.12 persons per household.
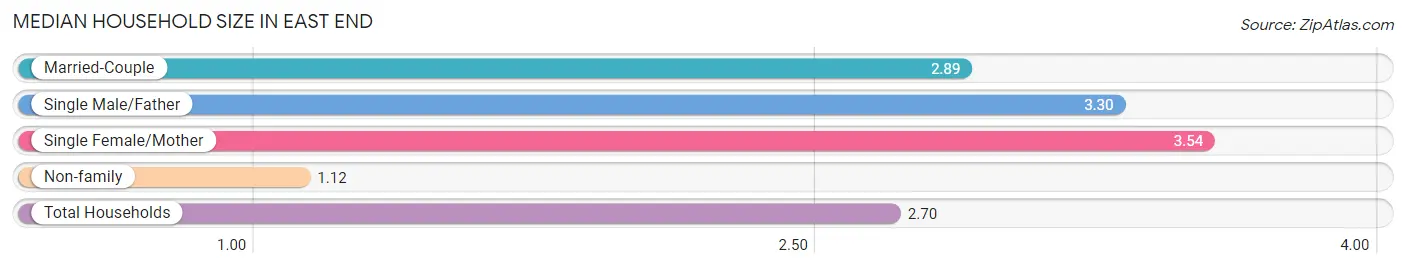
| Household Type | # Households | Household Size |
| Married-Couple | 1,244 (54.6%) | 2.89 |
| Single Male/Father | 227 (10.0%) | 3.30 |
| Single Female/Mother | 368 (16.2%) | 3.54 |
| Non-family | 440 (19.3%) | 1.12 |
| Total Households | 2,279 (100.0%) | 2.70 |
Household Size by Marriage Status in East End
Out of a total of 2,279 households in East End, 1,839 (80.7%) are family households, while 440 (19.3%) are nonfamily households. The most numerous type of family households are 2-person households, comprising 881, and the most common type of nonfamily households are 1-person households, comprising 398.
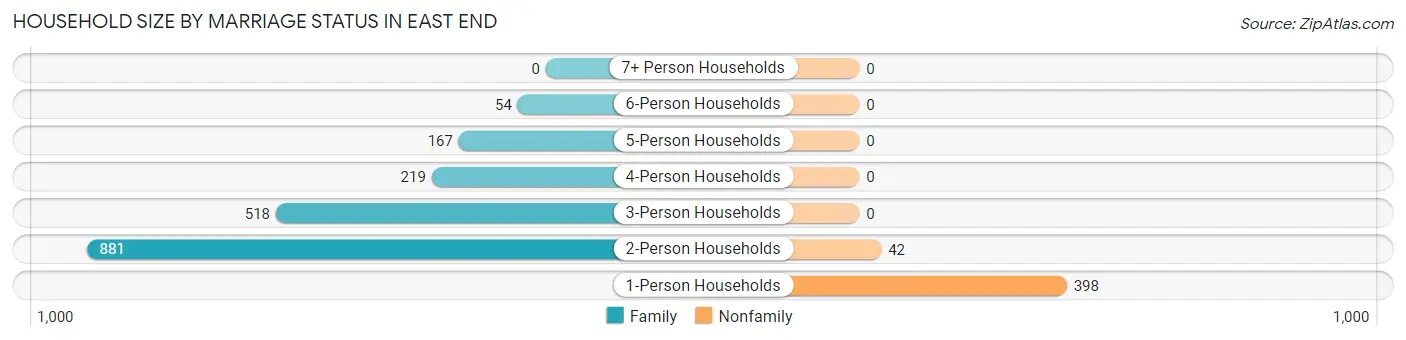
| Household Size | Family Households | Nonfamily Households |
| 1-Person Households | - | 398 (17.5%) |
| 2-Person Households | 881 (38.7%) | 42 (1.8%) |
| 3-Person Households | 518 (22.7%) | 0 (0.0%) |
| 4-Person Households | 219 (9.6%) | 0 (0.0%) |
| 5-Person Households | 167 (7.3%) | 0 (0.0%) |
| 6-Person Households | 54 (2.4%) | 0 (0.0%) |
| 7+ Person Households | 0 (0.0%) | 0 (0.0%) |
| Total | 1,839 (80.7%) | 440 (19.3%) |
Female Fertility in East End
Fertility by Age in East End
Average fertility rate in East End is 36.0 births per 1,000 women. Women in the age bracket of 20 to 34 years have the highest fertility rate with 92.0 births per 1,000 women. Women in the age bracket of 20 to 34 years acount for 100.0% of all women with births.
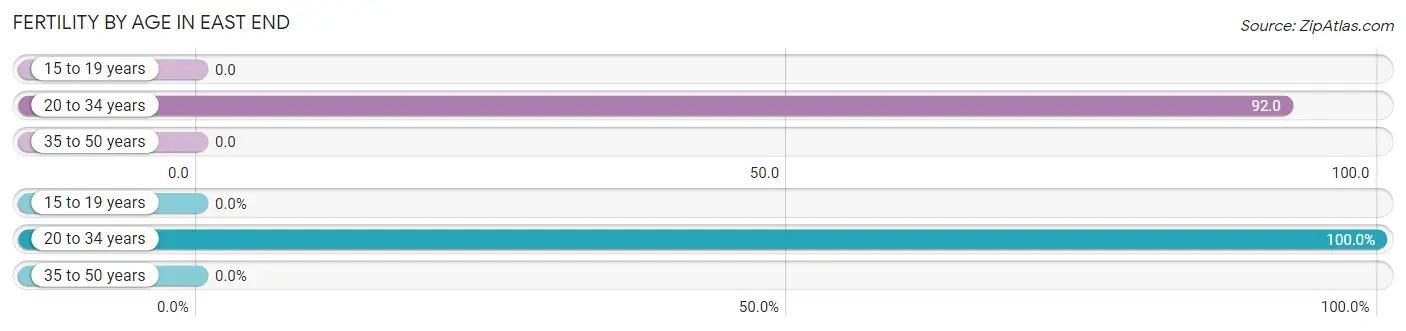
| Age Bracket | Women with Births | Births / 1,000 Women |
| 15 to 19 years | 0 (0.0%) | 0.0 |
| 20 to 34 years | 55 (100.0%) | 92.0 |
| 35 to 50 years | 0 (0.0%) | 0.0 |
| Total | 55 (100.0%) | 36.0 |
Fertility by Age by Marriage Status in East End
40.0% of women with births (55) in East End are married. The highest percentage of unmarried women with births falls into 20 to 34 years age bracket with 60.0% of them unmarried at the time of birth, while the lowest percentage of unmarried women with births belong to 20 to 34 years age bracket with 60.0% of them unmarried.
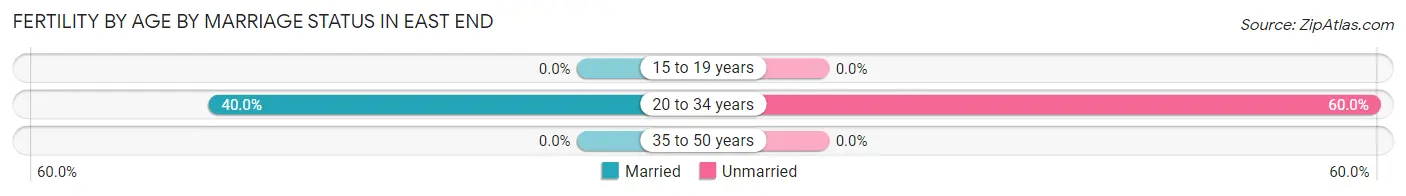
| Age Bracket | Married | Unmarried |
| 15 to 19 years | 0 (0.0%) | 0 (0.0%) |
| 20 to 34 years | 22 (40.0%) | 33 (60.0%) |
| 35 to 50 years | 0 (0.0%) | 0 (0.0%) |
| Total | 22 (40.0%) | 33 (60.0%) |
Fertility by Education in East End
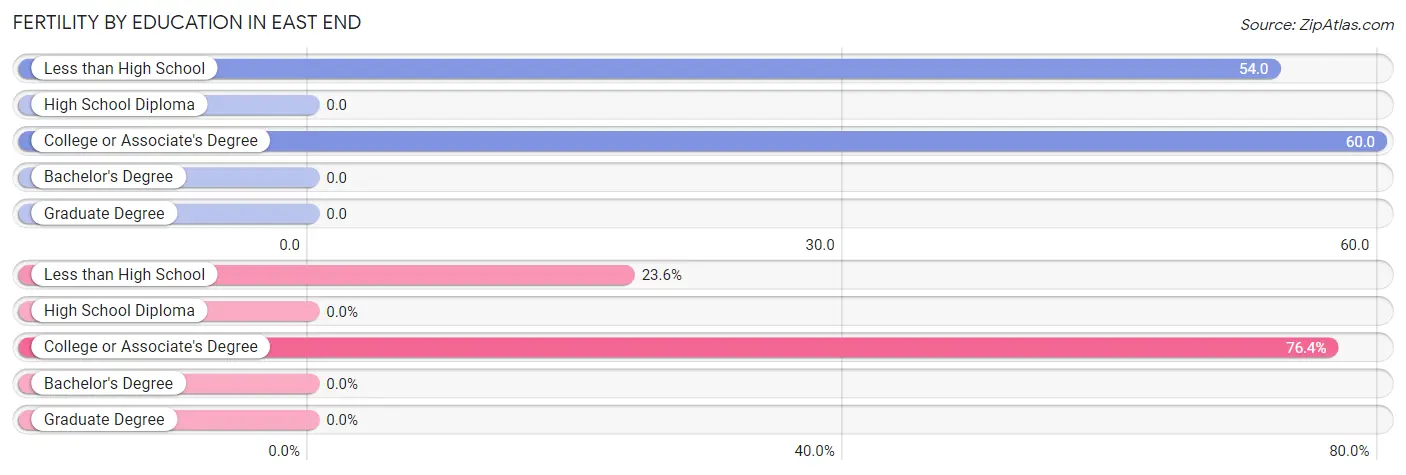
| Educational Attainment | Women with Births | Births / 1,000 Women |
| Less than High School | 13 (23.6%) | 54.0 |
| High School Diploma | 0 (0.0%) | 0.0 |
| College or Associate's Degree | 42 (76.4%) | 60.0 |
| Bachelor's Degree | 0 (0.0%) | 0.0 |
| Graduate Degree | 0 (0.0%) | 0.0 |
| Total | 55 (100.0%) | 36.0 |
Fertility by Education by Marriage Status in East End
60.0% of women with births in East End are unmarried. Women with the educational attainment of less than high school are most likely to be married with 100.0% of them married at childbirth, while women with the educational attainment of college or associate's degree are least likely to be married with 78.6% of them unmarried at childbirth.
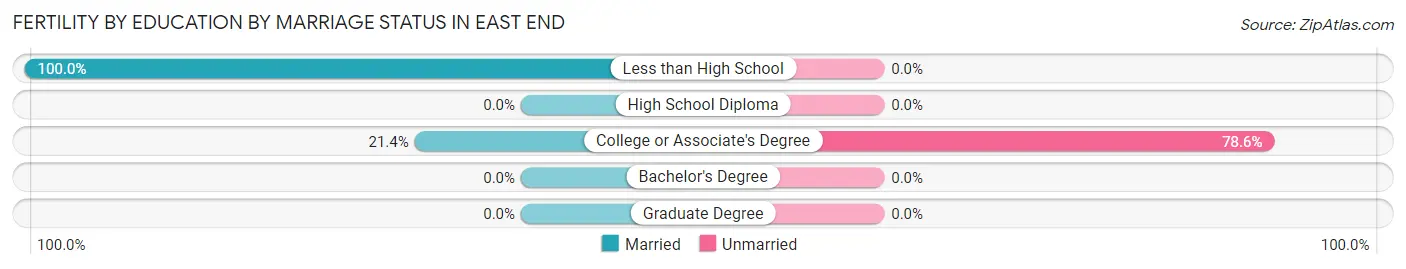
| Educational Attainment | Married | Unmarried |
| Less than High School | 13 (100.0%) | 0 (0.0%) |
| High School Diploma | 0 (0.0%) | 0 (0.0%) |
| College or Associate's Degree | 9 (21.4%) | 33 (78.6%) |
| Bachelor's Degree | 0 (0.0%) | 0 (0.0%) |
| Graduate Degree | 0 (0.0%) | 0 (0.0%) |
| Total | 22 (40.0%) | 33 (60.0%) |
Employment Characteristics in East End
Employment by Class of Employer in East End
Among the 3,138 employed individuals in East End, private company employees (2,137 | 68.1%), local government employees (298 | 9.5%), and state government employees (292 | 9.3%) make up the most common classes of employment.
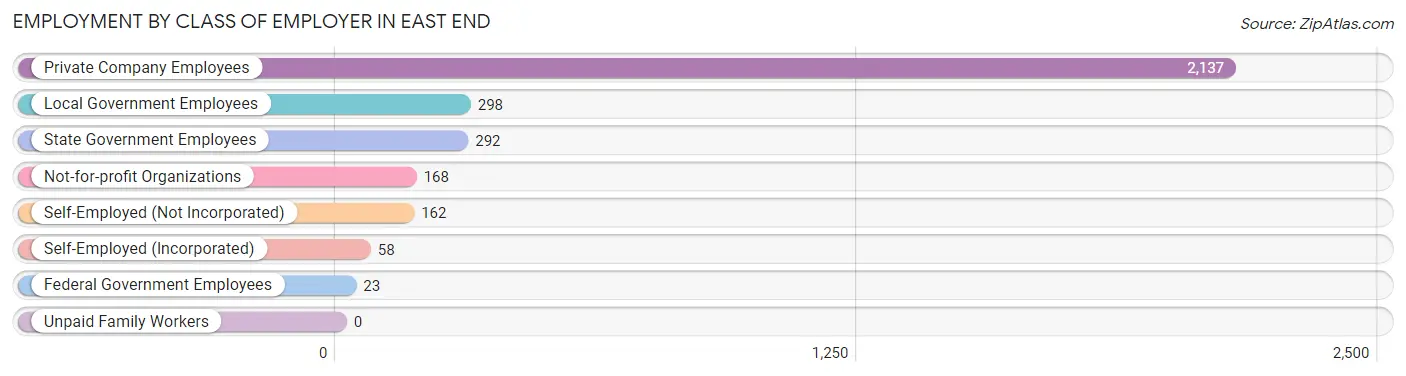
| Employer Class | # Employees | % Employees |
| Private Company Employees | 2,137 | 68.1% |
| Self-Employed (Incorporated) | 58 | 1.8% |
| Self-Employed (Not Incorporated) | 162 | 5.2% |
| Not-for-profit Organizations | 168 | 5.3% |
| Local Government Employees | 298 | 9.5% |
| State Government Employees | 292 | 9.3% |
| Federal Government Employees | 23 | 0.7% |
| Unpaid Family Workers | 0 | 0.0% |
| Total | 3,138 | 100.0% |
Employment Status by Age in East End
According to the labor force statistics for East End, out of the total population over 16 years of age (5,241), 63.3% or 3,318 individuals are in the labor force, with 4.7% or 156 of them unemployed. The age group with the highest labor force participation rate is 25 to 29 years, with 88.1% or 377 individuals in the labor force. Within the labor force, the 16 to 19 years age range has the highest percentage of unemployed individuals, with 34.6% or 53 of them being unemployed.
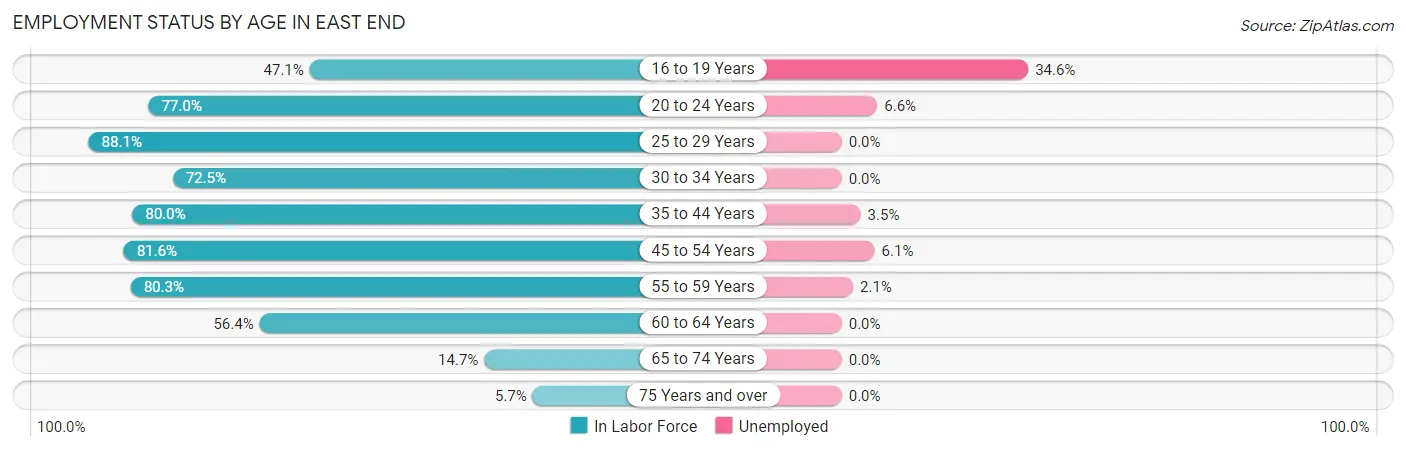
| Age Bracket | In Labor Force | Unemployed |
| 16 to 19 Years | 153 (47.1%) | 53 (34.6%) |
| 20 to 24 Years | 332 (77.0%) | 22 (6.6%) |
| 25 to 29 Years | 377 (88.1%) | 0 (0.0%) |
| 30 to 34 Years | 253 (72.5%) | 0 (0.0%) |
| 35 to 44 Years | 536 (80.0%) | 19 (3.5%) |
| 45 to 54 Years | 868 (81.6%) | 53 (6.1%) |
| 55 to 59 Years | 378 (80.3%) | 8 (2.1%) |
| 60 to 64 Years | 308 (56.4%) | 0 (0.0%) |
| 65 to 74 Years | 99 (14.7%) | 0 (0.0%) |
| 75 Years and over | 16 (5.7%) | 0 (0.0%) |
| Total | 3,318 (63.3%) | 156 (4.7%) |
Employment Status by Educational Attainment in East End
According to labor force statistics for East End, 77.1% of individuals (2,720) out of the total population between 25 and 64 years of age (3,528) are in the labor force, with 2.9% or 79 of them being unemployed. The group with the highest labor force participation rate are those with the educational attainment of bachelor's degree or higher, with 92.5% or 715 individuals in the labor force. Within the labor force, individuals with high school diploma education have the highest percentage of unemployment, with 9.0% or 72 of them being unemployed.
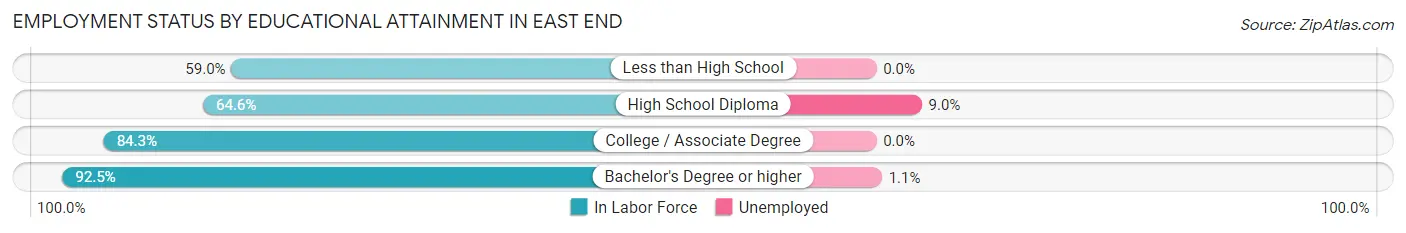
| Educational Attainment | In Labor Force | Unemployed |
| Less than High School | 174 (59.0%) | 0 (0.0%) |
| High School Diploma | 798 (64.6%) | 111 (9.0%) |
| College / Associate Degree | 1,032 (84.3%) | 0 (0.0%) |
| Bachelor's Degree or higher | 715 (92.5%) | 9 (1.1%) |
| Total | 2,720 (77.1%) | 102 (2.9%) |
Employment Occupations by Sex in East End
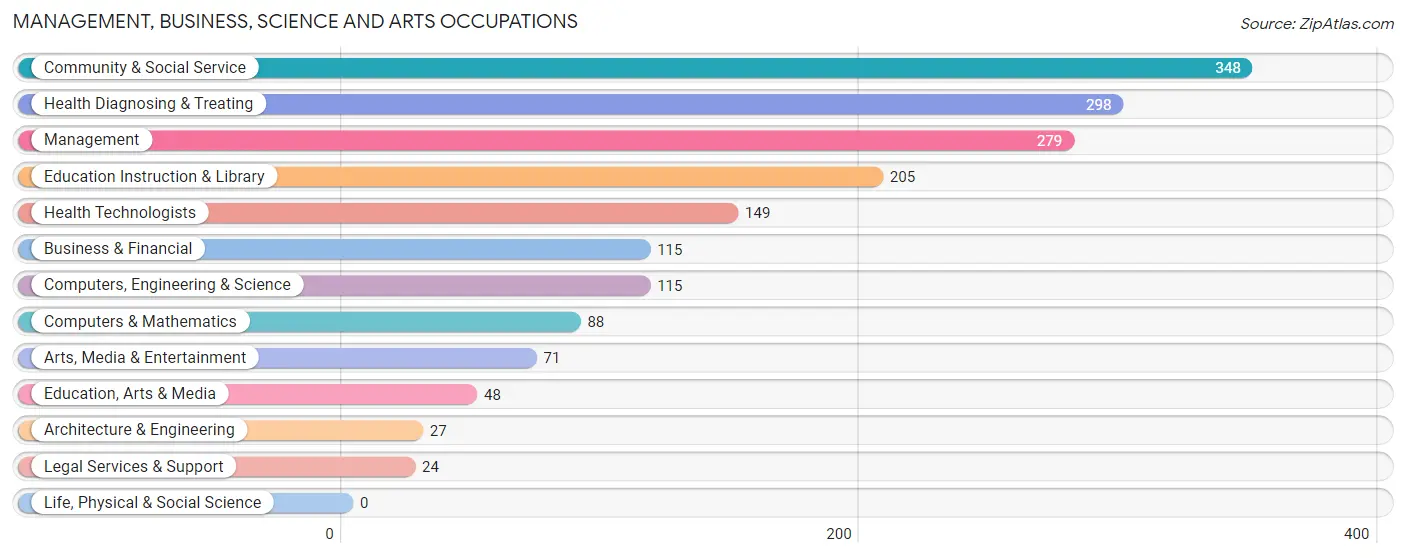
Management, Business, Science and Arts Occupations
The most common Management, Business, Science and Arts occupations in East End are Community & Social Service (348 | 11.0%), Health Diagnosing & Treating (298 | 9.4%), Management (279 | 8.8%), Education Instruction & Library (205 | 6.5%), and Health Technologists (149 | 4.7%).
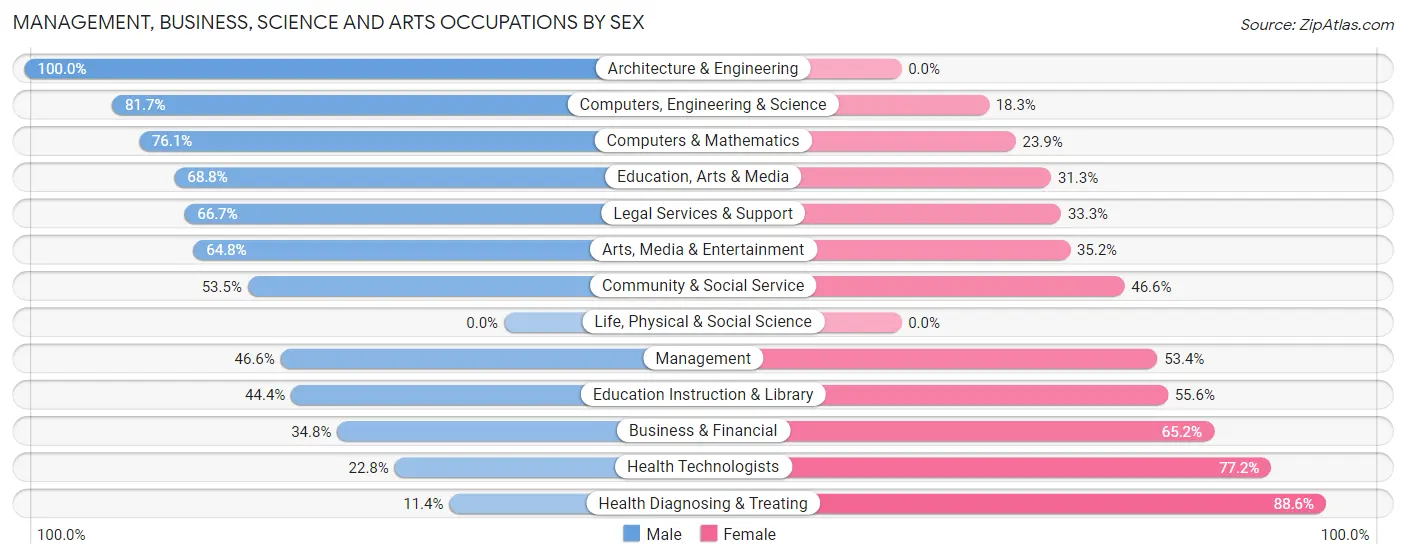
Management, Business, Science and Arts Occupations by Sex
Within the Management, Business, Science and Arts occupations in East End, the most male-oriented occupations are Architecture & Engineering (100.0%), Computers, Engineering & Science (81.7%), and Computers & Mathematics (76.1%), while the most female-oriented occupations are Health Diagnosing & Treating (88.6%), Health Technologists (77.2%), and Business & Financial (65.2%).
| Occupation | Male | Female |
| Management | 130 (46.6%) | 149 (53.4%) |
| Business & Financial | 40 (34.8%) | 75 (65.2%) |
| Computers, Engineering & Science | 94 (81.7%) | 21 (18.3%) |
| Computers & Mathematics | 67 (76.1%) | 21 (23.9%) |
| Architecture & Engineering | 27 (100.0%) | 0 (0.0%) |
| Life, Physical & Social Science | 0 (0.0%) | 0 (0.0%) |
| Community & Social Service | 186 (53.4%) | 162 (46.6%) |
| Education, Arts & Media | 33 (68.8%) | 15 (31.2%) |
| Legal Services & Support | 16 (66.7%) | 8 (33.3%) |
| Education Instruction & Library | 91 (44.4%) | 114 (55.6%) |
| Arts, Media & Entertainment | 46 (64.8%) | 25 (35.2%) |
| Health Diagnosing & Treating | 34 (11.4%) | 264 (88.6%) |
| Health Technologists | 34 (22.8%) | 115 (77.2%) |
| Total (Category) | 484 (41.9%) | 671 (58.1%) |
| Total (Overall) | 1,578 (49.9%) | 1,587 (50.1%) |
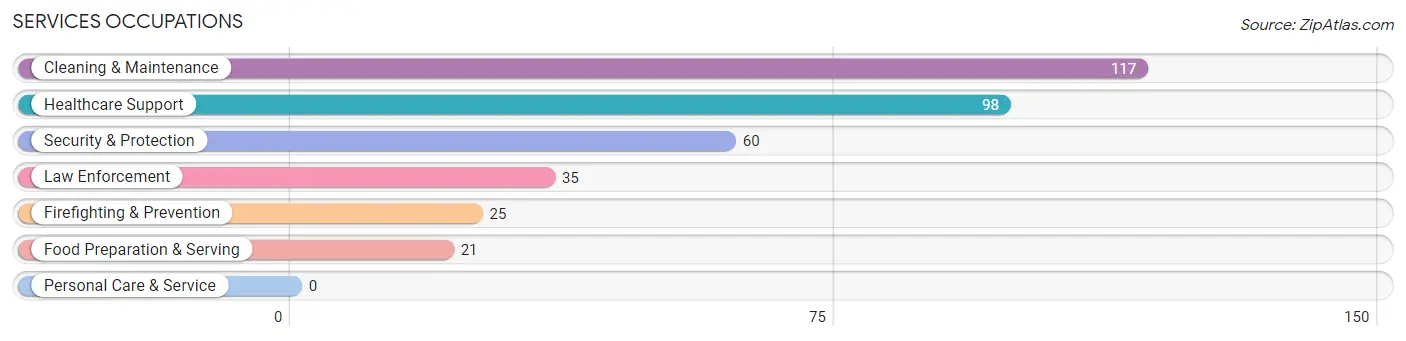
Services Occupations
The most common Services occupations in East End are Cleaning & Maintenance (117 | 3.7%), Healthcare Support (98 | 3.1%), Security & Protection (60 | 1.9%), Law Enforcement (35 | 1.1%), and Firefighting & Prevention (25 | 0.8%).
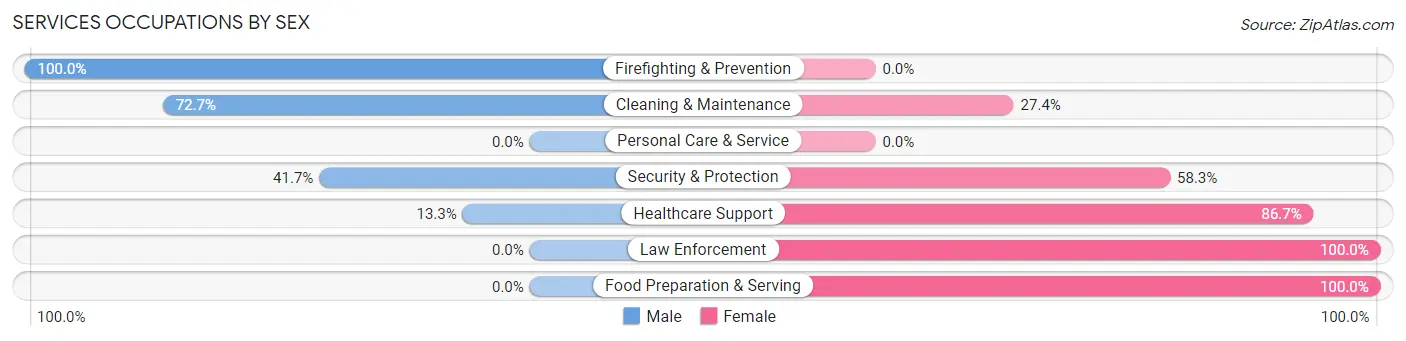
Services Occupations by Sex
Within the Services occupations in East End, the most male-oriented occupations are Firefighting & Prevention (100.0%), Cleaning & Maintenance (72.7%), and Security & Protection (41.7%), while the most female-oriented occupations are Law Enforcement (100.0%), Food Preparation & Serving (100.0%), and Healthcare Support (86.7%).
| Occupation | Male | Female |
| Healthcare Support | 13 (13.3%) | 85 (86.7%) |
| Security & Protection | 25 (41.7%) | 35 (58.3%) |
| Firefighting & Prevention | 25 (100.0%) | 0 (0.0%) |
| Law Enforcement | 0 (0.0%) | 35 (100.0%) |
| Food Preparation & Serving | 0 (0.0%) | 21 (100.0%) |
| Cleaning & Maintenance | 85 (72.7%) | 32 (27.4%) |
| Personal Care & Service | 0 (0.0%) | 0 (0.0%) |
| Total (Category) | 123 (41.5%) | 173 (58.5%) |
| Total (Overall) | 1,578 (49.9%) | 1,587 (50.1%) |
Sales and Office Occupations
The most common Sales and Office occupations in East End are Office & Administration (471 | 14.9%), and Sales & Related (308 | 9.7%).
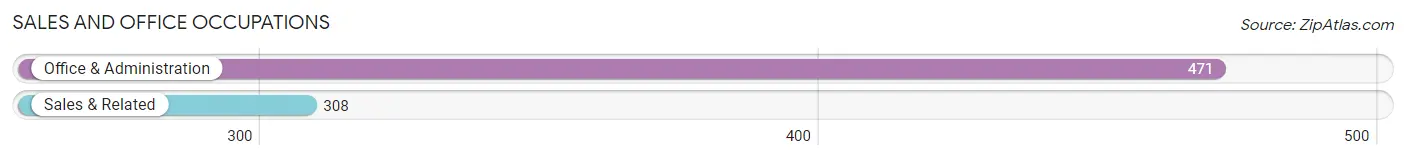
Sales and Office Occupations by Sex
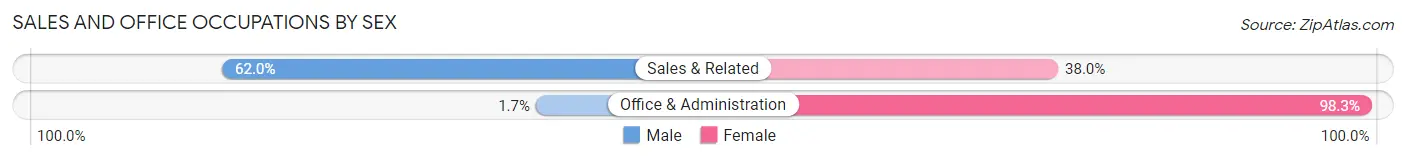
| Occupation | Male | Female |
| Sales & Related | 191 (62.0%) | 117 (38.0%) |
| Office & Administration | 8 (1.7%) | 463 (98.3%) |
| Total (Category) | 199 (25.6%) | 580 (74.5%) |
| Total (Overall) | 1,578 (49.9%) | 1,587 (50.1%) |
Natural Resources, Construction and Maintenance Occupations
The most common Natural Resources, Construction and Maintenance occupations in East End are Construction & Extraction (218 | 6.9%), Installation, Maintenance & Repair (135 | 4.3%), and Farming, Fishing & Forestry (26 | 0.8%).
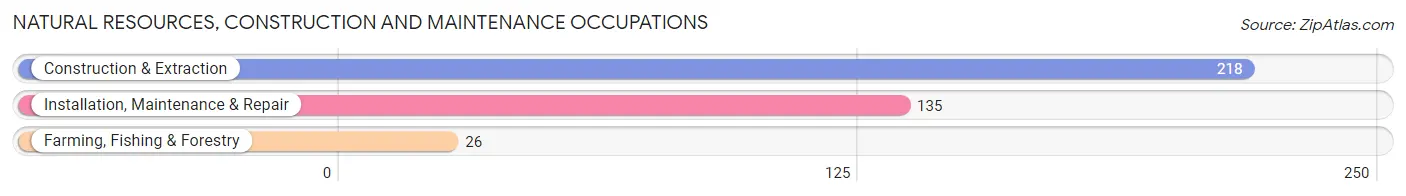
Natural Resources, Construction and Maintenance Occupations by Sex
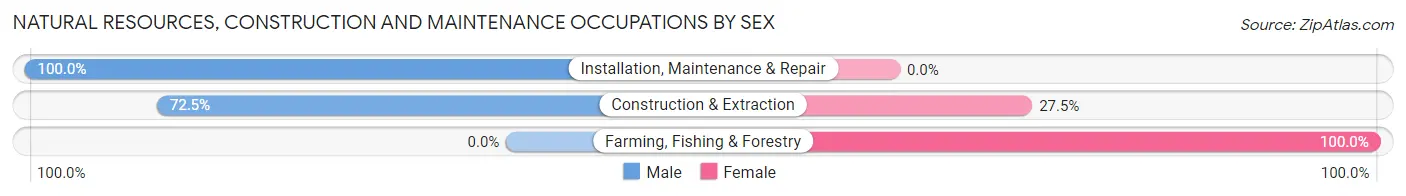
| Occupation | Male | Female |
| Farming, Fishing & Forestry | 0 (0.0%) | 26 (100.0%) |
| Construction & Extraction | 158 (72.5%) | 60 (27.5%) |
| Installation, Maintenance & Repair | 135 (100.0%) | 0 (0.0%) |
| Total (Category) | 293 (77.3%) | 86 (22.7%) |
| Total (Overall) | 1,578 (49.9%) | 1,587 (50.1%) |
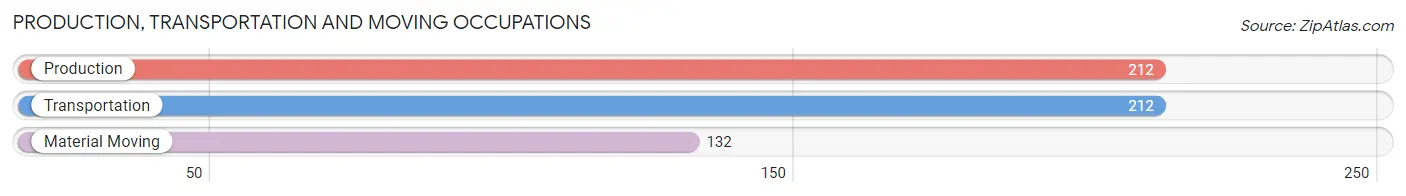
Production, Transportation and Moving Occupations
The most common Production, Transportation and Moving occupations in East End are Production (212 | 6.7%), Transportation (212 | 6.7%), and Material Moving (132 | 4.2%).
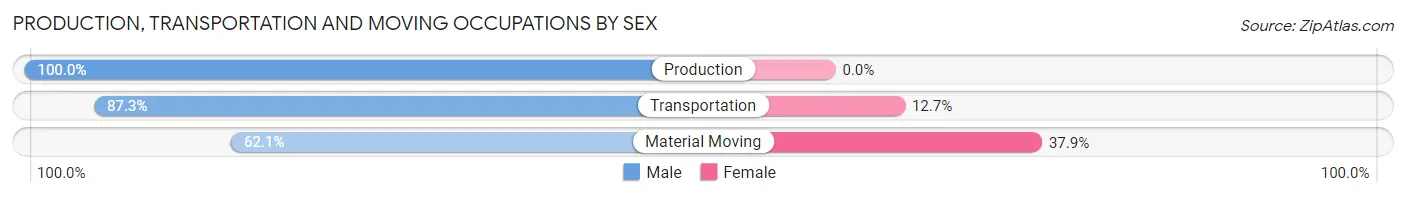
Production, Transportation and Moving Occupations by Sex
| Occupation | Male | Female |
| Production | 212 (100.0%) | 0 (0.0%) |
| Transportation | 185 (87.3%) | 27 (12.7%) |
| Material Moving | 82 (62.1%) | 50 (37.9%) |
| Total (Category) | 479 (86.2%) | 77 (13.9%) |
| Total (Overall) | 1,578 (49.9%) | 1,587 (50.1%) |
Employment Industries by Sex in East End
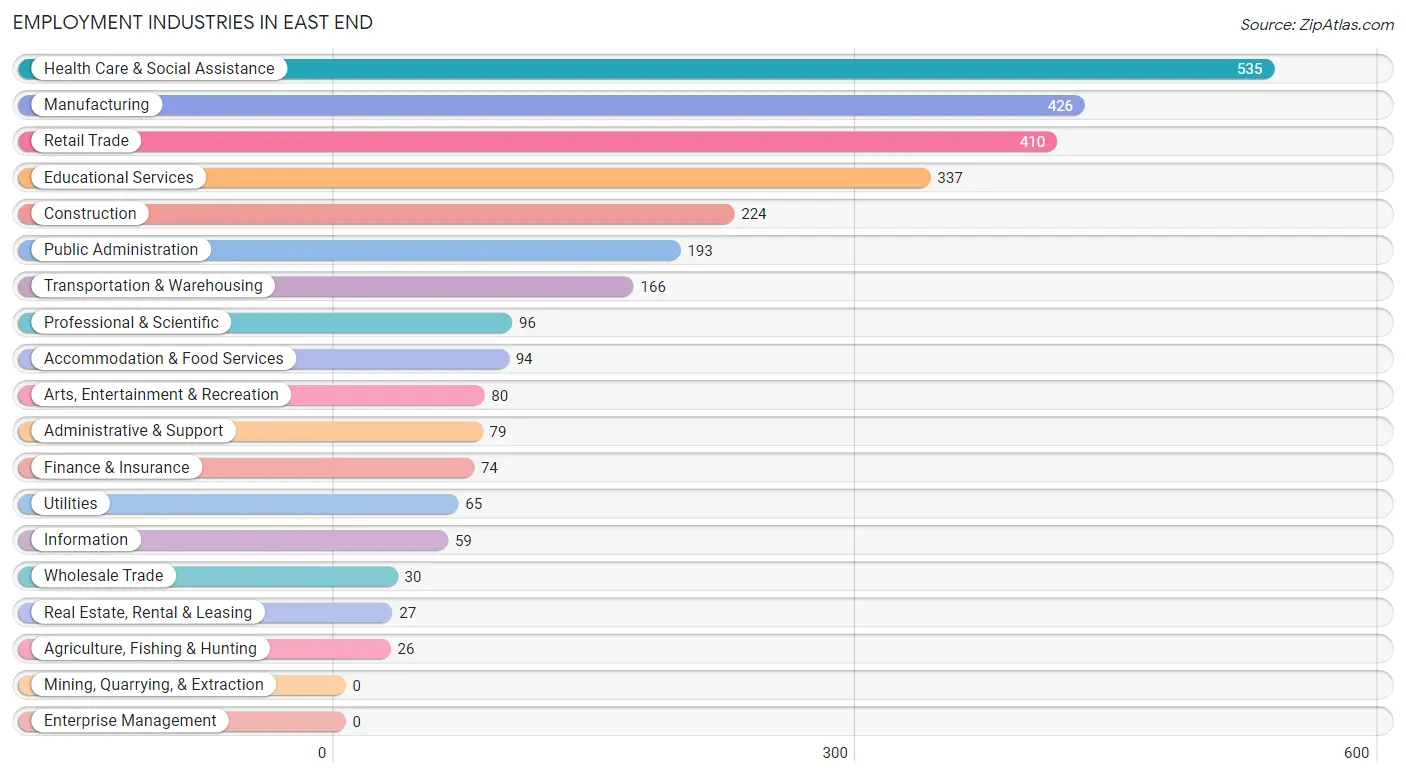
Employment Industries in East End
The major employment industries in East End include Health Care & Social Assistance (535 | 16.9%), Manufacturing (426 | 13.5%), Retail Trade (410 | 13.0%), Educational Services (337 | 10.6%), and Construction (224 | 7.1%).
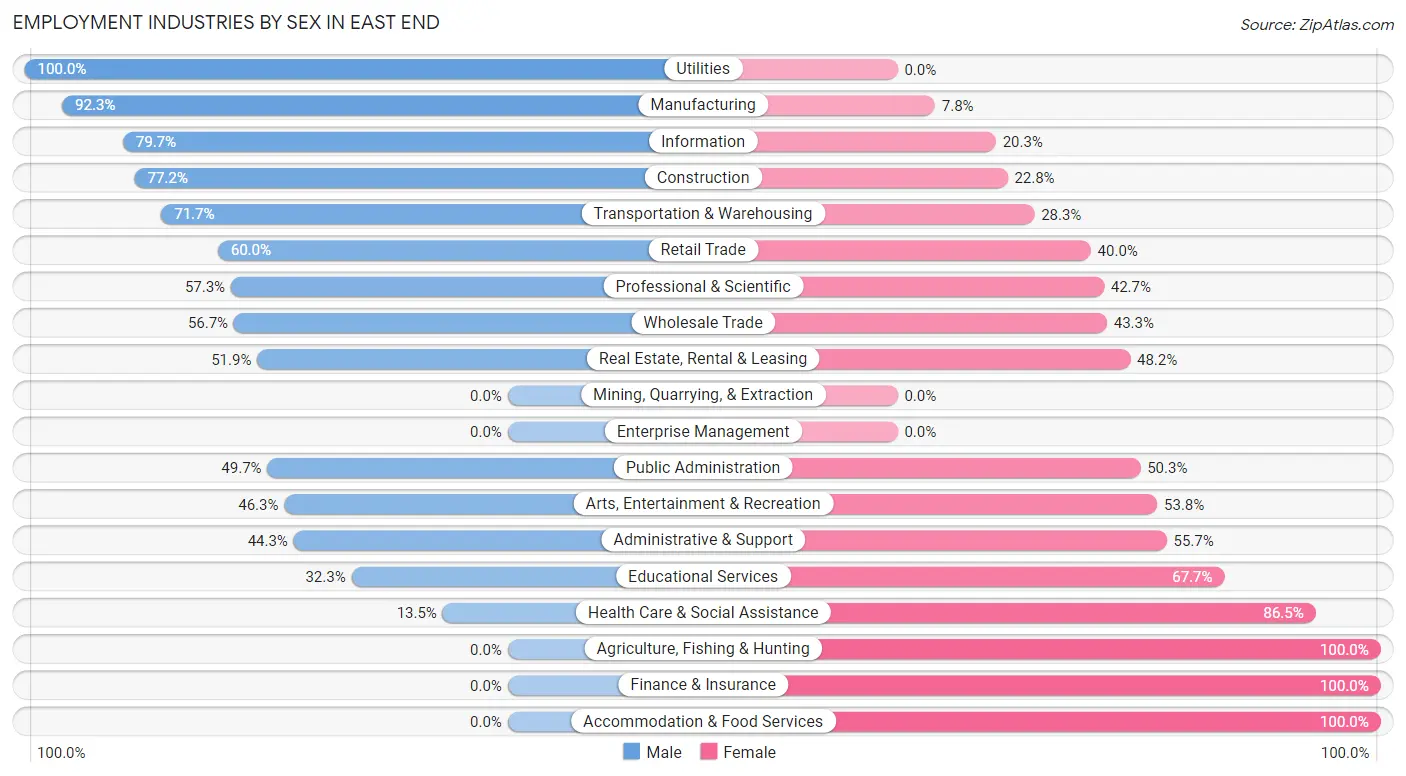
Employment Industries by Sex in East End
The East End industries that see more men than women are Utilities (100.0%), Manufacturing (92.2%), and Information (79.7%), whereas the industries that tend to have a higher number of women are Agriculture, Fishing & Hunting (100.0%), Finance & Insurance (100.0%), and Accommodation & Food Services (100.0%).
| Industry | Male | Female |
| Agriculture, Fishing & Hunting | 0 (0.0%) | 26 (100.0%) |
| Mining, Quarrying, & Extraction | 0 (0.0%) | 0 (0.0%) |
| Construction | 173 (77.2%) | 51 (22.8%) |
| Manufacturing | 393 (92.2%) | 33 (7.7%) |
| Wholesale Trade | 17 (56.7%) | 13 (43.3%) |
| Retail Trade | 246 (60.0%) | 164 (40.0%) |
| Transportation & Warehousing | 119 (71.7%) | 47 (28.3%) |
| Utilities | 65 (100.0%) | 0 (0.0%) |
| Information | 47 (79.7%) | 12 (20.3%) |
| Finance & Insurance | 0 (0.0%) | 74 (100.0%) |
| Real Estate, Rental & Leasing | 14 (51.8%) | 13 (48.1%) |
| Professional & Scientific | 55 (57.3%) | 41 (42.7%) |
| Enterprise Management | 0 (0.0%) | 0 (0.0%) |
| Administrative & Support | 35 (44.3%) | 44 (55.7%) |
| Educational Services | 109 (32.3%) | 228 (67.7%) |
| Health Care & Social Assistance | 72 (13.5%) | 463 (86.5%) |
| Arts, Entertainment & Recreation | 37 (46.3%) | 43 (53.7%) |
| Accommodation & Food Services | 0 (0.0%) | 94 (100.0%) |
| Public Administration | 96 (49.7%) | 97 (50.3%) |
| Total | 1,578 (49.9%) | 1,587 (50.1%) |
Education in East End
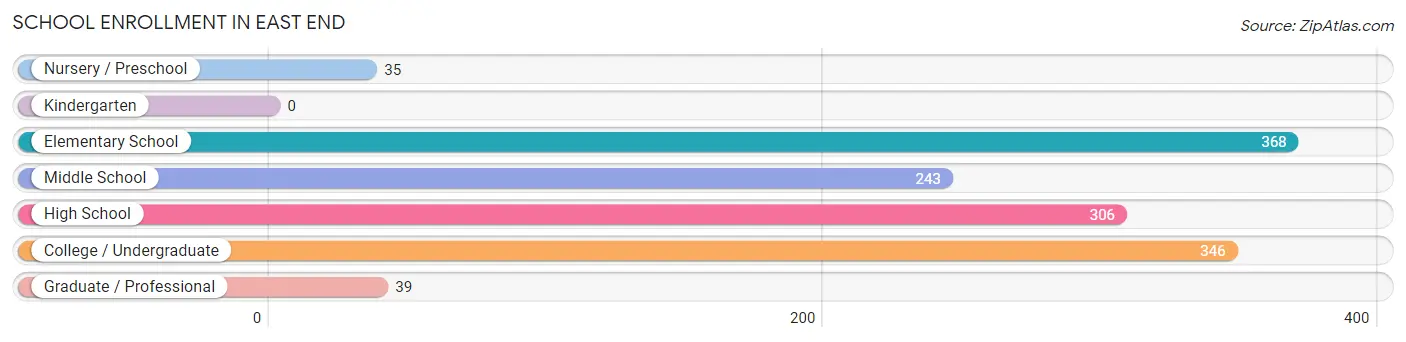
School Enrollment in East End
The most common levels of schooling among the 1,337 students in East End are elementary school (368 | 27.5%), college / undergraduate (346 | 25.9%), and high school (306 | 22.9%).
| School Level | # Students | % Students |
| Nursery / Preschool | 35 | 2.6% |
| Kindergarten | 0 | 0.0% |
| Elementary School | 368 | 27.5% |
| Middle School | 243 | 18.2% |
| High School | 306 | 22.9% |
| College / Undergraduate | 346 | 25.9% |
| Graduate / Professional | 39 | 2.9% |
| Total | 1,337 | 100.0% |
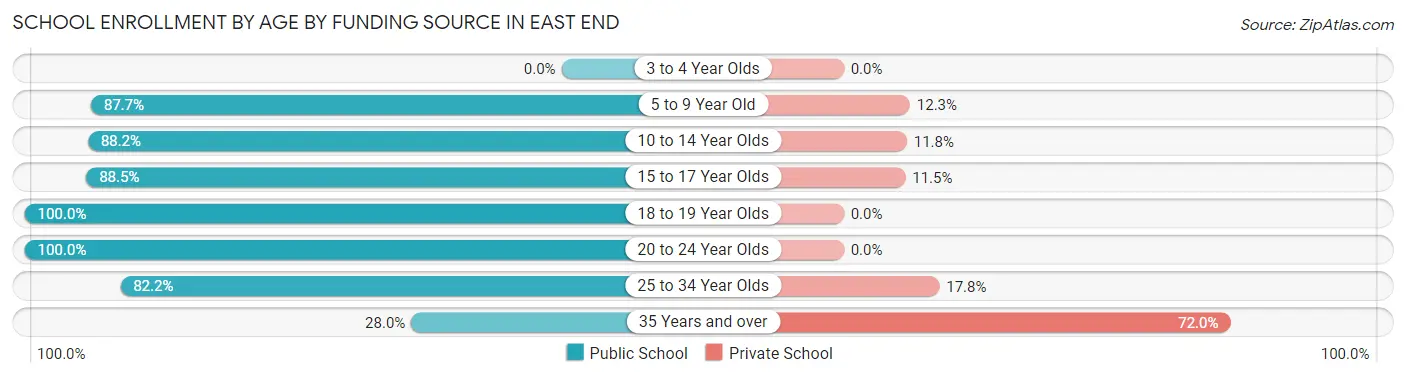
School Enrollment by Age by Funding Source in East End
Out of a total of 1,337 students who are enrolled in schools in East End, 152 (11.4%) attend a private institution, while the remaining 1,185 (88.6%) are enrolled in public schools. The age group of 35 years and over has the highest likelihood of being enrolled in private schools, with 18 (72.0% in the age bracket) enrolled. Conversely, the age group of 18 to 19 year olds has the lowest likelihood of being enrolled in a private school, with 98 (100.0% in the age bracket) attending a public institution.
| Age Bracket | Public School | Private School |
| 3 to 4 Year Olds | 0 (0.0%) | 0 (0.0%) |
| 5 to 9 Year Old | 256 (87.7%) | 36 (12.3%) |
| 10 to 14 Year Olds | 330 (88.2%) | 44 (11.8%) |
| 15 to 17 Year Olds | 216 (88.5%) | 28 (11.5%) |
| 18 to 19 Year Olds | 98 (100.0%) | 0 (0.0%) |
| 20 to 24 Year Olds | 158 (100.0%) | 0 (0.0%) |
| 25 to 34 Year Olds | 120 (82.2%) | 26 (17.8%) |
| 35 Years and over | 7 (28.0%) | 18 (72.0%) |
| Total | 1,185 (88.6%) | 152 (11.4%) |
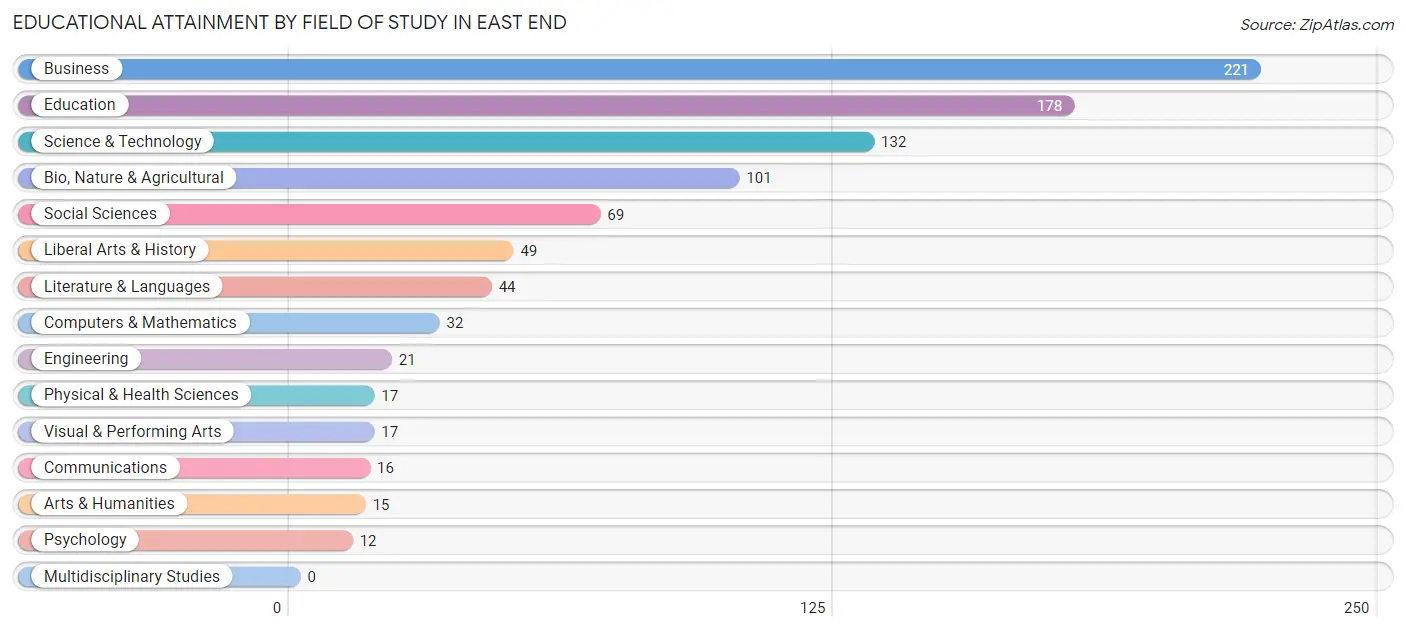
Educational Attainment by Field of Study in East End
Business (221 | 23.9%), education (178 | 19.3%), science & technology (132 | 14.3%), bio, nature & agricultural (101 | 10.9%), and social sciences (69 | 7.5%) are the most common fields of study among 924 individuals in East End who have obtained a bachelor's degree or higher.
| Field of Study | # Graduates | % Graduates |
| Computers & Mathematics | 32 | 3.5% |
| Bio, Nature & Agricultural | 101 | 10.9% |
| Physical & Health Sciences | 17 | 1.8% |
| Psychology | 12 | 1.3% |
| Social Sciences | 69 | 7.5% |
| Engineering | 21 | 2.3% |
| Multidisciplinary Studies | 0 | 0.0% |
| Science & Technology | 132 | 14.3% |
| Business | 221 | 23.9% |
| Education | 178 | 19.3% |
| Literature & Languages | 44 | 4.8% |
| Liberal Arts & History | 49 | 5.3% |
| Visual & Performing Arts | 17 | 1.8% |
| Communications | 16 | 1.7% |
| Arts & Humanities | 15 | 1.6% |
| Total | 924 | 100.0% |
Transportation & Commute in East End
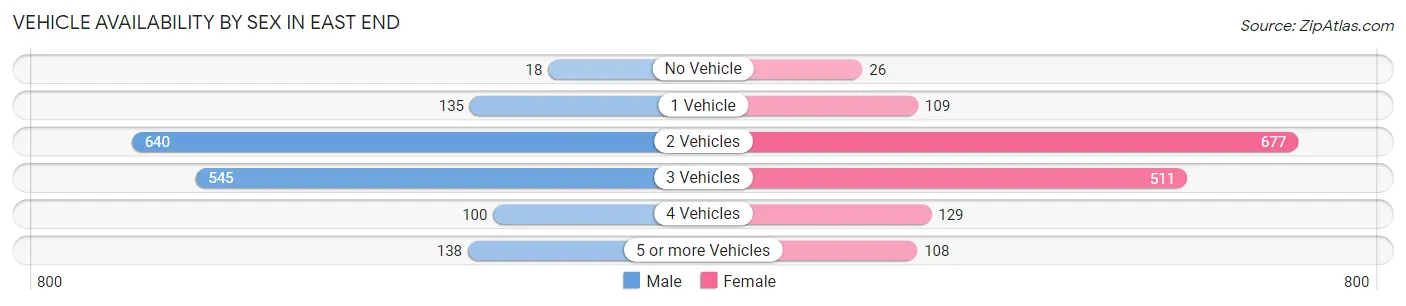
Vehicle Availability by Sex in East End
The most prevalent vehicle ownership categories in East End are males with 2 vehicles (640, accounting for 40.6%) and females with 2 vehicles (677, making up 41.0%).
| Vehicles Available | Male | Female |
| No Vehicle | 18 (1.1%) | 26 (1.7%) |
| 1 Vehicle | 135 (8.6%) | 109 (7.0%) |
| 2 Vehicles | 640 (40.6%) | 677 (43.4%) |
| 3 Vehicles | 545 (34.6%) | 511 (32.8%) |
| 4 Vehicles | 100 (6.4%) | 129 (8.3%) |
| 5 or more Vehicles | 138 (8.8%) | 108 (6.9%) |
| Total | 1,576 (100.0%) | 1,560 (100.0%) |
Commute Time in East End
The most frequently occuring commute durations in East End are 30 to 34 minutes (649 commuters, 22.0%), 20 to 24 minutes (590 commuters, 20.0%), and 25 to 29 minutes (531 commuters, 18.0%).
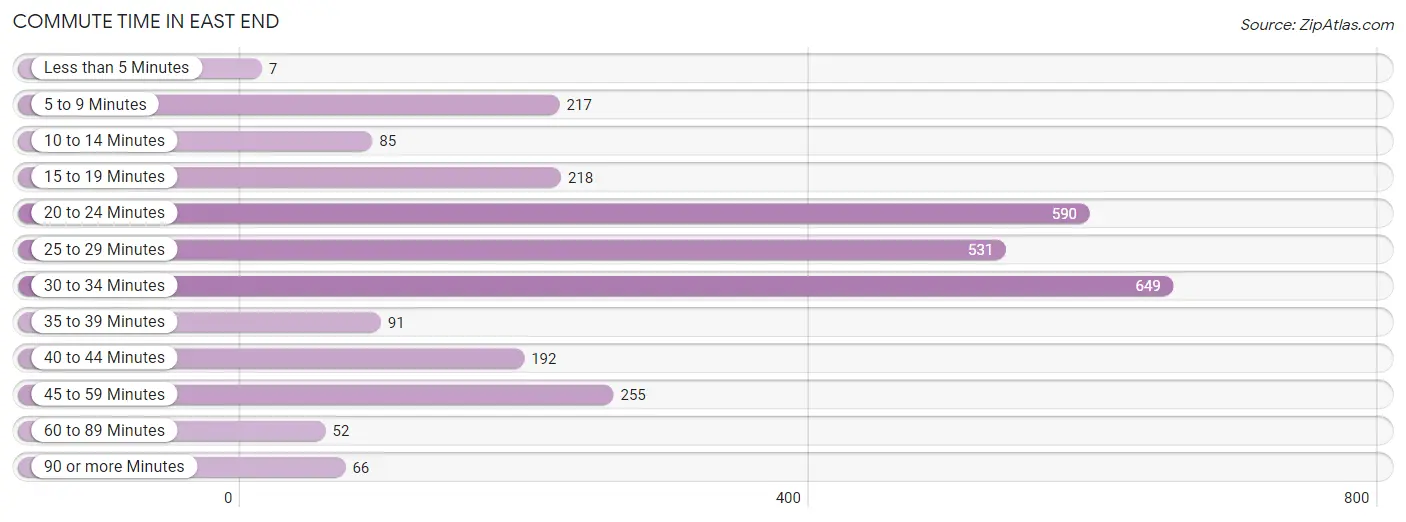
| Commute Time | # Commuters | % Commuters |
| Less than 5 Minutes | 7 | 0.2% |
| 5 to 9 Minutes | 217 | 7.3% |
| 10 to 14 Minutes | 85 | 2.9% |
| 15 to 19 Minutes | 218 | 7.4% |
| 20 to 24 Minutes | 590 | 20.0% |
| 25 to 29 Minutes | 531 | 18.0% |
| 30 to 34 Minutes | 649 | 22.0% |
| 35 to 39 Minutes | 91 | 3.1% |
| 40 to 44 Minutes | 192 | 6.5% |
| 45 to 59 Minutes | 255 | 8.6% |
| 60 to 89 Minutes | 52 | 1.8% |
| 90 or more Minutes | 66 | 2.2% |
Commute Time by Sex in East End
The most common commute times in East End are 20 to 24 minutes (395 commuters, 26.9%) for males and 30 to 34 minutes (391 commuters, 26.4%) for females.
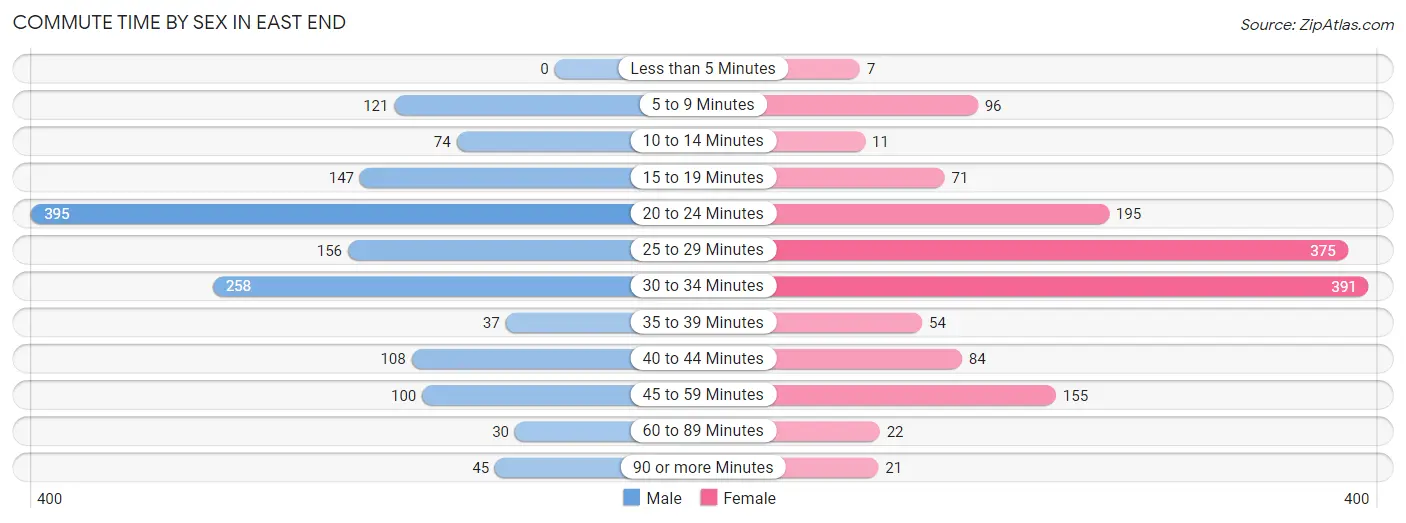
| Commute Time | Male | Female |
| Less than 5 Minutes | 0 (0.0%) | 7 (0.5%) |
| 5 to 9 Minutes | 121 (8.2%) | 96 (6.5%) |
| 10 to 14 Minutes | 74 (5.0%) | 11 (0.7%) |
| 15 to 19 Minutes | 147 (10.0%) | 71 (4.8%) |
| 20 to 24 Minutes | 395 (26.9%) | 195 (13.2%) |
| 25 to 29 Minutes | 156 (10.6%) | 375 (25.3%) |
| 30 to 34 Minutes | 258 (17.5%) | 391 (26.4%) |
| 35 to 39 Minutes | 37 (2.5%) | 54 (3.6%) |
| 40 to 44 Minutes | 108 (7.3%) | 84 (5.7%) |
| 45 to 59 Minutes | 100 (6.8%) | 155 (10.5%) |
| 60 to 89 Minutes | 30 (2.0%) | 22 (1.5%) |
| 90 or more Minutes | 45 (3.1%) | 21 (1.4%) |
Time of Departure to Work by Sex in East End
The most frequent times of departure to work in East End are 7:00 AM to 7:29 AM (298, 20.3%) for males and 7:00 AM to 7:29 AM (381, 25.7%) for females.
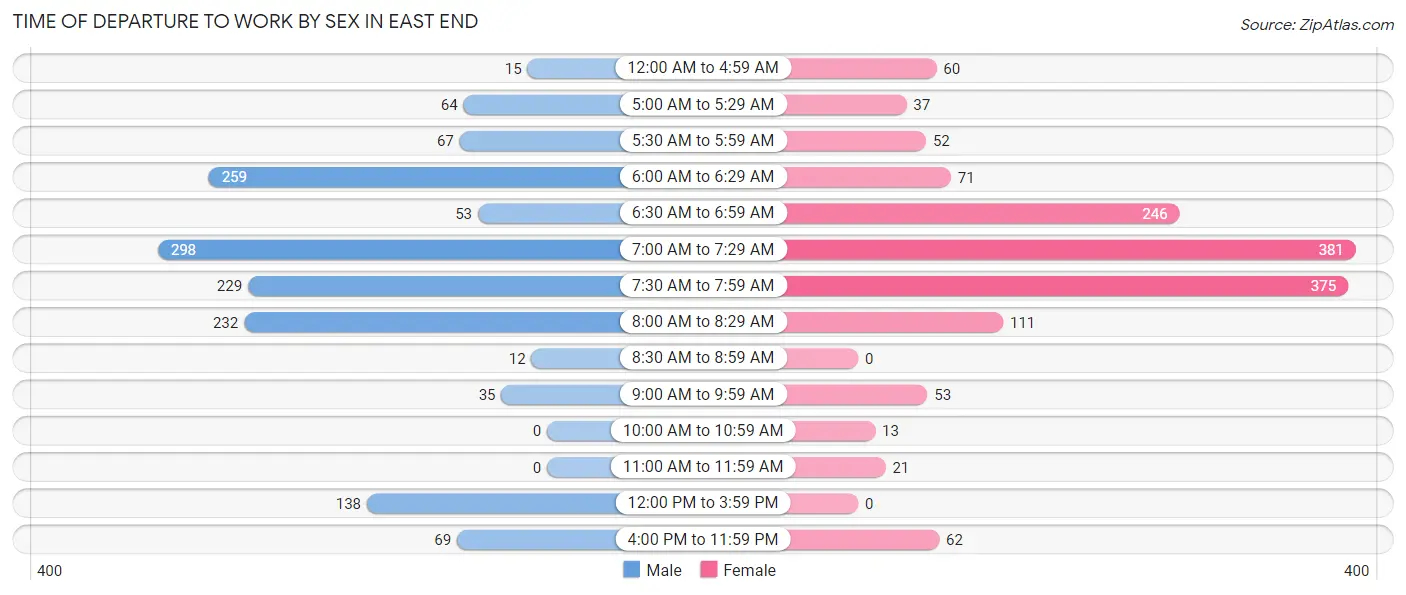
| Time of Departure | Male | Female |
| 12:00 AM to 4:59 AM | 15 (1.0%) | 60 (4.1%) |
| 5:00 AM to 5:29 AM | 64 (4.3%) | 37 (2.5%) |
| 5:30 AM to 5:59 AM | 67 (4.5%) | 52 (3.5%) |
| 6:00 AM to 6:29 AM | 259 (17.6%) | 71 (4.8%) |
| 6:30 AM to 6:59 AM | 53 (3.6%) | 246 (16.6%) |
| 7:00 AM to 7:29 AM | 298 (20.3%) | 381 (25.7%) |
| 7:30 AM to 7:59 AM | 229 (15.6%) | 375 (25.3%) |
| 8:00 AM to 8:29 AM | 232 (15.8%) | 111 (7.5%) |
| 8:30 AM to 8:59 AM | 12 (0.8%) | 0 (0.0%) |
| 9:00 AM to 9:59 AM | 35 (2.4%) | 53 (3.6%) |
| 10:00 AM to 10:59 AM | 0 (0.0%) | 13 (0.9%) |
| 11:00 AM to 11:59 AM | 0 (0.0%) | 21 (1.4%) |
| 12:00 PM to 3:59 PM | 138 (9.4%) | 0 (0.0%) |
| 4:00 PM to 11:59 PM | 69 (4.7%) | 62 (4.2%) |
| Total | 1,471 (100.0%) | 1,482 (100.0%) |
Housing Occupancy in East End
Occupancy by Ownership in East End
Of the total 2,279 dwellings in East End, owner-occupied units account for 1,750 (76.8%), while renter-occupied units make up 529 (23.2%).
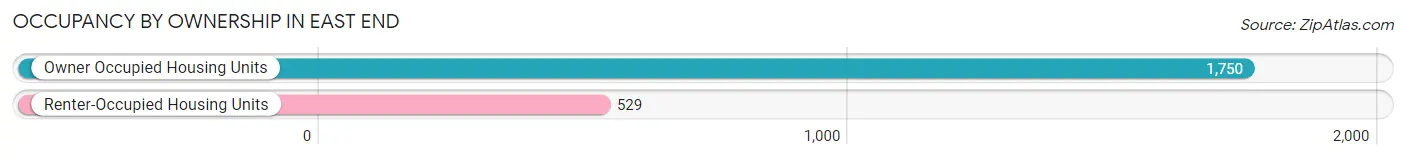
| Occupancy | # Housing Units | % Housing Units |
| Owner Occupied Housing Units | 1,750 | 76.8% |
| Renter-Occupied Housing Units | 529 | 23.2% |
| Total Occupied Housing Units | 2,279 | 100.0% |
Occupancy by Household Size in East End
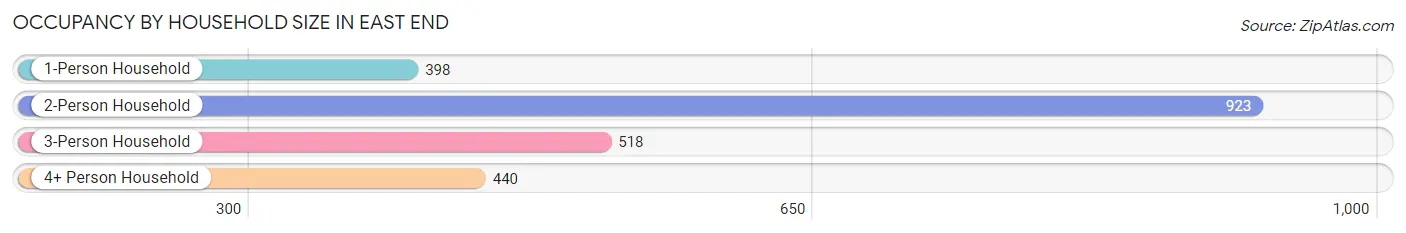
| Household Size | # Housing Units | % Housing Units |
| 1-Person Household | 398 | 17.5% |
| 2-Person Household | 923 | 40.5% |
| 3-Person Household | 518 | 22.7% |
| 4+ Person Household | 440 | 19.3% |
| Total Housing Units | 2,279 | 100.0% |
Occupancy by Ownership by Household Size in East End
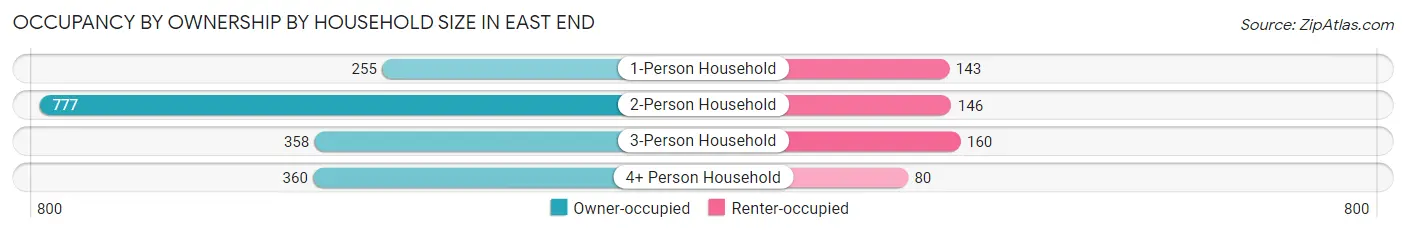
| Household Size | Owner-occupied | Renter-occupied |
| 1-Person Household | 255 (64.1%) | 143 (35.9%) |
| 2-Person Household | 777 (84.2%) | 146 (15.8%) |
| 3-Person Household | 358 (69.1%) | 160 (30.9%) |
| 4+ Person Household | 360 (81.8%) | 80 (18.2%) |
| Total Housing Units | 1,750 (76.8%) | 529 (23.2%) |
Occupancy by Educational Attainment in East End
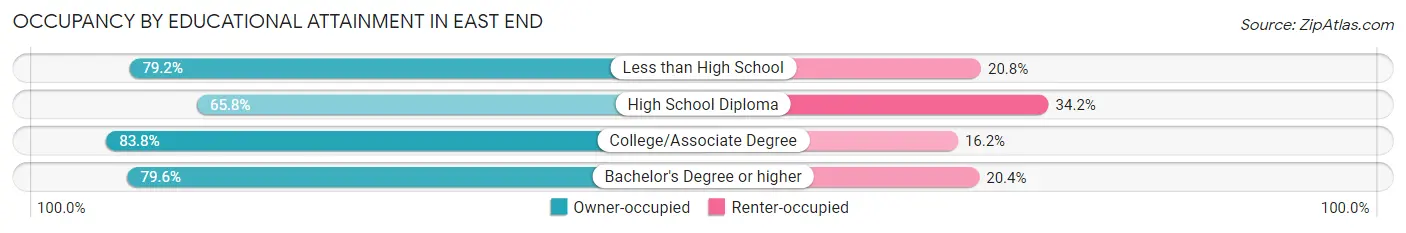
| Household Size | Owner-occupied | Renter-occupied |
| Less than High School | 179 (79.2%) | 47 (20.8%) |
| High School Diploma | 454 (65.8%) | 236 (34.2%) |
| College/Associate Degree | 646 (83.8%) | 125 (16.2%) |
| Bachelor's Degree or higher | 471 (79.6%) | 121 (20.4%) |
Occupancy by Age of Householder in East End
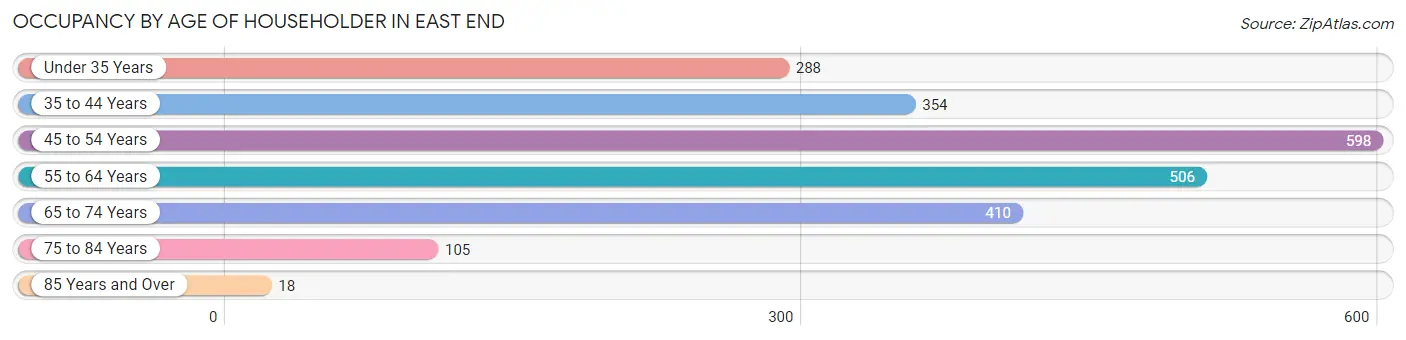
| Age Bracket | # Households | % Households |
| Under 35 Years | 288 | 12.6% |
| 35 to 44 Years | 354 | 15.5% |
| 45 to 54 Years | 598 | 26.2% |
| 55 to 64 Years | 506 | 22.2% |
| 65 to 74 Years | 410 | 18.0% |
| 75 to 84 Years | 105 | 4.6% |
| 85 Years and Over | 18 | 0.8% |
| Total | 2,279 | 100.0% |
Housing Finances in East End
Median Income by Occupancy in East End
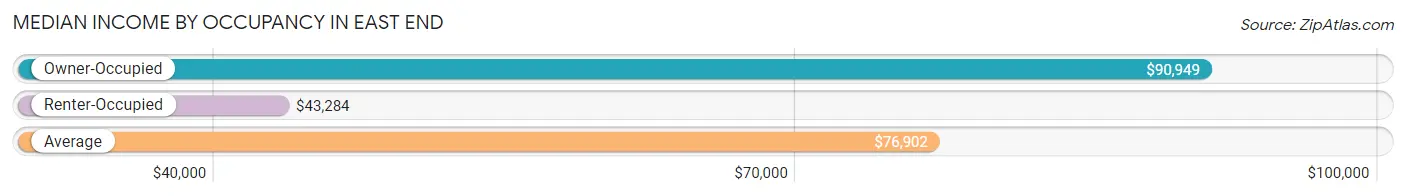
| Occupancy Type | # Households | Median Income |
| Owner-Occupied | 1,750 (76.8%) | $90,949 |
| Renter-Occupied | 529 (23.2%) | $43,284 |
| Average | 2,279 (100.0%) | $76,902 |
Occupancy by Householder Income Bracket in East End
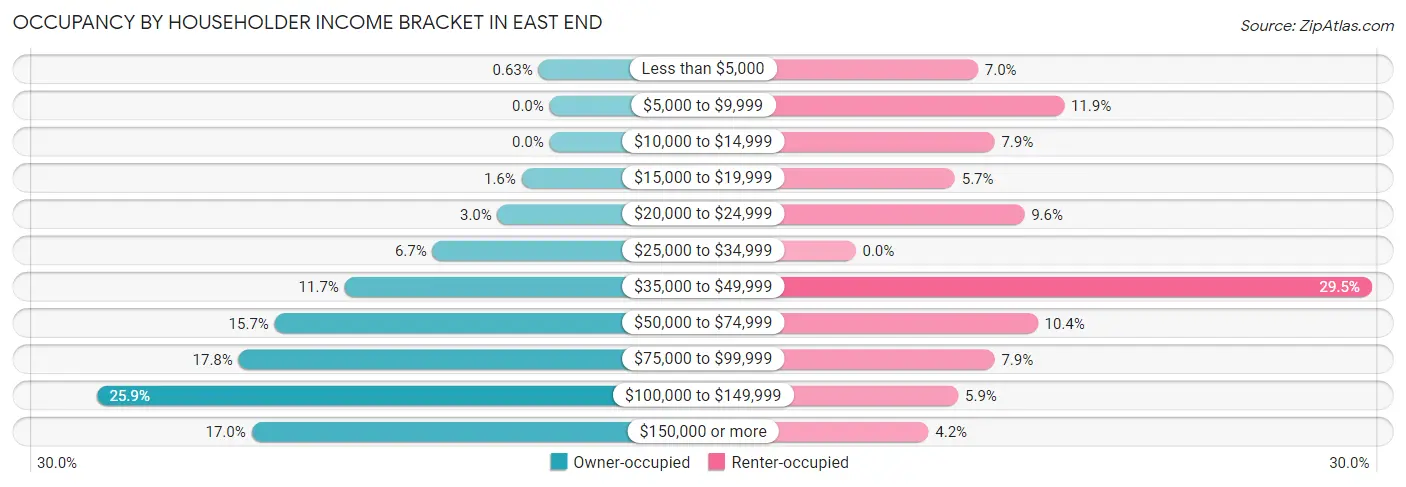
| Income Bracket | Owner-occupied | Renter-occupied |
| Less than $5,000 | 11 (0.6%) | 37 (7.0%) |
| $5,000 to $9,999 | 0 (0.0%) | 63 (11.9%) |
| $10,000 to $14,999 | 0 (0.0%) | 42 (7.9%) |
| $15,000 to $19,999 | 28 (1.6%) | 30 (5.7%) |
| $20,000 to $24,999 | 52 (3.0%) | 51 (9.6%) |
| $25,000 to $34,999 | 117 (6.7%) | 0 (0.0%) |
| $35,000 to $49,999 | 205 (11.7%) | 156 (29.5%) |
| $50,000 to $74,999 | 275 (15.7%) | 55 (10.4%) |
| $75,000 to $99,999 | 311 (17.8%) | 42 (7.9%) |
| $100,000 to $149,999 | 453 (25.9%) | 31 (5.9%) |
| $150,000 or more | 298 (17.0%) | 22 (4.2%) |
| Total | 1,750 (100.0%) | 529 (100.0%) |
Monthly Housing Cost Tiers in East End
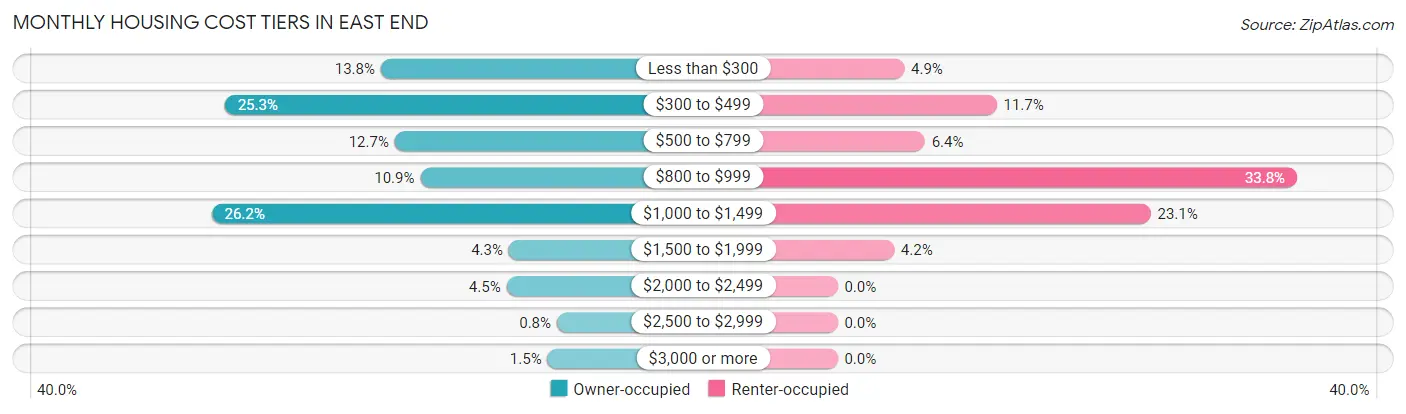
| Monthly Cost | Owner-occupied | Renter-occupied |
| Less than $300 | 241 (13.8%) | 26 (4.9%) |
| $300 to $499 | 442 (25.3%) | 62 (11.7%) |
| $500 to $799 | 223 (12.7%) | 34 (6.4%) |
| $800 to $999 | 190 (10.9%) | 179 (33.8%) |
| $1,000 to $1,499 | 459 (26.2%) | 122 (23.1%) |
| $1,500 to $1,999 | 76 (4.3%) | 22 (4.2%) |
| $2,000 to $2,499 | 79 (4.5%) | 0 (0.0%) |
| $2,500 to $2,999 | 14 (0.8%) | 0 (0.0%) |
| $3,000 or more | 26 (1.5%) | 0 (0.0%) |
| Total | 1,750 (100.0%) | 529 (100.0%) |
Physical Housing Characteristics in East End
Housing Structures in East End
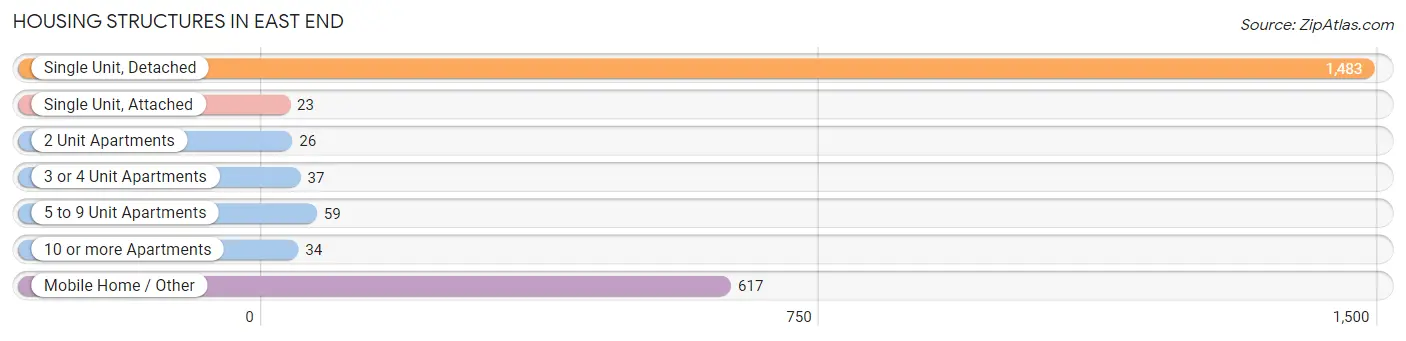
| Structure Type | # Housing Units | % Housing Units |
| Single Unit, Detached | 1,483 | 65.1% |
| Single Unit, Attached | 23 | 1.0% |
| 2 Unit Apartments | 26 | 1.1% |
| 3 or 4 Unit Apartments | 37 | 1.6% |
| 5 to 9 Unit Apartments | 59 | 2.6% |
| 10 or more Apartments | 34 | 1.5% |
| Mobile Home / Other | 617 | 27.1% |
| Total | 2,279 | 100.0% |
Housing Structures by Occupancy in East End
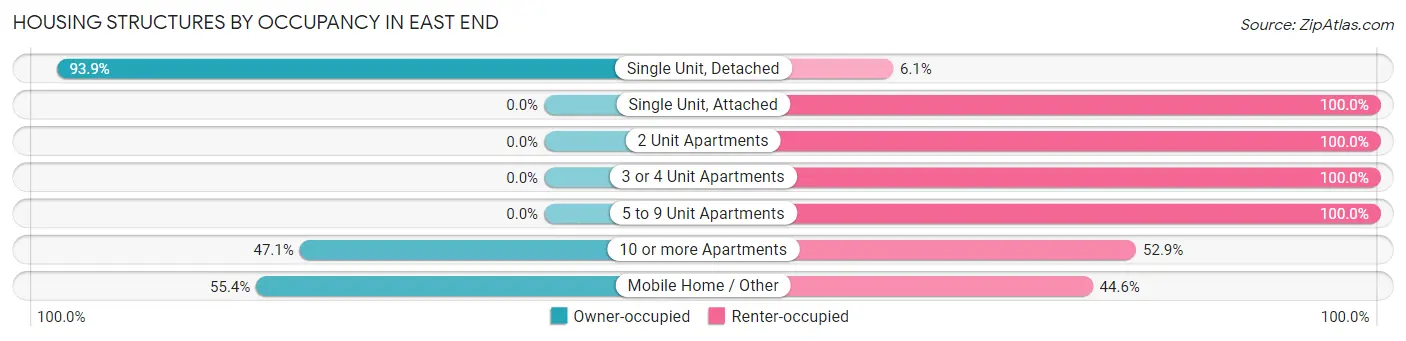
| Structure Type | Owner-occupied | Renter-occupied |
| Single Unit, Detached | 1,392 (93.9%) | 91 (6.1%) |
| Single Unit, Attached | 0 (0.0%) | 23 (100.0%) |
| 2 Unit Apartments | 0 (0.0%) | 26 (100.0%) |
| 3 or 4 Unit Apartments | 0 (0.0%) | 37 (100.0%) |
| 5 to 9 Unit Apartments | 0 (0.0%) | 59 (100.0%) |
| 10 or more Apartments | 16 (47.1%) | 18 (52.9%) |
| Mobile Home / Other | 342 (55.4%) | 275 (44.6%) |
| Total | 1,750 (76.8%) | 529 (23.2%) |
Housing Structures by Number of Rooms in East End
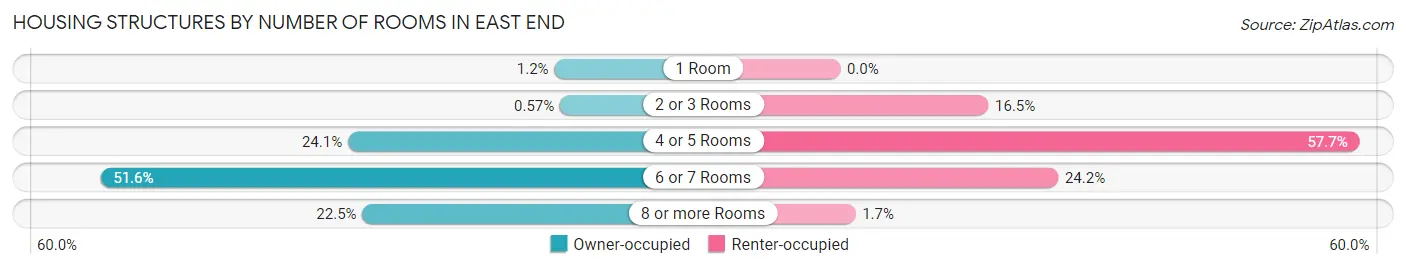
| Number of Rooms | Owner-occupied | Renter-occupied |
| 1 Room | 21 (1.2%) | 0 (0.0%) |
| 2 or 3 Rooms | 10 (0.6%) | 87 (16.5%) |
| 4 or 5 Rooms | 422 (24.1%) | 305 (57.7%) |
| 6 or 7 Rooms | 903 (51.6%) | 128 (24.2%) |
| 8 or more Rooms | 394 (22.5%) | 9 (1.7%) |
| Total | 1,750 (100.0%) | 529 (100.0%) |
Housing Structure by Heating Type in East End
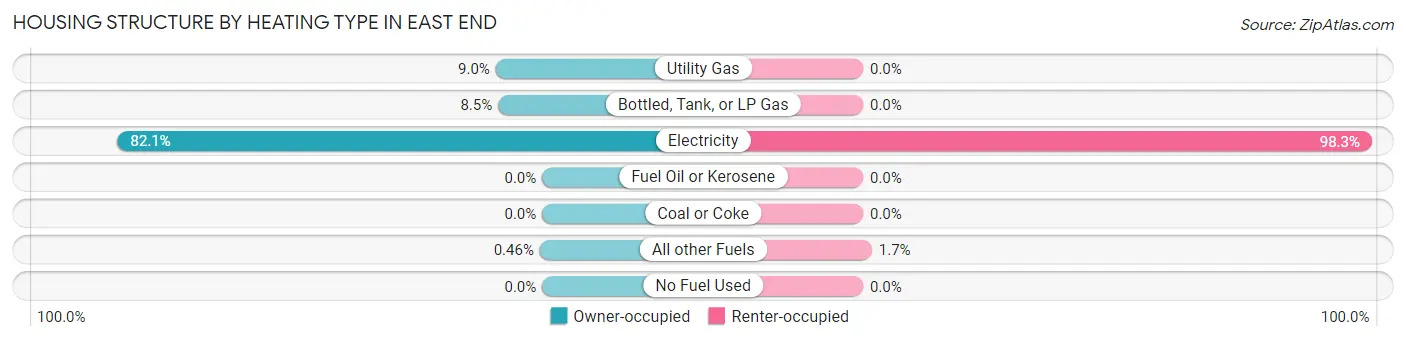
| Heating Type | Owner-occupied | Renter-occupied |
| Utility Gas | 157 (9.0%) | 0 (0.0%) |
| Bottled, Tank, or LP Gas | 149 (8.5%) | 0 (0.0%) |
| Electricity | 1,436 (82.1%) | 520 (98.3%) |
| Fuel Oil or Kerosene | 0 (0.0%) | 0 (0.0%) |
| Coal or Coke | 0 (0.0%) | 0 (0.0%) |
| All other Fuels | 8 (0.5%) | 9 (1.7%) |
| No Fuel Used | 0 (0.0%) | 0 (0.0%) |
| Total | 1,750 (100.0%) | 529 (100.0%) |
Household Vehicle Usage in East End
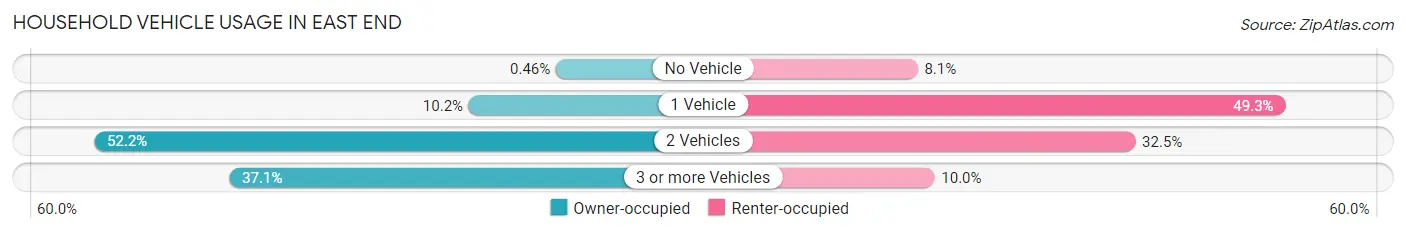
| Vehicles per Household | Owner-occupied | Renter-occupied |
| No Vehicle | 8 (0.5%) | 43 (8.1%) |
| 1 Vehicle | 179 (10.2%) | 261 (49.3%) |
| 2 Vehicles | 914 (52.2%) | 172 (32.5%) |
| 3 or more Vehicles | 649 (37.1%) | 53 (10.0%) |
| Total | 1,750 (100.0%) | 529 (100.0%) |
Real Estate & Mortgages in East End
Real Estate and Mortgage Overview in East End
| Characteristic | Without Mortgage | With Mortgage |
| Housing Units | 869 | 881 |
| Median Property Value | $163,800 | $192,300 |
| Median Household Income | $90,078 | $227 |
| Monthly Housing Costs | $379 | $26 |
| Real Estate Taxes | $820 | $45 |
Property Value by Mortgage Status in East End
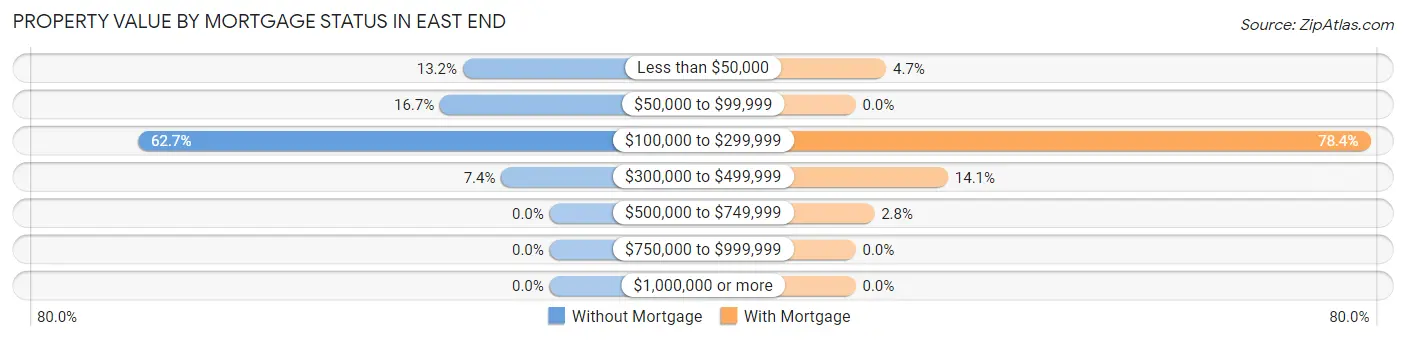
| Property Value | Without Mortgage | With Mortgage |
| Less than $50,000 | 115 (13.2%) | 41 (4.6%) |
| $50,000 to $99,999 | 145 (16.7%) | 0 (0.0%) |
| $100,000 to $299,999 | 545 (62.7%) | 691 (78.4%) |
| $300,000 to $499,999 | 64 (7.4%) | 124 (14.1%) |
| $500,000 to $749,999 | 0 (0.0%) | 25 (2.8%) |
| $750,000 to $999,999 | 0 (0.0%) | 0 (0.0%) |
| $1,000,000 or more | 0 (0.0%) | 0 (0.0%) |
| Total | 869 (100.0%) | 881 (100.0%) |
Household Income by Mortgage Status in East End
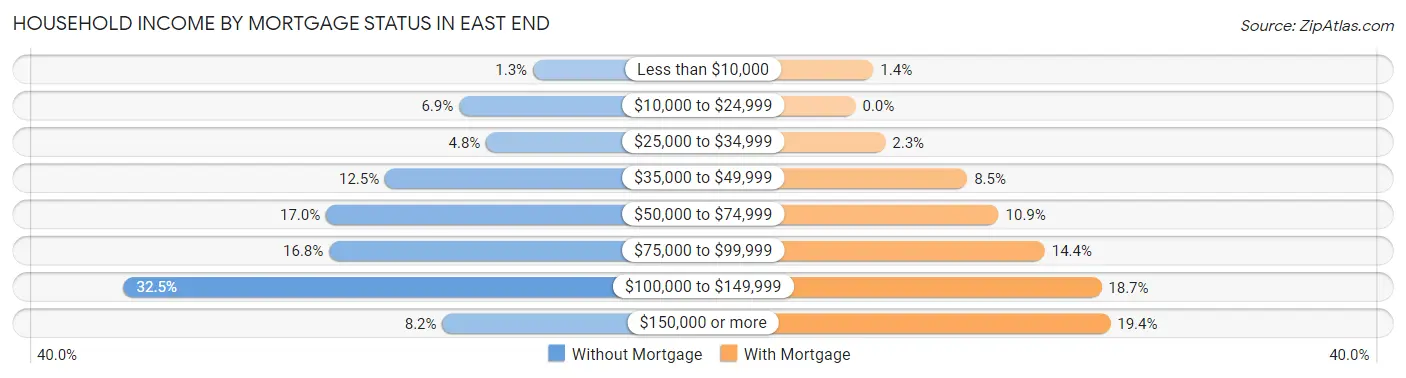
| Household Income | Without Mortgage | With Mortgage |
| Less than $10,000 | 11 (1.3%) | 12 (1.4%) |
| $10,000 to $24,999 | 60 (6.9%) | 0 (0.0%) |
| $25,000 to $34,999 | 42 (4.8%) | 20 (2.3%) |
| $35,000 to $49,999 | 109 (12.5%) | 75 (8.5%) |
| $50,000 to $74,999 | 148 (17.0%) | 96 (10.9%) |
| $75,000 to $99,999 | 146 (16.8%) | 127 (14.4%) |
| $100,000 to $149,999 | 282 (32.5%) | 165 (18.7%) |
| $150,000 or more | 71 (8.2%) | 171 (19.4%) |
| Total | 869 (100.0%) | 881 (100.0%) |
Property Value to Household Income Ratio in East End
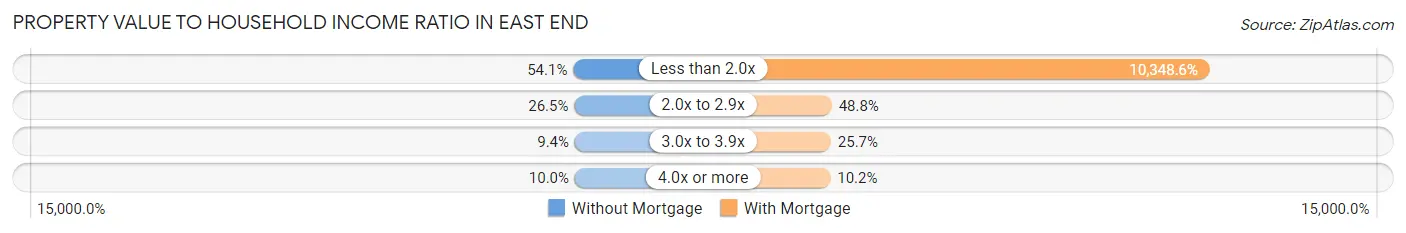
| Value-to-Income Ratio | Without Mortgage | With Mortgage |
| Less than 2.0x | 470 (54.1%) | 91,171 (10,348.6%) |
| 2.0x to 2.9x | 230 (26.5%) | 430 (48.8%) |
| 3.0x to 3.9x | 82 (9.4%) | 226 (25.7%) |
| 4.0x or more | 87 (10.0%) | 90 (10.2%) |
| Total | 869 (100.0%) | 881 (100.0%) |
Real Estate Taxes by Mortgage Status in East End
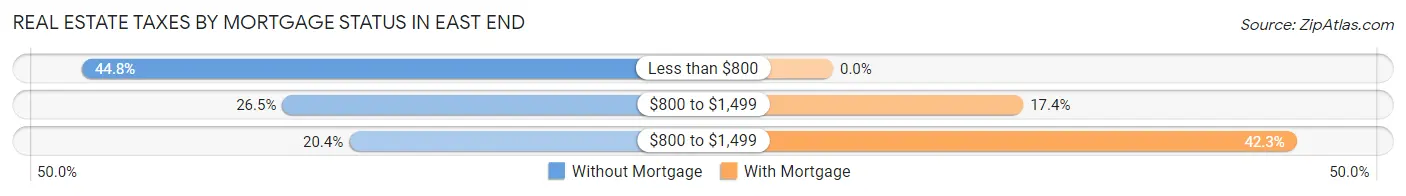
| Property Taxes | Without Mortgage | With Mortgage |
| Less than $800 | 389 (44.8%) | 0 (0.0%) |
| $800 to $1,499 | 230 (26.5%) | 153 (17.4%) |
| $800 to $1,499 | 177 (20.4%) | 373 (42.3%) |
| Total | 869 (100.0%) | 881 (100.0%) |
Health & Disability in East End
Health Insurance Coverage by Age in East End
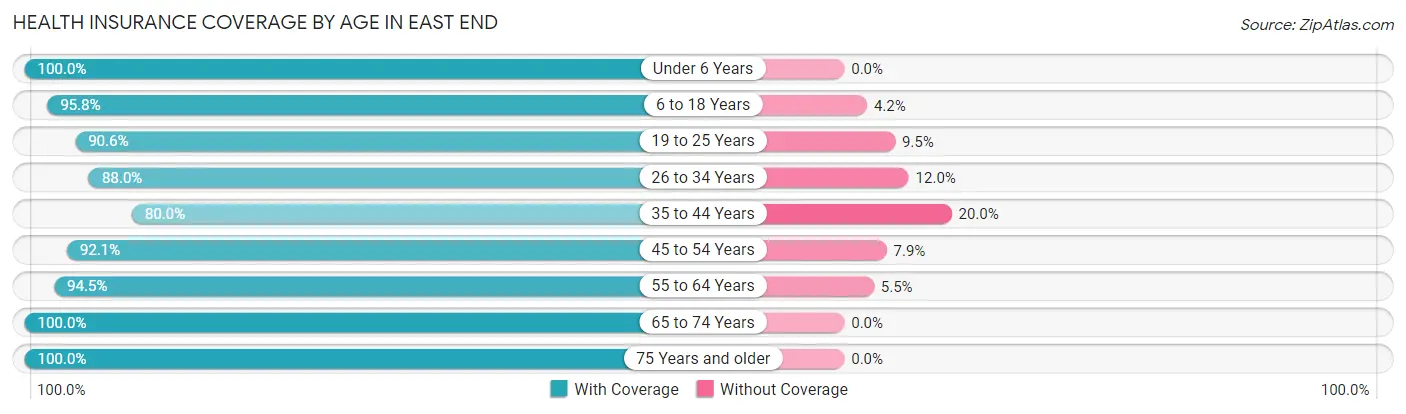
| Age Bracket | With Coverage | Without Coverage |
| Under 6 Years | 157 (100.0%) | 0 (0.0%) |
| 6 to 18 Years | 928 (95.8%) | 41 (4.2%) |
| 19 to 25 Years | 623 (90.5%) | 65 (9.5%) |
| 26 to 34 Years | 550 (88.0%) | 75 (12.0%) |
| 35 to 44 Years | 536 (80.0%) | 134 (20.0%) |
| 45 to 54 Years | 980 (92.1%) | 84 (7.9%) |
| 55 to 64 Years | 961 (94.5%) | 56 (5.5%) |
| 65 to 74 Years | 674 (100.0%) | 0 (0.0%) |
| 75 Years and older | 283 (100.0%) | 0 (0.0%) |
| Total | 5,692 (92.6%) | 455 (7.4%) |
Health Insurance Coverage by Citizenship Status in East End
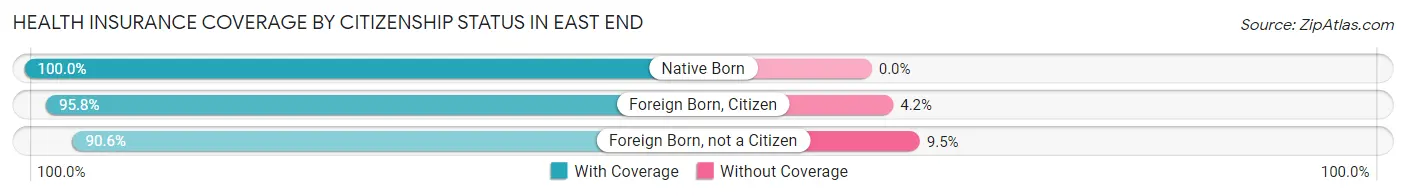
| Citizenship Status | With Coverage | Without Coverage |
| Native Born | 157 (100.0%) | 0 (0.0%) |
| Foreign Born, Citizen | 928 (95.8%) | 41 (4.2%) |
| Foreign Born, not a Citizen | 623 (90.5%) | 65 (9.5%) |
Health Insurance Coverage by Household Income in East End
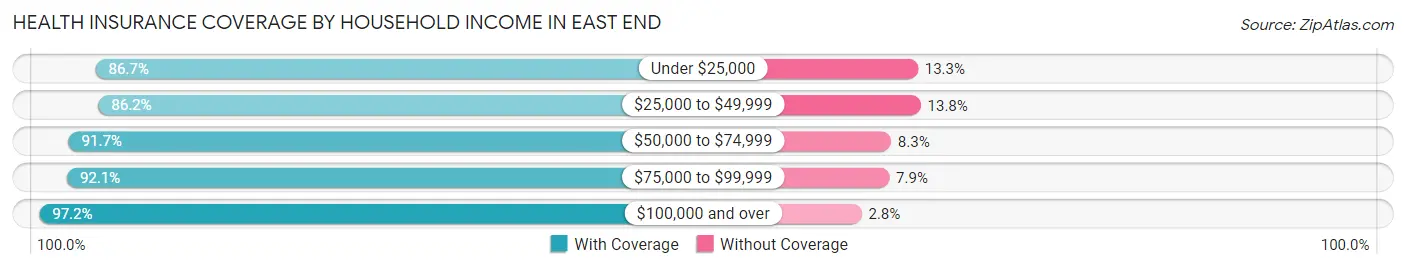
| Household Income | With Coverage | Without Coverage |
| Under $25,000 | 541 (86.7%) | 83 (13.3%) |
| $25,000 to $49,999 | 891 (86.2%) | 143 (13.8%) |
| $50,000 to $74,999 | 800 (91.7%) | 72 (8.3%) |
| $75,000 to $99,999 | 1,020 (92.1%) | 88 (7.9%) |
| $100,000 and over | 2,435 (97.2%) | 69 (2.8%) |
Public vs Private Health Insurance Coverage by Age in East End
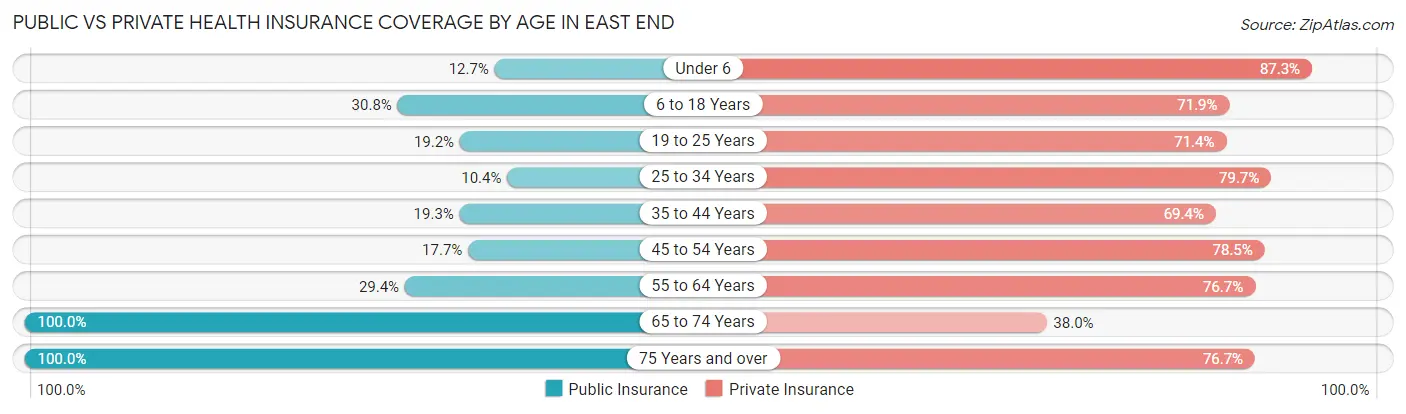
| Age Bracket | Public Insurance | Private Insurance |
| Under 6 | 20 (12.7%) | 137 (87.3%) |
| 6 to 18 Years | 298 (30.7%) | 697 (71.9%) |
| 19 to 25 Years | 132 (19.2%) | 491 (71.4%) |
| 25 to 34 Years | 65 (10.4%) | 498 (79.7%) |
| 35 to 44 Years | 129 (19.3%) | 465 (69.4%) |
| 45 to 54 Years | 188 (17.7%) | 835 (78.5%) |
| 55 to 64 Years | 299 (29.4%) | 780 (76.7%) |
| 65 to 74 Years | 674 (100.0%) | 256 (38.0%) |
| 75 Years and over | 283 (100.0%) | 217 (76.7%) |
| Total | 2,088 (34.0%) | 4,376 (71.2%) |
Disability Status by Sex by Age in East End
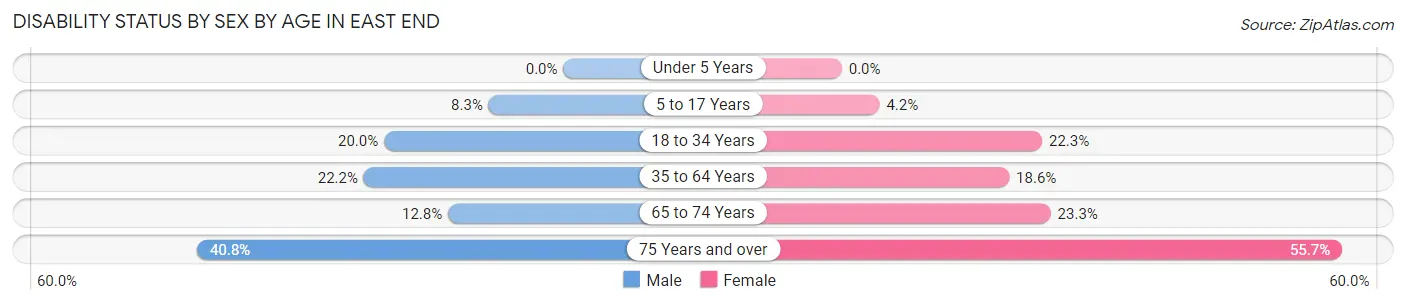
| Age Bracket | Male | Female |
| Under 5 Years | 0 (0.0%) | 0 (0.0%) |
| 5 to 17 Years | 26 (8.3%) | 26 (4.2%) |
| 18 to 34 Years | 136 (20.0%) | 157 (22.3%) |
| 35 to 64 Years | 324 (22.2%) | 241 (18.6%) |
| 65 to 74 Years | 33 (12.8%) | 97 (23.3%) |
| 75 Years and over | 51 (40.8%) | 88 (55.7%) |
Disability Class by Sex by Age in East End
Disability Class: Hearing Difficulty
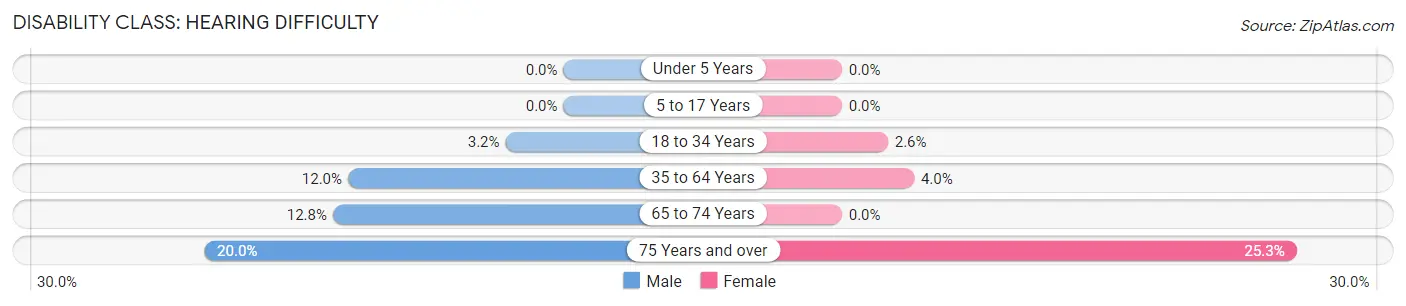
| Age Bracket | Male | Female |
| Under 5 Years | 0 (0.0%) | 0 (0.0%) |
| 5 to 17 Years | 0 (0.0%) | 0 (0.0%) |
| 18 to 34 Years | 22 (3.2%) | 18 (2.6%) |
| 35 to 64 Years | 175 (12.0%) | 52 (4.0%) |
| 65 to 74 Years | 33 (12.8%) | 0 (0.0%) |
| 75 Years and over | 25 (20.0%) | 40 (25.3%) |
Disability Class: Vision Difficulty
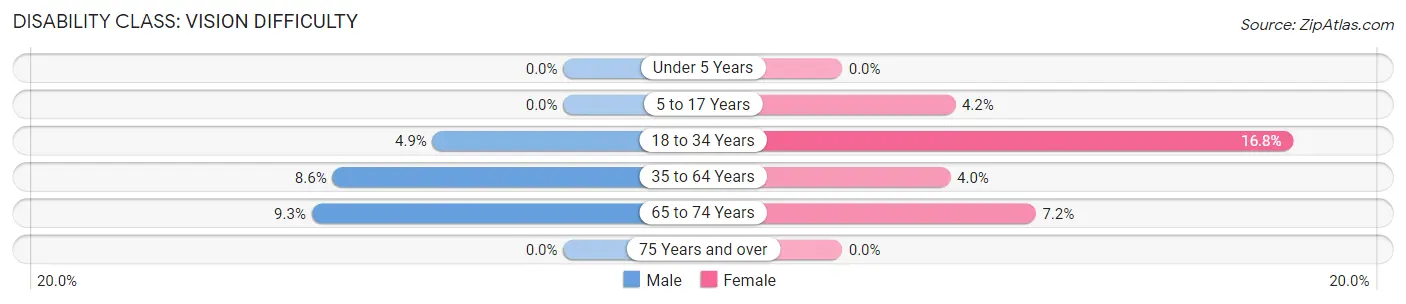
| Age Bracket | Male | Female |
| Under 5 Years | 0 (0.0%) | 0 (0.0%) |
| 5 to 17 Years | 0 (0.0%) | 26 (4.2%) |
| 18 to 34 Years | 33 (4.9%) | 118 (16.8%) |
| 35 to 64 Years | 125 (8.6%) | 52 (4.0%) |
| 65 to 74 Years | 24 (9.3%) | 30 (7.2%) |
| 75 Years and over | 0 (0.0%) | 0 (0.0%) |
Disability Class: Cognitive Difficulty
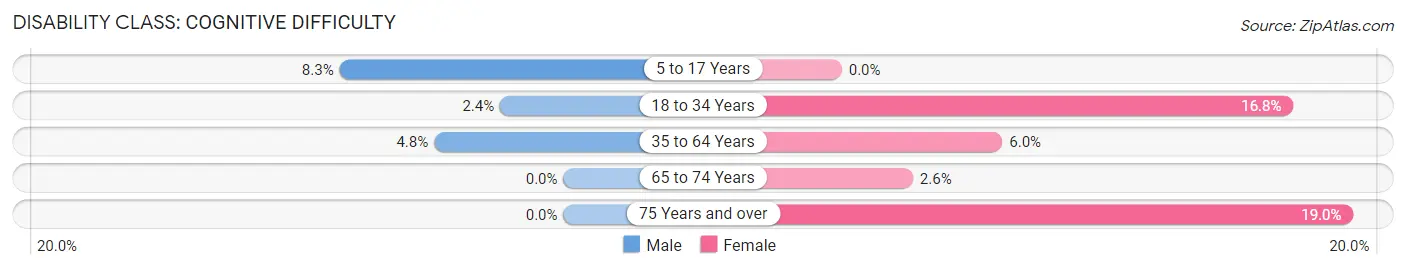
| Age Bracket | Male | Female |
| 5 to 17 Years | 26 (8.3%) | 0 (0.0%) |
| 18 to 34 Years | 16 (2.4%) | 118 (16.8%) |
| 35 to 64 Years | 70 (4.8%) | 77 (6.0%) |
| 65 to 74 Years | 0 (0.0%) | 11 (2.6%) |
| 75 Years and over | 0 (0.0%) | 30 (19.0%) |
Disability Class: Ambulatory Difficulty
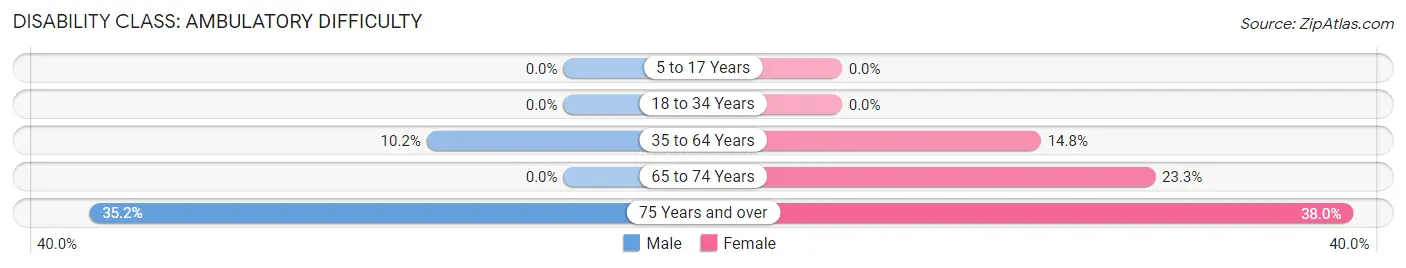
| Age Bracket | Male | Female |
| 5 to 17 Years | 0 (0.0%) | 0 (0.0%) |
| 18 to 34 Years | 0 (0.0%) | 0 (0.0%) |
| 35 to 64 Years | 148 (10.2%) | 191 (14.8%) |
| 65 to 74 Years | 0 (0.0%) | 97 (23.3%) |
| 75 Years and over | 44 (35.2%) | 60 (38.0%) |
Disability Class: Self-Care Difficulty
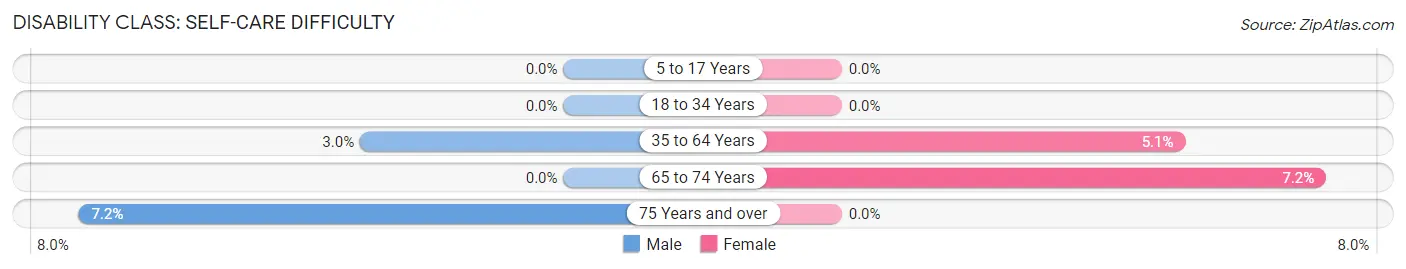
| Age Bracket | Male | Female |
| 5 to 17 Years | 0 (0.0%) | 0 (0.0%) |
| 18 to 34 Years | 0 (0.0%) | 0 (0.0%) |
| 35 to 64 Years | 44 (3.0%) | 66 (5.1%) |
| 65 to 74 Years | 0 (0.0%) | 30 (7.2%) |
| 75 Years and over | 9 (7.2%) | 0 (0.0%) |
Technology Access in East End
Computing Device Access in East End
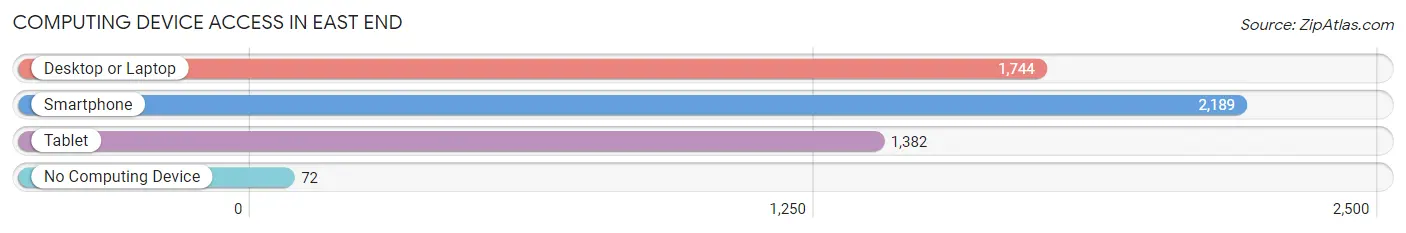
| Device Type | # Households | % Households |
| Desktop or Laptop | 1,744 | 76.5% |
| Smartphone | 2,189 | 96.1% |
| Tablet | 1,382 | 60.6% |
| No Computing Device | 72 | 3.2% |
| Total | 2,279 | 100.0% |
Internet Access in East End
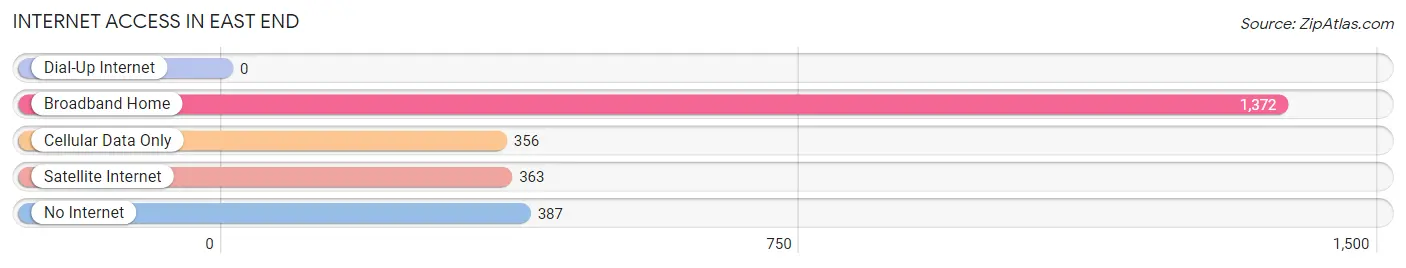
| Internet Type | # Households | % Households |
| Dial-Up Internet | 0 | 0.0% |
| Broadband Home | 1,372 | 60.2% |
| Cellular Data Only | 356 | 15.6% |
| Satellite Internet | 363 | 15.9% |
| No Internet | 387 | 17.0% |
| Total | 2,279 | 100.0% |
East End Summary
East End is a small town located in the northeast corner of Arkansas, in the foothills of the Ozark Mountains. It is situated in the White River Valley, and is part of the Little Rock-North Little Rock-Conway Metropolitan Statistical Area. The town has a population of 1,845 people, according to the 2010 census.
History
East End was founded in 1883 by a group of settlers from the nearby town of Searcy. The town was named after the easternmost point of the White River Valley. The first post office was established in 1884, and the town was incorporated in 1887.
East End was a small farming community for much of its history. The town was home to a cotton gin, a grist mill, and a sawmill. The town also had a number of stores, including a general store, a drug store, and a hardware store.
In the early 20th century, East End began to experience a period of growth. The town was connected to the railroad in 1906, and the first telephone service was established in 1908. The town also had a number of churches, including the First Baptist Church, which was founded in 1910.
Geography
East End is located in the northeast corner of Arkansas, in the foothills of the Ozark Mountains. The town is situated in the White River Valley, and is part of the Little Rock-North Little Rock-Conway Metropolitan Statistical Area.
The town is located at the intersection of Arkansas Highway 5 and Arkansas Highway 16. The White River runs through the town, and the town is located approximately 25 miles north of Little Rock.
Economy
East End is a small farming community, and the town’s economy is largely based on agriculture. The town is home to a number of farms, and the town’s main crops are cotton, soybeans, and corn.
The town is also home to a number of small businesses, including a grocery store, a hardware store, and a number of restaurants. The town also has a number of churches, and the town is home to a number of small manufacturing companies.
Demographics
According to the 2010 census, East End has a population of 1,845 people. The town has a median household income of $35,000, and the median age is 38. The town is predominantly white, with a small African American population. The town also has a small Hispanic population.
Conclusion
East End is a small town located in the northeast corner of Arkansas, in the foothills of the Ozark Mountains. The town has a population of 1,845 people, and the town’s economy is largely based on agriculture. The town is predominantly white, with a small African American and Hispanic population. East End is a small farming community, and the town is home to a number of small businesses and churches.
Common Questions
What is Per Capita Income in East End?
Per Capita income in East End is $35,347.
What is the Median Family Income in East End?
Median Family Income in East End is $86,540.
What is the Median Household income in East End?
Median Household Income in East End is $76,902.
What is Income or Wage Gap in East End?
Income or Wage Gap in East End is 13.7%.
Women in East End earn 86.3 cents for every dollar earned by a man.
What is Inequality or Gini Index in East End?
Inequality or Gini Index in East End is 0.41.
What is the Total Population of East End?
Total Population of East End is 6,147.
What is the Total Male Population of East End?
Total Male Population of East End is 2,921.
What is the Total Female Population of East End?
Total Female Population of East End is 3,226.
What is the Ratio of Males per 100 Females in East End?
There are 90.55 Males per 100 Females in East End.
What is the Ratio of Females per 100 Males in East End?
There are 110.44 Females per 100 Males in East End.
What is the Median Population Age in East End?
Median Population Age in East End is 44.6 Years.
What is the Average Family Size in East End
Average Family Size in East End is 3.0 People.
What is the Average Household Size in East End
Average Household Size in East End is 2.7 People.
How Large is the Labor Force in East End?
There are 3,318 People in the Labor Forcein in East End.
What is the Percentage of People in the Labor Force in East End?
63.3% of People are in the Labor Force in East End.
What is the Unemployment Rate in East End?
Unemployment Rate in East End is 4.7%.