Salem, AR Map & Demographics
Salem Map
Salem Overview
$41,478
PER CAPITA INCOME
$88,110
AVG FAMILY INCOME
$83,426
AVG HOUSEHOLD INCOME
54.1%
WAGE / INCOME GAP [ % ]
45.9¢/ $1
WAGE / INCOME GAP [ $ ]
0.37
INEQUALITY / GINI INDEX
2,476
TOTAL POPULATION
972
MALE POPULATION
1,504
FEMALE POPULATION
64.63
MALES / 100 FEMALES
154.73
FEMALES / 100 MALES
50.1
MEDIAN AGE
2.8
AVG FAMILY SIZE
2.3
AVG HOUSEHOLD SIZE
1,556
LABOR FORCE [ PEOPLE ]
68.6%
PERCENT IN LABOR FORCE
0.6%
UNEMPLOYMENT RATE
Salem Zip Codes
Salem Area Codes
Income in Salem
Income Overview in Salem
Per Capita Income in Salem is $41,478, while median incomes of families and households are $88,110 and $83,426 respectively.
| Characteristic | Number | Measure |
| Per Capita Income | 2,476 | $41,478 |
| Median Family Income | 653 | $88,110 |
| Mean Family Income | 653 | $110,092 |
| Median Household Income | 1,064 | $83,426 |
| Mean Household Income | 1,064 | $88,599 |
| Income Deficit | 653 | $0 |
| Wage / Income Gap (%) | 2,476 | 54.13% |
| Wage / Income Gap ($) | 2,476 | 45.87¢ per $1 |
| Gini / Inequality Index | 2,476 | 0.37 |
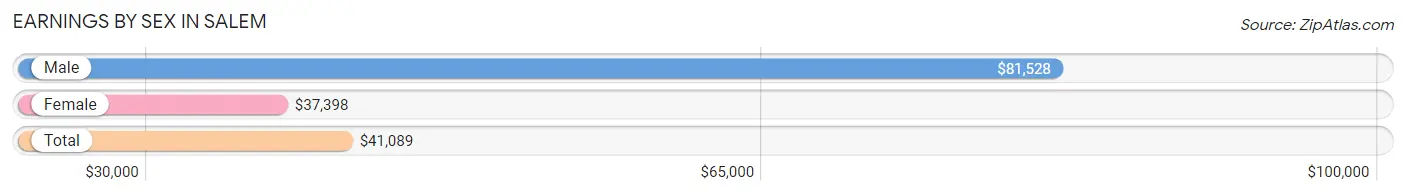
Earnings by Sex in Salem
Average Earnings in Salem are $41,089, $81,528 for men and $37,398 for women, a difference of 54.1%.
| Sex | Number | Average Earnings |
| Male | 611 (39.1%) | $81,528 |
| Female | 953 (60.9%) | $37,398 |
| Total | 1,564 (100.0%) | $41,089 |
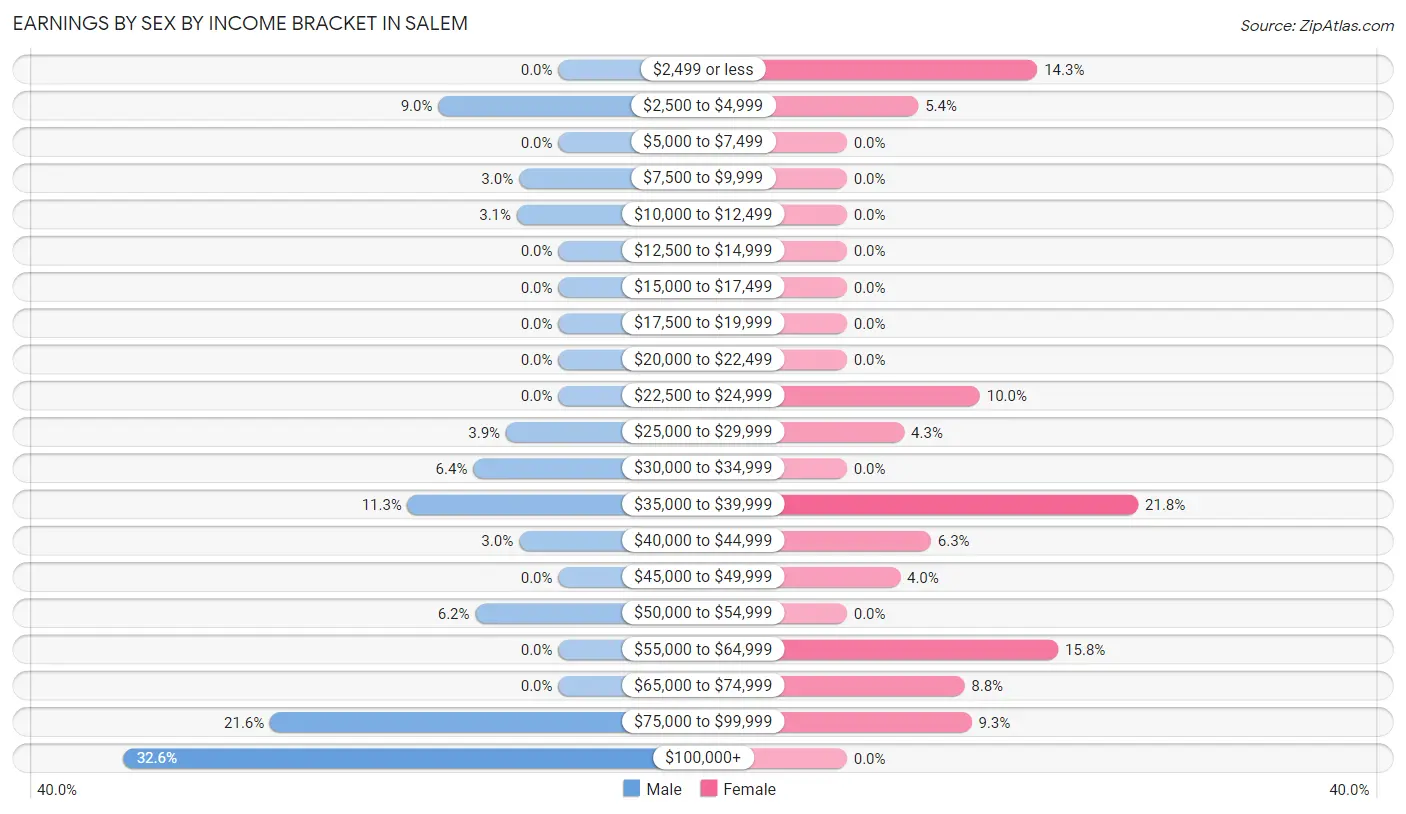
Earnings by Sex by Income Bracket in Salem
The most common earnings brackets in Salem are $100,000+ for men (199 | 32.6%) and $35,000 to $39,999 for women (208 | 21.8%).
| Income | Male | Female |
| $2,499 or less | 0 (0.0%) | 136 (14.3%) |
| $2,500 to $4,999 | 55 (9.0%) | 51 (5.3%) |
| $5,000 to $7,499 | 0 (0.0%) | 0 (0.0%) |
| $7,500 to $9,999 | 18 (2.9%) | 0 (0.0%) |
| $10,000 to $12,499 | 19 (3.1%) | 0 (0.0%) |
| $12,500 to $14,999 | 0 (0.0%) | 0 (0.0%) |
| $15,000 to $17,499 | 0 (0.0%) | 0 (0.0%) |
| $17,500 to $19,999 | 0 (0.0%) | 0 (0.0%) |
| $20,000 to $22,499 | 0 (0.0%) | 0 (0.0%) |
| $22,500 to $24,999 | 0 (0.0%) | 95 (10.0%) |
| $25,000 to $29,999 | 24 (3.9%) | 41 (4.3%) |
| $30,000 to $34,999 | 39 (6.4%) | 0 (0.0%) |
| $35,000 to $39,999 | 69 (11.3%) | 208 (21.8%) |
| $40,000 to $44,999 | 18 (2.9%) | 60 (6.3%) |
| $45,000 to $49,999 | 0 (0.0%) | 38 (4.0%) |
| $50,000 to $54,999 | 38 (6.2%) | 0 (0.0%) |
| $55,000 to $64,999 | 0 (0.0%) | 151 (15.8%) |
| $65,000 to $74,999 | 0 (0.0%) | 84 (8.8%) |
| $75,000 to $99,999 | 132 (21.6%) | 89 (9.3%) |
| $100,000+ | 199 (32.6%) | 0 (0.0%) |
| Total | 611 (100.0%) | 953 (100.0%) |
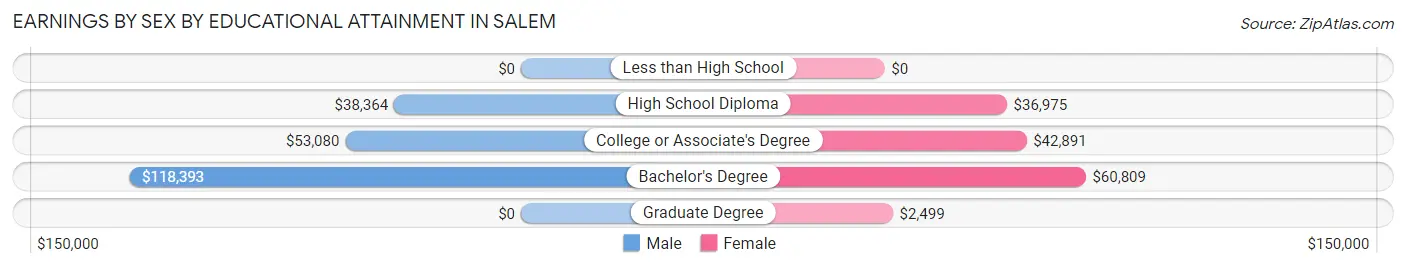
Earnings by Sex by Educational Attainment in Salem
Average earnings in Salem are $82,685 for men and $38,698 for women, a difference of 53.2%. Men with an educational attainment of bachelor's degree enjoy the highest average annual earnings of $118,393, while those with high school diploma education earn the least with $38,364. Women with an educational attainment of bachelor's degree earn the most with the average annual earnings of $60,809, while those with graduate degree education have the smallest earnings of $2,499.
| Educational Attainment | Male Income | Female Income |
| Less than High School | - | - |
| High School Diploma | $38,364 | $36,975 |
| College or Associate's Degree | $53,080 | $42,891 |
| Bachelor's Degree | $118,393 | $60,809 |
| Graduate Degree | - | - |
| Total | $82,685 | $38,698 |
Family Income in Salem
Family Income Brackets in Salem
According to the Salem family income data, there are 158 families falling into the $75,000 to $99,999 income range, which is the most common income bracket and makes up 24.2% of all families.
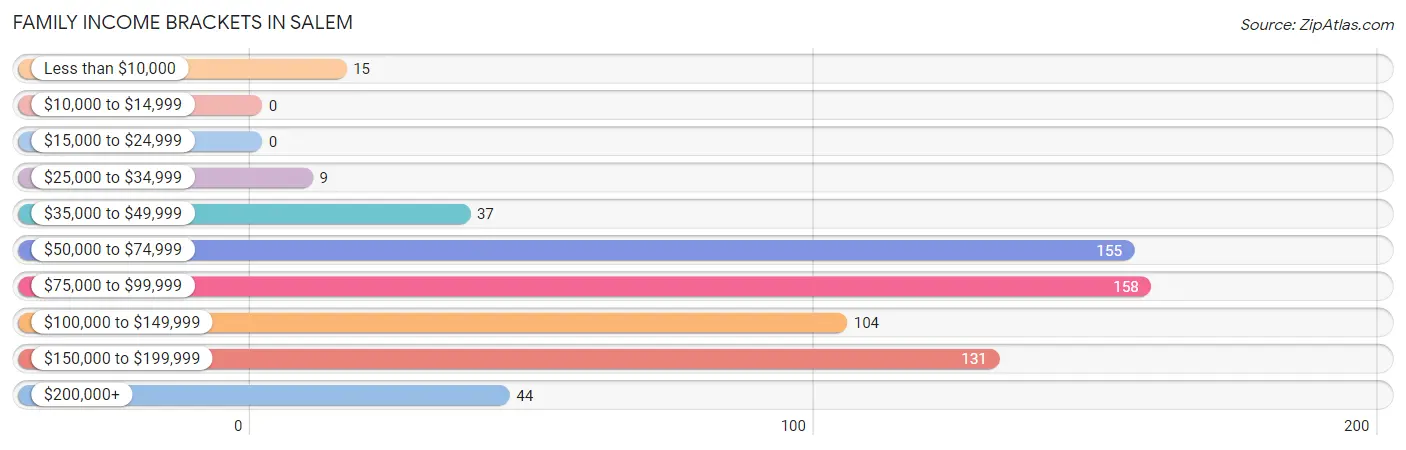
| Income Bracket | # Families | % Families |
| Less than $10,000 | 15 | 2.3% |
| $10,000 to $14,999 | 0 | 0.0% |
| $15,000 to $24,999 | 0 | 0.0% |
| $25,000 to $34,999 | 9 | 1.4% |
| $35,000 to $49,999 | 37 | 5.7% |
| $50,000 to $74,999 | 155 | 23.7% |
| $75,000 to $99,999 | 158 | 24.2% |
| $100,000 to $149,999 | 104 | 15.9% |
| $150,000 to $199,999 | 131 | 20.1% |
| $200,000+ | 44 | 6.7% |
Family Income by Famaliy Size in Salem
4-person families (96 | 14.7%) account for the highest median family income in Salem with $192,697 per family, while 4-person families (96 | 14.7%) have the highest median income of $48,174 per family member.
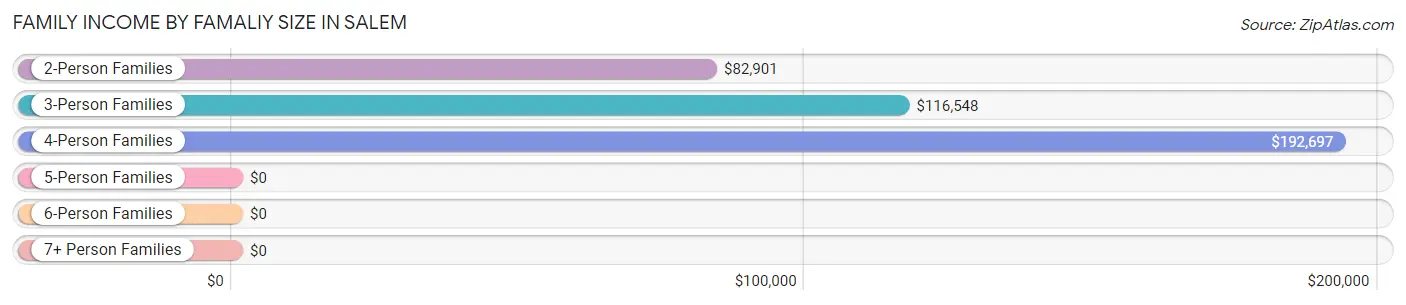
| Income Bracket | # Families | Median Income |
| 2-Person Families | 446 (68.3%) | $82,901 |
| 3-Person Families | 102 (15.6%) | $116,548 |
| 4-Person Families | 96 (14.7%) | $192,697 |
| 5-Person Families | 0 (0.0%) | $0 |
| 6-Person Families | 9 (1.4%) | $0 |
| 7+ Person Families | 0 (0.0%) | $0 |
| Total | 653 (100.0%) | $88,110 |
Family Income by Number of Earners in Salem
The median family income in Salem is $88,110, with families comprising 3+ earners (72) having the highest median family income of $193,355, while families with no earners (64) have the lowest median family income of $59,318, accounting for 11.0% and 9.8% of families, respectively.
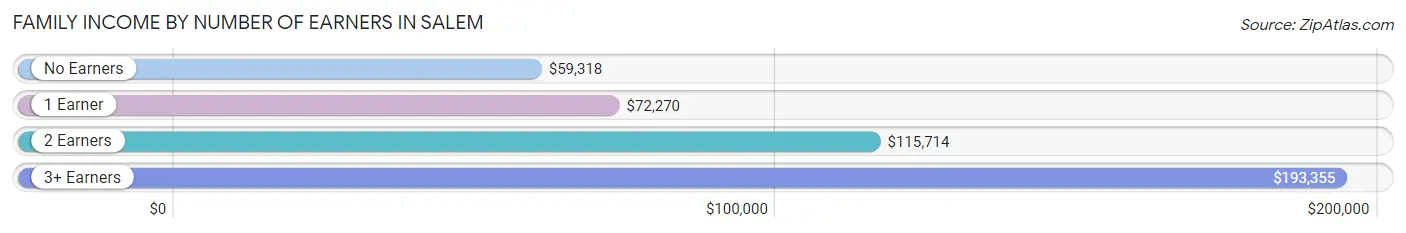
| Number of Earners | # Families | Median Income |
| No Earners | 64 (9.8%) | $59,318 |
| 1 Earner | 247 (37.8%) | $72,270 |
| 2 Earners | 270 (41.3%) | $115,714 |
| 3+ Earners | 72 (11.0%) | $193,355 |
| Total | 653 (100.0%) | $88,110 |
Household Income in Salem
Household Income Brackets in Salem
With 289 households falling in the category, the $75,000 to $99,999 income range is the most frequent in Salem, accounting for 27.2% of all households.
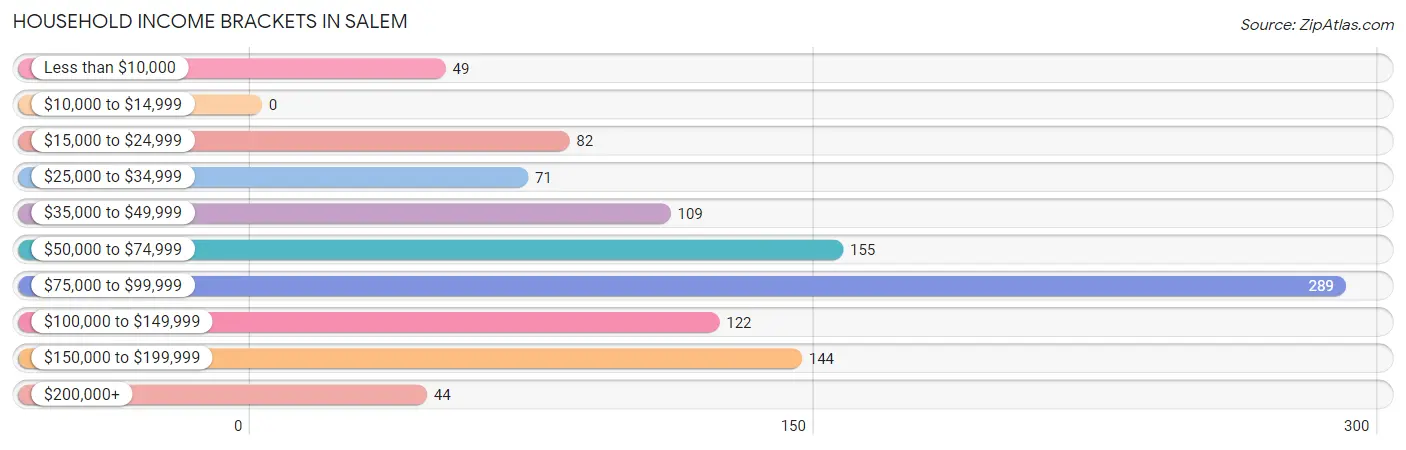
| Income Bracket | # Households | % Households |
| Less than $10,000 | 49 | 4.6% |
| $10,000 to $14,999 | 0 | 0.0% |
| $15,000 to $24,999 | 82 | 7.7% |
| $25,000 to $34,999 | 71 | 6.7% |
| $35,000 to $49,999 | 109 | 10.2% |
| $50,000 to $74,999 | 155 | 14.6% |
| $75,000 to $99,999 | 289 | 27.2% |
| $100,000 to $149,999 | 122 | 11.5% |
| $150,000 to $199,999 | 144 | 13.5% |
| $200,000+ | 44 | 4.1% |
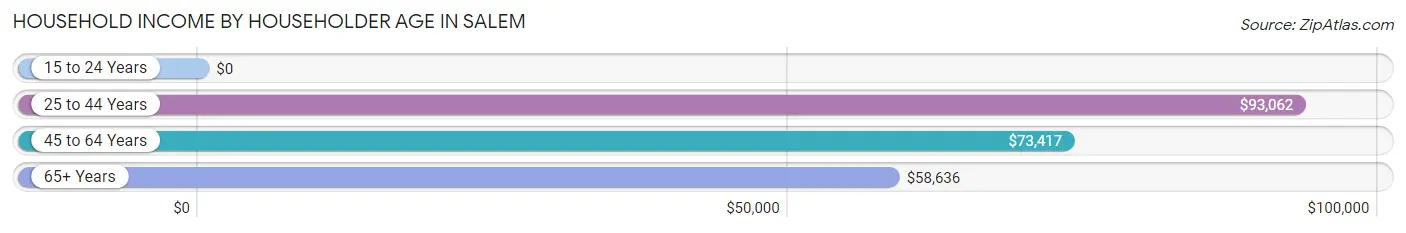
Household Income by Householder Age in Salem
The median household income in Salem is $83,426, with the highest median household income of $93,062 found in the 25 to 44 years age bracket for the primary householder. A total of 343 households (32.2%) fall into this category.
| Income Bracket | # Households | Median Income |
| 15 to 24 Years | 0 (0.0%) | $0 |
| 25 to 44 Years | 343 (32.2%) | $93,062 |
| 45 to 64 Years | 425 (39.9%) | $73,417 |
| 65+ Years | 296 (27.8%) | $58,636 |
| Total | 1,064 (100.0%) | $83,426 |
Poverty in Salem
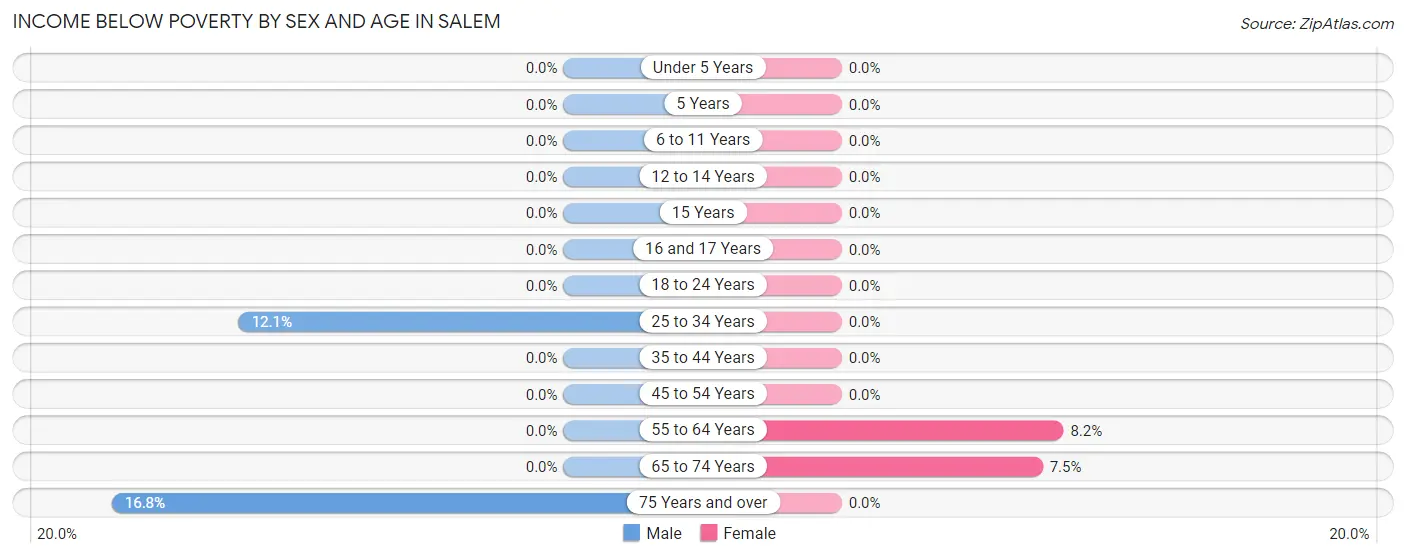
Income Below Poverty by Sex and Age in Salem
With 5.0% poverty level for males and 2.3% for females among the residents of Salem, 75 year old and over males and 55 to 64 year old females are the most vulnerable to poverty, with 29 males (16.8%) and 19 females (8.2%) in their respective age groups living below the poverty level.
| Age Bracket | Male | Female |
| Under 5 Years | 0 (0.0%) | 0 (0.0%) |
| 5 Years | 0 (0.0%) | 0 (0.0%) |
| 6 to 11 Years | 0 (0.0%) | 0 (0.0%) |
| 12 to 14 Years | 0 (0.0%) | 0 (0.0%) |
| 15 Years | 0 (0.0%) | 0 (0.0%) |
| 16 and 17 Years | 0 (0.0%) | 0 (0.0%) |
| 18 to 24 Years | 0 (0.0%) | 0 (0.0%) |
| 25 to 34 Years | 20 (12.0%) | 0 (0.0%) |
| 35 to 44 Years | 0 (0.0%) | 0 (0.0%) |
| 45 to 54 Years | 0 (0.0%) | 0 (0.0%) |
| 55 to 64 Years | 0 (0.0%) | 19 (8.2%) |
| 65 to 74 Years | 0 (0.0%) | 15 (7.5%) |
| 75 Years and over | 29 (16.8%) | 0 (0.0%) |
| Total | 49 (5.0%) | 34 (2.3%) |
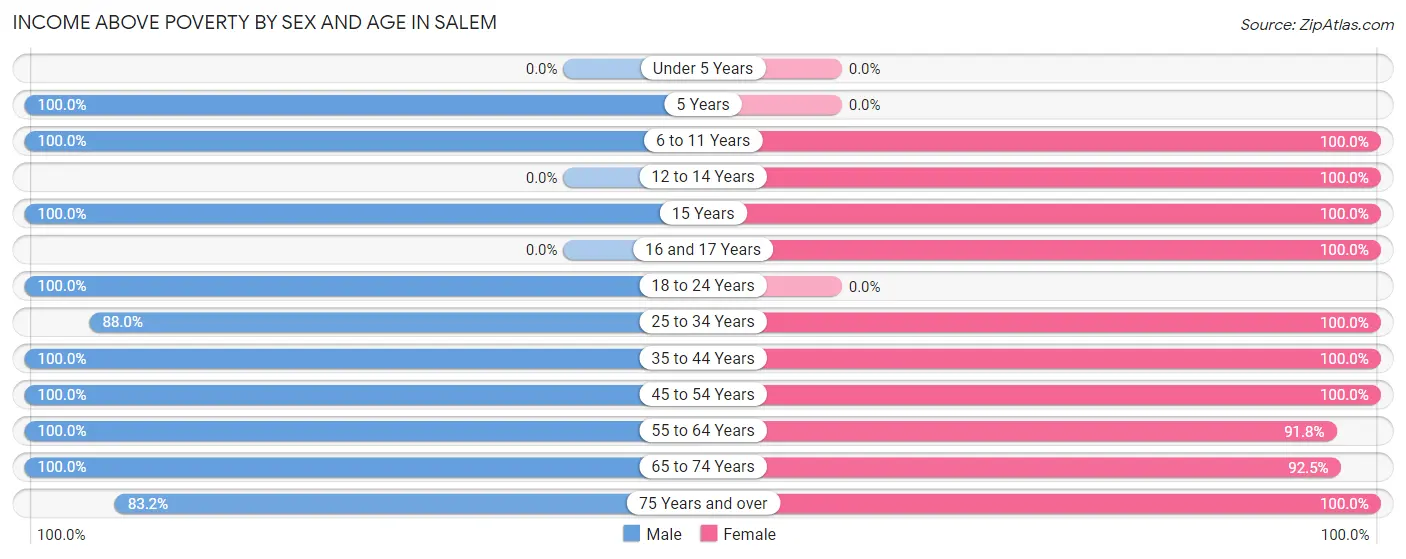
Income Above Poverty by Sex and Age in Salem
According to the poverty statistics in Salem, males aged 5 years and females aged 6 to 11 years are the age groups that are most secure financially, with 100.0% of males and 100.0% of females in these age groups living above the poverty line.
| Age Bracket | Male | Female |
| Under 5 Years | 0 (0.0%) | 0 (0.0%) |
| 5 Years | 21 (100.0%) | 0 (0.0%) |
| 6 to 11 Years | 28 (100.0%) | 24 (100.0%) |
| 12 to 14 Years | 0 (0.0%) | 70 (100.0%) |
| 15 Years | 33 (100.0%) | 32 (100.0%) |
| 16 and 17 Years | 0 (0.0%) | 63 (100.0%) |
| 18 to 24 Years | 19 (100.0%) | 0 (0.0%) |
| 25 to 34 Years | 146 (87.9%) | 380 (100.0%) |
| 35 to 44 Years | 137 (100.0%) | 101 (100.0%) |
| 45 to 54 Years | 140 (100.0%) | 325 (100.0%) |
| 55 to 64 Years | 178 (100.0%) | 212 (91.8%) |
| 65 to 74 Years | 77 (100.0%) | 186 (92.5%) |
| 75 Years and over | 144 (83.2%) | 77 (100.0%) |
| Total | 923 (95.0%) | 1,470 (97.7%) |
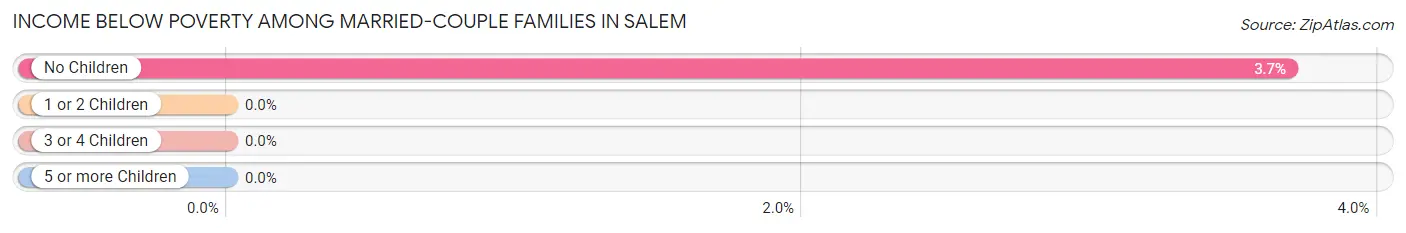
Income Below Poverty Among Married-Couple Families in Salem
The poverty statistics for married-couple families in Salem show that 2.6% or 15 of the total 573 families live below the poverty line. Families with no children have the highest poverty rate of 3.7%, comprising of 15 families. On the other hand, families with 1 or 2 children have the lowest poverty rate of 0.0%, which includes 0 families.
| Children | Above Poverty | Below Poverty |
| No Children | 391 (96.3%) | 15 (3.7%) |
| 1 or 2 Children | 158 (100.0%) | 0 (0.0%) |
| 3 or 4 Children | 9 (100.0%) | 0 (0.0%) |
| 5 or more Children | 0 (0.0%) | 0 (0.0%) |
| Total | 558 (97.4%) | 15 (2.6%) |
Income Below Poverty Among Single-Parent Households in Salem
| Children | Single Father | Single Mother |
| No Children | 0 (0.0%) | 0 (0.0%) |
| 1 or 2 Children | 0 (0.0%) | 0 (0.0%) |
| 3 or 4 Children | 0 (0.0%) | 0 (0.0%) |
| 5 or more Children | 0 (0.0%) | 0 (0.0%) |
| Total | 0 (0.0%) | 0 (0.0%) |
Income Below Poverty Among Married-Couple vs Single-Parent Households in Salem
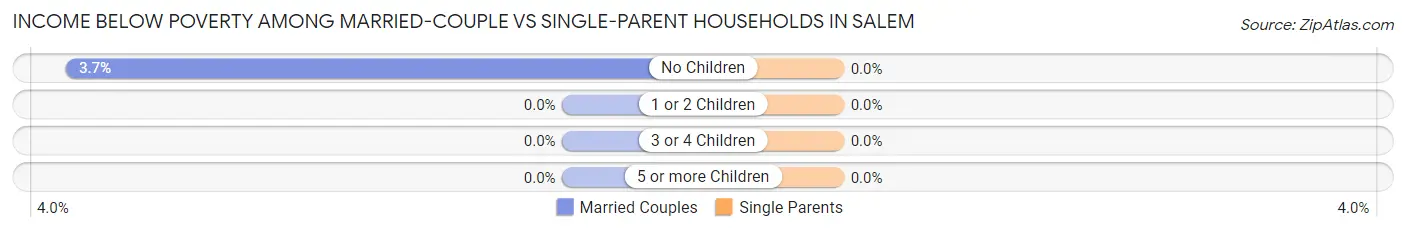
| Children | Married-Couple Families | Single-Parent Households |
| No Children | 15 (3.7%) | 0 (0.0%) |
| 1 or 2 Children | 0 (0.0%) | 0 (0.0%) |
| 3 or 4 Children | 0 (0.0%) | 0 (0.0%) |
| 5 or more Children | 0 (0.0%) | 0 (0.0%) |
| Total | 15 (2.6%) | 0 (0.0%) |
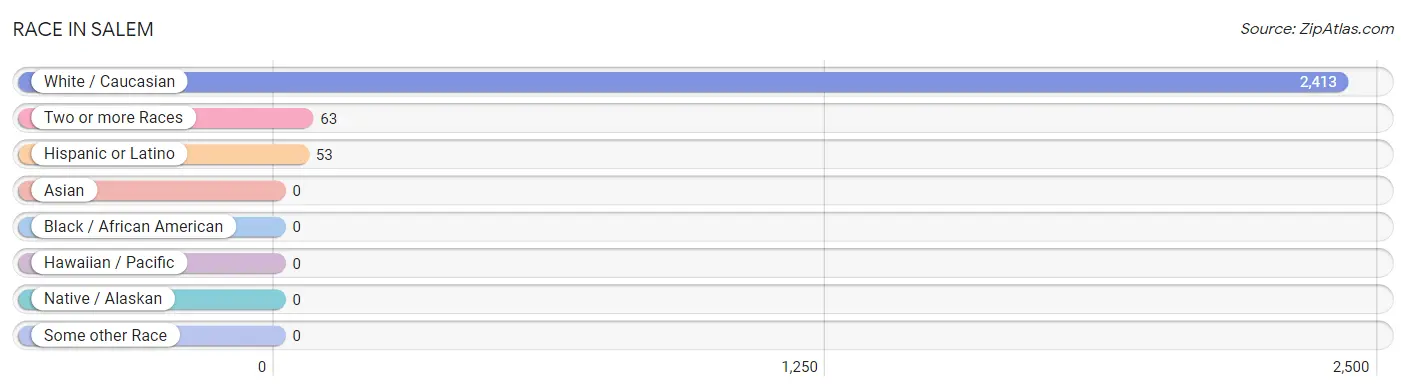
Race in Salem
The most populous races in Salem are White / Caucasian (2,413 | 97.5%), Two or more Races (63 | 2.5%), and Hispanic or Latino (53 | 2.1%).
| Race | # Population | % Population |
| Asian | 0 | 0.0% |
| Black / African American | 0 | 0.0% |
| Hawaiian / Pacific | 0 | 0.0% |
| Hispanic or Latino | 53 | 2.1% |
| Native / Alaskan | 0 | 0.0% |
| White / Caucasian | 2,413 | 97.5% |
| Two or more Races | 63 | 2.5% |
| Some other Race | 0 | 0.0% |
| Total | 2,476 | 100.0% |
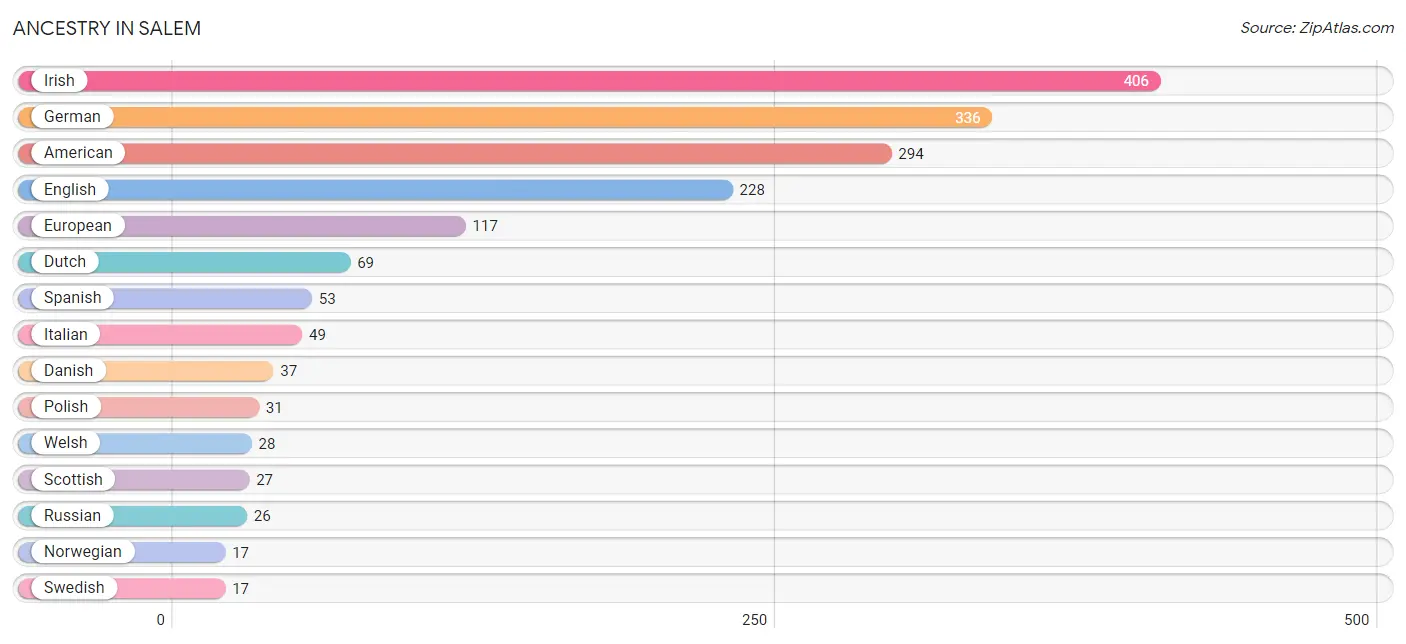
Ancestry in Salem
The most populous ancestries reported in Salem are Irish (406 | 16.4%), German (336 | 13.6%), American (294 | 11.9%), English (228 | 9.2%), and European (117 | 4.7%), together accounting for 55.8% of all Salem residents.
| Ancestry | # Population | % Population |
| American | 294 | 11.9% |
| Austrian | 10 | 0.4% |
| Creek | 12 | 0.5% |
| Danish | 37 | 1.5% |
| Dutch | 69 | 2.8% |
| English | 228 | 9.2% |
| European | 117 | 4.7% |
| French | 9 | 0.4% |
| German | 336 | 13.6% |
| Irish | 406 | 16.4% |
| Italian | 49 | 2.0% |
| Norwegian | 17 | 0.7% |
| Polish | 31 | 1.3% |
| Russian | 26 | 1.1% |
| Scotch-Irish | 9 | 0.4% |
| Scottish | 27 | 1.1% |
| Spanish | 53 | 2.1% |
| Swedish | 17 | 0.7% |
| Ukrainian | 14 | 0.6% |
| Welsh | 28 | 1.1% | View All 20 Rows |
Immigrants in Salem
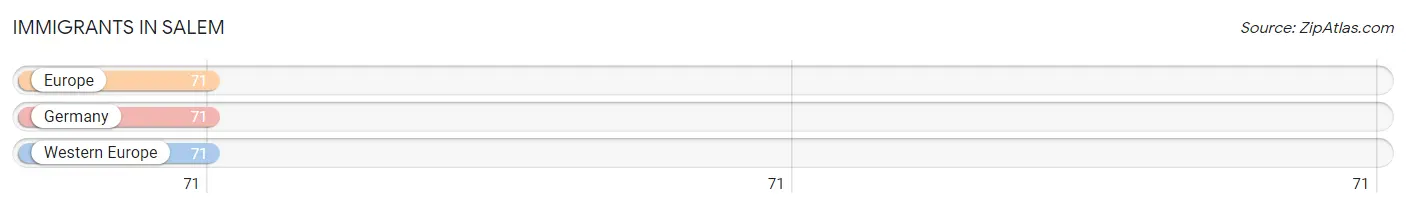
The most numerous immigrant groups reported in Salem came from Europe (71 | 2.9%), Germany (71 | 2.9%), and Western Europe (71 | 2.9%), together accounting for 8.6% of all Salem residents.
| Immigration Origin | # Population | % Population |
| Europe | 71 | 2.9% |
| Germany | 71 | 2.9% |
| Western Europe | 71 | 2.9% | View All 3 Rows |
Sex and Age in Salem
Sex and Age in Salem
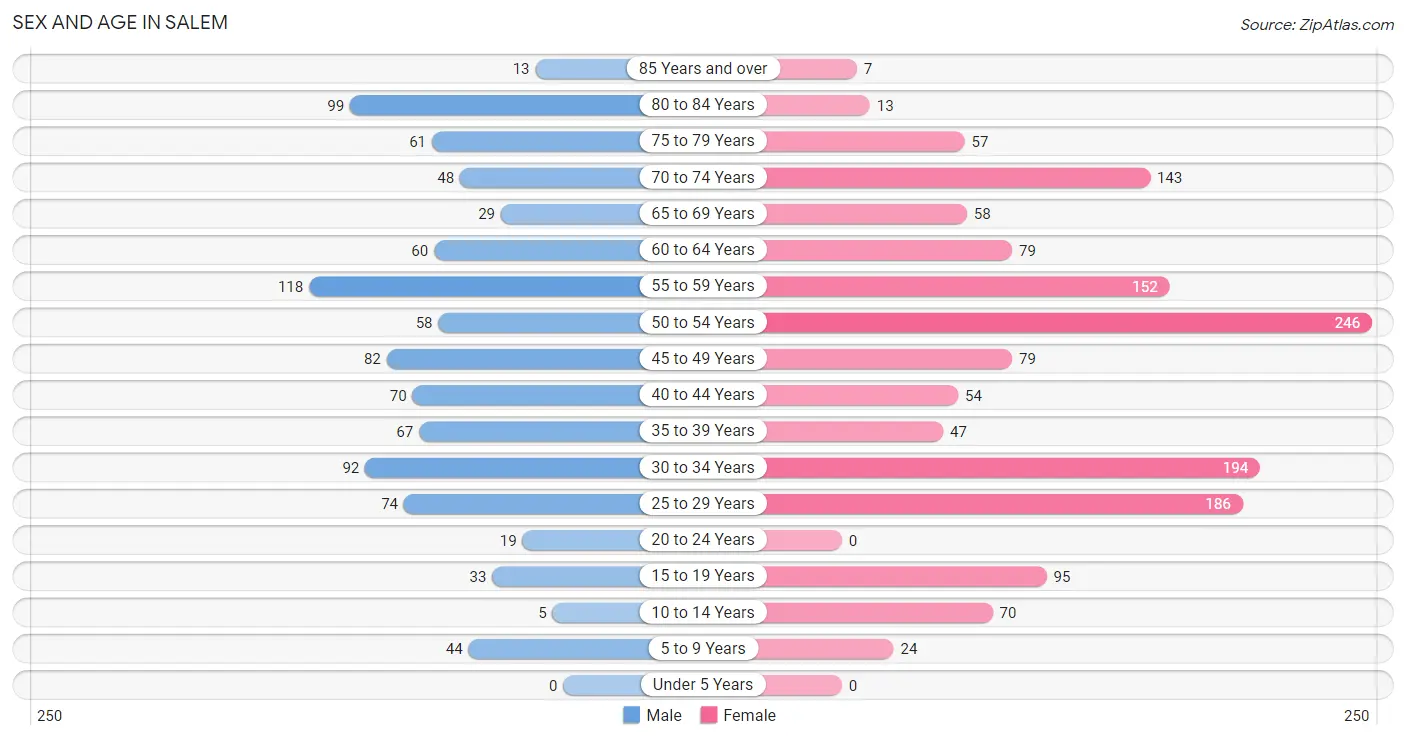
The most populous age groups in Salem are 55 to 59 Years (118 | 12.1%) for men and 50 to 54 Years (246 | 16.4%) for women.
| Age Bracket | Male | Female |
| Under 5 Years | 0 (0.0%) | 0 (0.0%) |
| 5 to 9 Years | 44 (4.5%) | 24 (1.6%) |
| 10 to 14 Years | 5 (0.5%) | 70 (4.6%) |
| 15 to 19 Years | 33 (3.4%) | 95 (6.3%) |
| 20 to 24 Years | 19 (1.9%) | 0 (0.0%) |
| 25 to 29 Years | 74 (7.6%) | 186 (12.4%) |
| 30 to 34 Years | 92 (9.5%) | 194 (12.9%) |
| 35 to 39 Years | 67 (6.9%) | 47 (3.1%) |
| 40 to 44 Years | 70 (7.2%) | 54 (3.6%) |
| 45 to 49 Years | 82 (8.4%) | 79 (5.2%) |
| 50 to 54 Years | 58 (6.0%) | 246 (16.4%) |
| 55 to 59 Years | 118 (12.1%) | 152 (10.1%) |
| 60 to 64 Years | 60 (6.2%) | 79 (5.2%) |
| 65 to 69 Years | 29 (3.0%) | 58 (3.9%) |
| 70 to 74 Years | 48 (4.9%) | 143 (9.5%) |
| 75 to 79 Years | 61 (6.3%) | 57 (3.8%) |
| 80 to 84 Years | 99 (10.2%) | 13 (0.9%) |
| 85 Years and over | 13 (1.3%) | 7 (0.5%) |
| Total | 972 (100.0%) | 1,504 (100.0%) |
Families and Households in Salem
Median Family Size in Salem
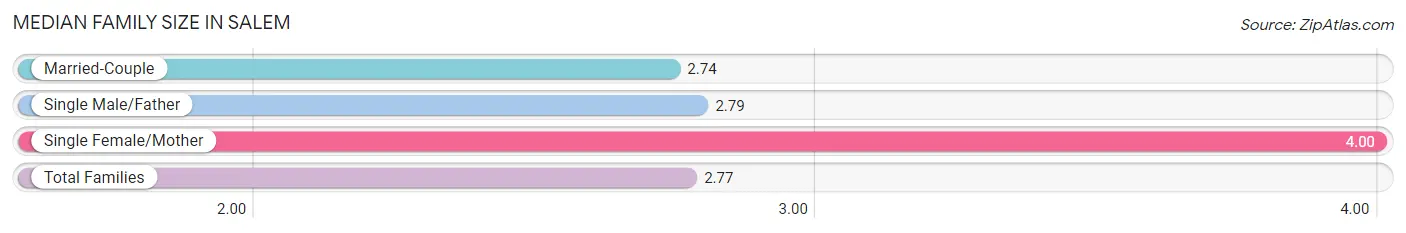
The median family size in Salem is 2.77 persons per family, with single female/mother families (12 | 1.8%) accounting for the largest median family size of 4 persons per family. On the other hand, married-couple families (573 | 87.7%) represent the smallest median family size with 2.74 persons per family.
| Family Type | # Families | Family Size |
| Married-Couple | 573 (87.7%) | 2.74 |
| Single Male/Father | 68 (10.4%) | 2.79 |
| Single Female/Mother | 12 (1.8%) | 4.00 |
| Total Families | 653 (100.0%) | 2.77 |
Median Household Size in Salem
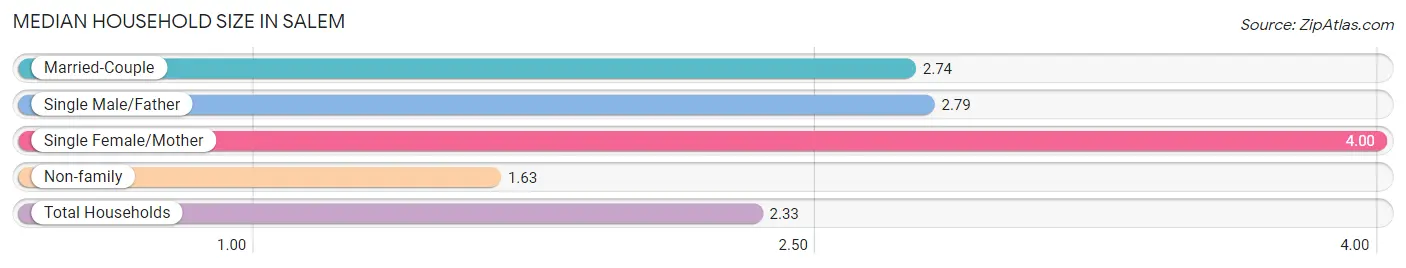
The median household size in Salem is 2.33 persons per household, with single female/mother households (12 | 1.1%) accounting for the largest median household size of 4 persons per household. non-family households (411 | 38.6%) represent the smallest median household size with 1.63 persons per household.
| Household Type | # Households | Household Size |
| Married-Couple | 573 (53.8%) | 2.74 |
| Single Male/Father | 68 (6.4%) | 2.79 |
| Single Female/Mother | 12 (1.1%) | 4.00 |
| Non-family | 411 (38.6%) | 1.63 |
| Total Households | 1,064 (100.0%) | 2.33 |
Household Size by Marriage Status in Salem
Out of a total of 1,064 households in Salem, 653 (61.4%) are family households, while 411 (38.6%) are nonfamily households. The most numerous type of family households are 2-person households, comprising 446, and the most common type of nonfamily households are 1-person households, comprising 278.
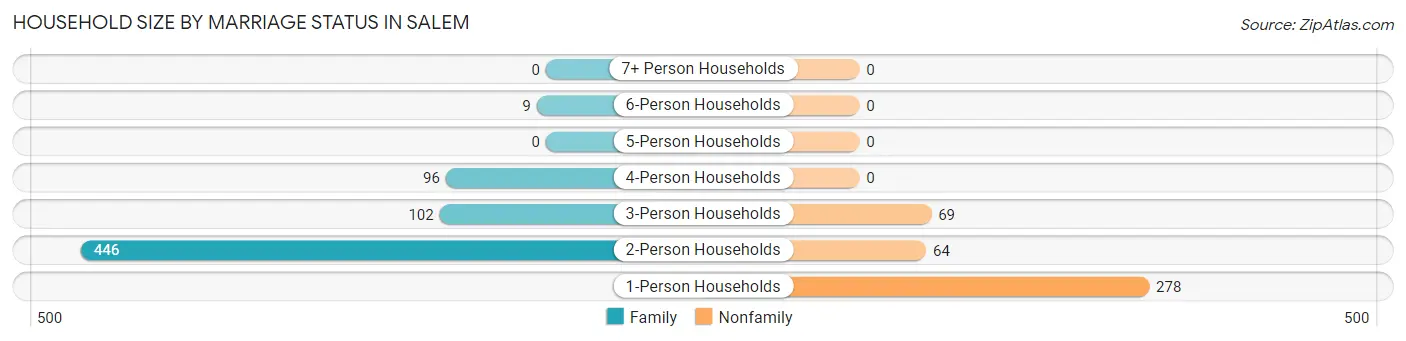
| Household Size | Family Households | Nonfamily Households |
| 1-Person Households | - | 278 (26.1%) |
| 2-Person Households | 446 (41.9%) | 64 (6.0%) |
| 3-Person Households | 102 (9.6%) | 69 (6.5%) |
| 4-Person Households | 96 (9.0%) | 0 (0.0%) |
| 5-Person Households | 0 (0.0%) | 0 (0.0%) |
| 6-Person Households | 9 (0.9%) | 0 (0.0%) |
| 7+ Person Households | 0 (0.0%) | 0 (0.0%) |
| Total | 653 (61.4%) | 411 (38.6%) |
Female Fertility in Salem
Fertility by Age in Salem
| Age Bracket | Women with Births | Births / 1,000 Women |
| 15 to 19 years | 0 (0.0%) | 0.0 |
| 20 to 34 years | 0 (0.0%) | 0.0 |
| 35 to 50 years | 0 (0.0%) | 0.0 |
| Total | 0 (0.0%) | 0.0 |
Fertility by Age by Marriage Status in Salem
| Age Bracket | Married | Unmarried |
| 15 to 19 years | 0 (0.0%) | 0 (0.0%) |
| 20 to 34 years | 0 (0.0%) | 0 (0.0%) |
| 35 to 50 years | 0 (0.0%) | 0 (0.0%) |
| Total | 0 (0.0%) | 0 (0.0%) |
Fertility by Education in Salem
| Educational Attainment | Women with Births | Births / 1,000 Women |
| Less than High School | 0 (0.0%) | 0.0 |
| High School Diploma | 0 (0.0%) | 0.0 |
| College or Associate's Degree | 0 (0.0%) | 0.0 |
| Bachelor's Degree | 0 (0.0%) | 0.0 |
| Graduate Degree | 0 (0.0%) | 0.0 |
| Total | 0 (0.0%) | 0.0 |
Fertility by Education by Marriage Status in Salem
| Educational Attainment | Married | Unmarried |
| Less than High School | 0 (0.0%) | 0 (0.0%) |
| High School Diploma | 0 (0.0%) | 0 (0.0%) |
| College or Associate's Degree | 0 (0.0%) | 0 (0.0%) |
| Bachelor's Degree | 0 (0.0%) | 0 (0.0%) |
| Graduate Degree | 0 (0.0%) | 0 (0.0%) |
| Total | 0 (0.0%) | 0 (0.0%) |
Employment Characteristics in Salem
Employment by Class of Employer in Salem
Among the 1,429 employed individuals in Salem, private company employees (1,117 | 78.2%), self-employed (not incorporated) (190 | 13.3%), and not-for-profit organizations (78 | 5.5%) make up the most common classes of employment.
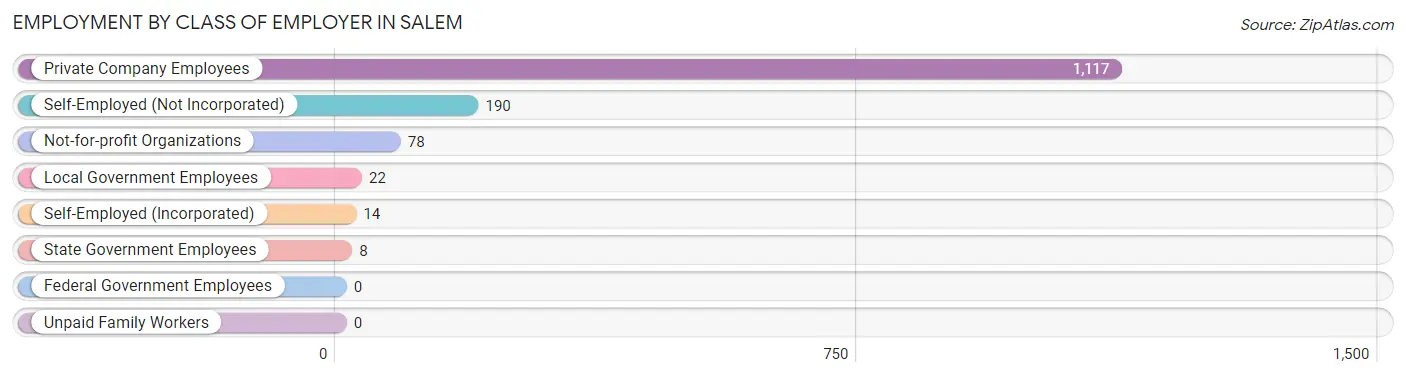
| Employer Class | # Employees | % Employees |
| Private Company Employees | 1,117 | 78.2% |
| Self-Employed (Incorporated) | 14 | 1.0% |
| Self-Employed (Not Incorporated) | 190 | 13.3% |
| Not-for-profit Organizations | 78 | 5.5% |
| Local Government Employees | 22 | 1.5% |
| State Government Employees | 8 | 0.6% |
| Federal Government Employees | 0 | 0.0% |
| Unpaid Family Workers | 0 | 0.0% |
| Total | 1,429 | 100.0% |
Employment Status by Age in Salem
According to the labor force statistics for Salem, out of the total population over 16 years of age (2,268), 68.6% or 1,556 individuals are in the labor force, with 0.6% or 9 of them unemployed. The age group with the highest labor force participation rate is 20 to 24 years, with 100.0% or 19 individuals in the labor force. Within the labor force, the 45 to 54 years age range has the highest percentage of unemployed individuals, with 2.0% or 9 of them being unemployed.
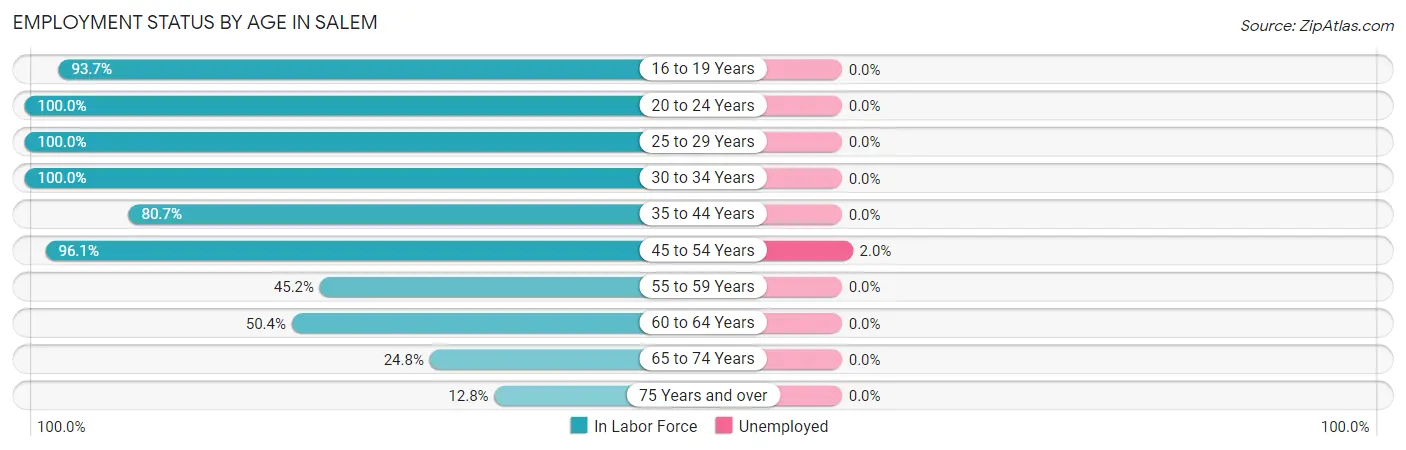
| Age Bracket | In Labor Force | Unemployed |
| 16 to 19 Years | 59 (93.7%) | 0 (0.0%) |
| 20 to 24 Years | 19 (100.0%) | 0 (0.0%) |
| 25 to 29 Years | 260 (100.0%) | 0 (0.0%) |
| 30 to 34 Years | 286 (100.0%) | 0 (0.0%) |
| 35 to 44 Years | 192 (80.7%) | 0 (0.0%) |
| 45 to 54 Years | 447 (96.1%) | 9 (2.0%) |
| 55 to 59 Years | 122 (45.2%) | 0 (0.0%) |
| 60 to 64 Years | 70 (50.4%) | 0 (0.0%) |
| 65 to 74 Years | 69 (24.8%) | 0 (0.0%) |
| 75 Years and over | 32 (12.8%) | 0 (0.0%) |
| Total | 1,556 (68.6%) | 9 (0.6%) |
Employment Status by Educational Attainment in Salem
According to labor force statistics for Salem, 83.1% of individuals (1,378) out of the total population between 25 and 64 years of age (1,658) are in the labor force, with 0.7% or 10 of them being unemployed. The group with the highest labor force participation rate are those with the educational attainment of bachelor's degree or higher, with 93.1% or 549 individuals in the labor force. Within the labor force, individuals with college / associate degree education have the highest percentage of unemployment, with 1.5% or 9 of them being unemployed.
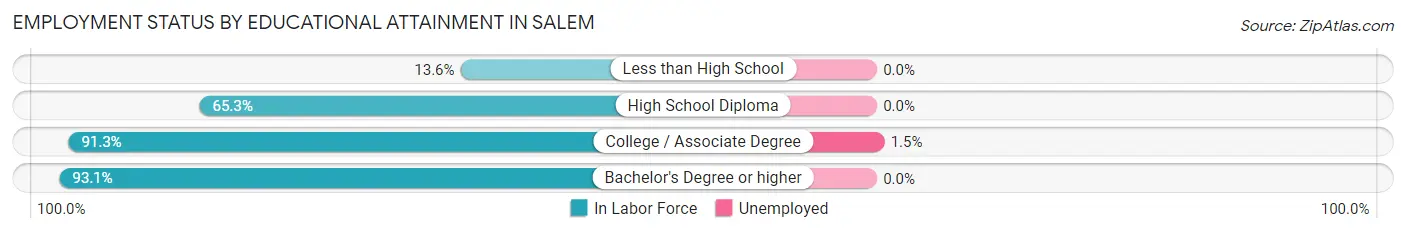
| Educational Attainment | In Labor Force | Unemployed |
| Less than High School | 12 (13.6%) | 0 (0.0%) |
| High School Diploma | 198 (65.3%) | 0 (0.0%) |
| College / Associate Degree | 618 (91.3%) | 10 (1.5%) |
| Bachelor's Degree or higher | 549 (93.1%) | 0 (0.0%) |
| Total | 1,378 (83.1%) | 12 (0.7%) |
Employment Occupations by Sex in Salem
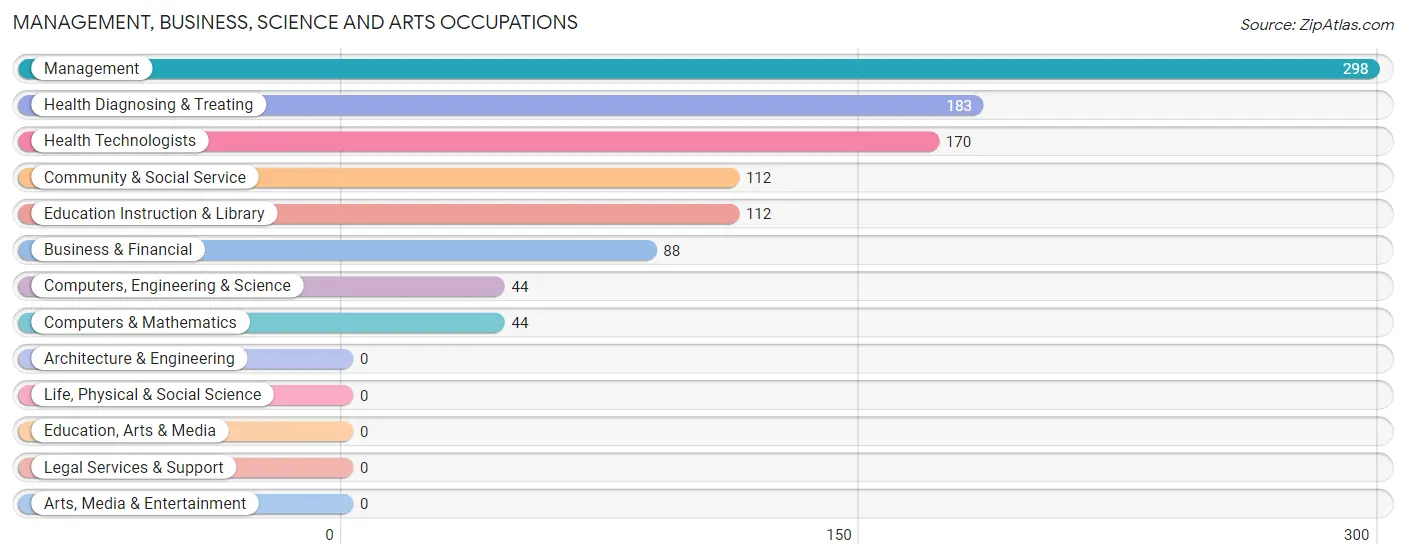
Management, Business, Science and Arts Occupations
The most common Management, Business, Science and Arts occupations in Salem are Management (298 | 19.3%), Health Diagnosing & Treating (183 | 11.8%), Health Technologists (170 | 11.0%), Community & Social Service (112 | 7.2%), and Education Instruction & Library (112 | 7.2%).
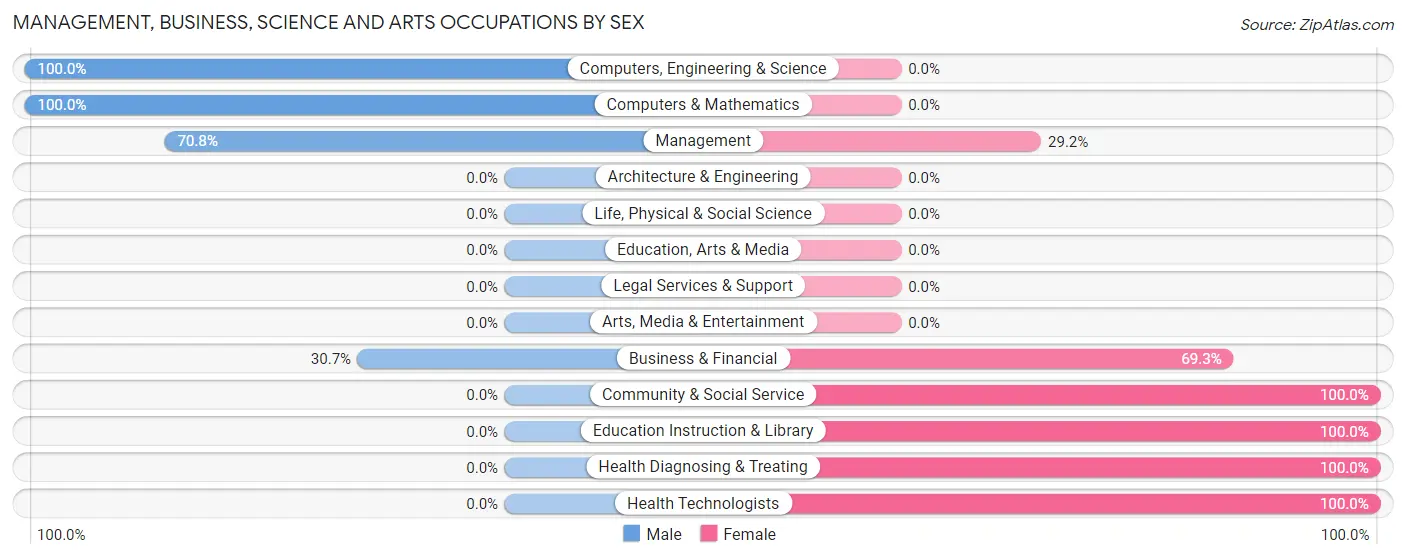
Management, Business, Science and Arts Occupations by Sex
Within the Management, Business, Science and Arts occupations in Salem, the most male-oriented occupations are Computers, Engineering & Science (100.0%), Computers & Mathematics (100.0%), and Management (70.8%), while the most female-oriented occupations are Community & Social Service (100.0%), Education Instruction & Library (100.0%), and Health Diagnosing & Treating (100.0%).
| Occupation | Male | Female |
| Management | 211 (70.8%) | 87 (29.2%) |
| Business & Financial | 27 (30.7%) | 61 (69.3%) |
| Computers, Engineering & Science | 44 (100.0%) | 0 (0.0%) |
| Computers & Mathematics | 44 (100.0%) | 0 (0.0%) |
| Architecture & Engineering | 0 (0.0%) | 0 (0.0%) |
| Life, Physical & Social Science | 0 (0.0%) | 0 (0.0%) |
| Community & Social Service | 0 (0.0%) | 112 (100.0%) |
| Education, Arts & Media | 0 (0.0%) | 0 (0.0%) |
| Legal Services & Support | 0 (0.0%) | 0 (0.0%) |
| Education Instruction & Library | 0 (0.0%) | 112 (100.0%) |
| Arts, Media & Entertainment | 0 (0.0%) | 0 (0.0%) |
| Health Diagnosing & Treating | 0 (0.0%) | 183 (100.0%) |
| Health Technologists | 0 (0.0%) | 170 (100.0%) |
| Total (Category) | 282 (38.9%) | 443 (61.1%) |
| Total (Overall) | 594 (38.4%) | 953 (61.6%) |
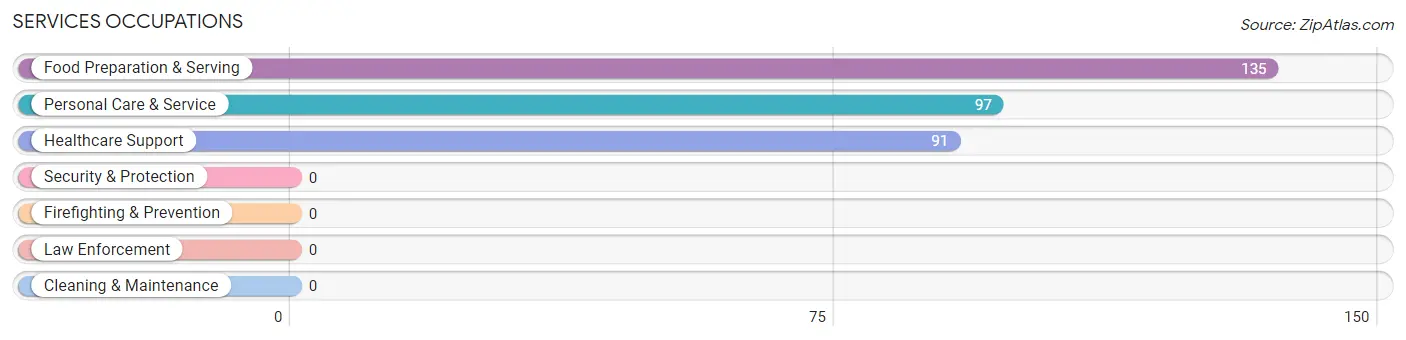
Services Occupations
The most common Services occupations in Salem are Food Preparation & Serving (135 | 8.7%), Personal Care & Service (97 | 6.3%), and Healthcare Support (91 | 5.9%).
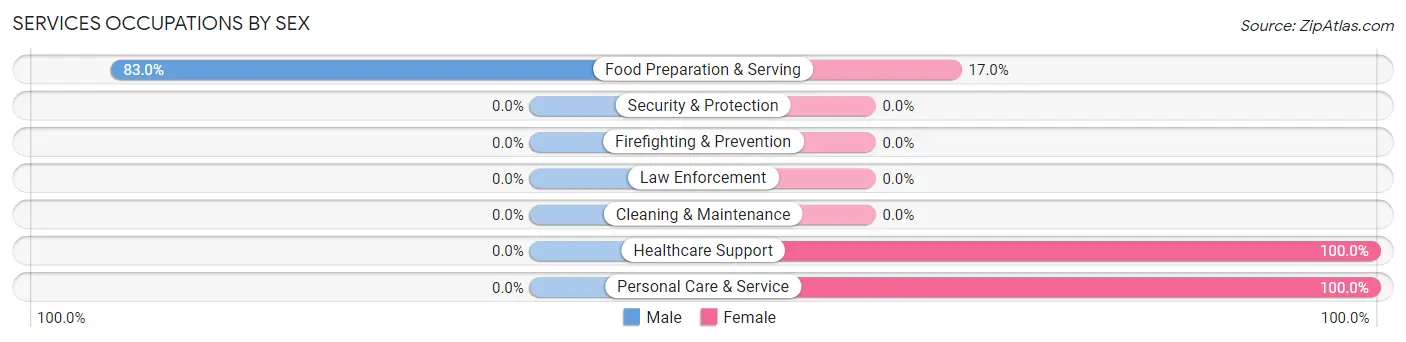
Services Occupations by Sex
| Occupation | Male | Female |
| Healthcare Support | 0 (0.0%) | 91 (100.0%) |
| Security & Protection | 0 (0.0%) | 0 (0.0%) |
| Firefighting & Prevention | 0 (0.0%) | 0 (0.0%) |
| Law Enforcement | 0 (0.0%) | 0 (0.0%) |
| Food Preparation & Serving | 112 (83.0%) | 23 (17.0%) |
| Cleaning & Maintenance | 0 (0.0%) | 0 (0.0%) |
| Personal Care & Service | 0 (0.0%) | 97 (100.0%) |
| Total (Category) | 112 (34.7%) | 211 (65.3%) |
| Total (Overall) | 594 (38.4%) | 953 (61.6%) |
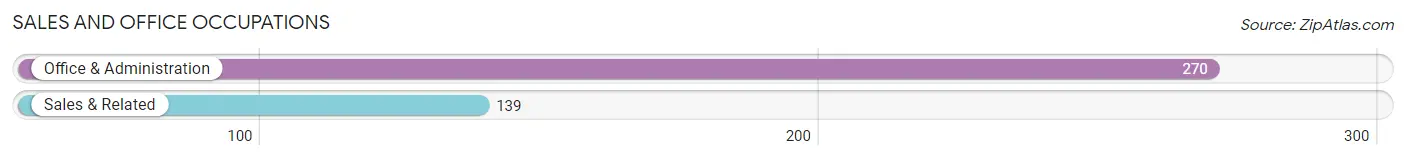
Sales and Office Occupations
The most common Sales and Office occupations in Salem are Office & Administration (270 | 17.4%), and Sales & Related (139 | 9.0%).
Sales and Office Occupations by Sex
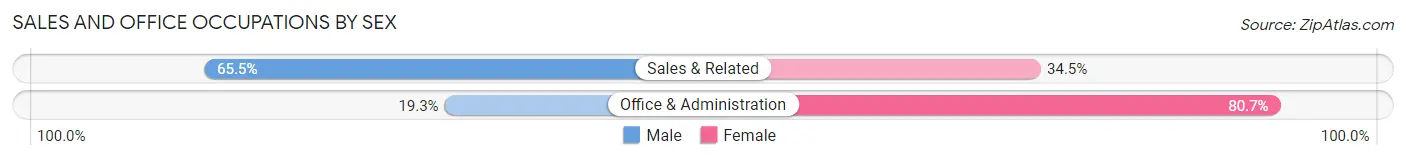
| Occupation | Male | Female |
| Sales & Related | 91 (65.5%) | 48 (34.5%) |
| Office & Administration | 52 (19.3%) | 218 (80.7%) |
| Total (Category) | 143 (35.0%) | 266 (65.0%) |
| Total (Overall) | 594 (38.4%) | 953 (61.6%) |
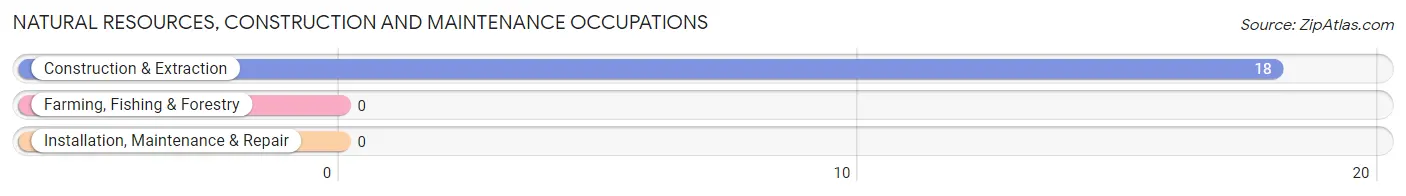
Natural Resources, Construction and Maintenance Occupations
The most common Natural Resources, Construction and Maintenance occupations in Salem are , and Construction & Extraction (18 | 1.2%).
Natural Resources, Construction and Maintenance Occupations by Sex
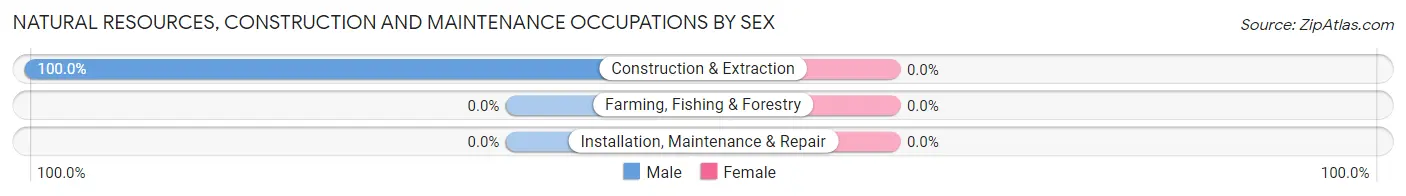
| Occupation | Male | Female |
| Farming, Fishing & Forestry | 0 (0.0%) | 0 (0.0%) |
| Construction & Extraction | 18 (100.0%) | 0 (0.0%) |
| Installation, Maintenance & Repair | 0 (0.0%) | 0 (0.0%) |
| Total (Category) | 18 (100.0%) | 0 (0.0%) |
| Total (Overall) | 594 (38.4%) | 953 (61.6%) |
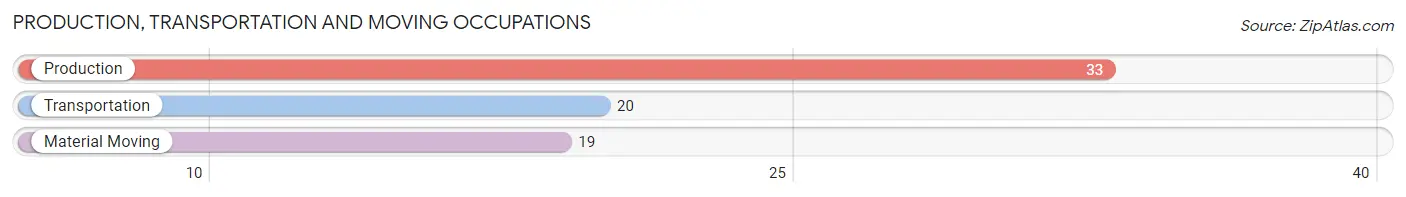
Production, Transportation and Moving Occupations
The most common Production, Transportation and Moving occupations in Salem are Production (33 | 2.1%), Transportation (20 | 1.3%), and Material Moving (19 | 1.2%).
Production, Transportation and Moving Occupations by Sex
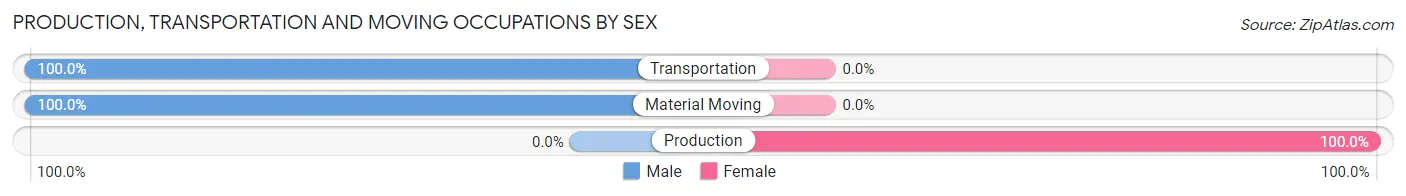
| Occupation | Male | Female |
| Production | 0 (0.0%) | 33 (100.0%) |
| Transportation | 20 (100.0%) | 0 (0.0%) |
| Material Moving | 19 (100.0%) | 0 (0.0%) |
| Total (Category) | 39 (54.2%) | 33 (45.8%) |
| Total (Overall) | 594 (38.4%) | 953 (61.6%) |
Employment Industries by Sex in Salem
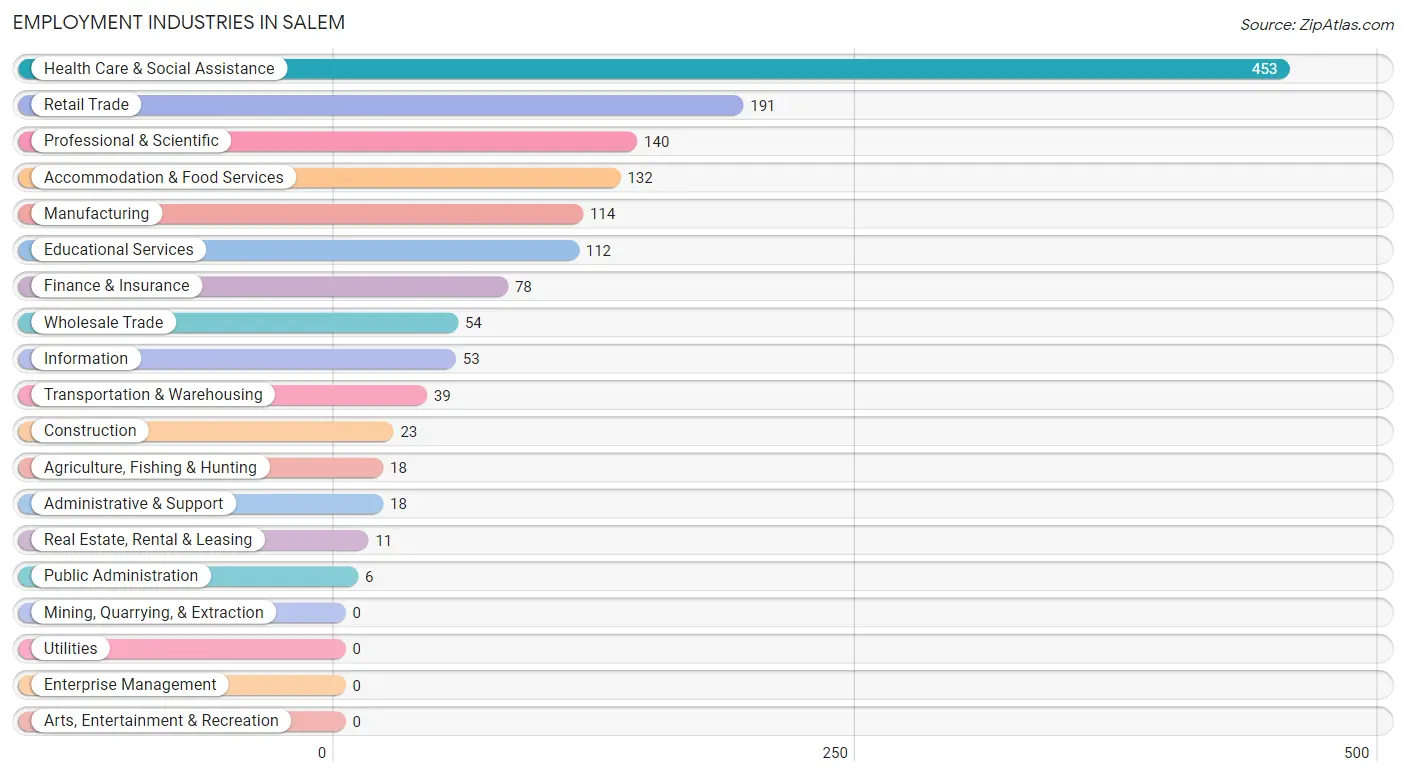
Employment Industries in Salem
The major employment industries in Salem include Health Care & Social Assistance (453 | 29.3%), Retail Trade (191 | 12.3%), Professional & Scientific (140 | 9.0%), Accommodation & Food Services (132 | 8.5%), and Manufacturing (114 | 7.4%).
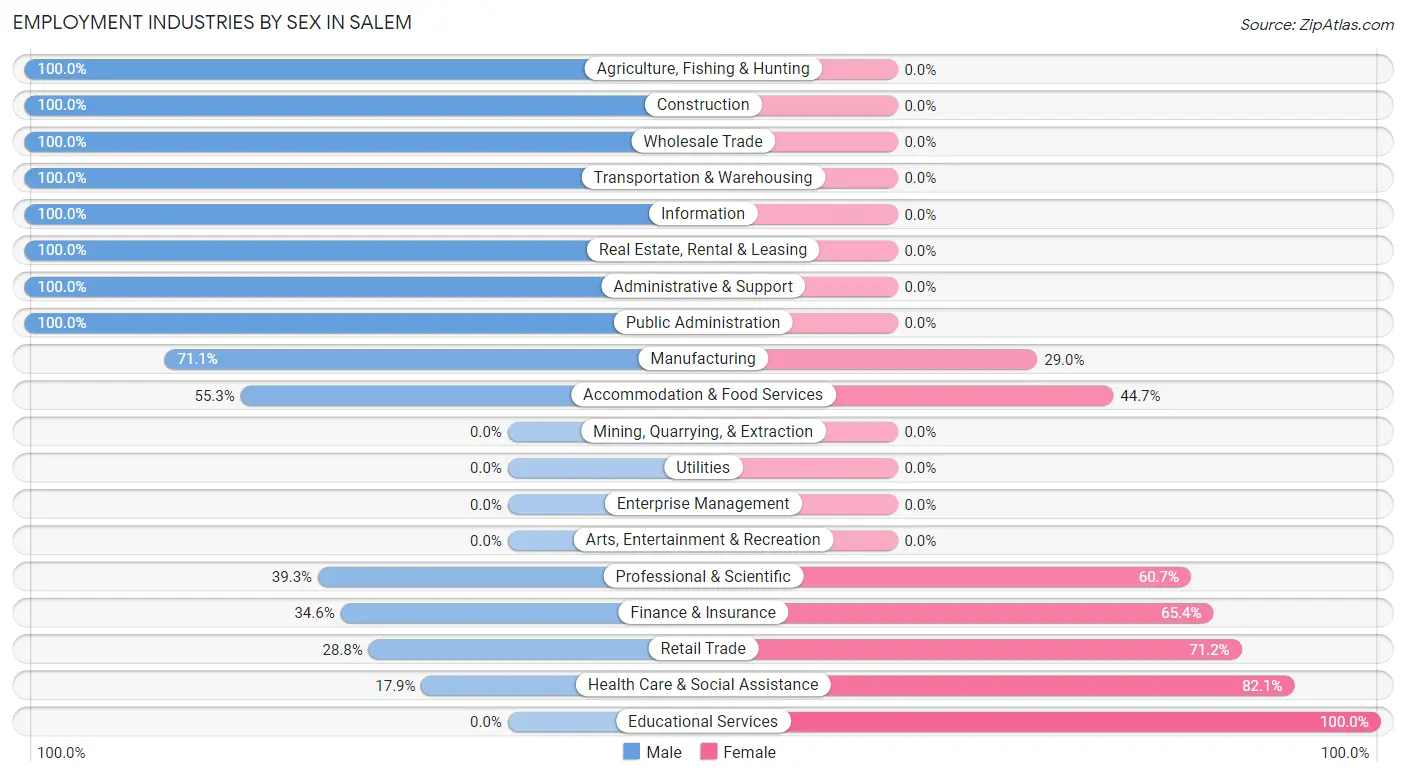
Employment Industries by Sex in Salem
The Salem industries that see more men than women are Agriculture, Fishing & Hunting (100.0%), Construction (100.0%), and Wholesale Trade (100.0%), whereas the industries that tend to have a higher number of women are Educational Services (100.0%), Health Care & Social Assistance (82.1%), and Retail Trade (71.2%).
| Industry | Male | Female |
| Agriculture, Fishing & Hunting | 18 (100.0%) | 0 (0.0%) |
| Mining, Quarrying, & Extraction | 0 (0.0%) | 0 (0.0%) |
| Construction | 23 (100.0%) | 0 (0.0%) |
| Manufacturing | 81 (71.1%) | 33 (28.9%) |
| Wholesale Trade | 54 (100.0%) | 0 (0.0%) |
| Retail Trade | 55 (28.8%) | 136 (71.2%) |
| Transportation & Warehousing | 39 (100.0%) | 0 (0.0%) |
| Utilities | 0 (0.0%) | 0 (0.0%) |
| Information | 53 (100.0%) | 0 (0.0%) |
| Finance & Insurance | 27 (34.6%) | 51 (65.4%) |
| Real Estate, Rental & Leasing | 11 (100.0%) | 0 (0.0%) |
| Professional & Scientific | 55 (39.3%) | 85 (60.7%) |
| Enterprise Management | 0 (0.0%) | 0 (0.0%) |
| Administrative & Support | 18 (100.0%) | 0 (0.0%) |
| Educational Services | 0 (0.0%) | 112 (100.0%) |
| Health Care & Social Assistance | 81 (17.9%) | 372 (82.1%) |
| Arts, Entertainment & Recreation | 0 (0.0%) | 0 (0.0%) |
| Accommodation & Food Services | 73 (55.3%) | 59 (44.7%) |
| Public Administration | 6 (100.0%) | 0 (0.0%) |
| Total | 594 (38.4%) | 953 (61.6%) |
Education in Salem
School Enrollment in Salem
The most common levels of schooling among the 344 students in Salem are high school (163 | 47.4%), college / undergraduate (73 | 21.2%), and elementary school (52 | 15.1%).
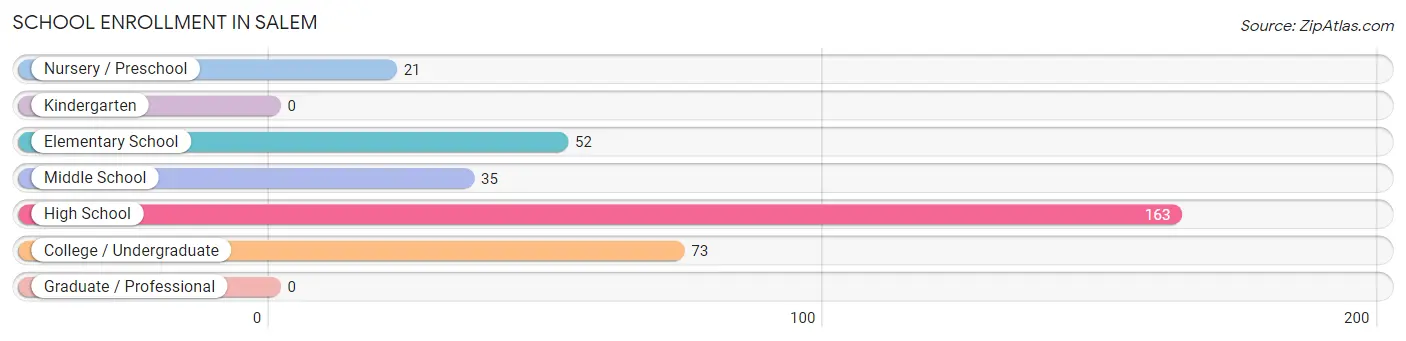
| School Level | # Students | % Students |
| Nursery / Preschool | 21 | 6.1% |
| Kindergarten | 0 | 0.0% |
| Elementary School | 52 | 15.1% |
| Middle School | 35 | 10.2% |
| High School | 163 | 47.4% |
| College / Undergraduate | 73 | 21.2% |
| Graduate / Professional | 0 | 0.0% |
| Total | 344 | 100.0% |
School Enrollment by Age by Funding Source in Salem
Out of a total of 344 students who are enrolled in schools in Salem, 21 (6.1%) attend a private institution, while the remaining 323 (93.9%) are enrolled in public schools. The age group of 5 to 9 year old has the highest likelihood of being enrolled in private schools, with 21 (30.9% in the age bracket) enrolled. Conversely, the age group of 10 to 14 year olds has the lowest likelihood of being enrolled in a private school, with 75 (100.0% in the age bracket) attending a public institution.
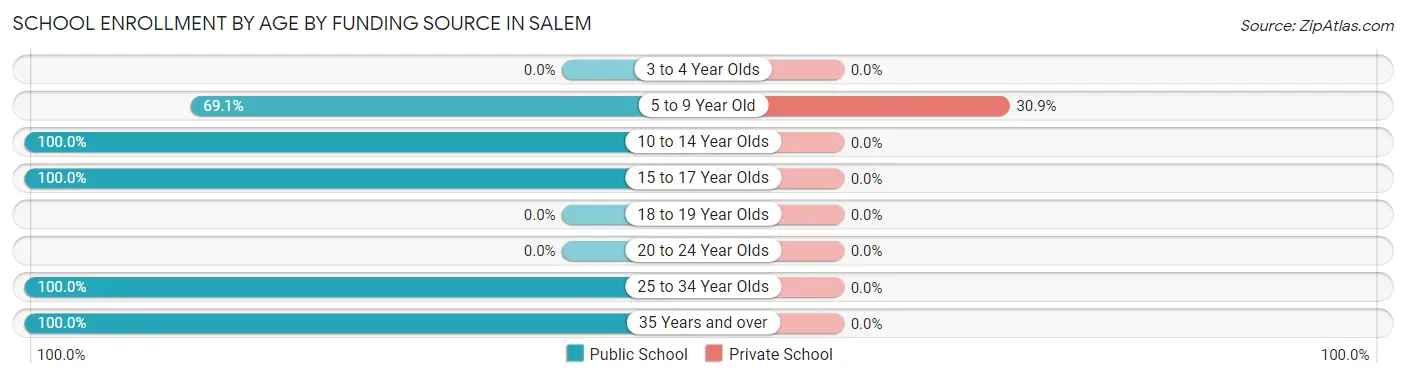
| Age Bracket | Public School | Private School |
| 3 to 4 Year Olds | 0 (0.0%) | 0 (0.0%) |
| 5 to 9 Year Old | 47 (69.1%) | 21 (30.9%) |
| 10 to 14 Year Olds | 75 (100.0%) | 0 (0.0%) |
| 15 to 17 Year Olds | 128 (100.0%) | 0 (0.0%) |
| 18 to 19 Year Olds | 0 (0.0%) | 0 (0.0%) |
| 20 to 24 Year Olds | 0 (0.0%) | 0 (0.0%) |
| 25 to 34 Year Olds | 58 (100.0%) | 0 (0.0%) |
| 35 Years and over | 15 (100.0%) | 0 (0.0%) |
| Total | 323 (93.9%) | 21 (6.1%) |
Educational Attainment by Field of Study in Salem
Science & technology (160 | 23.7%), business (144 | 21.4%), psychology (129 | 19.1%), engineering (81 | 12.0%), and arts & humanities (54 | 8.0%) are the most common fields of study among 674 individuals in Salem who have obtained a bachelor's degree or higher.
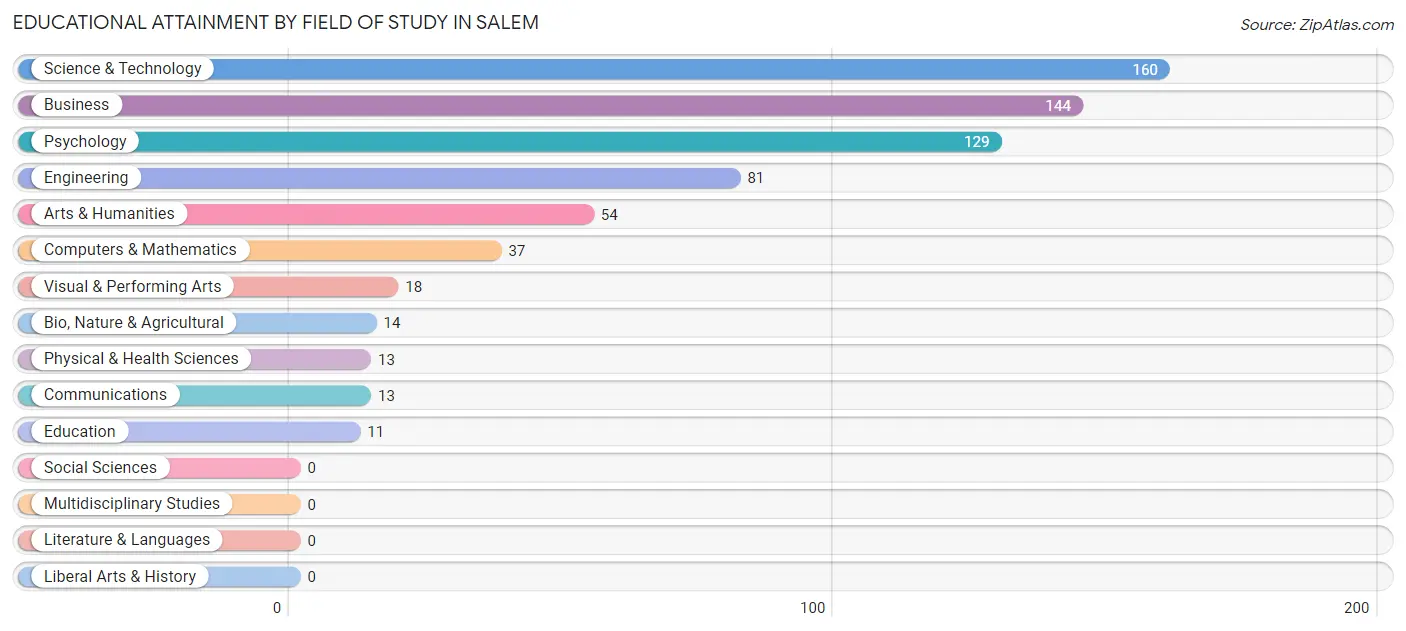
| Field of Study | # Graduates | % Graduates |
| Computers & Mathematics | 37 | 5.5% |
| Bio, Nature & Agricultural | 14 | 2.1% |
| Physical & Health Sciences | 13 | 1.9% |
| Psychology | 129 | 19.1% |
| Social Sciences | 0 | 0.0% |
| Engineering | 81 | 12.0% |
| Multidisciplinary Studies | 0 | 0.0% |
| Science & Technology | 160 | 23.7% |
| Business | 144 | 21.4% |
| Education | 11 | 1.6% |
| Literature & Languages | 0 | 0.0% |
| Liberal Arts & History | 0 | 0.0% |
| Visual & Performing Arts | 18 | 2.7% |
| Communications | 13 | 1.9% |
| Arts & Humanities | 54 | 8.0% |
| Total | 674 | 100.0% |
Transportation & Commute in Salem
Vehicle Availability by Sex in Salem
The most prevalent vehicle ownership categories in Salem are males with 2 vehicles (322, accounting for 54.2%) and females with 2 vehicles (239, making up 38.6%).
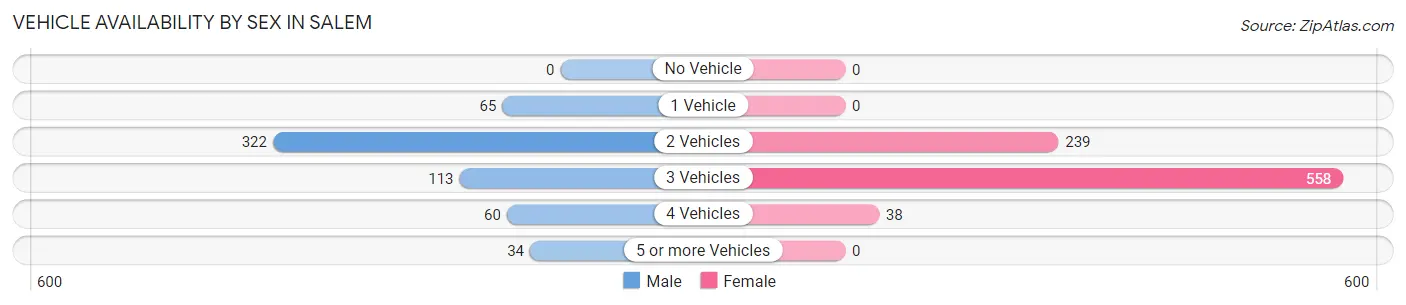
| Vehicles Available | Male | Female |
| No Vehicle | 0 (0.0%) | 0 (0.0%) |
| 1 Vehicle | 65 (10.9%) | 0 (0.0%) |
| 2 Vehicles | 322 (54.2%) | 239 (28.6%) |
| 3 Vehicles | 113 (19.0%) | 558 (66.8%) |
| 4 Vehicles | 60 (10.1%) | 38 (4.5%) |
| 5 or more Vehicles | 34 (5.7%) | 0 (0.0%) |
| Total | 594 (100.0%) | 835 (100.0%) |
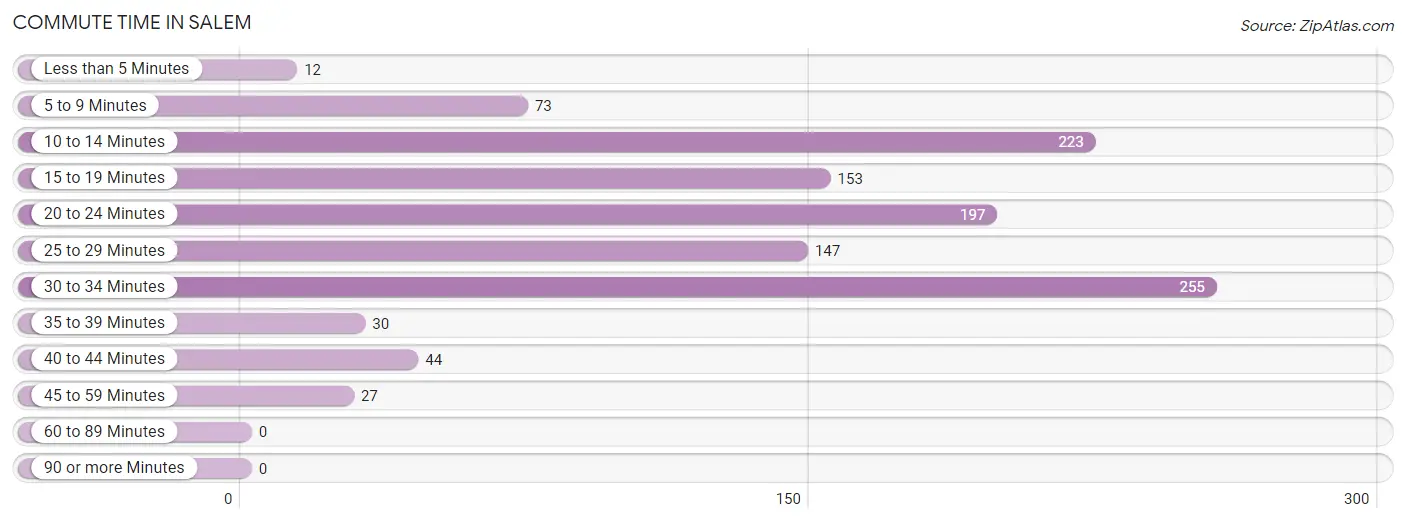
Commute Time in Salem
The most frequently occuring commute durations in Salem are 30 to 34 minutes (255 commuters, 22.0%), 10 to 14 minutes (223 commuters, 19.2%), and 20 to 24 minutes (197 commuters, 17.0%).
| Commute Time | # Commuters | % Commuters |
| Less than 5 Minutes | 12 | 1.0% |
| 5 to 9 Minutes | 73 | 6.3% |
| 10 to 14 Minutes | 223 | 19.2% |
| 15 to 19 Minutes | 153 | 13.2% |
| 20 to 24 Minutes | 197 | 17.0% |
| 25 to 29 Minutes | 147 | 12.7% |
| 30 to 34 Minutes | 255 | 22.0% |
| 35 to 39 Minutes | 30 | 2.6% |
| 40 to 44 Minutes | 44 | 3.8% |
| 45 to 59 Minutes | 27 | 2.3% |
| 60 to 89 Minutes | 0 | 0.0% |
| 90 or more Minutes | 0 | 0.0% |
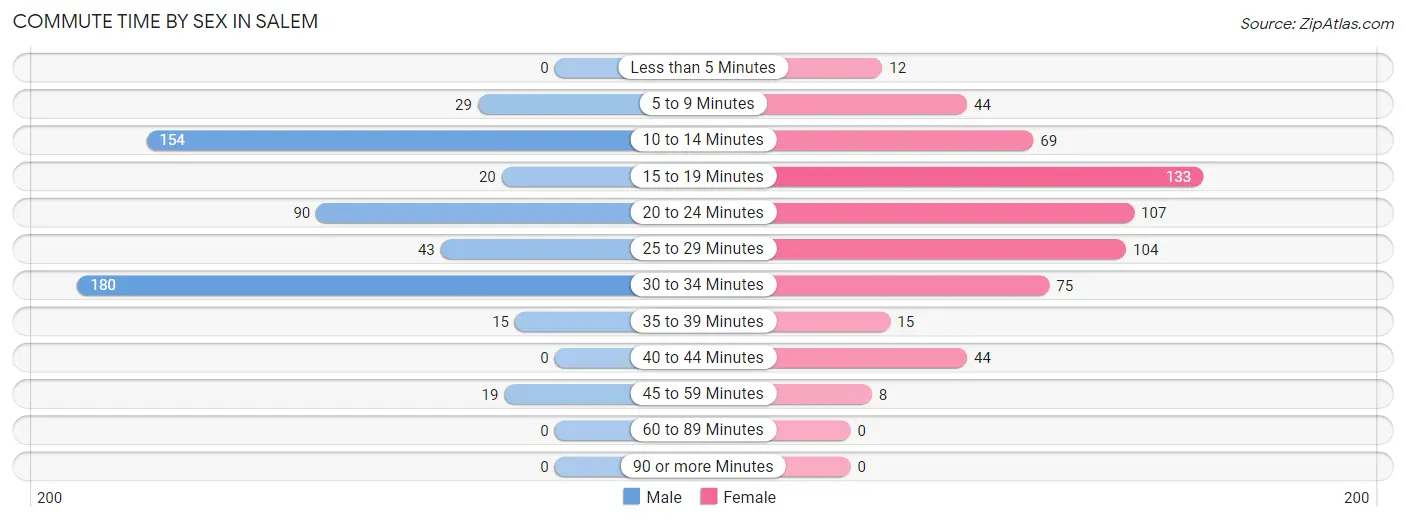
Commute Time by Sex in Salem
The most common commute times in Salem are 30 to 34 minutes (180 commuters, 32.7%) for males and 15 to 19 minutes (133 commuters, 21.8%) for females.
| Commute Time | Male | Female |
| Less than 5 Minutes | 0 (0.0%) | 12 (2.0%) |
| 5 to 9 Minutes | 29 (5.3%) | 44 (7.2%) |
| 10 to 14 Minutes | 154 (28.0%) | 69 (11.3%) |
| 15 to 19 Minutes | 20 (3.6%) | 133 (21.8%) |
| 20 to 24 Minutes | 90 (16.4%) | 107 (17.5%) |
| 25 to 29 Minutes | 43 (7.8%) | 104 (17.0%) |
| 30 to 34 Minutes | 180 (32.7%) | 75 (12.3%) |
| 35 to 39 Minutes | 15 (2.7%) | 15 (2.5%) |
| 40 to 44 Minutes | 0 (0.0%) | 44 (7.2%) |
| 45 to 59 Minutes | 19 (3.5%) | 8 (1.3%) |
| 60 to 89 Minutes | 0 (0.0%) | 0 (0.0%) |
| 90 or more Minutes | 0 (0.0%) | 0 (0.0%) |
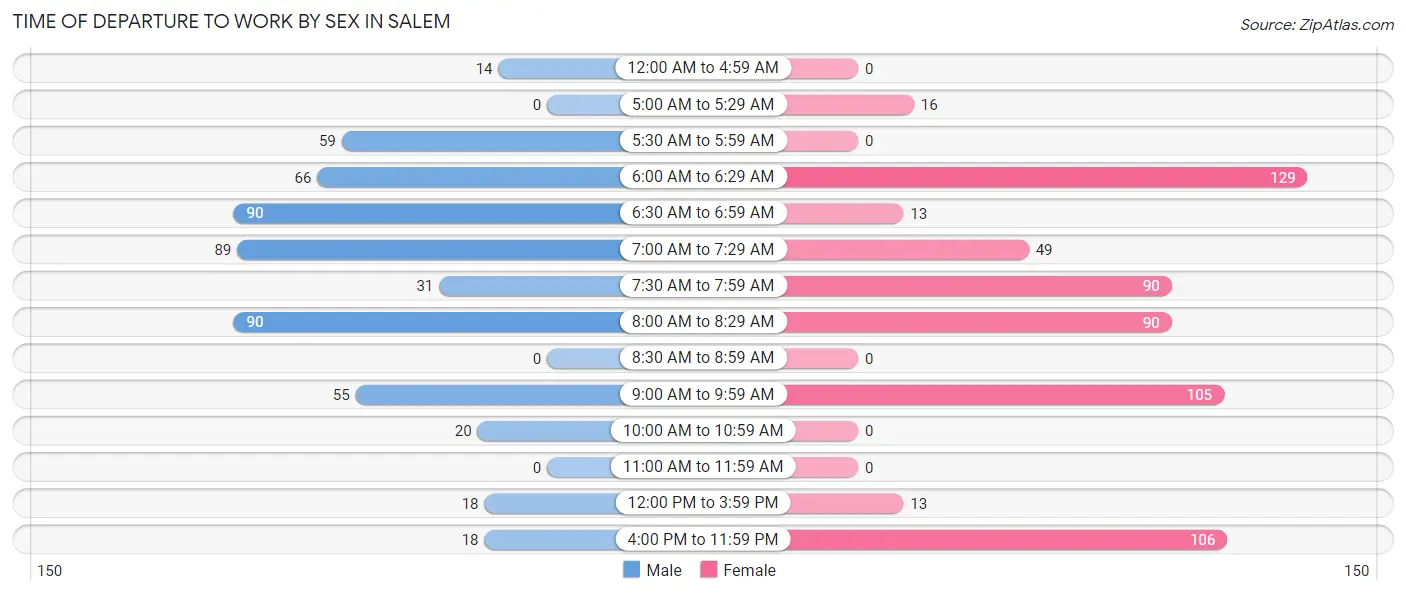
Time of Departure to Work by Sex in Salem
The most frequent times of departure to work in Salem are 6:30 AM to 6:59 AM (90, 16.4%) for males and 6:00 AM to 6:29 AM (129, 21.1%) for females.
| Time of Departure | Male | Female |
| 12:00 AM to 4:59 AM | 14 (2.5%) | 0 (0.0%) |
| 5:00 AM to 5:29 AM | 0 (0.0%) | 16 (2.6%) |
| 5:30 AM to 5:59 AM | 59 (10.7%) | 0 (0.0%) |
| 6:00 AM to 6:29 AM | 66 (12.0%) | 129 (21.1%) |
| 6:30 AM to 6:59 AM | 90 (16.4%) | 13 (2.1%) |
| 7:00 AM to 7:29 AM | 89 (16.2%) | 49 (8.0%) |
| 7:30 AM to 7:59 AM | 31 (5.6%) | 90 (14.7%) |
| 8:00 AM to 8:29 AM | 90 (16.4%) | 90 (14.7%) |
| 8:30 AM to 8:59 AM | 0 (0.0%) | 0 (0.0%) |
| 9:00 AM to 9:59 AM | 55 (10.0%) | 105 (17.2%) |
| 10:00 AM to 10:59 AM | 20 (3.6%) | 0 (0.0%) |
| 11:00 AM to 11:59 AM | 0 (0.0%) | 0 (0.0%) |
| 12:00 PM to 3:59 PM | 18 (3.3%) | 13 (2.1%) |
| 4:00 PM to 11:59 PM | 18 (3.3%) | 106 (17.3%) |
| Total | 550 (100.0%) | 611 (100.0%) |
Housing Occupancy in Salem
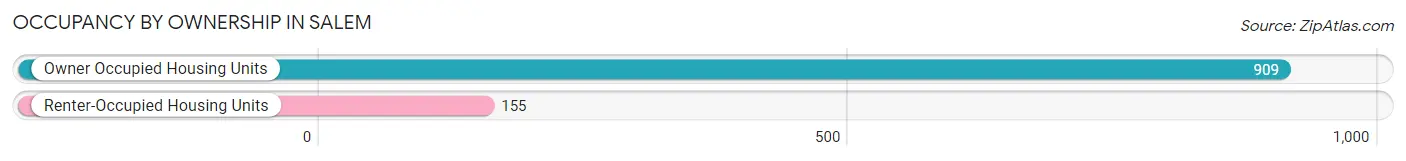
Occupancy by Ownership in Salem
Of the total 1,064 dwellings in Salem, owner-occupied units account for 909 (85.4%), while renter-occupied units make up 155 (14.6%).
| Occupancy | # Housing Units | % Housing Units |
| Owner Occupied Housing Units | 909 | 85.4% |
| Renter-Occupied Housing Units | 155 | 14.6% |
| Total Occupied Housing Units | 1,064 | 100.0% |
Occupancy by Household Size in Salem
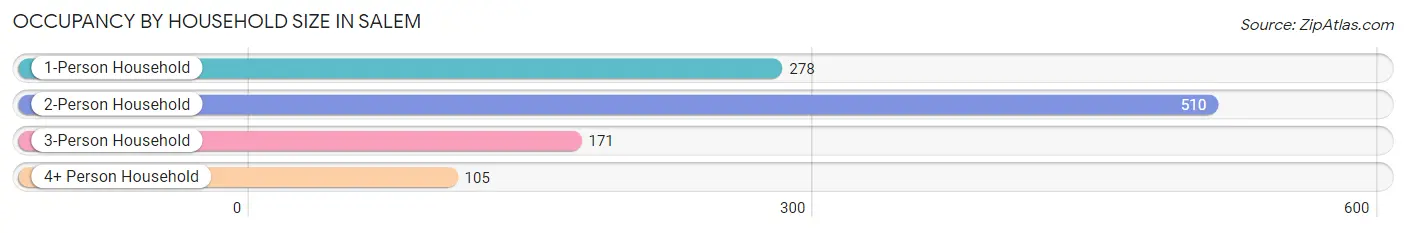
| Household Size | # Housing Units | % Housing Units |
| 1-Person Household | 278 | 26.1% |
| 2-Person Household | 510 | 47.9% |
| 3-Person Household | 171 | 16.1% |
| 4+ Person Household | 105 | 9.9% |
| Total Housing Units | 1,064 | 100.0% |
Occupancy by Ownership by Household Size in Salem
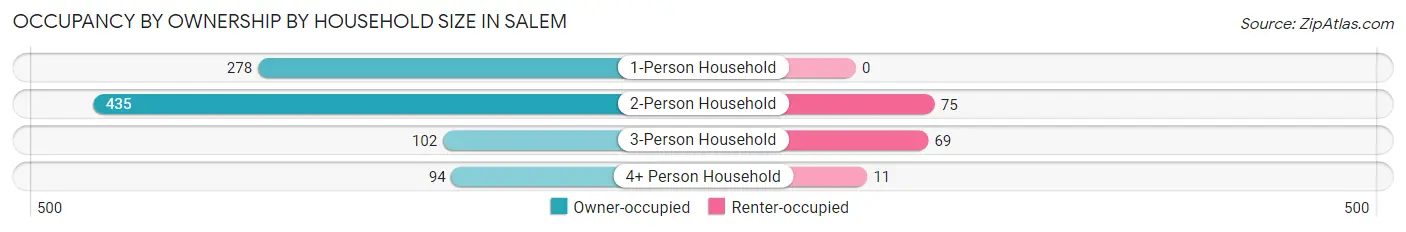
| Household Size | Owner-occupied | Renter-occupied |
| 1-Person Household | 278 (100.0%) | 0 (0.0%) |
| 2-Person Household | 435 (85.3%) | 75 (14.7%) |
| 3-Person Household | 102 (59.7%) | 69 (40.4%) |
| 4+ Person Household | 94 (89.5%) | 11 (10.5%) |
| Total Housing Units | 909 (85.4%) | 155 (14.6%) |
Occupancy by Educational Attainment in Salem
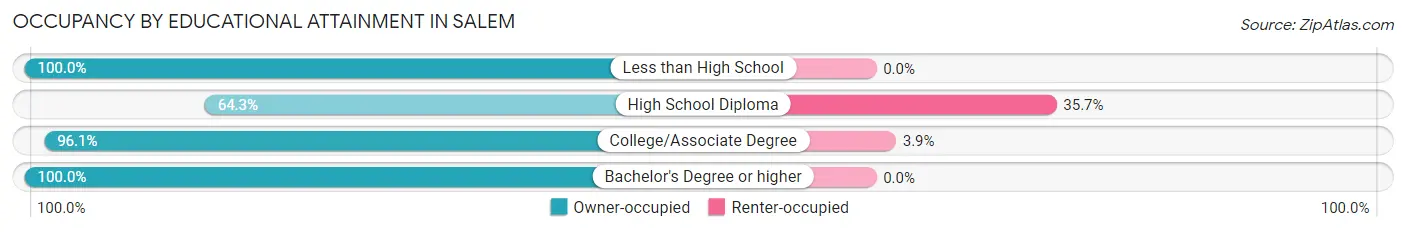
| Household Size | Owner-occupied | Renter-occupied |
| Less than High School | 84 (100.0%) | 0 (0.0%) |
| High School Diploma | 259 (64.3%) | 144 (35.7%) |
| College/Associate Degree | 272 (96.1%) | 11 (3.9%) |
| Bachelor's Degree or higher | 294 (100.0%) | 0 (0.0%) |
Occupancy by Age of Householder in Salem
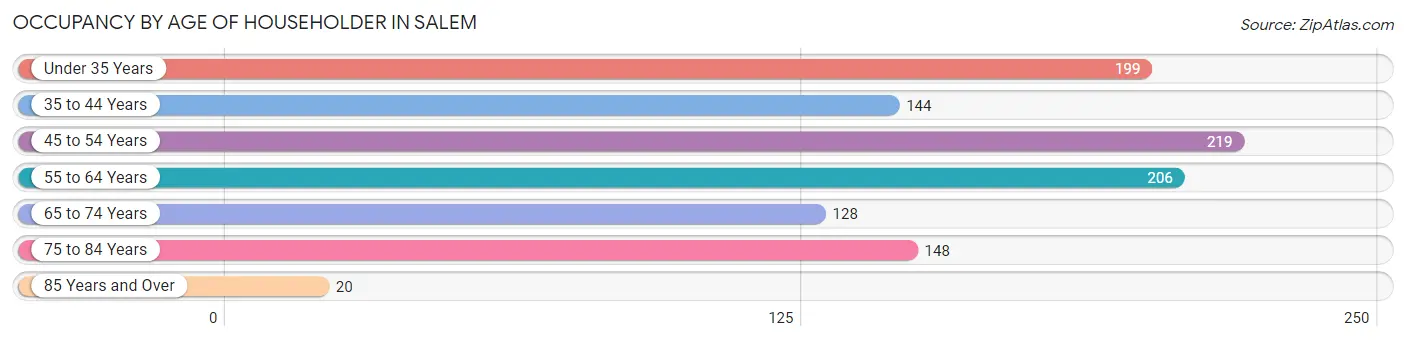
| Age Bracket | # Households | % Households |
| Under 35 Years | 199 | 18.7% |
| 35 to 44 Years | 144 | 13.5% |
| 45 to 54 Years | 219 | 20.6% |
| 55 to 64 Years | 206 | 19.4% |
| 65 to 74 Years | 128 | 12.0% |
| 75 to 84 Years | 148 | 13.9% |
| 85 Years and Over | 20 | 1.9% |
| Total | 1,064 | 100.0% |
Housing Finances in Salem
Median Income by Occupancy in Salem
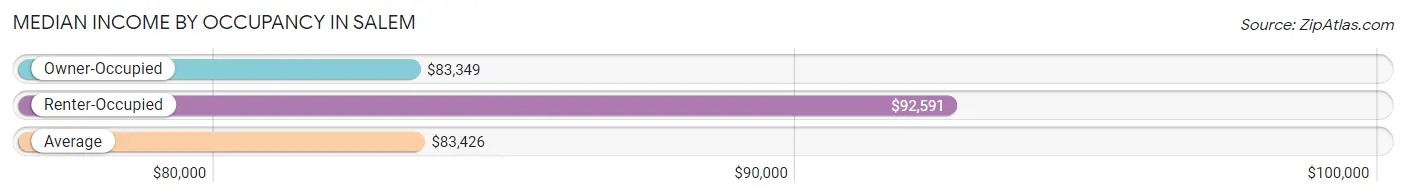
| Occupancy Type | # Households | Median Income |
| Owner-Occupied | 909 (85.4%) | $83,349 |
| Renter-Occupied | 155 (14.6%) | $92,591 |
| Average | 1,064 (100.0%) | $83,426 |
Occupancy by Householder Income Bracket in Salem
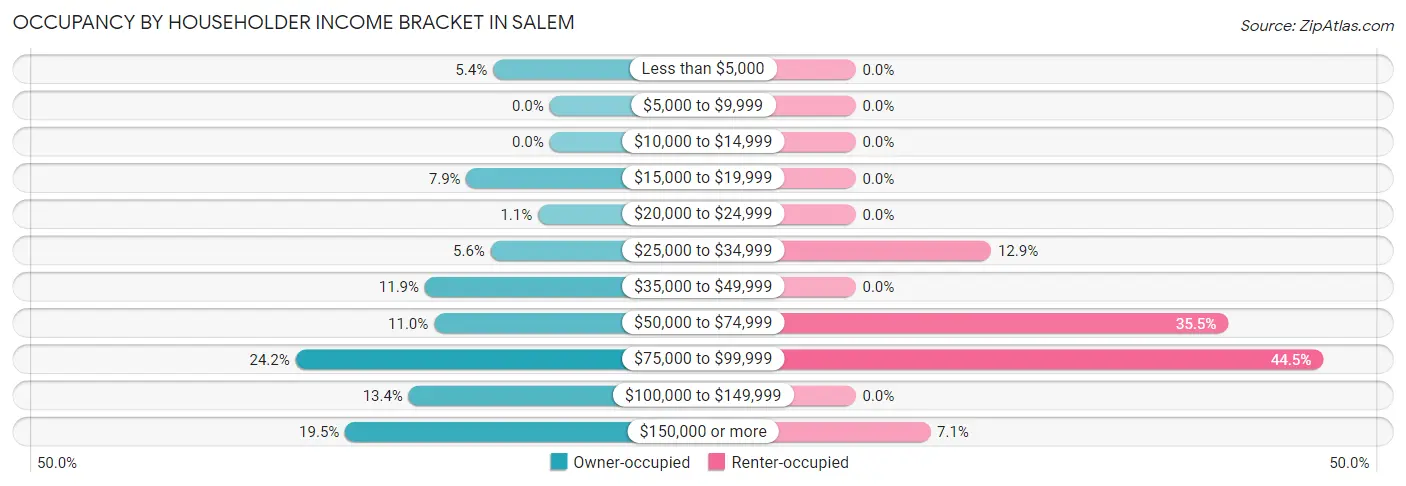
| Income Bracket | Owner-occupied | Renter-occupied |
| Less than $5,000 | 49 (5.4%) | 0 (0.0%) |
| $5,000 to $9,999 | 0 (0.0%) | 0 (0.0%) |
| $10,000 to $14,999 | 0 (0.0%) | 0 (0.0%) |
| $15,000 to $19,999 | 72 (7.9%) | 0 (0.0%) |
| $20,000 to $24,999 | 10 (1.1%) | 0 (0.0%) |
| $25,000 to $34,999 | 51 (5.6%) | 20 (12.9%) |
| $35,000 to $49,999 | 108 (11.9%) | 0 (0.0%) |
| $50,000 to $74,999 | 100 (11.0%) | 55 (35.5%) |
| $75,000 to $99,999 | 220 (24.2%) | 69 (44.5%) |
| $100,000 to $149,999 | 122 (13.4%) | 0 (0.0%) |
| $150,000 or more | 177 (19.5%) | 11 (7.1%) |
| Total | 909 (100.0%) | 155 (100.0%) |
Monthly Housing Cost Tiers in Salem
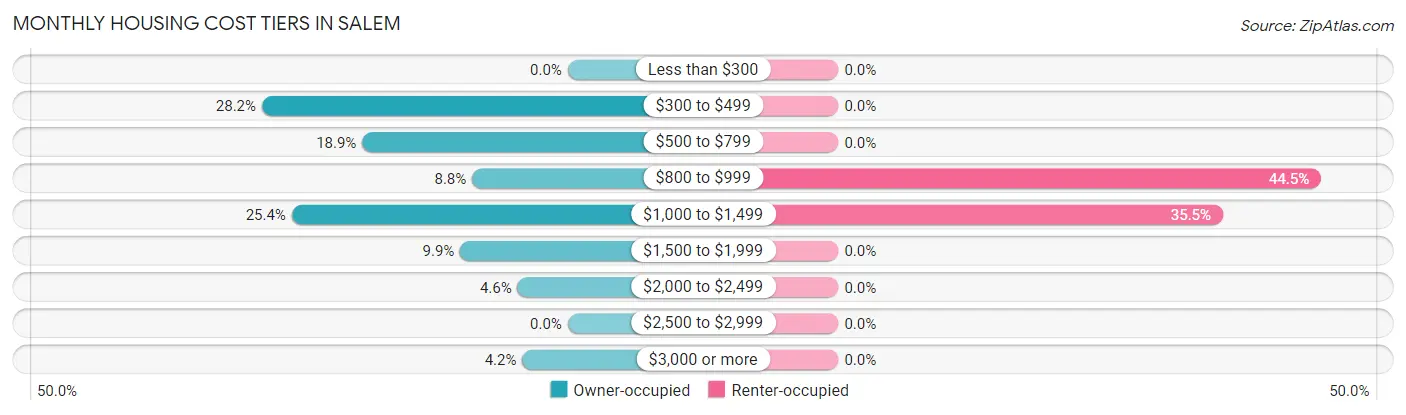
| Monthly Cost | Owner-occupied | Renter-occupied |
| Less than $300 | 0 (0.0%) | 0 (0.0%) |
| $300 to $499 | 256 (28.2%) | 0 (0.0%) |
| $500 to $799 | 172 (18.9%) | 0 (0.0%) |
| $800 to $999 | 80 (8.8%) | 69 (44.5%) |
| $1,000 to $1,499 | 231 (25.4%) | 55 (35.5%) |
| $1,500 to $1,999 | 90 (9.9%) | 0 (0.0%) |
| $2,000 to $2,499 | 42 (4.6%) | 0 (0.0%) |
| $2,500 to $2,999 | 0 (0.0%) | 0 (0.0%) |
| $3,000 or more | 38 (4.2%) | 0 (0.0%) |
| Total | 909 (100.0%) | 155 (100.0%) |
Physical Housing Characteristics in Salem
Housing Structures in Salem
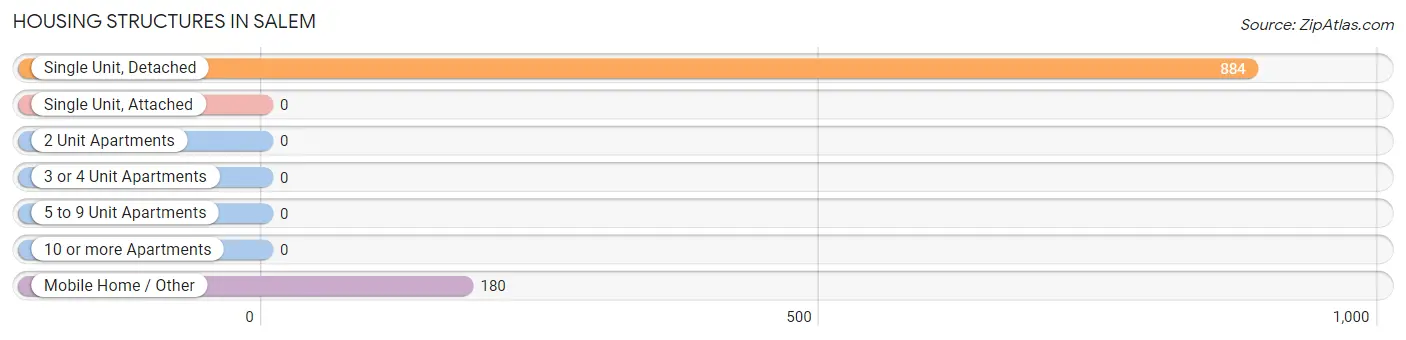
| Structure Type | # Housing Units | % Housing Units |
| Single Unit, Detached | 884 | 83.1% |
| Single Unit, Attached | 0 | 0.0% |
| 2 Unit Apartments | 0 | 0.0% |
| 3 or 4 Unit Apartments | 0 | 0.0% |
| 5 to 9 Unit Apartments | 0 | 0.0% |
| 10 or more Apartments | 0 | 0.0% |
| Mobile Home / Other | 180 | 16.9% |
| Total | 1,064 | 100.0% |
Housing Structures by Occupancy in Salem
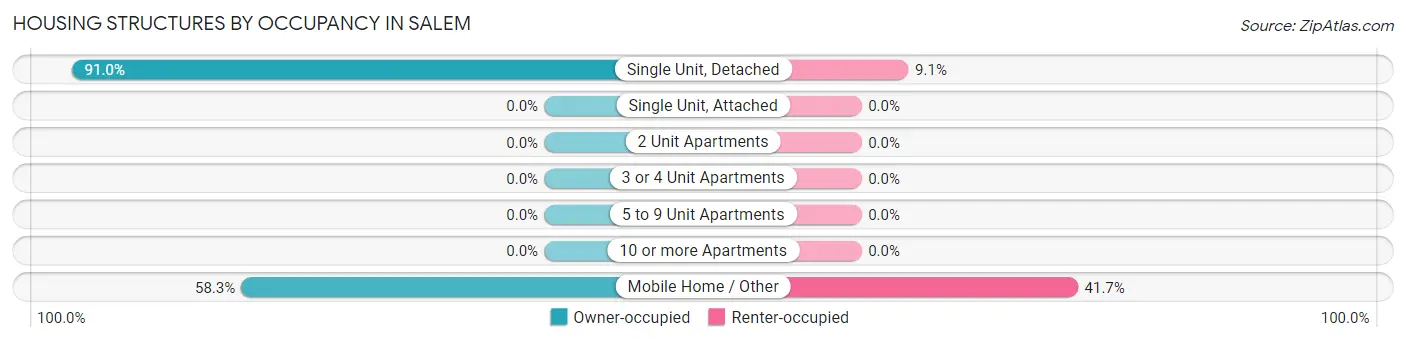
| Structure Type | Owner-occupied | Renter-occupied |
| Single Unit, Detached | 804 (90.9%) | 80 (9.0%) |
| Single Unit, Attached | 0 (0.0%) | 0 (0.0%) |
| 2 Unit Apartments | 0 (0.0%) | 0 (0.0%) |
| 3 or 4 Unit Apartments | 0 (0.0%) | 0 (0.0%) |
| 5 to 9 Unit Apartments | 0 (0.0%) | 0 (0.0%) |
| 10 or more Apartments | 0 (0.0%) | 0 (0.0%) |
| Mobile Home / Other | 105 (58.3%) | 75 (41.7%) |
| Total | 909 (85.4%) | 155 (14.6%) |
Housing Structures by Number of Rooms in Salem
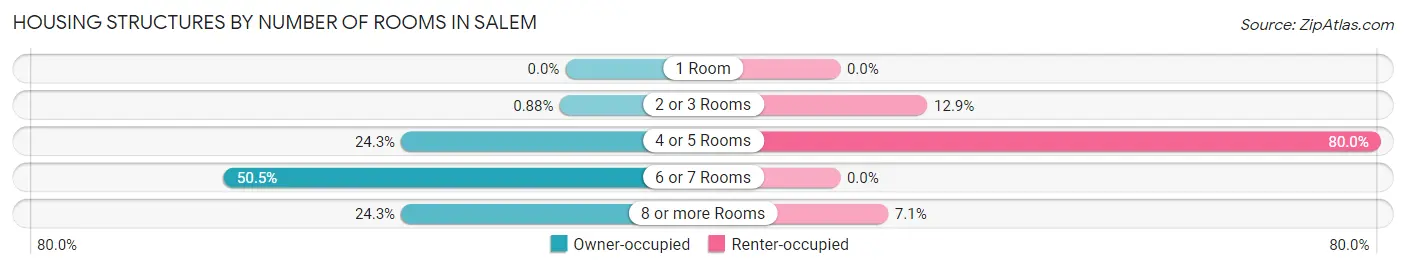
| Number of Rooms | Owner-occupied | Renter-occupied |
| 1 Room | 0 (0.0%) | 0 (0.0%) |
| 2 or 3 Rooms | 8 (0.9%) | 20 (12.9%) |
| 4 or 5 Rooms | 221 (24.3%) | 124 (80.0%) |
| 6 or 7 Rooms | 459 (50.5%) | 0 (0.0%) |
| 8 or more Rooms | 221 (24.3%) | 11 (7.1%) |
| Total | 909 (100.0%) | 155 (100.0%) |
Housing Structure by Heating Type in Salem
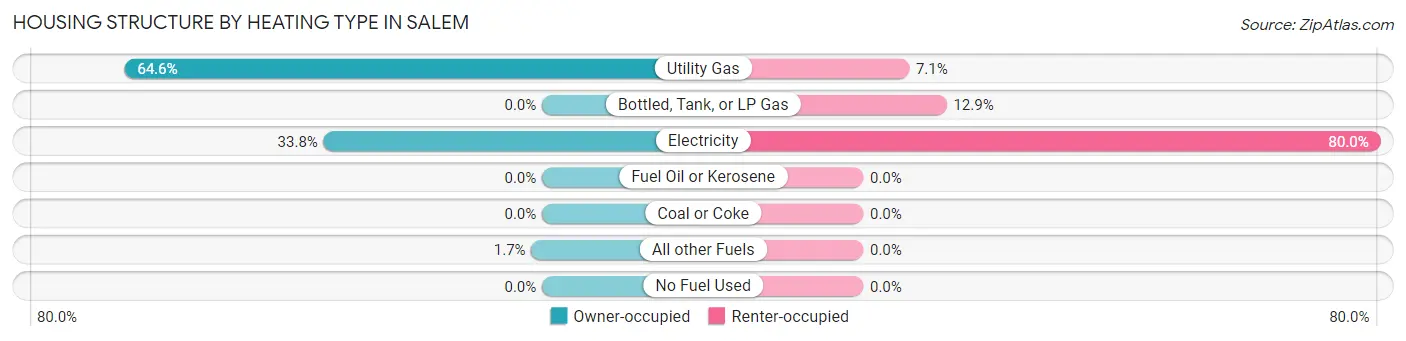
| Heating Type | Owner-occupied | Renter-occupied |
| Utility Gas | 587 (64.6%) | 11 (7.1%) |
| Bottled, Tank, or LP Gas | 0 (0.0%) | 20 (12.9%) |
| Electricity | 307 (33.8%) | 124 (80.0%) |
| Fuel Oil or Kerosene | 0 (0.0%) | 0 (0.0%) |
| Coal or Coke | 0 (0.0%) | 0 (0.0%) |
| All other Fuels | 15 (1.7%) | 0 (0.0%) |
| No Fuel Used | 0 (0.0%) | 0 (0.0%) |
| Total | 909 (100.0%) | 155 (100.0%) |
Household Vehicle Usage in Salem
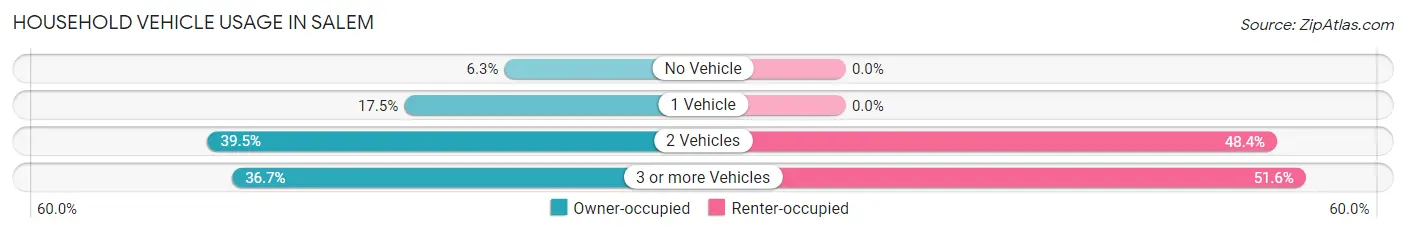
| Vehicles per Household | Owner-occupied | Renter-occupied |
| No Vehicle | 57 (6.3%) | 0 (0.0%) |
| 1 Vehicle | 159 (17.5%) | 0 (0.0%) |
| 2 Vehicles | 359 (39.5%) | 75 (48.4%) |
| 3 or more Vehicles | 334 (36.7%) | 80 (51.6%) |
| Total | 909 (100.0%) | 155 (100.0%) |
Real Estate & Mortgages in Salem
Real Estate and Mortgage Overview in Salem
| Characteristic | Without Mortgage | With Mortgage |
| Housing Units | 319 | 590 |
| Median Property Value | $180,500 | $199,300 |
| Median Household Income | $43,105 | $177 |
| Monthly Housing Costs | $418 | $38 |
| Real Estate Taxes | $1,093 | $14 |
Property Value by Mortgage Status in Salem
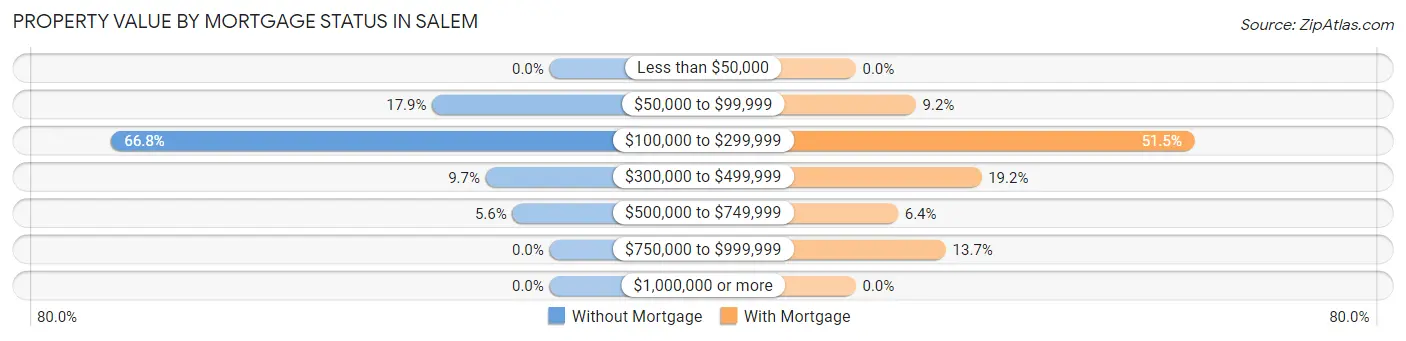
| Property Value | Without Mortgage | With Mortgage |
| Less than $50,000 | 0 (0.0%) | 0 (0.0%) |
| $50,000 to $99,999 | 57 (17.9%) | 54 (9.1%) |
| $100,000 to $299,999 | 213 (66.8%) | 304 (51.5%) |
| $300,000 to $499,999 | 31 (9.7%) | 113 (19.2%) |
| $500,000 to $749,999 | 18 (5.6%) | 38 (6.4%) |
| $750,000 to $999,999 | 0 (0.0%) | 81 (13.7%) |
| $1,000,000 or more | 0 (0.0%) | 0 (0.0%) |
| Total | 319 (100.0%) | 590 (100.0%) |
Household Income by Mortgage Status in Salem
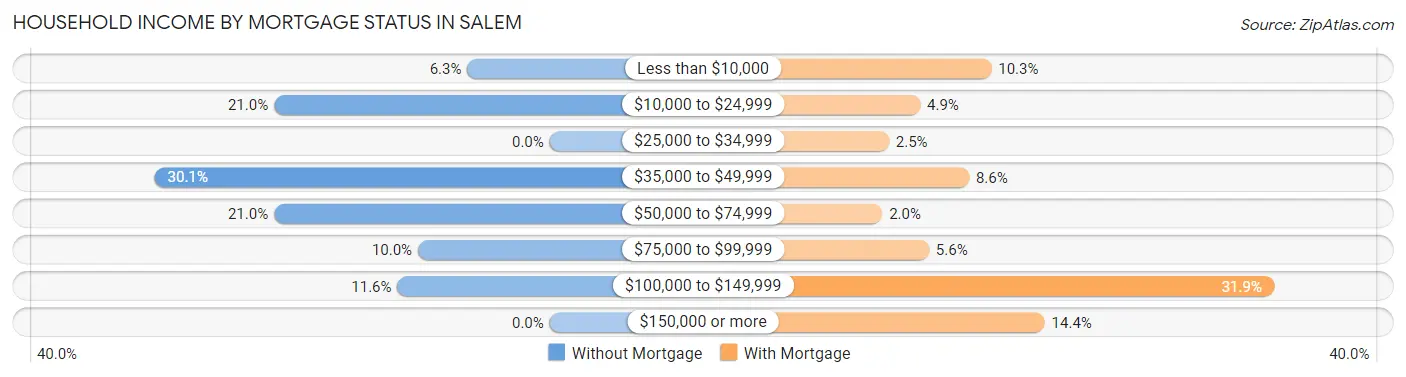
| Household Income | Without Mortgage | With Mortgage |
| Less than $10,000 | 20 (6.3%) | 61 (10.3%) |
| $10,000 to $24,999 | 67 (21.0%) | 29 (4.9%) |
| $25,000 to $34,999 | 0 (0.0%) | 15 (2.5%) |
| $35,000 to $49,999 | 96 (30.1%) | 51 (8.6%) |
| $50,000 to $74,999 | 67 (21.0%) | 12 (2.0%) |
| $75,000 to $99,999 | 32 (10.0%) | 33 (5.6%) |
| $100,000 to $149,999 | 37 (11.6%) | 188 (31.9%) |
| $150,000 or more | 0 (0.0%) | 85 (14.4%) |
| Total | 319 (100.0%) | 590 (100.0%) |
Property Value to Household Income Ratio in Salem
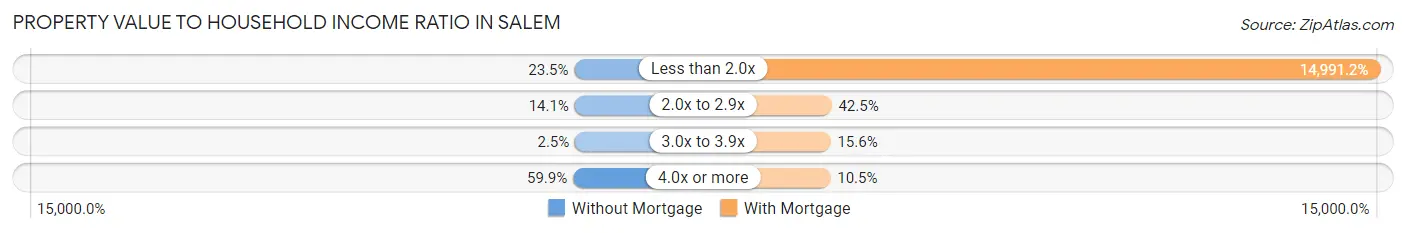
| Value-to-Income Ratio | Without Mortgage | With Mortgage |
| Less than 2.0x | 75 (23.5%) | 88,448 (14,991.2%) |
| 2.0x to 2.9x | 45 (14.1%) | 251 (42.5%) |
| 3.0x to 3.9x | 8 (2.5%) | 92 (15.6%) |
| 4.0x or more | 191 (59.9%) | 62 (10.5%) |
| Total | 319 (100.0%) | 590 (100.0%) |
Real Estate Taxes by Mortgage Status in Salem
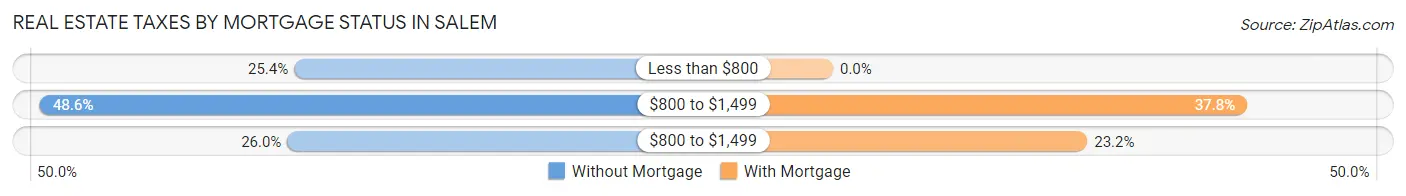
| Property Taxes | Without Mortgage | With Mortgage |
| Less than $800 | 81 (25.4%) | 0 (0.0%) |
| $800 to $1,499 | 155 (48.6%) | 223 (37.8%) |
| $800 to $1,499 | 83 (26.0%) | 137 (23.2%) |
| Total | 319 (100.0%) | 590 (100.0%) |
Health & Disability in Salem
Health Insurance Coverage by Age in Salem
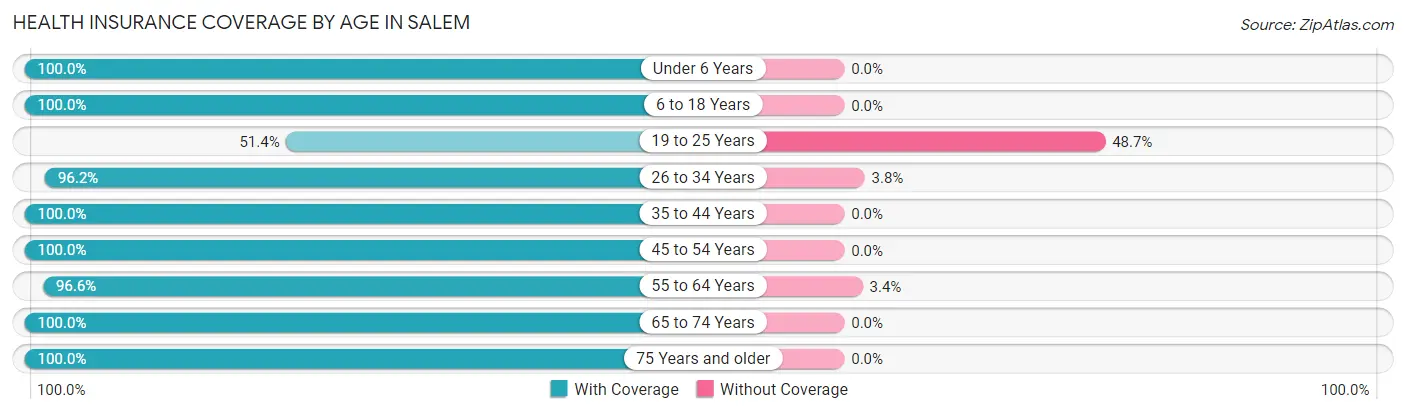
| Age Bracket | With Coverage | Without Coverage |
| Under 6 Years | 21 (100.0%) | 0 (0.0%) |
| 6 to 18 Years | 250 (100.0%) | 0 (0.0%) |
| 19 to 25 Years | 19 (51.3%) | 18 (48.6%) |
| 26 to 34 Years | 508 (96.2%) | 20 (3.8%) |
| 35 to 44 Years | 238 (100.0%) | 0 (0.0%) |
| 45 to 54 Years | 465 (100.0%) | 0 (0.0%) |
| 55 to 64 Years | 395 (96.6%) | 14 (3.4%) |
| 65 to 74 Years | 278 (100.0%) | 0 (0.0%) |
| 75 Years and older | 250 (100.0%) | 0 (0.0%) |
| Total | 2,424 (97.9%) | 52 (2.1%) |
Health Insurance Coverage by Citizenship Status in Salem
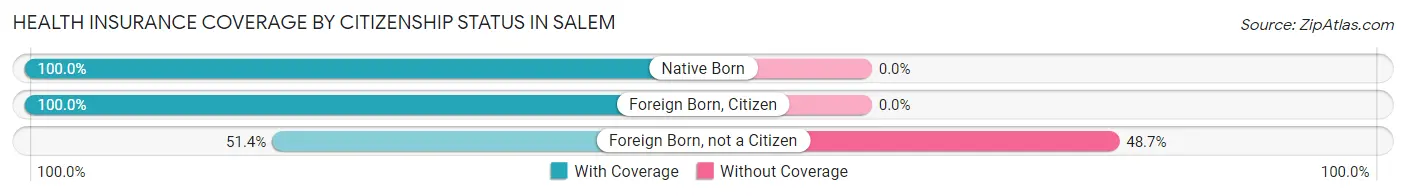
| Citizenship Status | With Coverage | Without Coverage |
| Native Born | 21 (100.0%) | 0 (0.0%) |
| Foreign Born, Citizen | 250 (100.0%) | 0 (0.0%) |
| Foreign Born, not a Citizen | 19 (51.3%) | 18 (48.6%) |
Health Insurance Coverage by Household Income in Salem
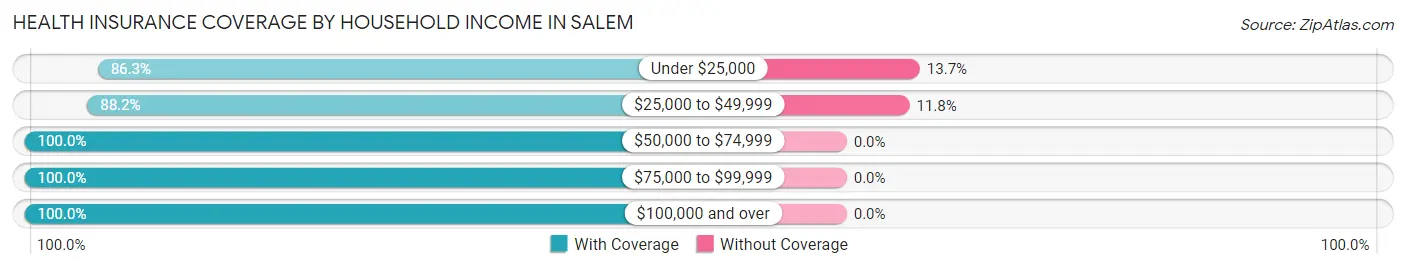
| Household Income | With Coverage | Without Coverage |
| Under $25,000 | 126 (86.3%) | 20 (13.7%) |
| $25,000 to $49,999 | 240 (88.2%) | 32 (11.8%) |
| $50,000 to $74,999 | 375 (100.0%) | 0 (0.0%) |
| $75,000 to $99,999 | 729 (100.0%) | 0 (0.0%) |
| $100,000 and over | 954 (100.0%) | 0 (0.0%) |
Public vs Private Health Insurance Coverage by Age in Salem
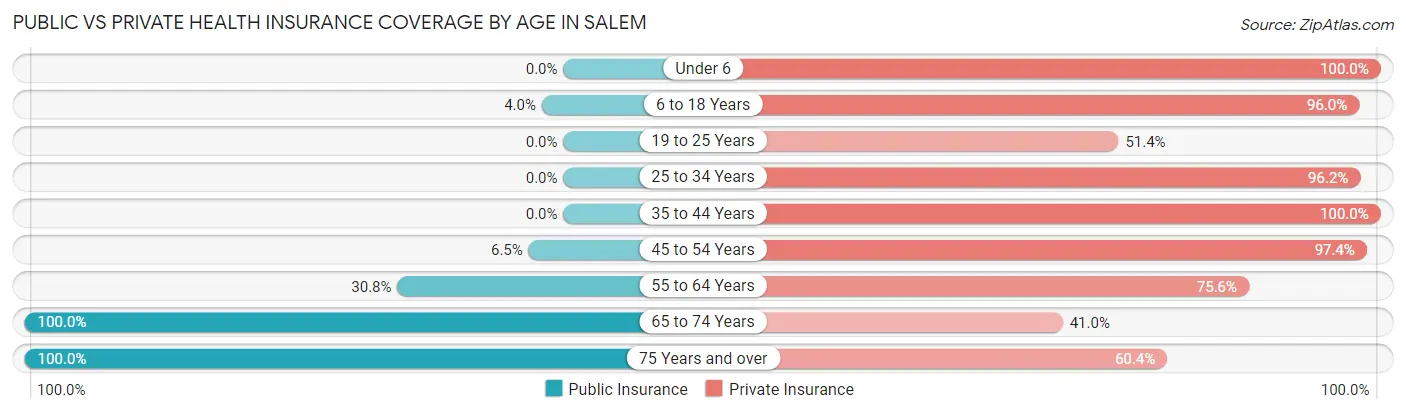
| Age Bracket | Public Insurance | Private Insurance |
| Under 6 | 0 (0.0%) | 21 (100.0%) |
| 6 to 18 Years | 10 (4.0%) | 240 (96.0%) |
| 19 to 25 Years | 0 (0.0%) | 19 (51.3%) |
| 25 to 34 Years | 0 (0.0%) | 508 (96.2%) |
| 35 to 44 Years | 0 (0.0%) | 238 (100.0%) |
| 45 to 54 Years | 30 (6.5%) | 453 (97.4%) |
| 55 to 64 Years | 126 (30.8%) | 309 (75.5%) |
| 65 to 74 Years | 278 (100.0%) | 114 (41.0%) |
| 75 Years and over | 250 (100.0%) | 151 (60.4%) |
| Total | 694 (28.0%) | 2,053 (82.9%) |
Disability Status by Sex by Age in Salem
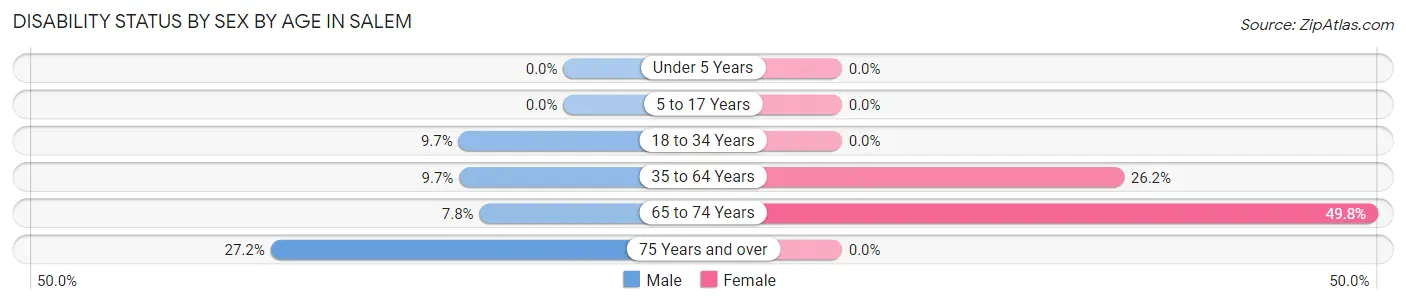
| Age Bracket | Male | Female |
| Under 5 Years | 0 (0.0%) | 0 (0.0%) |
| 5 to 17 Years | 0 (0.0%) | 0 (0.0%) |
| 18 to 34 Years | 18 (9.7%) | 0 (0.0%) |
| 35 to 64 Years | 44 (9.7%) | 172 (26.2%) |
| 65 to 74 Years | 6 (7.8%) | 100 (49.7%) |
| 75 Years and over | 47 (27.2%) | 0 (0.0%) |
Disability Class by Sex by Age in Salem
Disability Class: Hearing Difficulty
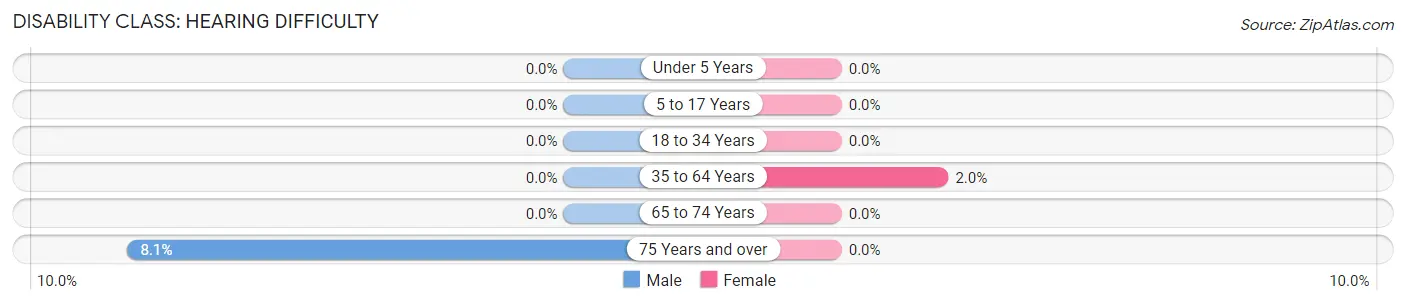
| Age Bracket | Male | Female |
| Under 5 Years | 0 (0.0%) | 0 (0.0%) |
| 5 to 17 Years | 0 (0.0%) | 0 (0.0%) |
| 18 to 34 Years | 0 (0.0%) | 0 (0.0%) |
| 35 to 64 Years | 0 (0.0%) | 13 (2.0%) |
| 65 to 74 Years | 0 (0.0%) | 0 (0.0%) |
| 75 Years and over | 14 (8.1%) | 0 (0.0%) |
Disability Class: Vision Difficulty
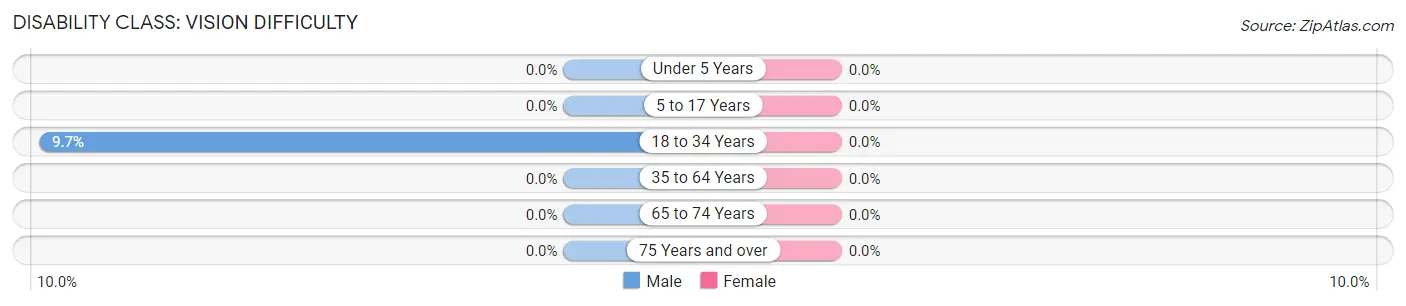
| Age Bracket | Male | Female |
| Under 5 Years | 0 (0.0%) | 0 (0.0%) |
| 5 to 17 Years | 0 (0.0%) | 0 (0.0%) |
| 18 to 34 Years | 18 (9.7%) | 0 (0.0%) |
| 35 to 64 Years | 0 (0.0%) | 0 (0.0%) |
| 65 to 74 Years | 0 (0.0%) | 0 (0.0%) |
| 75 Years and over | 0 (0.0%) | 0 (0.0%) |
Disability Class: Cognitive Difficulty
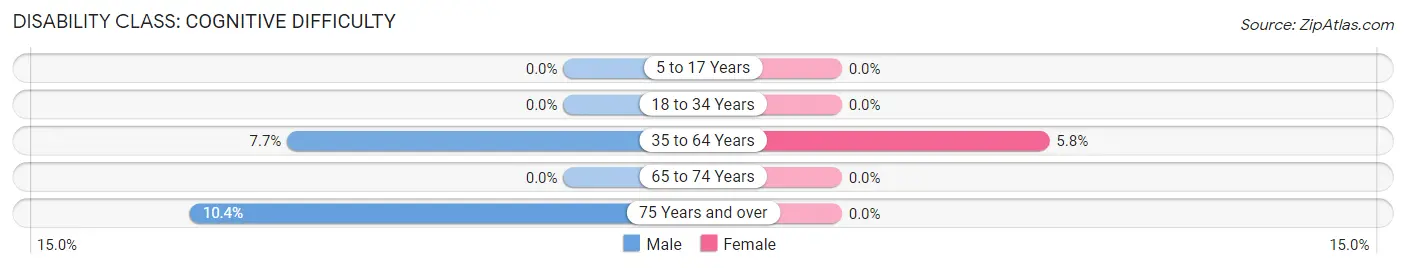
| Age Bracket | Male | Female |
| 5 to 17 Years | 0 (0.0%) | 0 (0.0%) |
| 18 to 34 Years | 0 (0.0%) | 0 (0.0%) |
| 35 to 64 Years | 35 (7.7%) | 38 (5.8%) |
| 65 to 74 Years | 0 (0.0%) | 0 (0.0%) |
| 75 Years and over | 18 (10.4%) | 0 (0.0%) |
Disability Class: Ambulatory Difficulty
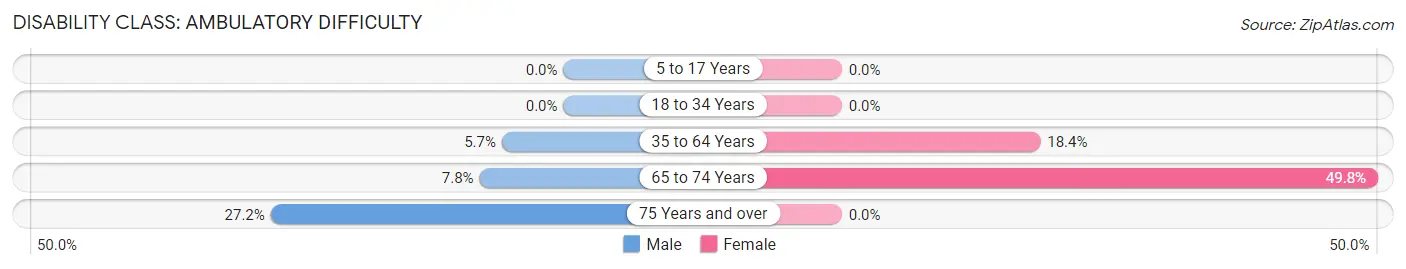
| Age Bracket | Male | Female |
| 5 to 17 Years | 0 (0.0%) | 0 (0.0%) |
| 18 to 34 Years | 0 (0.0%) | 0 (0.0%) |
| 35 to 64 Years | 26 (5.7%) | 121 (18.4%) |
| 65 to 74 Years | 6 (7.8%) | 100 (49.7%) |
| 75 Years and over | 47 (27.2%) | 0 (0.0%) |
Disability Class: Self-Care Difficulty
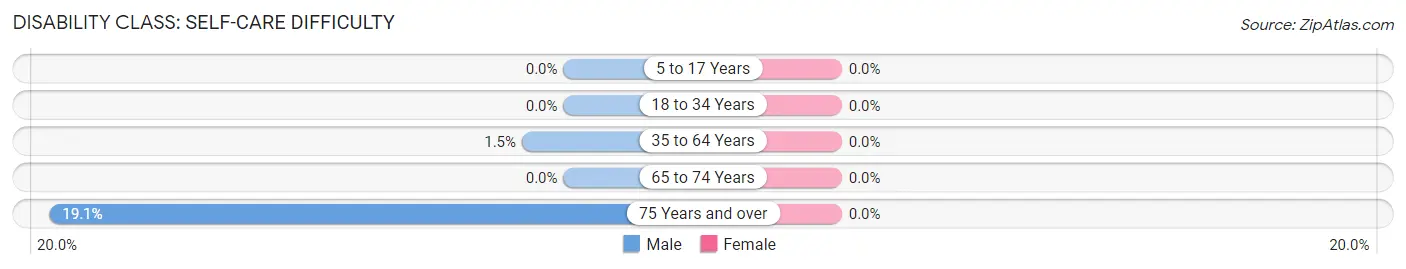
| Age Bracket | Male | Female |
| 5 to 17 Years | 0 (0.0%) | 0 (0.0%) |
| 18 to 34 Years | 0 (0.0%) | 0 (0.0%) |
| 35 to 64 Years | 7 (1.5%) | 0 (0.0%) |
| 65 to 74 Years | 0 (0.0%) | 0 (0.0%) |
| 75 Years and over | 33 (19.1%) | 0 (0.0%) |
Technology Access in Salem
Computing Device Access in Salem
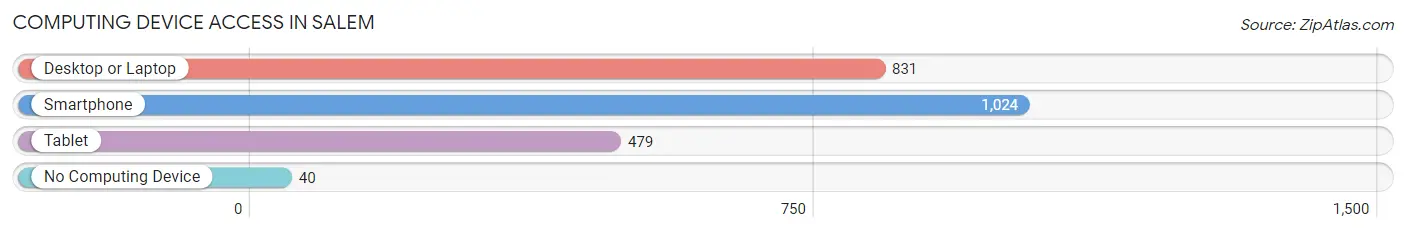
| Device Type | # Households | % Households |
| Desktop or Laptop | 831 | 78.1% |
| Smartphone | 1,024 | 96.2% |
| Tablet | 479 | 45.0% |
| No Computing Device | 40 | 3.8% |
| Total | 1,064 | 100.0% |
Internet Access in Salem
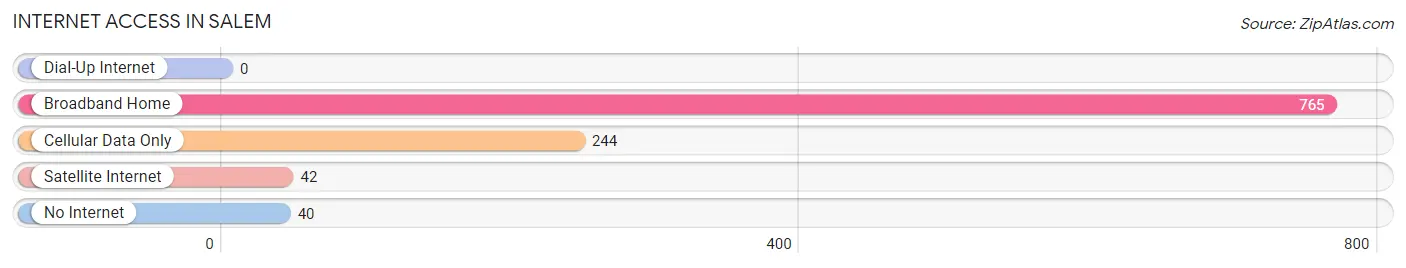
| Internet Type | # Households | % Households |
| Dial-Up Internet | 0 | 0.0% |
| Broadband Home | 765 | 71.9% |
| Cellular Data Only | 244 | 22.9% |
| Satellite Internet | 42 | 4.0% |
| No Internet | 40 | 3.8% |
| Total | 1,064 | 100.0% |
Salem Summary
Salem is a city located in Fulton County, Arkansas, United States. The population was 2,890 at the 2010 census. It is the county seat of Fulton County.
History
The area that is now Salem was first settled in the early 1800s. The town was originally known as "Fulton Court House" and was the county seat of Fulton County. In 1851, the town was renamed Salem after the biblical city of the same name.
In 1883, the St. Louis, Iron Mountain and Southern Railway built a line through the town, connecting it to the larger cities of St. Louis and Little Rock. This allowed Salem to become an important trading center for the surrounding area.
In the early 1900s, Salem was a thriving agricultural center. The town was home to several cotton gins, a sawmill, and a gristmill. The town also had a hotel, a bank, and several stores.
Geography
Salem is located in the Ozark Mountains of northern Arkansas. The city is situated in the foothills of the Ozarks, at an elevation of 890 feet (271 m).
The city is located at the intersection of U.S. Route 62 and Arkansas Highway 9. It is approximately 30 miles (48 km) east of Fayetteville, Arkansas, and 40 miles (64 km) west of Jonesboro, Arkansas.
Economy
The economy of Salem is largely based on agriculture. The city is home to several farms, which produce a variety of crops, including cotton, soybeans, corn, and wheat.
The city is also home to several manufacturing companies, including a furniture factory, a plastics factory, and a metal fabrication plant.
Demographics
As of the 2010 census, there were 2,890 people, 1,093 households, and 745 families residing in the city. The population density was 845.3 people per square mile (326.2/km2). There were 1,223 housing units at an average density of 355.3 per square mile (137.2/km2).
The racial makeup of the city was 95.2% White, 0.7% African American, 0.3% Native American, 0.3% Asian, 0.1% Pacific Islander, 1.7% from other races, and 1.9% from two or more races. Hispanic or Latino of any race were 3.2% of the population.
There were 1,093 households, out of which 33.2% had children under the age of 18 living with them, 51.2% were married couples living together, 13.2% had a female householder with no husband present, and 30.7% were non-families. 26.7% of all households were made up of individuals, and 13.2% had someone living alone who was 65 years of age or older. The average household size was 2.54 and the average family size was 3.06.
In the city, the population was spread out, with 27.2% under the age of 18, 8.3% from 18 to 24, 27.2% from 25 to 44, 22.2% from 45 to 64, and 15.1% who were 65 years of age or older. The median age was 36 years. For every 100 females, there were 91.2 males. For every 100 females age 18 and over, there were 87.2 males.
The median income for a household in the city was $27,917, and the median income for a family was $33,750. Males had a median income of $26,964 versus $20,000 for females. The per capita income for the city was $14,845. About 14.2% of families and 17.3% of the population were below the poverty line, including 22.2% of those under age 18 and 16.2% of those age 65 or over.
Common Questions
What is Per Capita Income in Salem?
Per Capita income in Salem is $41,478.
What is the Median Family Income in Salem?
Median Family Income in Salem is $88,110.
What is the Median Household income in Salem?
Median Household Income in Salem is $83,426.
What is Income or Wage Gap in Salem?
Income or Wage Gap in Salem is 54.1%.
Women in Salem earn 45.9 cents for every dollar earned by a man.
What is Inequality or Gini Index in Salem?
Inequality or Gini Index in Salem is 0.37.
What is the Total Population of Salem?
Total Population of Salem is 2,476.
What is the Total Male Population of Salem?
Total Male Population of Salem is 972.
What is the Total Female Population of Salem?
Total Female Population of Salem is 1,504.
What is the Ratio of Males per 100 Females in Salem?
There are 64.63 Males per 100 Females in Salem.
What is the Ratio of Females per 100 Males in Salem?
There are 154.73 Females per 100 Males in Salem.
What is the Median Population Age in Salem?
Median Population Age in Salem is 50.1 Years.
What is the Average Family Size in Salem
Average Family Size in Salem is 2.8 People.
What is the Average Household Size in Salem
Average Household Size in Salem is 2.3 People.
How Large is the Labor Force in Salem?
There are 1,556 People in the Labor Forcein in Salem.
What is the Percentage of People in the Labor Force in Salem?
68.6% of People are in the Labor Force in Salem.
What is the Unemployment Rate in Salem?
Unemployment Rate in Salem is 0.6%.