Farmington, AR Map & Demographics
Farmington Map
Farmington Overview
$31,547
PER CAPITA INCOME
$95,504
AVG FAMILY INCOME
$83,783
AVG HOUSEHOLD INCOME
45.0%
WAGE / INCOME GAP [ % ]
55.0¢/ $1
WAGE / INCOME GAP [ $ ]
0.35
INEQUALITY / GINI INDEX
7,991
TOTAL POPULATION
3,882
MALE POPULATION
4,109
FEMALE POPULATION
94.48
MALES / 100 FEMALES
105.85
FEMALES / 100 MALES
34.4
MEDIAN AGE
3.6
AVG FAMILY SIZE
2.9
AVG HOUSEHOLD SIZE
3,327
LABOR FORCE [ PEOPLE ]
59.8%
PERCENT IN LABOR FORCE
0.4%
UNEMPLOYMENT RATE
Farmington Zip Codes
Farmington Area Codes
Income in Farmington
Income Overview in Farmington
Per Capita Income in Farmington is $31,547, while median incomes of families and households are $95,504 and $83,783 respectively.
| Characteristic | Number | Measure |
| Per Capita Income | 7,991 | $31,547 |
| Median Family Income | 1,862 | $95,504 |
| Mean Family Income | 1,862 | $106,851 |
| Median Household Income | 2,716 | $83,783 |
| Mean Household Income | 2,716 | $91,741 |
| Income Deficit | 1,862 | $0 |
| Wage / Income Gap (%) | 7,991 | 44.98% |
| Wage / Income Gap ($) | 7,991 | 55.02¢ per $1 |
| Gini / Inequality Index | 7,991 | 0.35 |
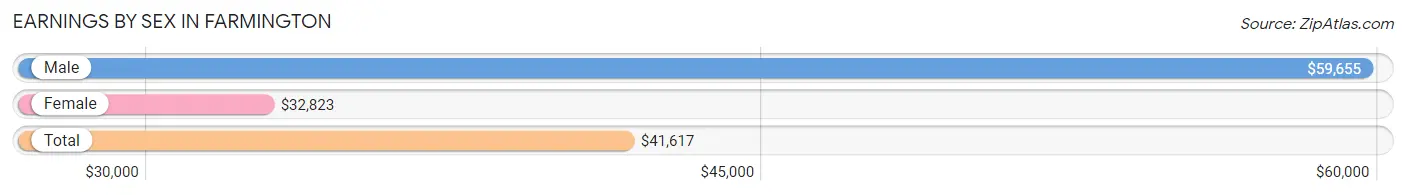
Earnings by Sex in Farmington
Average Earnings in Farmington are $41,617, $59,655 for men and $32,823 for women, a difference of 45.0%.
| Sex | Number | Average Earnings |
| Male | 1,880 (50.2%) | $59,655 |
| Female | 1,868 (49.8%) | $32,823 |
| Total | 3,748 (100.0%) | $41,617 |
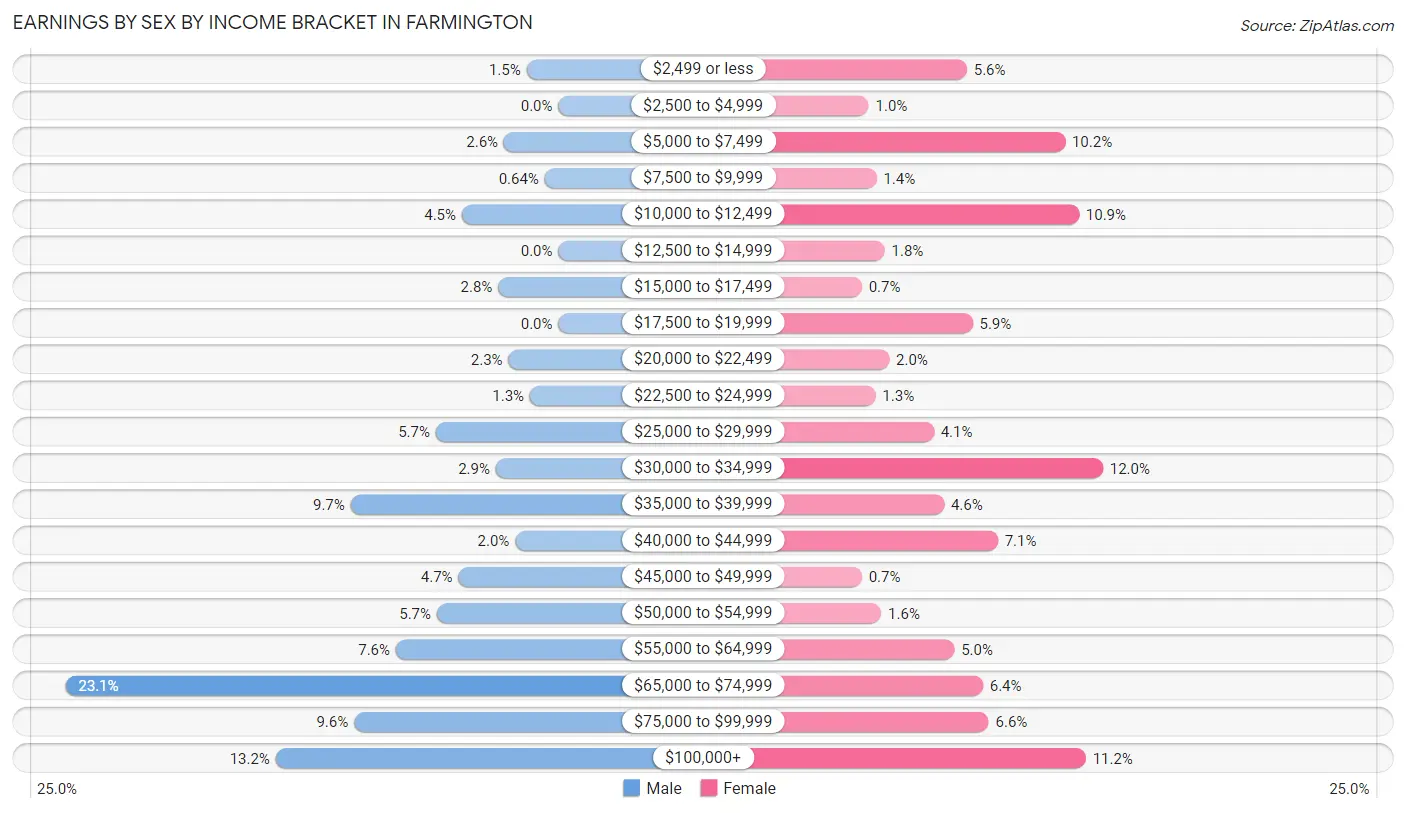
Earnings by Sex by Income Bracket in Farmington
The most common earnings brackets in Farmington are $65,000 to $74,999 for men (434 | 23.1%) and $30,000 to $34,999 for women (224 | 12.0%).
| Income | Male | Female |
| $2,499 or less | 28 (1.5%) | 105 (5.6%) |
| $2,500 to $4,999 | 0 (0.0%) | 19 (1.0%) |
| $5,000 to $7,499 | 48 (2.5%) | 191 (10.2%) |
| $7,500 to $9,999 | 12 (0.6%) | 26 (1.4%) |
| $10,000 to $12,499 | 85 (4.5%) | 203 (10.9%) |
| $12,500 to $14,999 | 0 (0.0%) | 33 (1.8%) |
| $15,000 to $17,499 | 53 (2.8%) | 13 (0.7%) |
| $17,500 to $19,999 | 0 (0.0%) | 110 (5.9%) |
| $20,000 to $22,499 | 44 (2.3%) | 37 (2.0%) |
| $22,500 to $24,999 | 25 (1.3%) | 25 (1.3%) |
| $25,000 to $29,999 | 108 (5.7%) | 76 (4.1%) |
| $30,000 to $34,999 | 55 (2.9%) | 224 (12.0%) |
| $35,000 to $39,999 | 183 (9.7%) | 85 (4.5%) |
| $40,000 to $44,999 | 38 (2.0%) | 132 (7.1%) |
| $45,000 to $49,999 | 88 (4.7%) | 13 (0.7%) |
| $50,000 to $54,999 | 107 (5.7%) | 30 (1.6%) |
| $55,000 to $64,999 | 143 (7.6%) | 94 (5.0%) |
| $65,000 to $74,999 | 434 (23.1%) | 119 (6.4%) |
| $75,000 to $99,999 | 180 (9.6%) | 124 (6.6%) |
| $100,000+ | 249 (13.2%) | 209 (11.2%) |
| Total | 1,880 (100.0%) | 1,868 (100.0%) |
Earnings by Sex by Educational Attainment in Farmington
Average earnings in Farmington are $64,236 for men and $34,030 for women, a difference of 47.0%. Men with an educational attainment of less than high school enjoy the highest average annual earnings of $160,139, while those with college or associate's degree education earn the least with $53,672. Women with an educational attainment of graduate degree earn the most with the average annual earnings of $62,050, while those with college or associate's degree education have the smallest earnings of $23,550.

| Educational Attainment | Male Income | Female Income |
| Less than High School | $160,139 | $0 |
| High School Diploma | $62,386 | $0 |
| College or Associate's Degree | $53,672 | $23,550 |
| Bachelor's Degree | $66,932 | $43,007 |
| Graduate Degree | $81,811 | $62,050 |
| Total | $64,236 | $34,030 |
Family Income in Farmington
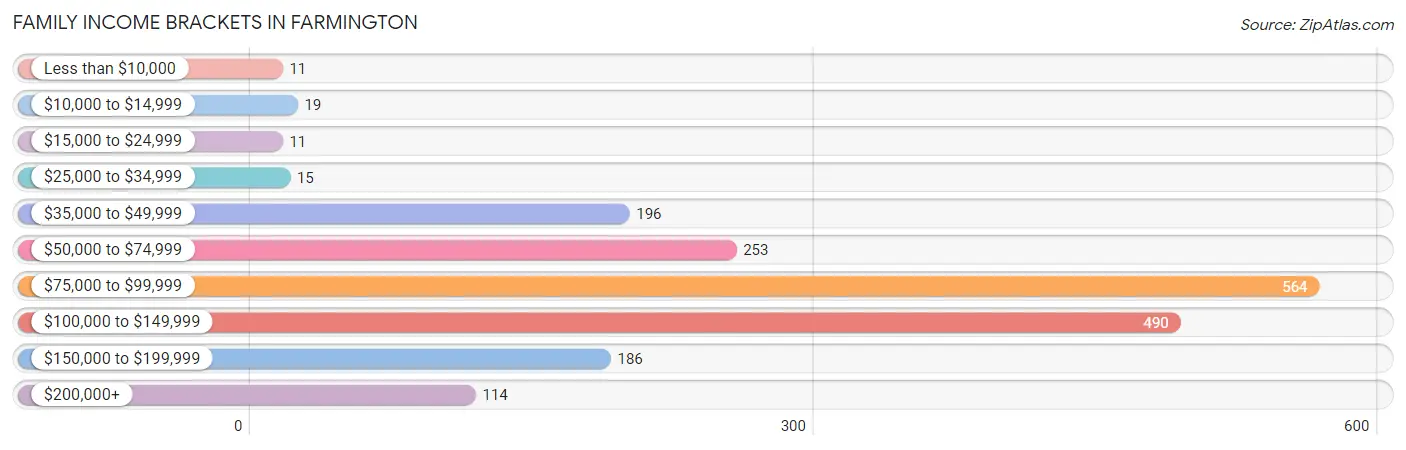
Family Income Brackets in Farmington
According to the Farmington family income data, there are 564 families falling into the $75,000 to $99,999 income range, which is the most common income bracket and makes up 30.3% of all families. Conversely, the less than $10,000 income bracket is the least frequent group with only 11 families (0.6%) belonging to this category.
| Income Bracket | # Families | % Families |
| Less than $10,000 | 11 | 0.6% |
| $10,000 to $14,999 | 19 | 1.0% |
| $15,000 to $24,999 | 11 | 0.6% |
| $25,000 to $34,999 | 15 | 0.8% |
| $35,000 to $49,999 | 196 | 10.5% |
| $50,000 to $74,999 | 253 | 13.6% |
| $75,000 to $99,999 | 564 | 30.3% |
| $100,000 to $149,999 | 490 | 26.3% |
| $150,000 to $199,999 | 186 | 10.0% |
| $200,000+ | 114 | 6.1% |
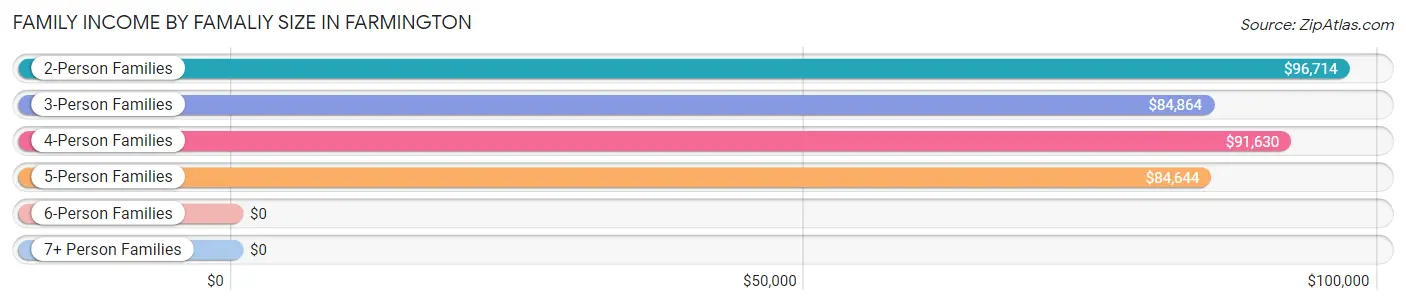
Family Income by Famaliy Size in Farmington
2-person families (670 | 36.0%) account for the highest median family income in Farmington with $96,714 per family, while 2-person families (670 | 36.0%) have the highest median income of $48,357 per family member.
| Income Bracket | # Families | Median Income |
| 2-Person Families | 670 (36.0%) | $96,714 |
| 3-Person Families | 473 (25.4%) | $84,864 |
| 4-Person Families | 162 (8.7%) | $91,630 |
| 5-Person Families | 341 (18.3%) | $84,644 |
| 6-Person Families | 120 (6.4%) | $0 |
| 7+ Person Families | 96 (5.2%) | $0 |
| Total | 1,862 (100.0%) | $95,504 |
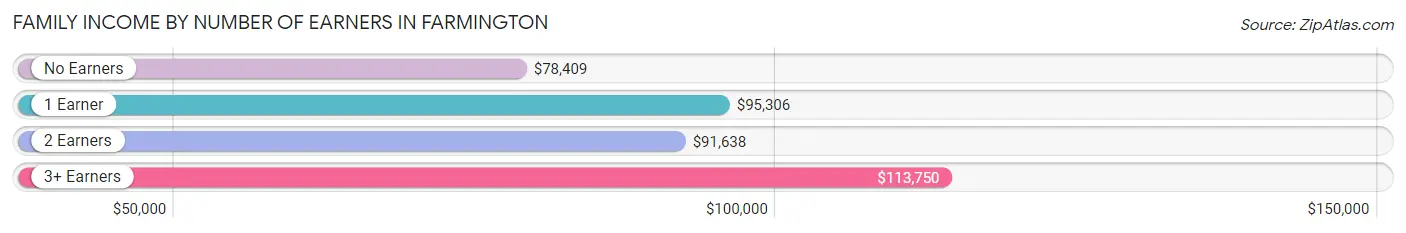
Family Income by Number of Earners in Farmington
The median family income in Farmington is $95,504, with families comprising 3+ earners (182) having the highest median family income of $113,750, while families with no earners (130) have the lowest median family income of $78,409, accounting for 9.8% and 7.0% of families, respectively.
| Number of Earners | # Families | Median Income |
| No Earners | 130 (7.0%) | $78,409 |
| 1 Earner | 662 (35.5%) | $95,306 |
| 2 Earners | 888 (47.7%) | $91,638 |
| 3+ Earners | 182 (9.8%) | $113,750 |
| Total | 1,862 (100.0%) | $95,504 |
Household Income in Farmington
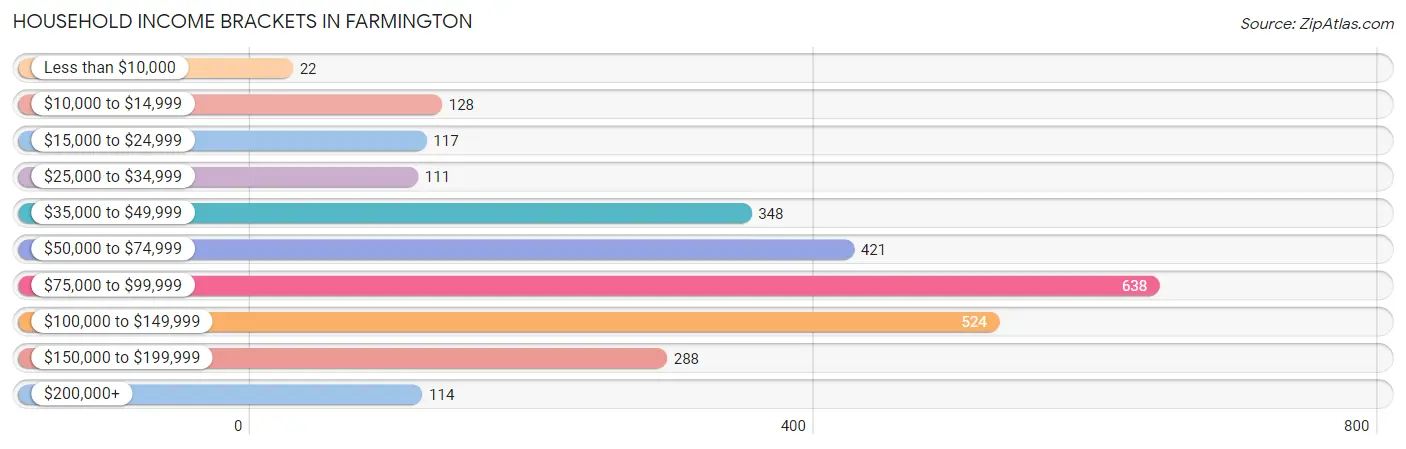
Household Income Brackets in Farmington
With 638 households falling in the category, the $75,000 to $99,999 income range is the most frequent in Farmington, accounting for 23.5% of all households. In contrast, only 22 households (0.8%) fall into the less than $10,000 income bracket, making it the least populous group.
| Income Bracket | # Households | % Households |
| Less than $10,000 | 22 | 0.8% |
| $10,000 to $14,999 | 128 | 4.7% |
| $15,000 to $24,999 | 117 | 4.3% |
| $25,000 to $34,999 | 111 | 4.1% |
| $35,000 to $49,999 | 348 | 12.8% |
| $50,000 to $74,999 | 421 | 15.5% |
| $75,000 to $99,999 | 638 | 23.5% |
| $100,000 to $149,999 | 524 | 19.3% |
| $150,000 to $199,999 | 288 | 10.6% |
| $200,000+ | 114 | 4.2% |
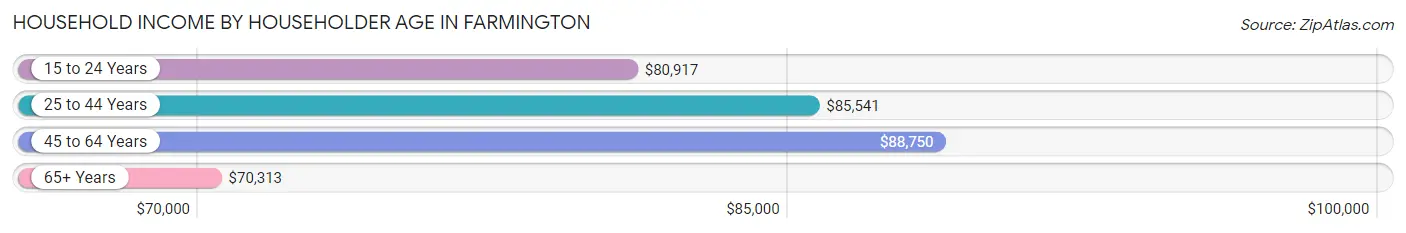
Household Income by Householder Age in Farmington
The median household income in Farmington is $83,783, with the highest median household income of $88,750 found in the 45 to 64 years age bracket for the primary householder. A total of 699 households (25.7%) fall into this category. Meanwhile, the 65+ years age bracket for the primary householder has the lowest median household income of $70,313, with 754 households (27.8%) in this group.
| Income Bracket | # Households | Median Income |
| 15 to 24 Years | 63 (2.3%) | $80,917 |
| 25 to 44 Years | 1,200 (44.2%) | $85,541 |
| 45 to 64 Years | 699 (25.7%) | $88,750 |
| 65+ Years | 754 (27.8%) | $70,313 |
| Total | 2,716 (100.0%) | $83,783 |
Poverty in Farmington
Income Below Poverty by Sex and Age in Farmington
With 4.5% poverty level for males and 2.6% for females among the residents of Farmington, 65 to 74 year old males and 55 to 64 year old females are the most vulnerable to poverty, with 58 males (25.0%) and 63 females (15.6%) in their respective age groups living below the poverty level.
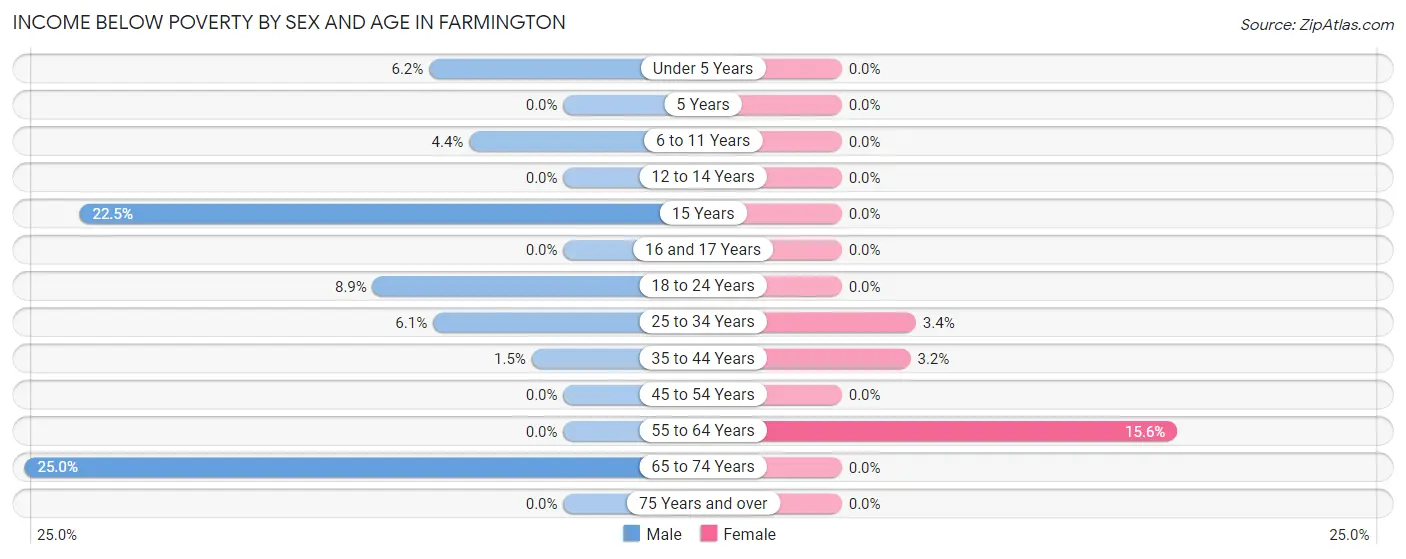
| Age Bracket | Male | Female |
| Under 5 Years | 17 (6.2%) | 0 (0.0%) |
| 5 Years | 0 (0.0%) | 0 (0.0%) |
| 6 to 11 Years | 20 (4.4%) | 0 (0.0%) |
| 12 to 14 Years | 0 (0.0%) | 0 (0.0%) |
| 15 Years | 22 (22.5%) | 0 (0.0%) |
| 16 and 17 Years | 0 (0.0%) | 0 (0.0%) |
| 18 to 24 Years | 17 (8.8%) | 0 (0.0%) |
| 25 to 34 Years | 30 (6.0%) | 17 (3.4%) |
| 35 to 44 Years | 12 (1.5%) | 24 (3.2%) |
| 45 to 54 Years | 0 (0.0%) | 0 (0.0%) |
| 55 to 64 Years | 0 (0.0%) | 63 (15.6%) |
| 65 to 74 Years | 58 (25.0%) | 0 (0.0%) |
| 75 Years and over | 0 (0.0%) | 0 (0.0%) |
| Total | 176 (4.5%) | 104 (2.6%) |
Income Above Poverty by Sex and Age in Farmington
According to the poverty statistics in Farmington, males aged 12 to 14 years and females aged under 5 years are the age groups that are most secure financially, with 100.0% of males and 100.0% of females in these age groups living above the poverty line.
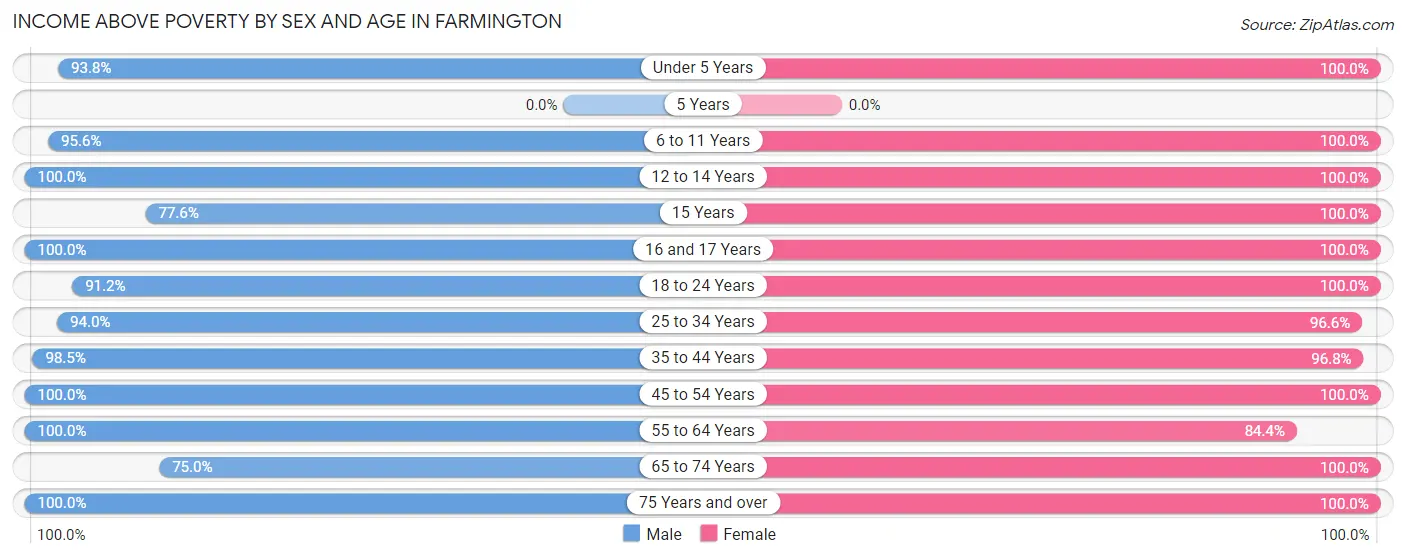
| Age Bracket | Male | Female |
| Under 5 Years | 256 (93.8%) | 300 (100.0%) |
| 5 Years | 0 (0.0%) | 0 (0.0%) |
| 6 to 11 Years | 438 (95.6%) | 333 (100.0%) |
| 12 to 14 Years | 419 (100.0%) | 341 (100.0%) |
| 15 Years | 76 (77.5%) | 76 (100.0%) |
| 16 and 17 Years | 180 (100.0%) | 43 (100.0%) |
| 18 to 24 Years | 175 (91.1%) | 274 (100.0%) |
| 25 to 34 Years | 466 (94.0%) | 477 (96.6%) |
| 35 to 44 Years | 804 (98.5%) | 729 (96.8%) |
| 45 to 54 Years | 380 (100.0%) | 341 (100.0%) |
| 55 to 64 Years | 127 (100.0%) | 342 (84.4%) |
| 65 to 74 Years | 174 (75.0%) | 220 (100.0%) |
| 75 Years and over | 211 (100.0%) | 400 (100.0%) |
| Total | 3,706 (95.5%) | 3,876 (97.4%) |
Income Below Poverty Among Married-Couple Families in Farmington
The poverty statistics for married-couple families in Farmington show that 2.0% or 30 of the total 1,495 families live below the poverty line. Families with 1 or 2 children have the highest poverty rate of 8.8%, comprising of 30 families. On the other hand, families with no children have the lowest poverty rate of 0.0%, which includes 0 families.
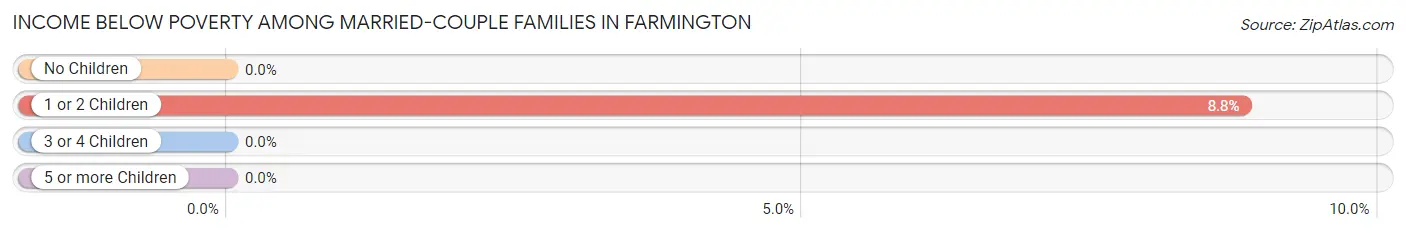
| Children | Above Poverty | Below Poverty |
| No Children | 634 (100.0%) | 0 (0.0%) |
| 1 or 2 Children | 310 (91.2%) | 30 (8.8%) |
| 3 or 4 Children | 425 (100.0%) | 0 (0.0%) |
| 5 or more Children | 96 (100.0%) | 0 (0.0%) |
| Total | 1,465 (98.0%) | 30 (2.0%) |
Income Below Poverty Among Single-Parent Households in Farmington
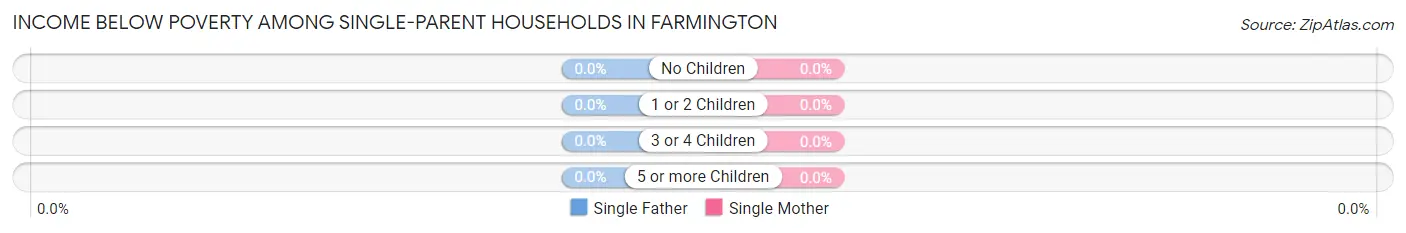
| Children | Single Father | Single Mother |
| No Children | 0 (0.0%) | 0 (0.0%) |
| 1 or 2 Children | 0 (0.0%) | 0 (0.0%) |
| 3 or 4 Children | 0 (0.0%) | 0 (0.0%) |
| 5 or more Children | 0 (0.0%) | 0 (0.0%) |
| Total | 0 (0.0%) | 0 (0.0%) |
Income Below Poverty Among Married-Couple vs Single-Parent Households in Farmington
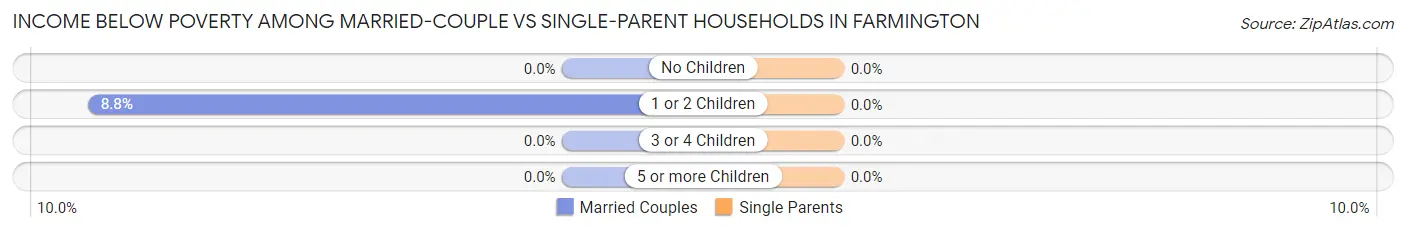
| Children | Married-Couple Families | Single-Parent Households |
| No Children | 0 (0.0%) | 0 (0.0%) |
| 1 or 2 Children | 30 (8.8%) | 0 (0.0%) |
| 3 or 4 Children | 0 (0.0%) | 0 (0.0%) |
| 5 or more Children | 0 (0.0%) | 0 (0.0%) |
| Total | 30 (2.0%) | 0 (0.0%) |
Race in Farmington
The most populous races in Farmington are White / Caucasian (6,553 | 82.0%), Two or more Races (829 | 10.4%), and Hispanic or Latino (578 | 7.2%).
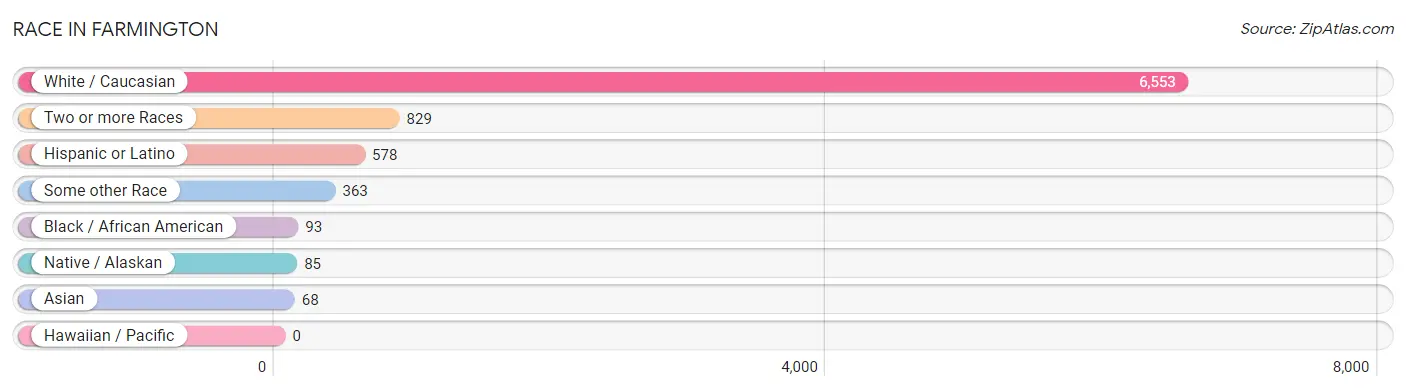
| Race | # Population | % Population |
| Asian | 68 | 0.9% |
| Black / African American | 93 | 1.2% |
| Hawaiian / Pacific | 0 | 0.0% |
| Hispanic or Latino | 578 | 7.2% |
| Native / Alaskan | 85 | 1.1% |
| White / Caucasian | 6,553 | 82.0% |
| Two or more Races | 829 | 10.4% |
| Some other Race | 363 | 4.5% |
| Total | 7,991 | 100.0% |
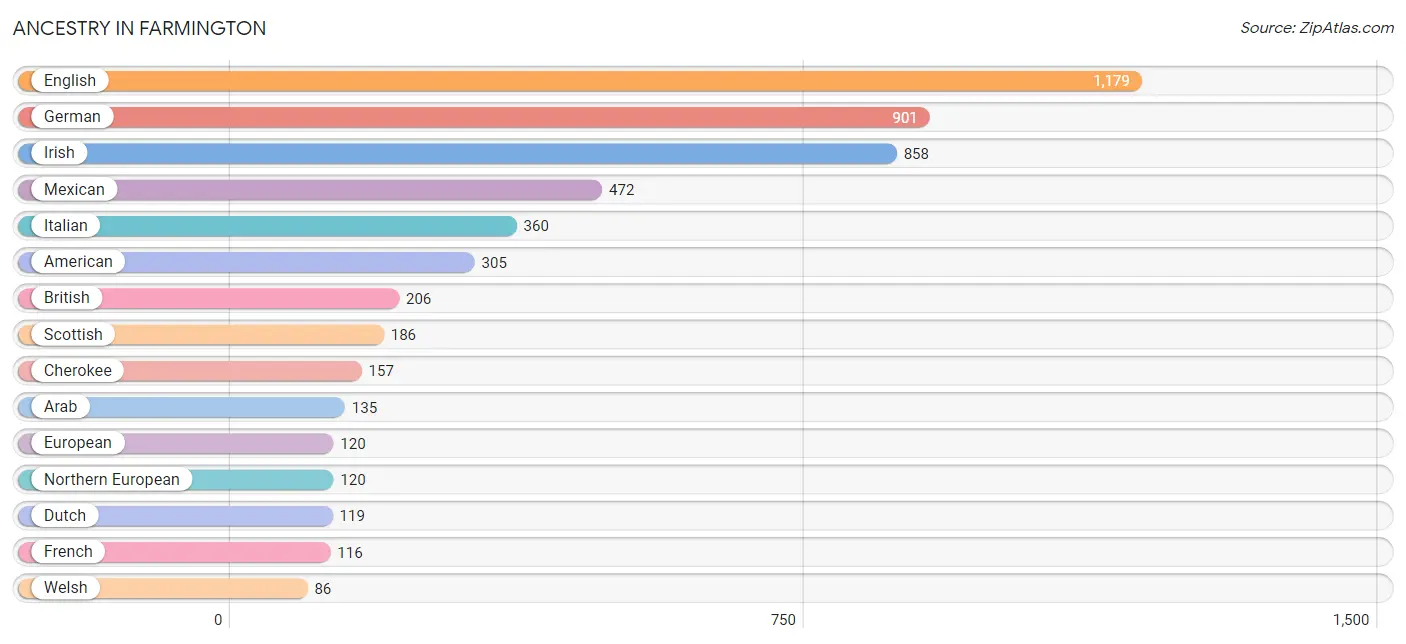
Ancestry in Farmington
The most populous ancestries reported in Farmington are English (1,179 | 14.7%), German (901 | 11.3%), Irish (858 | 10.7%), Mexican (472 | 5.9%), and Italian (360 | 4.5%), together accounting for 47.2% of all Farmington residents.
| Ancestry | # Population | % Population |
| American | 305 | 3.8% |
| Apache | 49 | 0.6% |
| Arab | 135 | 1.7% |
| Austrian | 41 | 0.5% |
| Barbadian | 14 | 0.2% |
| Bhutanese | 53 | 0.7% |
| British | 206 | 2.6% |
| Burmese | 15 | 0.2% |
| Canadian | 42 | 0.5% |
| Celtic | 16 | 0.2% |
| Cherokee | 157 | 2.0% |
| Choctaw | 49 | 0.6% |
| Czechoslovakian | 15 | 0.2% |
| Dutch | 119 | 1.5% |
| Dutch West Indian | 9 | 0.1% |
| English | 1,179 | 14.7% |
| European | 120 | 1.5% |
| Finnish | 25 | 0.3% |
| French | 116 | 1.5% |
| German | 901 | 11.3% |
| Irish | 858 | 10.7% |
| Italian | 360 | 4.5% |
| Mexican | 472 | 5.9% |
| Native Hawaiian | 25 | 0.3% |
| Northern European | 120 | 1.5% |
| Norwegian | 23 | 0.3% |
| Pennsylvania German | 18 | 0.2% |
| Peruvian | 17 | 0.2% |
| Polish | 19 | 0.2% |
| Pueblo | 4 | 0.1% |
| Puerto Rican | 25 | 0.3% |
| Russian | 25 | 0.3% |
| Scandinavian | 52 | 0.6% |
| Scotch-Irish | 75 | 0.9% |
| Scottish | 186 | 2.3% |
| Slovak | 14 | 0.2% |
| South American | 44 | 0.5% |
| Spaniard | 37 | 0.5% |
| Swedish | 46 | 0.6% |
| Ukrainian | 18 | 0.2% |
| Uruguayan | 27 | 0.3% |
| Welsh | 86 | 1.1% | View All 42 Rows |
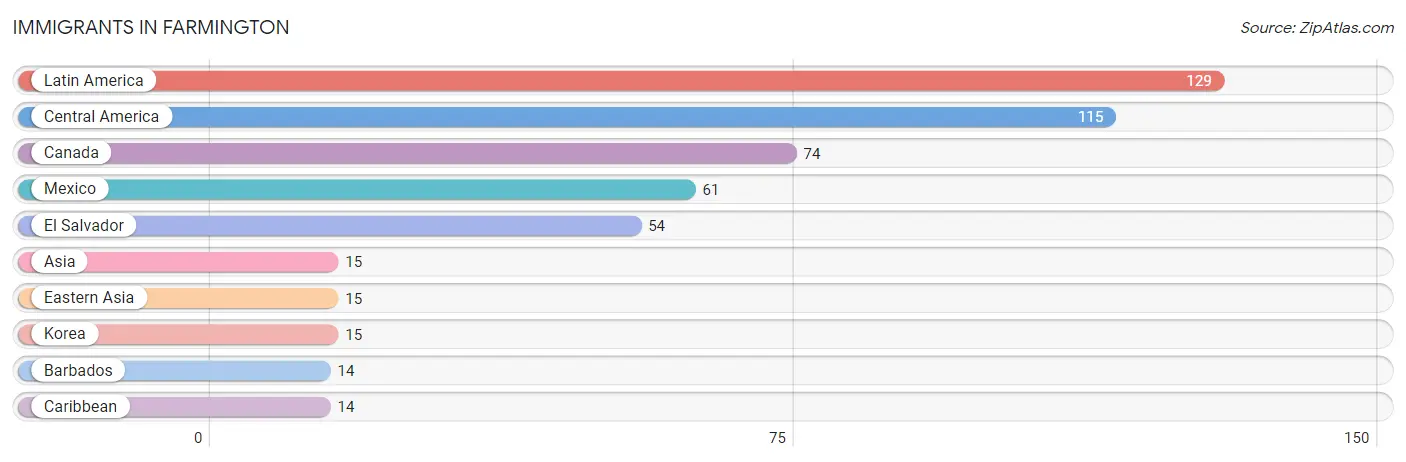
Immigrants in Farmington
The most numerous immigrant groups reported in Farmington came from Latin America (129 | 1.6%), Central America (115 | 1.4%), Canada (74 | 0.9%), Mexico (61 | 0.8%), and El Salvador (54 | 0.7%), together accounting for 5.4% of all Farmington residents.
| Immigration Origin | # Population | % Population |
| Asia | 15 | 0.2% |
| Barbados | 14 | 0.2% |
| Canada | 74 | 0.9% |
| Caribbean | 14 | 0.2% |
| Central America | 115 | 1.4% |
| Eastern Asia | 15 | 0.2% |
| El Salvador | 54 | 0.7% |
| Korea | 15 | 0.2% |
| Latin America | 129 | 1.6% |
| Mexico | 61 | 0.8% | View All 10 Rows |
Sex and Age in Farmington
Sex and Age in Farmington
The most populous age groups in Farmington are 35 to 39 Years (499 | 12.9%) for men and 35 to 39 Years (588 | 14.3%) for women.
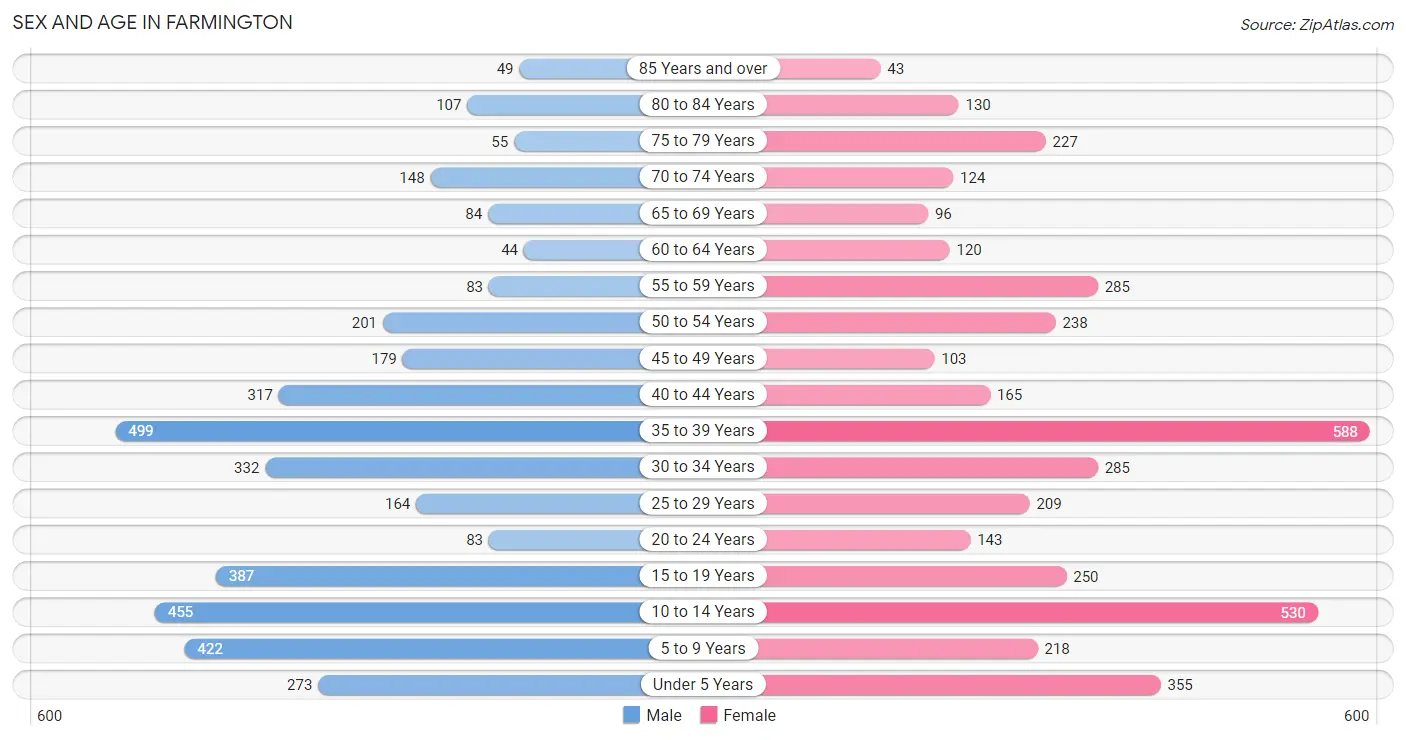
| Age Bracket | Male | Female |
| Under 5 Years | 273 (7.0%) | 355 (8.6%) |
| 5 to 9 Years | 422 (10.9%) | 218 (5.3%) |
| 10 to 14 Years | 455 (11.7%) | 530 (12.9%) |
| 15 to 19 Years | 387 (10.0%) | 250 (6.1%) |
| 20 to 24 Years | 83 (2.1%) | 143 (3.5%) |
| 25 to 29 Years | 164 (4.2%) | 209 (5.1%) |
| 30 to 34 Years | 332 (8.6%) | 285 (6.9%) |
| 35 to 39 Years | 499 (12.9%) | 588 (14.3%) |
| 40 to 44 Years | 317 (8.2%) | 165 (4.0%) |
| 45 to 49 Years | 179 (4.6%) | 103 (2.5%) |
| 50 to 54 Years | 201 (5.2%) | 238 (5.8%) |
| 55 to 59 Years | 83 (2.1%) | 285 (6.9%) |
| 60 to 64 Years | 44 (1.1%) | 120 (2.9%) |
| 65 to 69 Years | 84 (2.2%) | 96 (2.3%) |
| 70 to 74 Years | 148 (3.8%) | 124 (3.0%) |
| 75 to 79 Years | 55 (1.4%) | 227 (5.5%) |
| 80 to 84 Years | 107 (2.8%) | 130 (3.2%) |
| 85 Years and over | 49 (1.3%) | 43 (1.1%) |
| Total | 3,882 (100.0%) | 4,109 (100.0%) |
Families and Households in Farmington
Median Family Size in Farmington
The median family size in Farmington is 3.59 persons per family, with married-couple families (1,495 | 80.3%) accounting for the largest median family size of 3.81 persons per family. On the other hand, single female/mother families (311 | 16.7%) represent the smallest median family size with 2.56 persons per family.
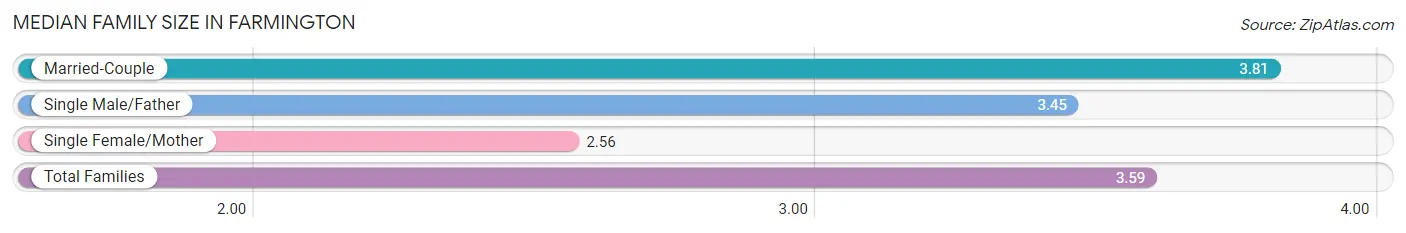
| Family Type | # Families | Family Size |
| Married-Couple | 1,495 (80.3%) | 3.81 |
| Single Male/Father | 56 (3.0%) | 3.45 |
| Single Female/Mother | 311 (16.7%) | 2.56 |
| Total Families | 1,862 (100.0%) | 3.59 |
Median Household Size in Farmington
The median household size in Farmington is 2.94 persons per household, with married-couple households (1,495 | 55.0%) accounting for the largest median household size of 3.81 persons per household. non-family households (854 | 31.4%) represent the smallest median household size with 1.41 persons per household.
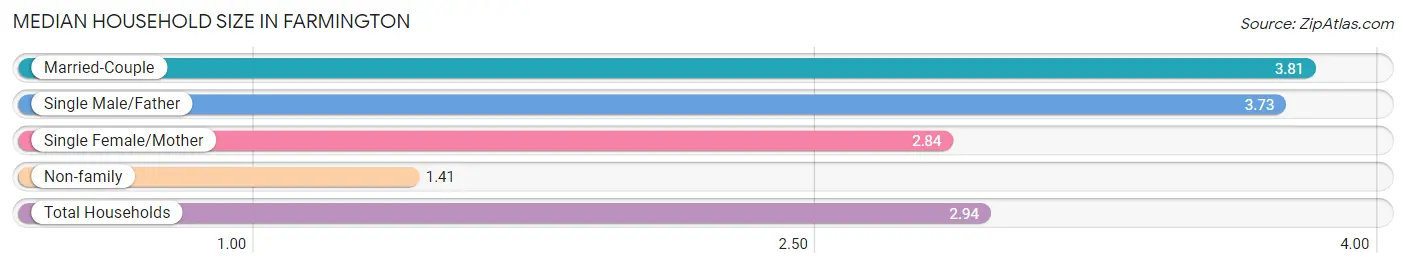
| Household Type | # Households | Household Size |
| Married-Couple | 1,495 (55.0%) | 3.81 |
| Single Male/Father | 56 (2.1%) | 3.73 |
| Single Female/Mother | 311 (11.5%) | 2.84 |
| Non-family | 854 (31.4%) | 1.41 |
| Total Households | 2,716 (100.0%) | 2.94 |
Household Size by Marriage Status in Farmington
Out of a total of 2,716 households in Farmington, 1,862 (68.6%) are family households, while 854 (31.4%) are nonfamily households. The most numerous type of family households are 2-person households, comprising 586, and the most common type of nonfamily households are 1-person households, comprising 627.
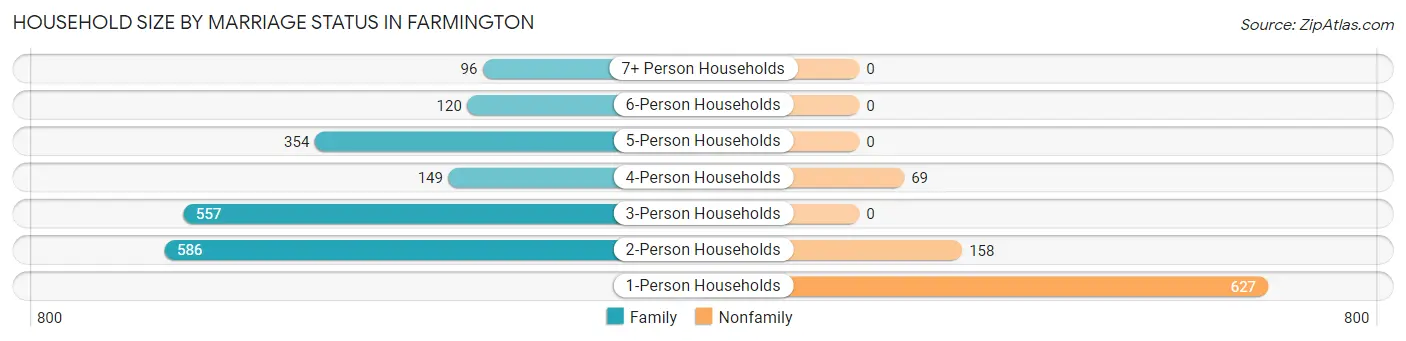
| Household Size | Family Households | Nonfamily Households |
| 1-Person Households | - | 627 (23.1%) |
| 2-Person Households | 586 (21.6%) | 158 (5.8%) |
| 3-Person Households | 557 (20.5%) | 0 (0.0%) |
| 4-Person Households | 149 (5.5%) | 69 (2.5%) |
| 5-Person Households | 354 (13.0%) | 0 (0.0%) |
| 6-Person Households | 120 (4.4%) | 0 (0.0%) |
| 7+ Person Households | 96 (3.5%) | 0 (0.0%) |
| Total | 1,862 (68.6%) | 854 (31.4%) |
Female Fertility in Farmington
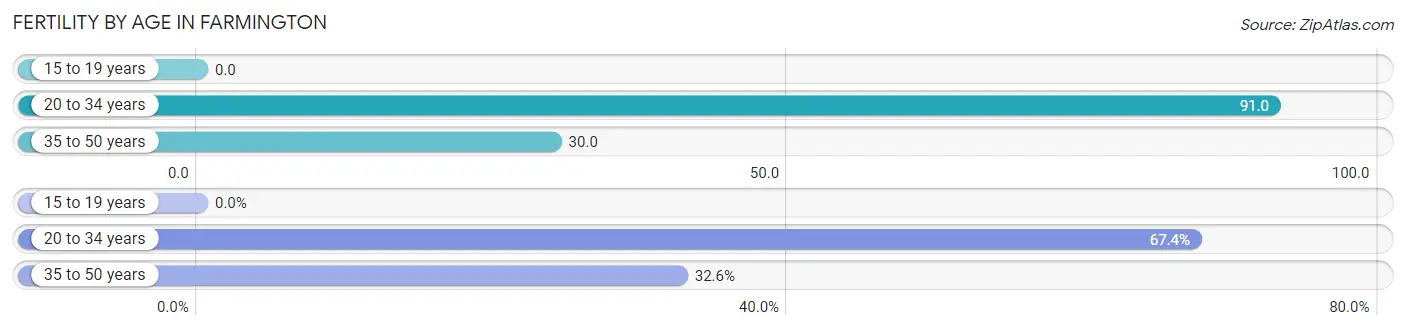
Fertility by Age in Farmington
Average fertility rate in Farmington is 48.0 births per 1,000 women. Women in the age bracket of 20 to 34 years have the highest fertility rate with 91.0 births per 1,000 women. Women in the age bracket of 20 to 34 years acount for 67.4% of all women with births.
| Age Bracket | Women with Births | Births / 1,000 Women |
| 15 to 19 years | 0 (0.0%) | 0.0 |
| 20 to 34 years | 58 (67.4%) | 91.0 |
| 35 to 50 years | 28 (32.6%) | 30.0 |
| Total | 86 (100.0%) | 48.0 |
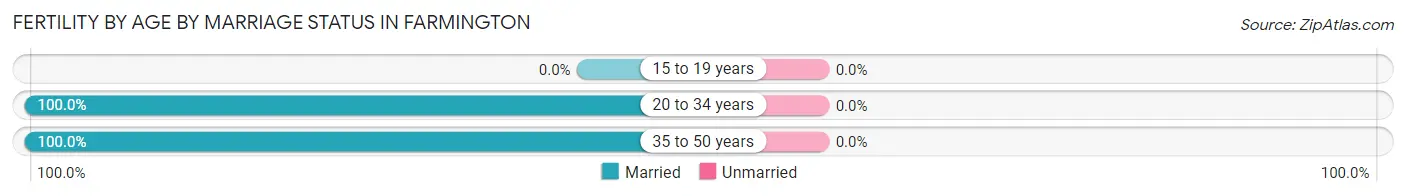
Fertility by Age by Marriage Status in Farmington
| Age Bracket | Married | Unmarried |
| 15 to 19 years | 0 (0.0%) | 0 (0.0%) |
| 20 to 34 years | 58 (100.0%) | 0 (0.0%) |
| 35 to 50 years | 28 (100.0%) | 0 (0.0%) |
| Total | 86 (100.0%) | 0 (0.0%) |
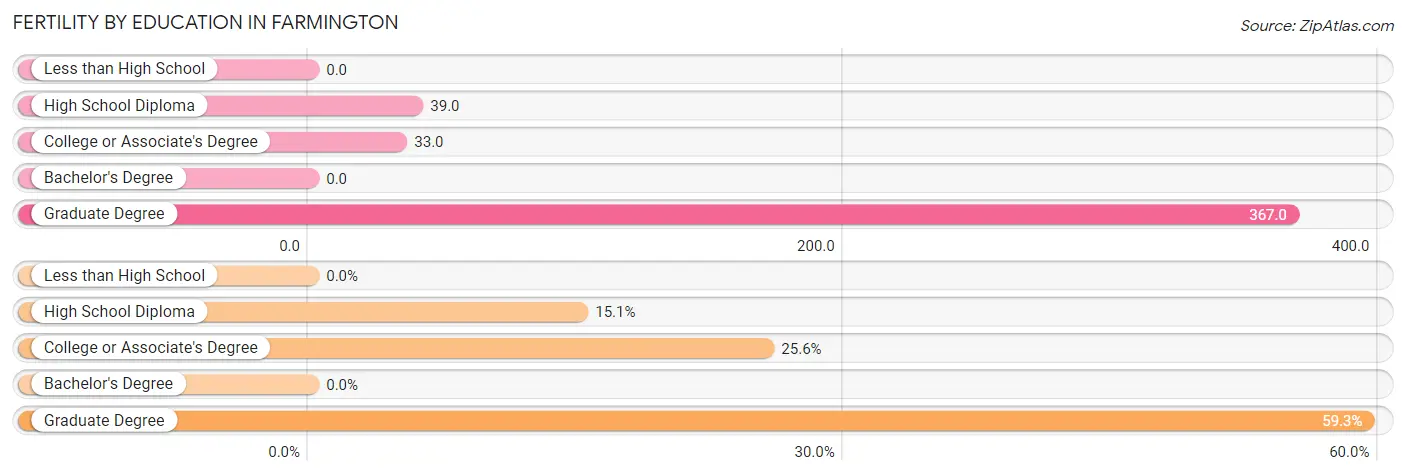
Fertility by Education in Farmington
| Educational Attainment | Women with Births | Births / 1,000 Women |
| Less than High School | 0 (0.0%) | 0.0 |
| High School Diploma | 13 (15.1%) | 39.0 |
| College or Associate's Degree | 22 (25.6%) | 33.0 |
| Bachelor's Degree | 0 (0.0%) | 0.0 |
| Graduate Degree | 51 (59.3%) | 367.0 |
| Total | 86 (100.0%) | 48.0 |
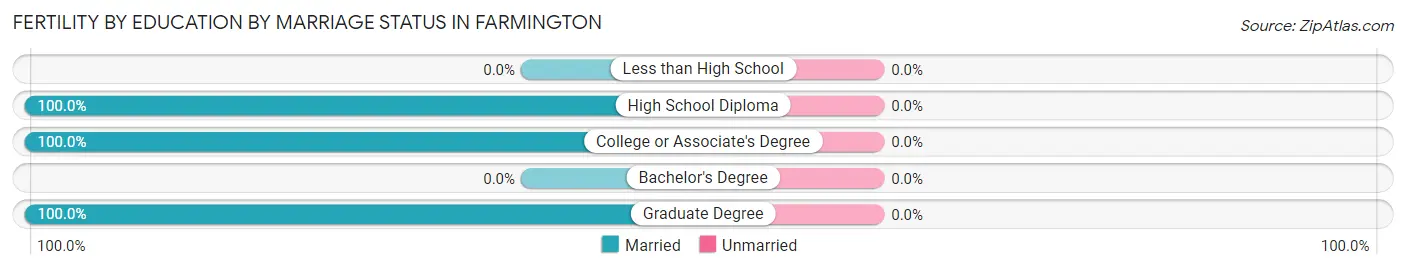
Fertility by Education by Marriage Status in Farmington
| Educational Attainment | Married | Unmarried |
| Less than High School | 0 (0.0%) | 0 (0.0%) |
| High School Diploma | 13 (100.0%) | 0 (0.0%) |
| College or Associate's Degree | 22 (100.0%) | 0 (0.0%) |
| Bachelor's Degree | 0 (0.0%) | 0 (0.0%) |
| Graduate Degree | 51 (100.0%) | 0 (0.0%) |
| Total | 86 (100.0%) | 0 (0.0%) |
Employment Characteristics in Farmington
Employment by Class of Employer in Farmington
Among the 3,273 employed individuals in Farmington, private company employees (1,932 | 59.0%), self-employed (not incorporated) (377 | 11.5%), and local government employees (277 | 8.5%) make up the most common classes of employment.
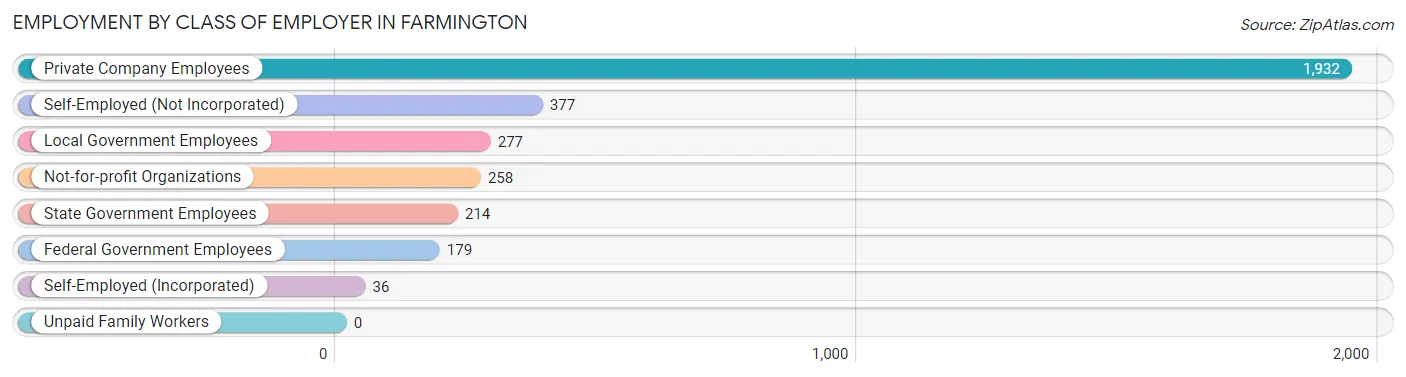
| Employer Class | # Employees | % Employees |
| Private Company Employees | 1,932 | 59.0% |
| Self-Employed (Incorporated) | 36 | 1.1% |
| Self-Employed (Not Incorporated) | 377 | 11.5% |
| Not-for-profit Organizations | 258 | 7.9% |
| Local Government Employees | 277 | 8.5% |
| State Government Employees | 214 | 6.5% |
| Federal Government Employees | 179 | 5.5% |
| Unpaid Family Workers | 0 | 0.0% |
| Total | 3,273 | 100.0% |
Employment Status by Age in Farmington
According to the labor force statistics for Farmington, out of the total population over 16 years of age (5,564), 59.8% or 3,327 individuals are in the labor force, with 0.4% or 13 of them unemployed. The age group with the highest labor force participation rate is 20 to 24 years, with 100.0% or 226 individuals in the labor force. Within the labor force, the 20 to 24 years age range has the highest percentage of unemployed individuals, with 5.8% or 13 of them being unemployed.
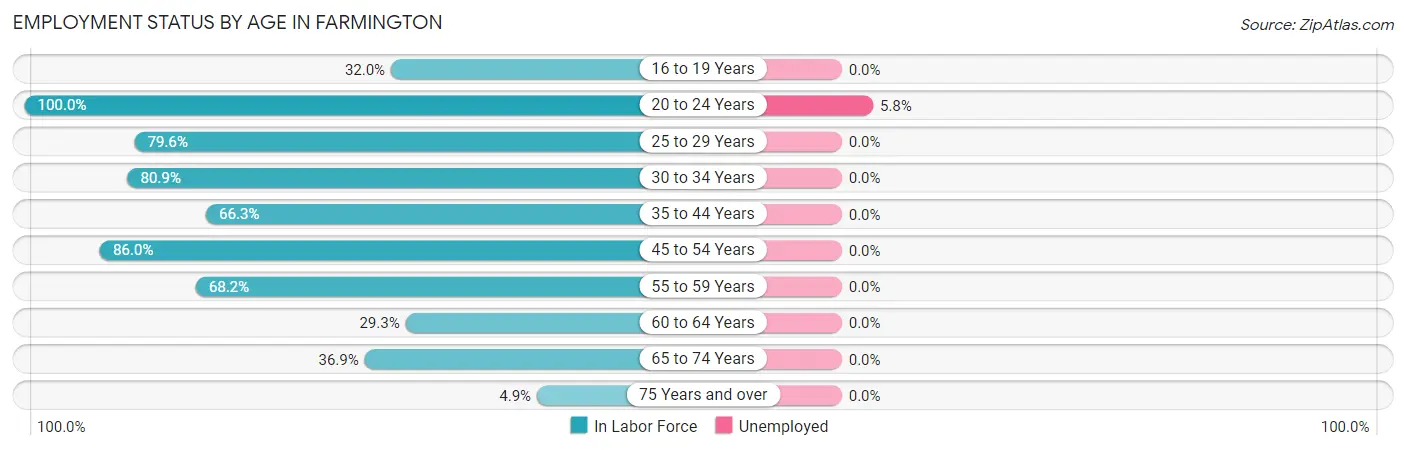
| Age Bracket | In Labor Force | Unemployed |
| 16 to 19 Years | 148 (32.0%) | 0 (0.0%) |
| 20 to 24 Years | 226 (100.0%) | 13 (5.8%) |
| 25 to 29 Years | 297 (79.6%) | 0 (0.0%) |
| 30 to 34 Years | 499 (80.9%) | 0 (0.0%) |
| 35 to 44 Years | 1,040 (66.3%) | 0 (0.0%) |
| 45 to 54 Years | 620 (86.0%) | 0 (0.0%) |
| 55 to 59 Years | 251 (68.2%) | 0 (0.0%) |
| 60 to 64 Years | 48 (29.3%) | 0 (0.0%) |
| 65 to 74 Years | 167 (36.9%) | 0 (0.0%) |
| 75 Years and over | 30 (4.9%) | 0 (0.0%) |
| Total | 3,327 (59.8%) | 13 (0.4%) |
Employment Status by Educational Attainment in Farmington
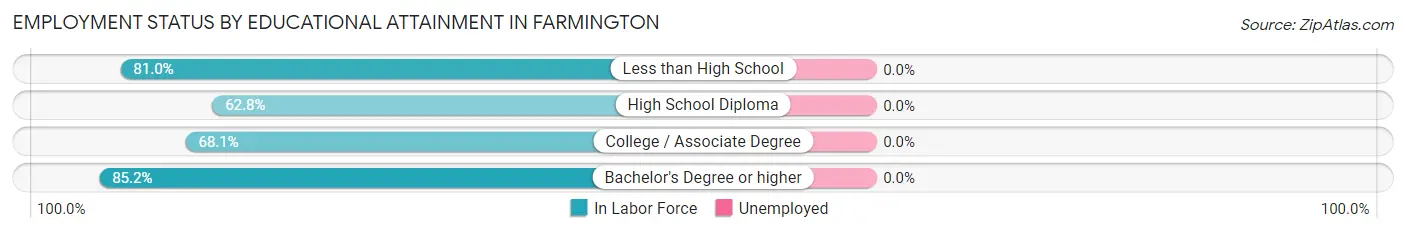
| Educational Attainment | In Labor Force | Unemployed |
| Less than High School | 209 (81.0%) | 0 (0.0%) |
| High School Diploma | 722 (62.8%) | 0 (0.0%) |
| College / Associate Degree | 895 (68.1%) | 0 (0.0%) |
| Bachelor's Degree or higher | 930 (85.2%) | 0 (0.0%) |
| Total | 2,756 (72.3%) | 0 (0.0%) |
Employment Occupations by Sex in Farmington
Management, Business, Science and Arts Occupations
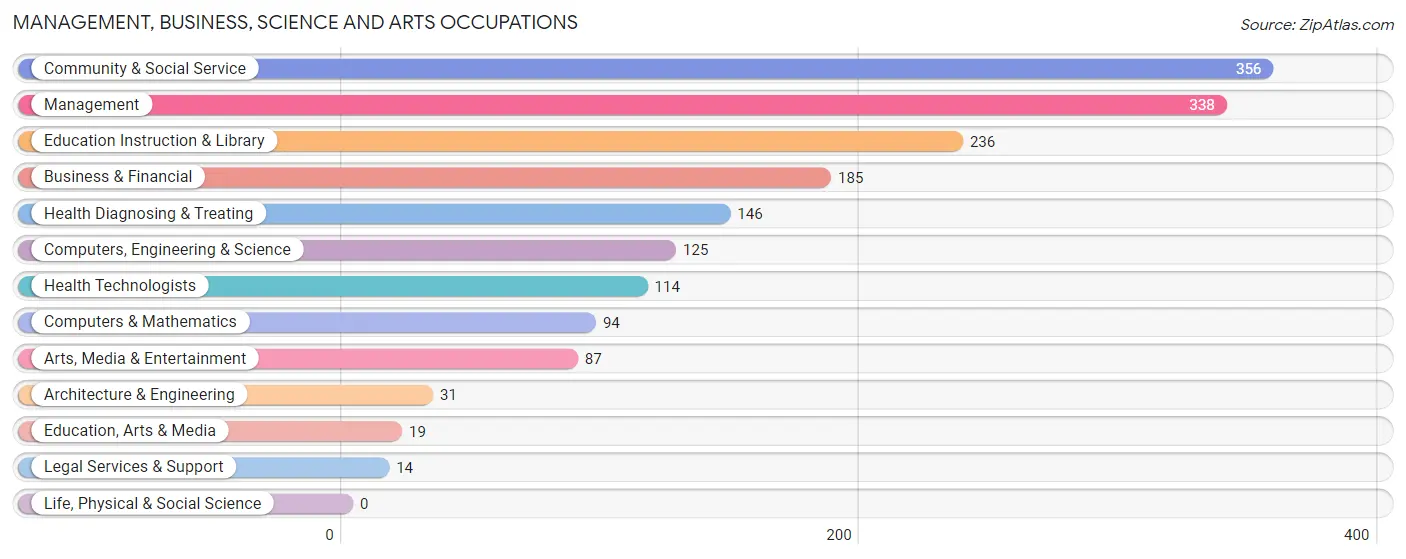
The most common Management, Business, Science and Arts occupations in Farmington are Community & Social Service (356 | 10.7%), Management (338 | 10.2%), Education Instruction & Library (236 | 7.1%), Business & Financial (185 | 5.6%), and Health Diagnosing & Treating (146 | 4.4%).
Management, Business, Science and Arts Occupations by Sex
Within the Management, Business, Science and Arts occupations in Farmington, the most male-oriented occupations are Architecture & Engineering (100.0%), Education, Arts & Media (100.0%), and Arts, Media & Entertainment (87.4%), while the most female-oriented occupations are Legal Services & Support (100.0%), Business & Financial (86.0%), and Education Instruction & Library (61.4%).
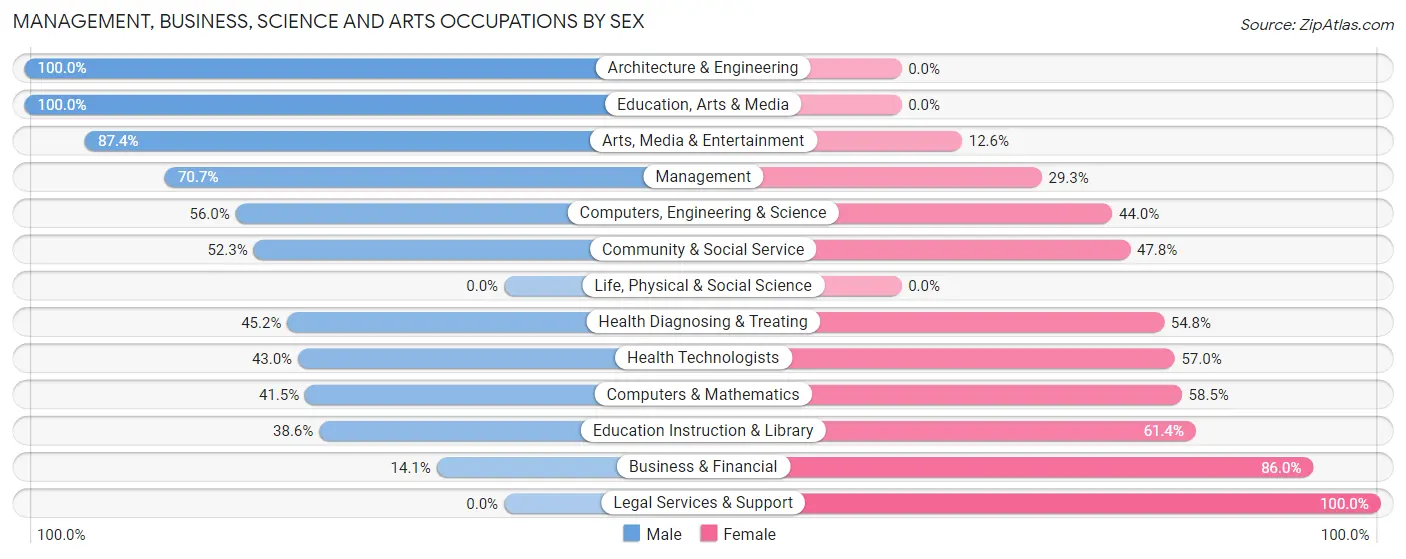
| Occupation | Male | Female |
| Management | 239 (70.7%) | 99 (29.3%) |
| Business & Financial | 26 (14.1%) | 159 (86.0%) |
| Computers, Engineering & Science | 70 (56.0%) | 55 (44.0%) |
| Computers & Mathematics | 39 (41.5%) | 55 (58.5%) |
| Architecture & Engineering | 31 (100.0%) | 0 (0.0%) |
| Life, Physical & Social Science | 0 (0.0%) | 0 (0.0%) |
| Community & Social Service | 186 (52.2%) | 170 (47.7%) |
| Education, Arts & Media | 19 (100.0%) | 0 (0.0%) |
| Legal Services & Support | 0 (0.0%) | 14 (100.0%) |
| Education Instruction & Library | 91 (38.6%) | 145 (61.4%) |
| Arts, Media & Entertainment | 76 (87.4%) | 11 (12.6%) |
| Health Diagnosing & Treating | 66 (45.2%) | 80 (54.8%) |
| Health Technologists | 49 (43.0%) | 65 (57.0%) |
| Total (Category) | 587 (51.0%) | 563 (49.0%) |
| Total (Overall) | 1,793 (54.1%) | 1,521 (45.9%) |
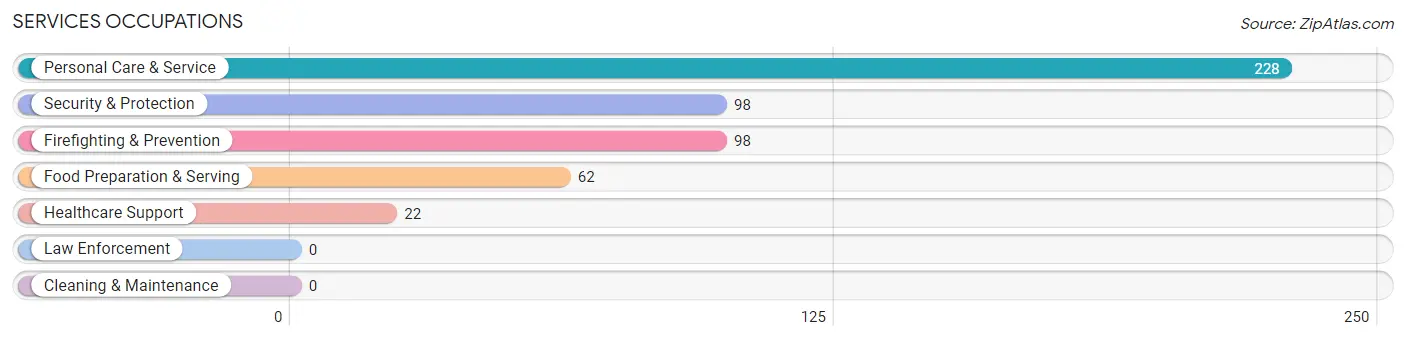
Services Occupations
The most common Services occupations in Farmington are Personal Care & Service (228 | 6.9%), Security & Protection (98 | 3.0%), Firefighting & Prevention (98 | 3.0%), Food Preparation & Serving (62 | 1.9%), and Healthcare Support (22 | 0.7%).
Services Occupations by Sex
Within the Services occupations in Farmington, the most male-oriented occupations are Security & Protection (100.0%), Firefighting & Prevention (100.0%), and Personal Care & Service (21.0%), while the most female-oriented occupations are Healthcare Support (100.0%), Food Preparation & Serving (79.0%), and Personal Care & Service (78.9%).
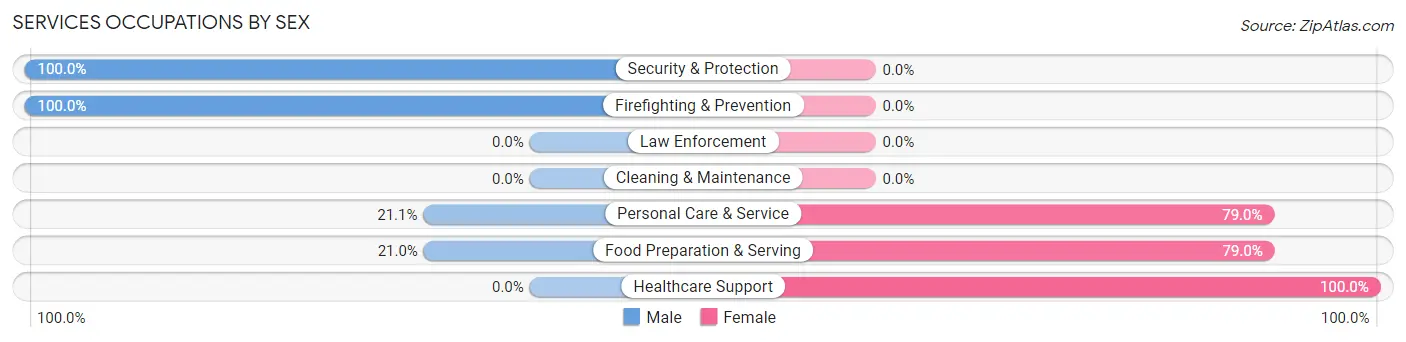
| Occupation | Male | Female |
| Healthcare Support | 0 (0.0%) | 22 (100.0%) |
| Security & Protection | 98 (100.0%) | 0 (0.0%) |
| Firefighting & Prevention | 98 (100.0%) | 0 (0.0%) |
| Law Enforcement | 0 (0.0%) | 0 (0.0%) |
| Food Preparation & Serving | 13 (21.0%) | 49 (79.0%) |
| Cleaning & Maintenance | 0 (0.0%) | 0 (0.0%) |
| Personal Care & Service | 48 (21.0%) | 180 (78.9%) |
| Total (Category) | 159 (38.8%) | 251 (61.2%) |
| Total (Overall) | 1,793 (54.1%) | 1,521 (45.9%) |
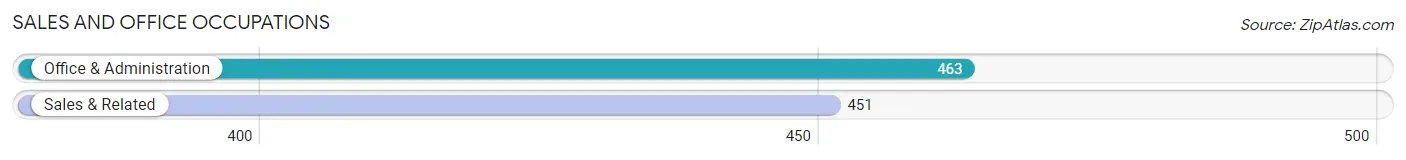
Sales and Office Occupations
The most common Sales and Office occupations in Farmington are Office & Administration (463 | 14.0%), and Sales & Related (451 | 13.6%).
Sales and Office Occupations by Sex
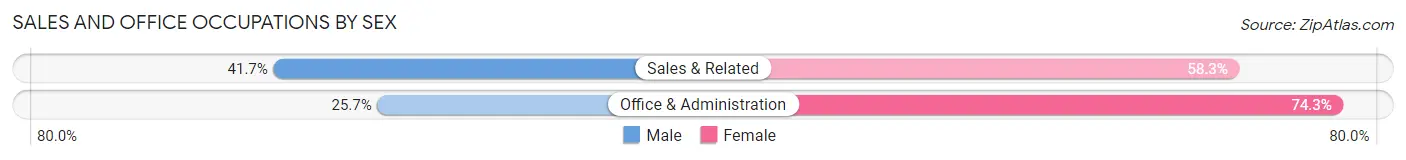
| Occupation | Male | Female |
| Sales & Related | 188 (41.7%) | 263 (58.3%) |
| Office & Administration | 119 (25.7%) | 344 (74.3%) |
| Total (Category) | 307 (33.6%) | 607 (66.4%) |
| Total (Overall) | 1,793 (54.1%) | 1,521 (45.9%) |
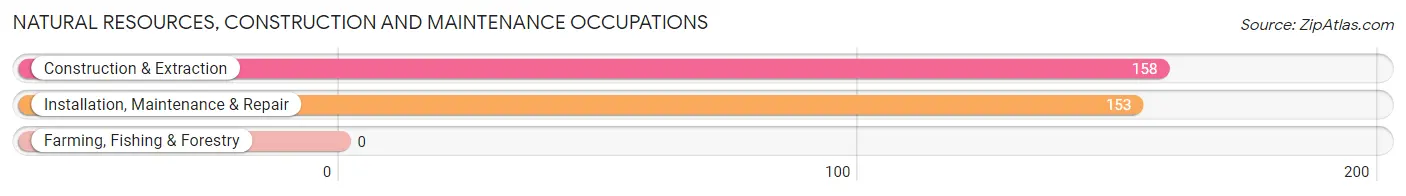
Natural Resources, Construction and Maintenance Occupations
The most common Natural Resources, Construction and Maintenance occupations in Farmington are Construction & Extraction (158 | 4.8%), and Installation, Maintenance & Repair (153 | 4.6%).
Natural Resources, Construction and Maintenance Occupations by Sex
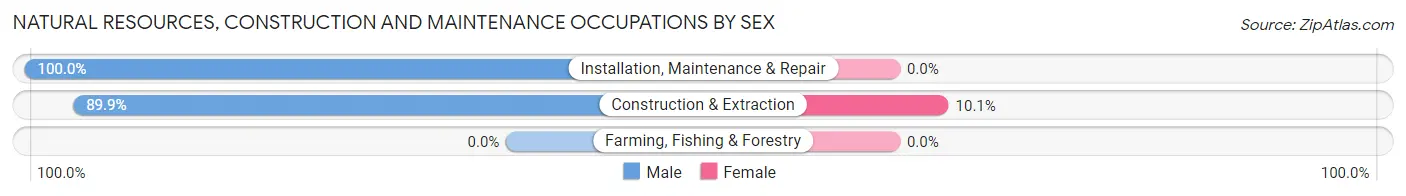
| Occupation | Male | Female |
| Farming, Fishing & Forestry | 0 (0.0%) | 0 (0.0%) |
| Construction & Extraction | 142 (89.9%) | 16 (10.1%) |
| Installation, Maintenance & Repair | 153 (100.0%) | 0 (0.0%) |
| Total (Category) | 295 (94.9%) | 16 (5.1%) |
| Total (Overall) | 1,793 (54.1%) | 1,521 (45.9%) |
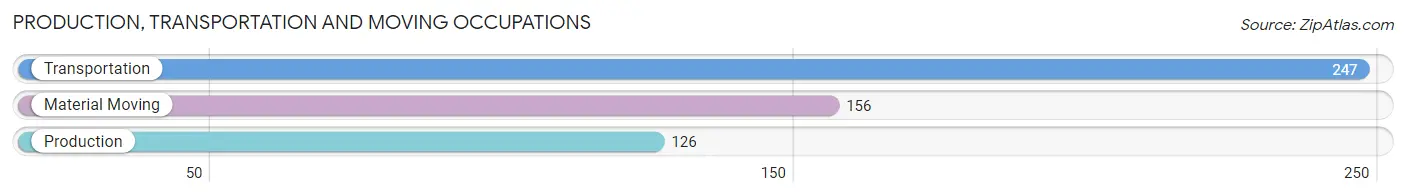
Production, Transportation and Moving Occupations
The most common Production, Transportation and Moving occupations in Farmington are Transportation (247 | 7.4%), Material Moving (156 | 4.7%), and Production (126 | 3.8%).
Production, Transportation and Moving Occupations by Sex
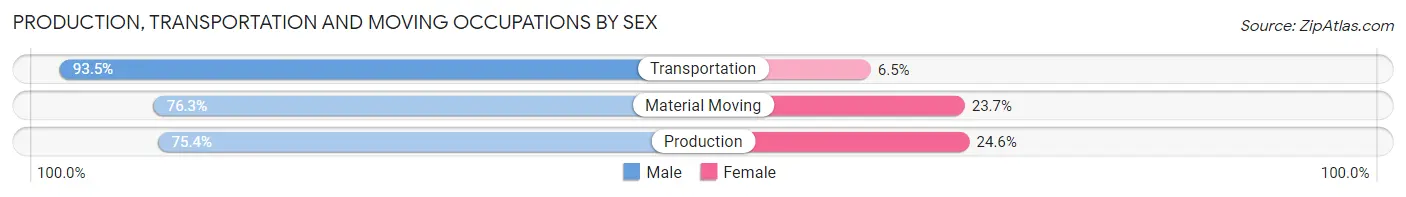
| Occupation | Male | Female |
| Production | 95 (75.4%) | 31 (24.6%) |
| Transportation | 231 (93.5%) | 16 (6.5%) |
| Material Moving | 119 (76.3%) | 37 (23.7%) |
| Total (Category) | 445 (84.1%) | 84 (15.9%) |
| Total (Overall) | 1,793 (54.1%) | 1,521 (45.9%) |
Employment Industries by Sex in Farmington
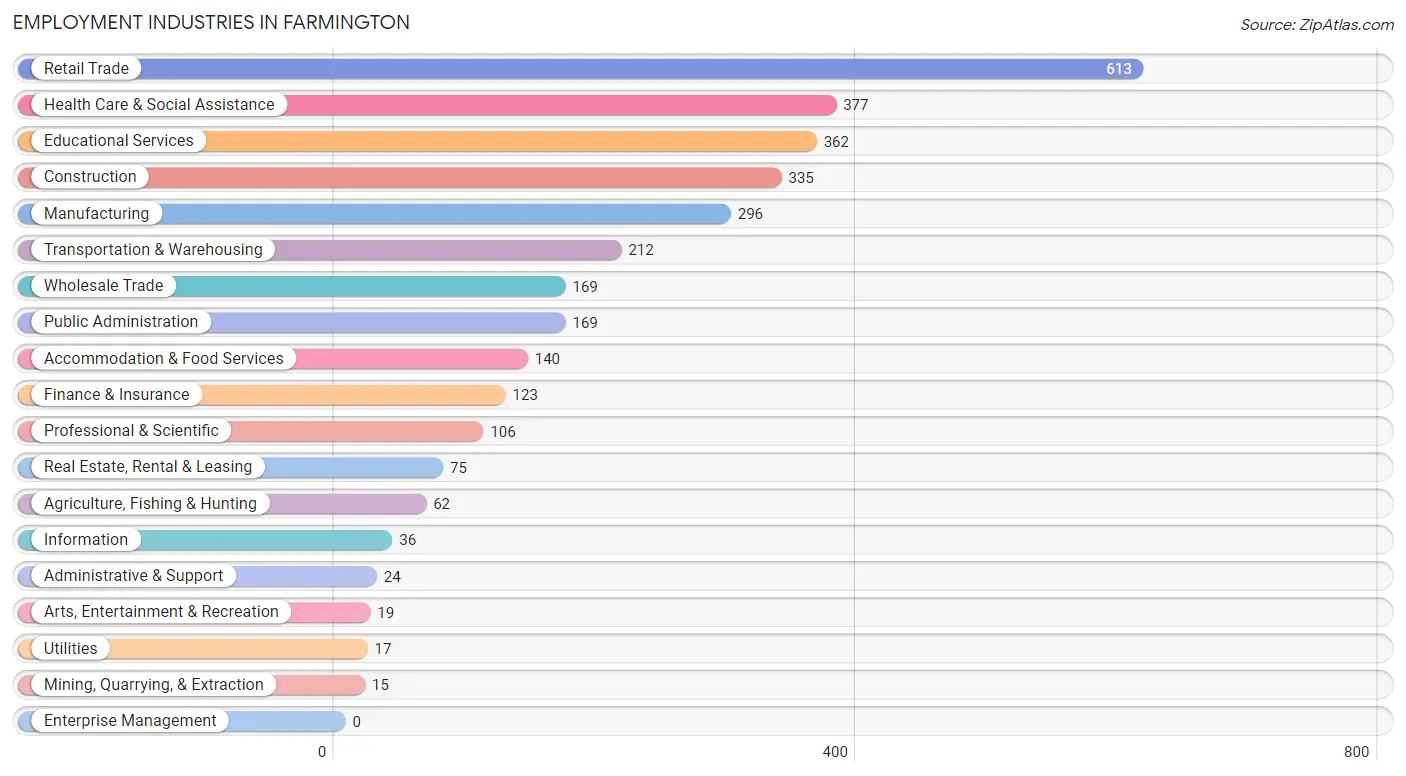
Employment Industries in Farmington
The major employment industries in Farmington include Retail Trade (613 | 18.5%), Health Care & Social Assistance (377 | 11.4%), Educational Services (362 | 10.9%), Construction (335 | 10.1%), and Manufacturing (296 | 8.9%).
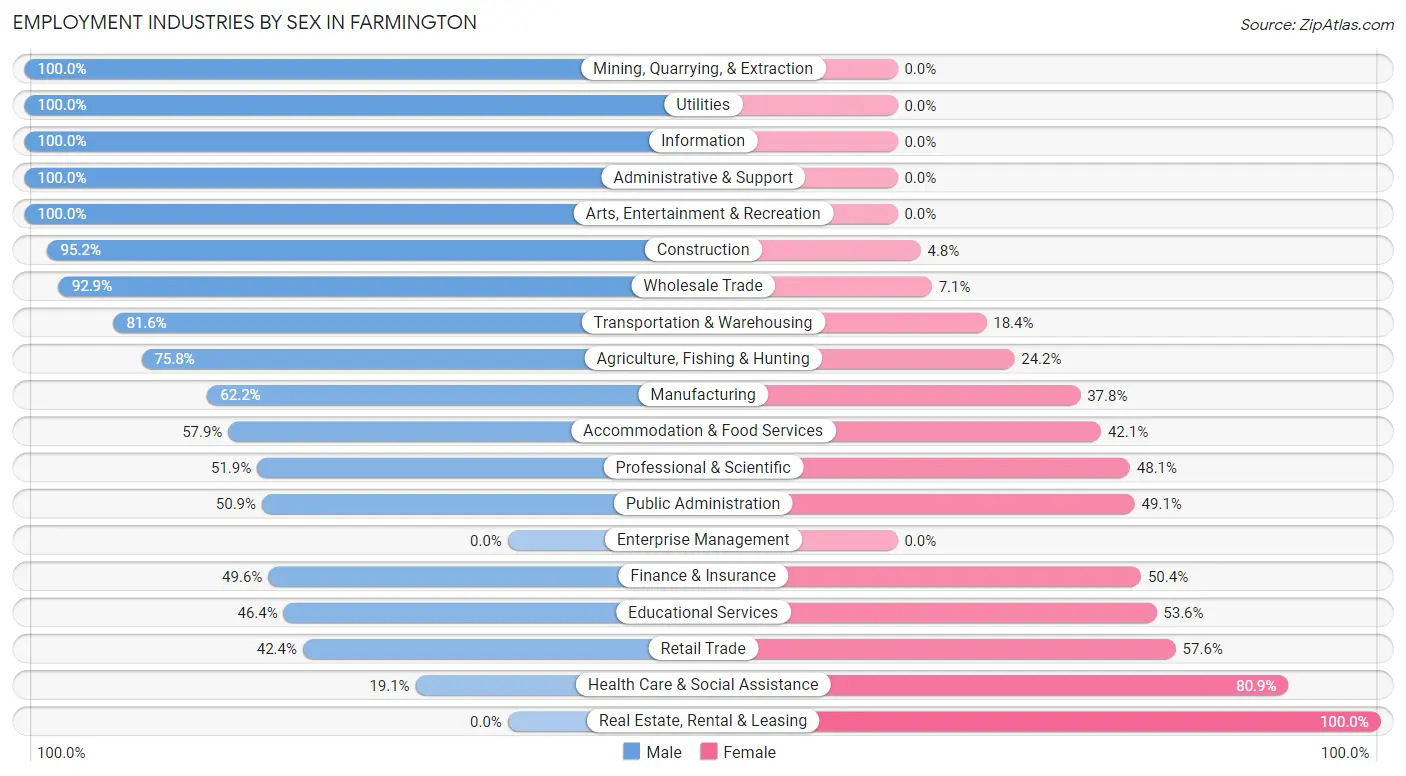
Employment Industries by Sex in Farmington
The Farmington industries that see more men than women are Mining, Quarrying, & Extraction (100.0%), Utilities (100.0%), and Information (100.0%), whereas the industries that tend to have a higher number of women are Real Estate, Rental & Leasing (100.0%), Health Care & Social Assistance (80.9%), and Retail Trade (57.6%).
| Industry | Male | Female |
| Agriculture, Fishing & Hunting | 47 (75.8%) | 15 (24.2%) |
| Mining, Quarrying, & Extraction | 15 (100.0%) | 0 (0.0%) |
| Construction | 319 (95.2%) | 16 (4.8%) |
| Manufacturing | 184 (62.2%) | 112 (37.8%) |
| Wholesale Trade | 157 (92.9%) | 12 (7.1%) |
| Retail Trade | 260 (42.4%) | 353 (57.6%) |
| Transportation & Warehousing | 173 (81.6%) | 39 (18.4%) |
| Utilities | 17 (100.0%) | 0 (0.0%) |
| Information | 36 (100.0%) | 0 (0.0%) |
| Finance & Insurance | 61 (49.6%) | 62 (50.4%) |
| Real Estate, Rental & Leasing | 0 (0.0%) | 75 (100.0%) |
| Professional & Scientific | 55 (51.9%) | 51 (48.1%) |
| Enterprise Management | 0 (0.0%) | 0 (0.0%) |
| Administrative & Support | 24 (100.0%) | 0 (0.0%) |
| Educational Services | 168 (46.4%) | 194 (53.6%) |
| Health Care & Social Assistance | 72 (19.1%) | 305 (80.9%) |
| Arts, Entertainment & Recreation | 19 (100.0%) | 0 (0.0%) |
| Accommodation & Food Services | 81 (57.9%) | 59 (42.1%) |
| Public Administration | 86 (50.9%) | 83 (49.1%) |
| Total | 1,793 (54.1%) | 1,521 (45.9%) |
Education in Farmington
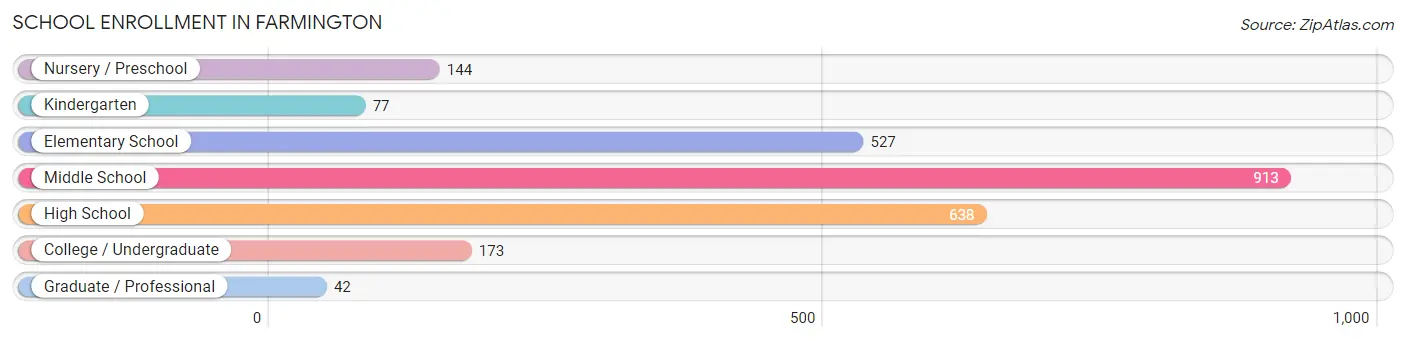
School Enrollment in Farmington
The most common levels of schooling among the 2,514 students in Farmington are middle school (913 | 36.3%), high school (638 | 25.4%), and elementary school (527 | 21.0%).
| School Level | # Students | % Students |
| Nursery / Preschool | 144 | 5.7% |
| Kindergarten | 77 | 3.1% |
| Elementary School | 527 | 21.0% |
| Middle School | 913 | 36.3% |
| High School | 638 | 25.4% |
| College / Undergraduate | 173 | 6.9% |
| Graduate / Professional | 42 | 1.7% |
| Total | 2,514 | 100.0% |
School Enrollment by Age by Funding Source in Farmington
Out of a total of 2,514 students who are enrolled in schools in Farmington, 143 (5.7%) attend a private institution, while the remaining 2,371 (94.3%) are enrolled in public schools. The age group of 35 years and over has the highest likelihood of being enrolled in private schools, with 11 (28.2% in the age bracket) enrolled. Conversely, the age group of 15 to 17 year olds has the lowest likelihood of being enrolled in a private school, with 397 (100.0% in the age bracket) attending a public institution.
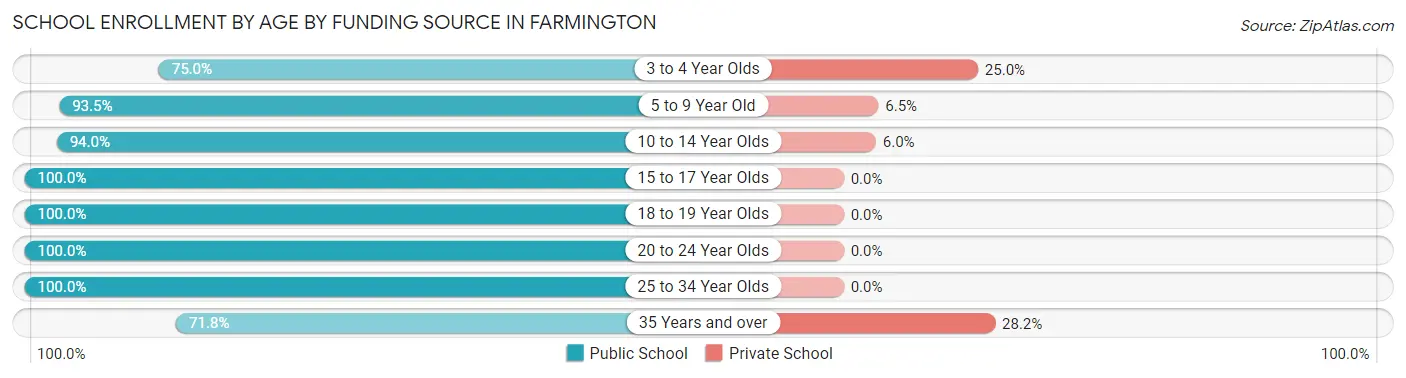
| Age Bracket | Public School | Private School |
| 3 to 4 Year Olds | 108 (75.0%) | 36 (25.0%) |
| 5 to 9 Year Old | 550 (93.5%) | 38 (6.5%) |
| 10 to 14 Year Olds | 926 (94.0%) | 59 (6.0%) |
| 15 to 17 Year Olds | 397 (100.0%) | 0 (0.0%) |
| 18 to 19 Year Olds | 221 (100.0%) | 0 (0.0%) |
| 20 to 24 Year Olds | 62 (100.0%) | 0 (0.0%) |
| 25 to 34 Year Olds | 78 (100.0%) | 0 (0.0%) |
| 35 Years and over | 28 (71.8%) | 11 (28.2%) |
| Total | 2,371 (94.3%) | 143 (5.7%) |
Educational Attainment by Field of Study in Farmington
Business (282 | 21.5%), science & technology (198 | 15.1%), education (183 | 13.9%), communications (134 | 10.2%), and social sciences (103 | 7.8%) are the most common fields of study among 1,314 individuals in Farmington who have obtained a bachelor's degree or higher.
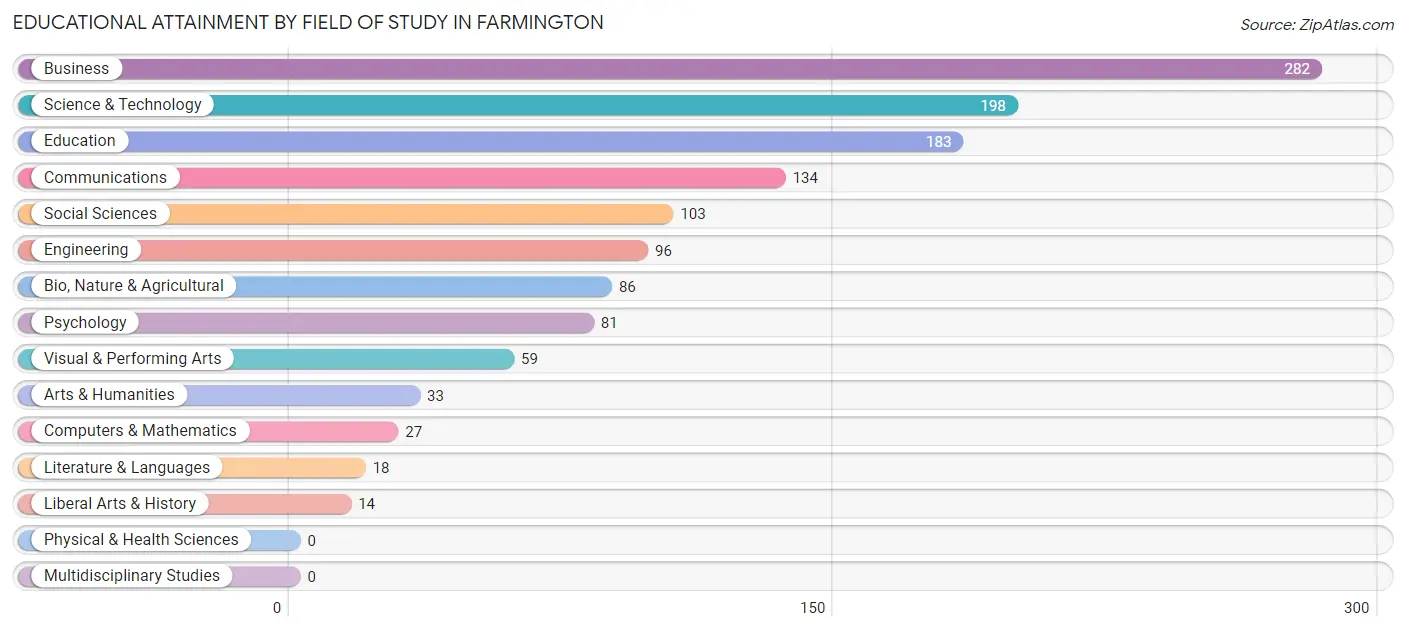
| Field of Study | # Graduates | % Graduates |
| Computers & Mathematics | 27 | 2.1% |
| Bio, Nature & Agricultural | 86 | 6.5% |
| Physical & Health Sciences | 0 | 0.0% |
| Psychology | 81 | 6.2% |
| Social Sciences | 103 | 7.8% |
| Engineering | 96 | 7.3% |
| Multidisciplinary Studies | 0 | 0.0% |
| Science & Technology | 198 | 15.1% |
| Business | 282 | 21.5% |
| Education | 183 | 13.9% |
| Literature & Languages | 18 | 1.4% |
| Liberal Arts & History | 14 | 1.1% |
| Visual & Performing Arts | 59 | 4.5% |
| Communications | 134 | 10.2% |
| Arts & Humanities | 33 | 2.5% |
| Total | 1,314 | 100.0% |
Transportation & Commute in Farmington
Vehicle Availability by Sex in Farmington
The most prevalent vehicle ownership categories in Farmington are males with 2 vehicles (730, accounting for 41.3%) and females with 2 vehicles (588, making up 48.5%).
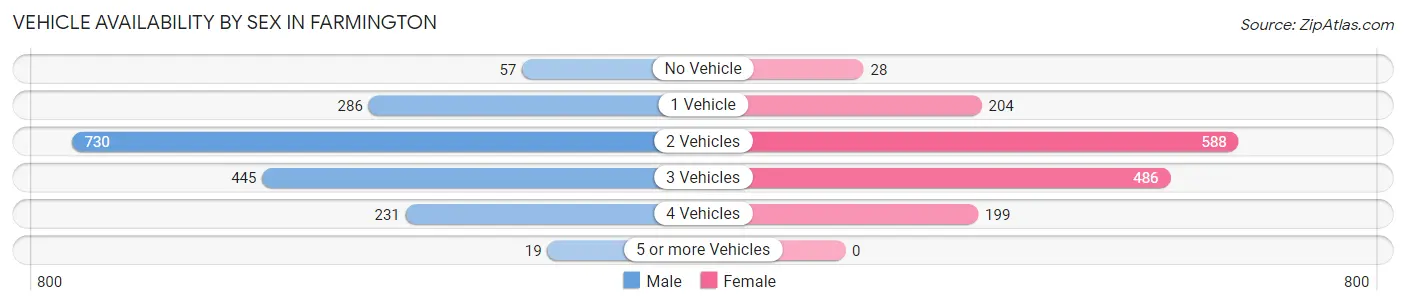
| Vehicles Available | Male | Female |
| No Vehicle | 57 (3.2%) | 28 (1.9%) |
| 1 Vehicle | 286 (16.2%) | 204 (13.6%) |
| 2 Vehicles | 730 (41.3%) | 588 (39.1%) |
| 3 Vehicles | 445 (25.2%) | 486 (32.3%) |
| 4 Vehicles | 231 (13.1%) | 199 (13.2%) |
| 5 or more Vehicles | 19 (1.1%) | 0 (0.0%) |
| Total | 1,768 (100.0%) | 1,505 (100.0%) |
Commute Time in Farmington
The most frequently occuring commute durations in Farmington are 10 to 14 minutes (508 commuters, 16.6%), 20 to 24 minutes (476 commuters, 15.5%), and 30 to 34 minutes (463 commuters, 15.1%).
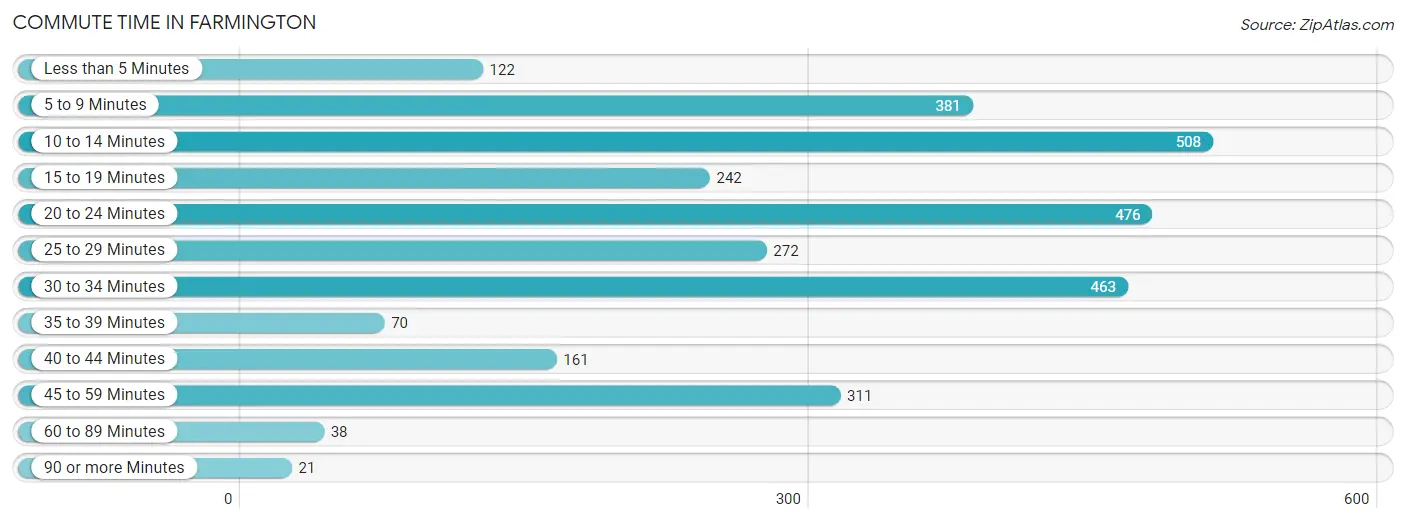
| Commute Time | # Commuters | % Commuters |
| Less than 5 Minutes | 122 | 4.0% |
| 5 to 9 Minutes | 381 | 12.4% |
| 10 to 14 Minutes | 508 | 16.6% |
| 15 to 19 Minutes | 242 | 7.9% |
| 20 to 24 Minutes | 476 | 15.5% |
| 25 to 29 Minutes | 272 | 8.9% |
| 30 to 34 Minutes | 463 | 15.1% |
| 35 to 39 Minutes | 70 | 2.3% |
| 40 to 44 Minutes | 161 | 5.2% |
| 45 to 59 Minutes | 311 | 10.2% |
| 60 to 89 Minutes | 38 | 1.2% |
| 90 or more Minutes | 21 | 0.7% |
Commute Time by Sex in Farmington
The most common commute times in Farmington are 30 to 34 minutes (316 commuters, 18.9%) for males and 5 to 9 minutes (311 commuters, 22.3%) for females.
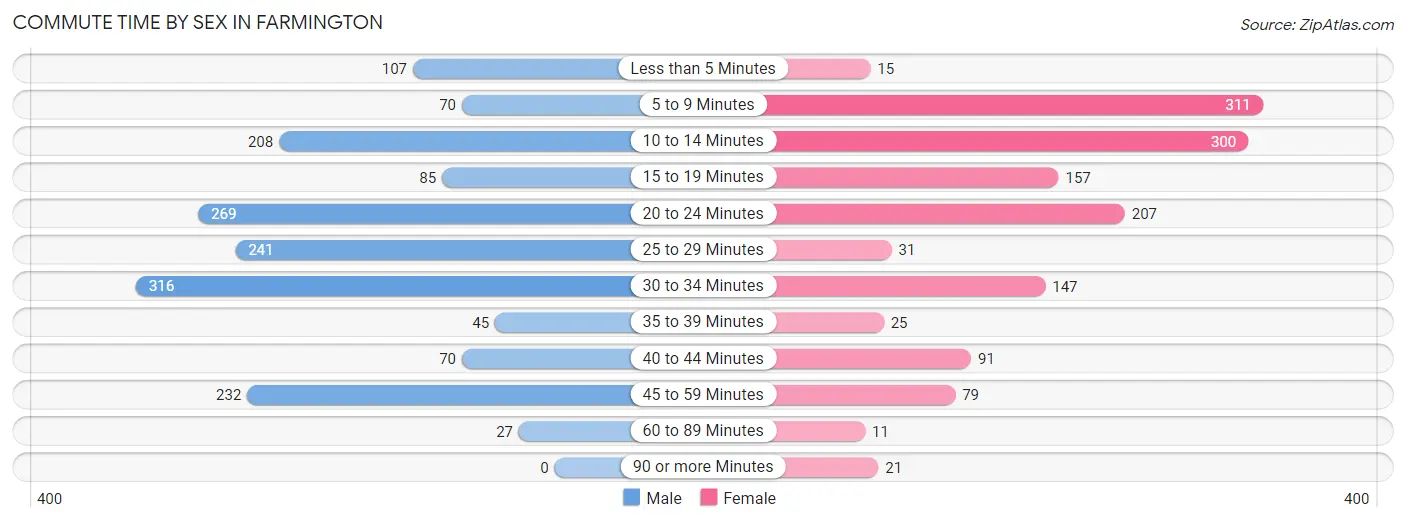
| Commute Time | Male | Female |
| Less than 5 Minutes | 107 (6.4%) | 15 (1.1%) |
| 5 to 9 Minutes | 70 (4.2%) | 311 (22.3%) |
| 10 to 14 Minutes | 208 (12.5%) | 300 (21.5%) |
| 15 to 19 Minutes | 85 (5.1%) | 157 (11.3%) |
| 20 to 24 Minutes | 269 (16.1%) | 207 (14.8%) |
| 25 to 29 Minutes | 241 (14.4%) | 31 (2.2%) |
| 30 to 34 Minutes | 316 (18.9%) | 147 (10.5%) |
| 35 to 39 Minutes | 45 (2.7%) | 25 (1.8%) |
| 40 to 44 Minutes | 70 (4.2%) | 91 (6.5%) |
| 45 to 59 Minutes | 232 (13.9%) | 79 (5.7%) |
| 60 to 89 Minutes | 27 (1.6%) | 11 (0.8%) |
| 90 or more Minutes | 0 (0.0%) | 21 (1.5%) |
Time of Departure to Work by Sex in Farmington
The most frequent times of departure to work in Farmington are 6:30 AM to 6:59 AM (275, 16.5%) for males and 7:00 AM to 7:29 AM (299, 21.4%) for females.
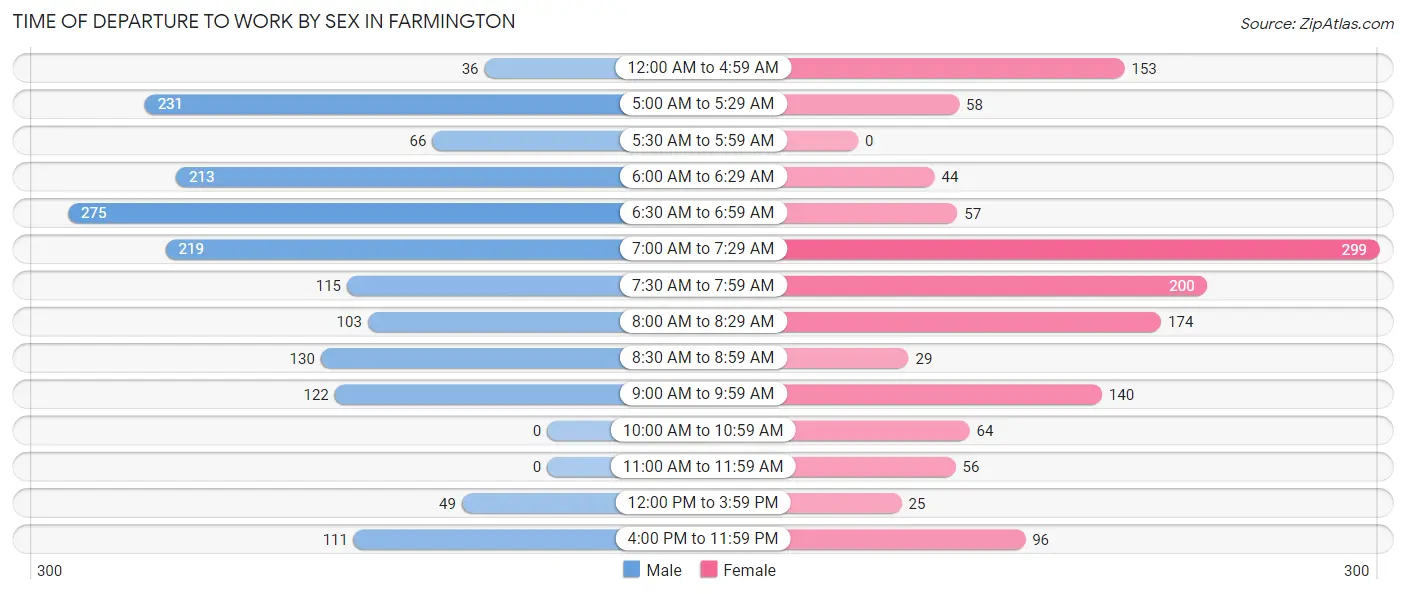
| Time of Departure | Male | Female |
| 12:00 AM to 4:59 AM | 36 (2.2%) | 153 (11.0%) |
| 5:00 AM to 5:29 AM | 231 (13.8%) | 58 (4.2%) |
| 5:30 AM to 5:59 AM | 66 (4.0%) | 0 (0.0%) |
| 6:00 AM to 6:29 AM | 213 (12.8%) | 44 (3.2%) |
| 6:30 AM to 6:59 AM | 275 (16.5%) | 57 (4.1%) |
| 7:00 AM to 7:29 AM | 219 (13.1%) | 299 (21.4%) |
| 7:30 AM to 7:59 AM | 115 (6.9%) | 200 (14.3%) |
| 8:00 AM to 8:29 AM | 103 (6.2%) | 174 (12.5%) |
| 8:30 AM to 8:59 AM | 130 (7.8%) | 29 (2.1%) |
| 9:00 AM to 9:59 AM | 122 (7.3%) | 140 (10.0%) |
| 10:00 AM to 10:59 AM | 0 (0.0%) | 64 (4.6%) |
| 11:00 AM to 11:59 AM | 0 (0.0%) | 56 (4.0%) |
| 12:00 PM to 3:59 PM | 49 (2.9%) | 25 (1.8%) |
| 4:00 PM to 11:59 PM | 111 (6.7%) | 96 (6.9%) |
| Total | 1,670 (100.0%) | 1,395 (100.0%) |
Housing Occupancy in Farmington
Occupancy by Ownership in Farmington
Of the total 2,716 dwellings in Farmington, owner-occupied units account for 2,059 (75.8%), while renter-occupied units make up 657 (24.2%).
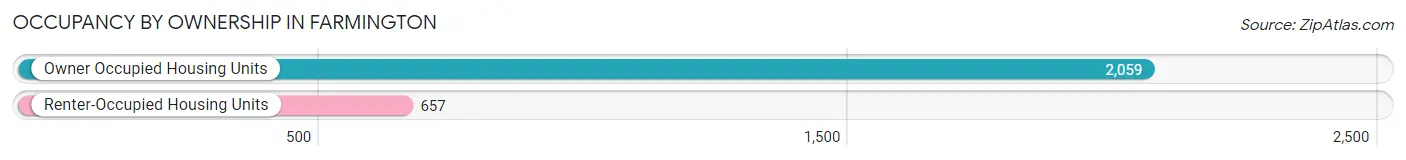
| Occupancy | # Housing Units | % Housing Units |
| Owner Occupied Housing Units | 2,059 | 75.8% |
| Renter-Occupied Housing Units | 657 | 24.2% |
| Total Occupied Housing Units | 2,716 | 100.0% |
Occupancy by Household Size in Farmington
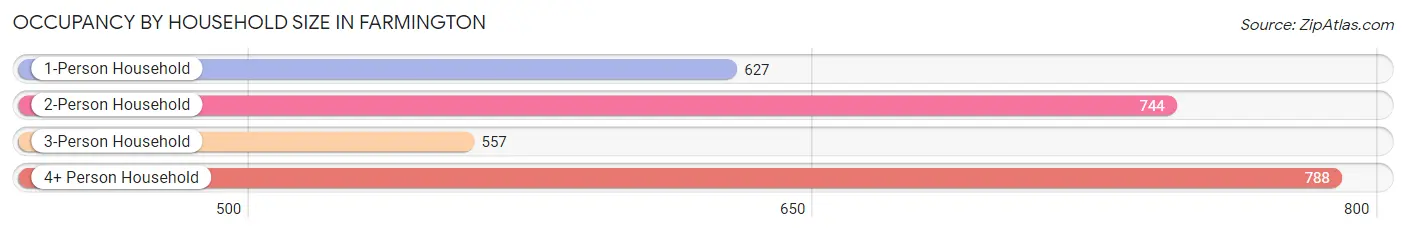
| Household Size | # Housing Units | % Housing Units |
| 1-Person Household | 627 | 23.1% |
| 2-Person Household | 744 | 27.4% |
| 3-Person Household | 557 | 20.5% |
| 4+ Person Household | 788 | 29.0% |
| Total Housing Units | 2,716 | 100.0% |
Occupancy by Ownership by Household Size in Farmington
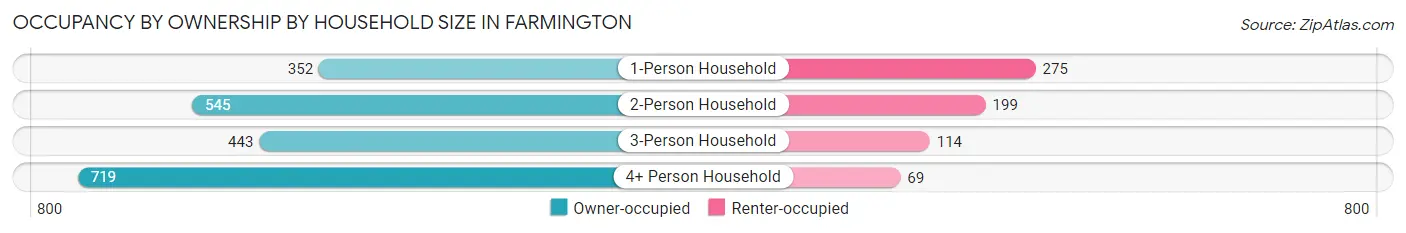
| Household Size | Owner-occupied | Renter-occupied |
| 1-Person Household | 352 (56.1%) | 275 (43.9%) |
| 2-Person Household | 545 (73.3%) | 199 (26.8%) |
| 3-Person Household | 443 (79.5%) | 114 (20.5%) |
| 4+ Person Household | 719 (91.2%) | 69 (8.8%) |
| Total Housing Units | 2,059 (75.8%) | 657 (24.2%) |
Occupancy by Educational Attainment in Farmington
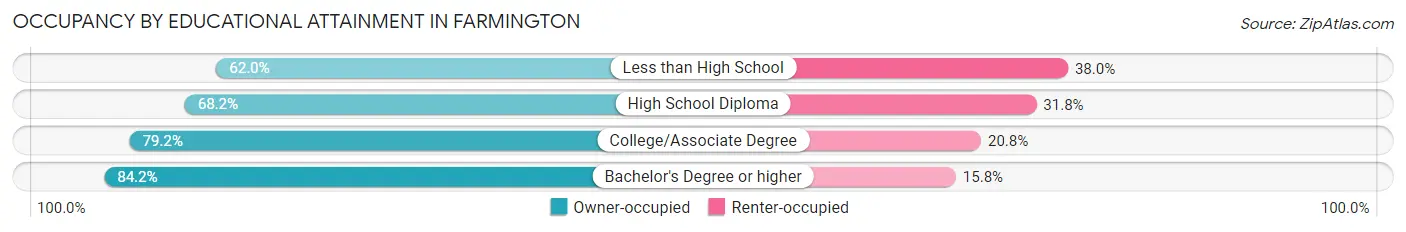
| Household Size | Owner-occupied | Renter-occupied |
| Less than High School | 88 (62.0%) | 54 (38.0%) |
| High School Diploma | 668 (68.2%) | 311 (31.8%) |
| College/Associate Degree | 632 (79.2%) | 166 (20.8%) |
| Bachelor's Degree or higher | 671 (84.2%) | 126 (15.8%) |
Occupancy by Age of Householder in Farmington
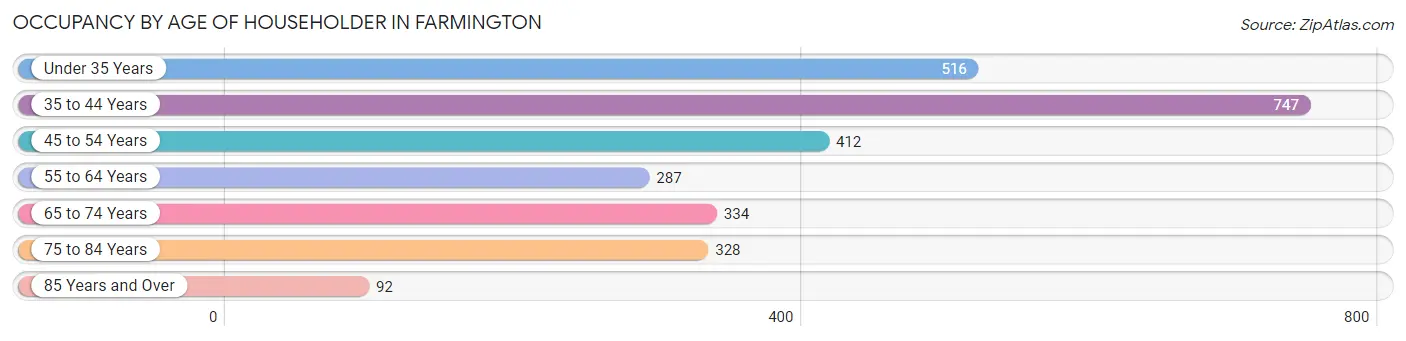
| Age Bracket | # Households | % Households |
| Under 35 Years | 516 | 19.0% |
| 35 to 44 Years | 747 | 27.5% |
| 45 to 54 Years | 412 | 15.2% |
| 55 to 64 Years | 287 | 10.6% |
| 65 to 74 Years | 334 | 12.3% |
| 75 to 84 Years | 328 | 12.1% |
| 85 Years and Over | 92 | 3.4% |
| Total | 2,716 | 100.0% |
Housing Finances in Farmington
Median Income by Occupancy in Farmington
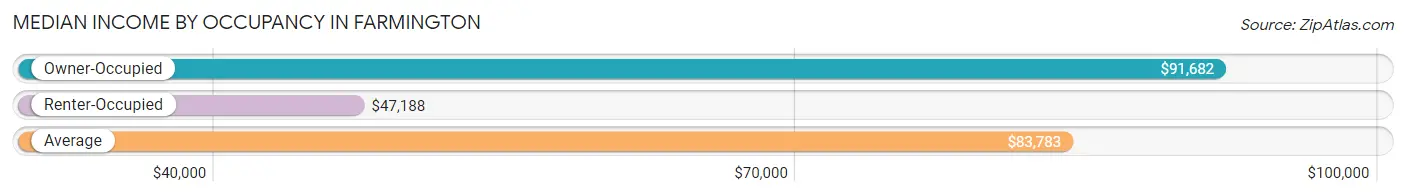
| Occupancy Type | # Households | Median Income |
| Owner-Occupied | 2,059 (75.8%) | $91,682 |
| Renter-Occupied | 657 (24.2%) | $47,188 |
| Average | 2,716 (100.0%) | $83,783 |
Occupancy by Householder Income Bracket in Farmington
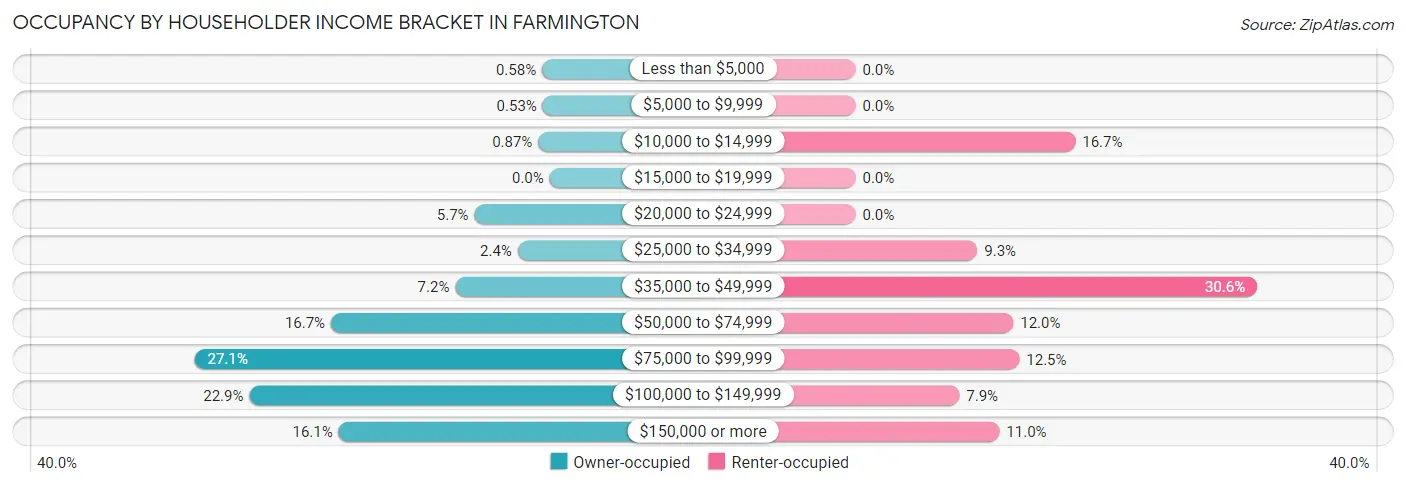
| Income Bracket | Owner-occupied | Renter-occupied |
| Less than $5,000 | 12 (0.6%) | 0 (0.0%) |
| $5,000 to $9,999 | 11 (0.5%) | 0 (0.0%) |
| $10,000 to $14,999 | 18 (0.9%) | 110 (16.7%) |
| $15,000 to $19,999 | 0 (0.0%) | 0 (0.0%) |
| $20,000 to $24,999 | 118 (5.7%) | 0 (0.0%) |
| $25,000 to $34,999 | 50 (2.4%) | 61 (9.3%) |
| $35,000 to $49,999 | 148 (7.2%) | 201 (30.6%) |
| $50,000 to $74,999 | 343 (16.7%) | 79 (12.0%) |
| $75,000 to $99,999 | 557 (27.1%) | 82 (12.5%) |
| $100,000 to $149,999 | 471 (22.9%) | 52 (7.9%) |
| $150,000 or more | 331 (16.1%) | 72 (11.0%) |
| Total | 2,059 (100.0%) | 657 (100.0%) |
Monthly Housing Cost Tiers in Farmington
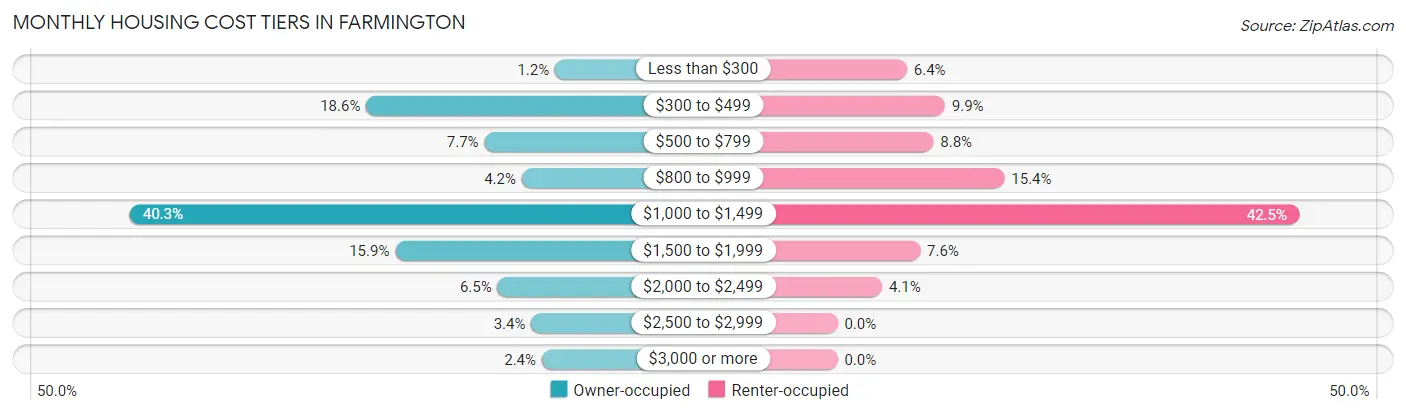
| Monthly Cost | Owner-occupied | Renter-occupied |
| Less than $300 | 24 (1.2%) | 42 (6.4%) |
| $300 to $499 | 382 (18.5%) | 65 (9.9%) |
| $500 to $799 | 158 (7.7%) | 58 (8.8%) |
| $800 to $999 | 87 (4.2%) | 101 (15.4%) |
| $1,000 to $1,499 | 830 (40.3%) | 279 (42.5%) |
| $1,500 to $1,999 | 327 (15.9%) | 50 (7.6%) |
| $2,000 to $2,499 | 133 (6.5%) | 27 (4.1%) |
| $2,500 to $2,999 | 69 (3.4%) | 0 (0.0%) |
| $3,000 or more | 49 (2.4%) | 0 (0.0%) |
| Total | 2,059 (100.0%) | 657 (100.0%) |
Physical Housing Characteristics in Farmington
Housing Structures in Farmington
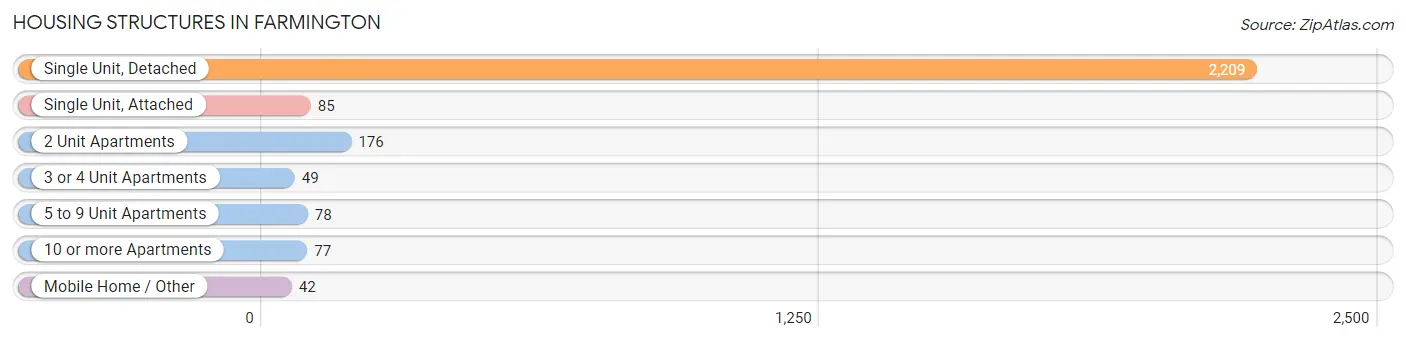
| Structure Type | # Housing Units | % Housing Units |
| Single Unit, Detached | 2,209 | 81.3% |
| Single Unit, Attached | 85 | 3.1% |
| 2 Unit Apartments | 176 | 6.5% |
| 3 or 4 Unit Apartments | 49 | 1.8% |
| 5 to 9 Unit Apartments | 78 | 2.9% |
| 10 or more Apartments | 77 | 2.8% |
| Mobile Home / Other | 42 | 1.5% |
| Total | 2,716 | 100.0% |
Housing Structures by Occupancy in Farmington
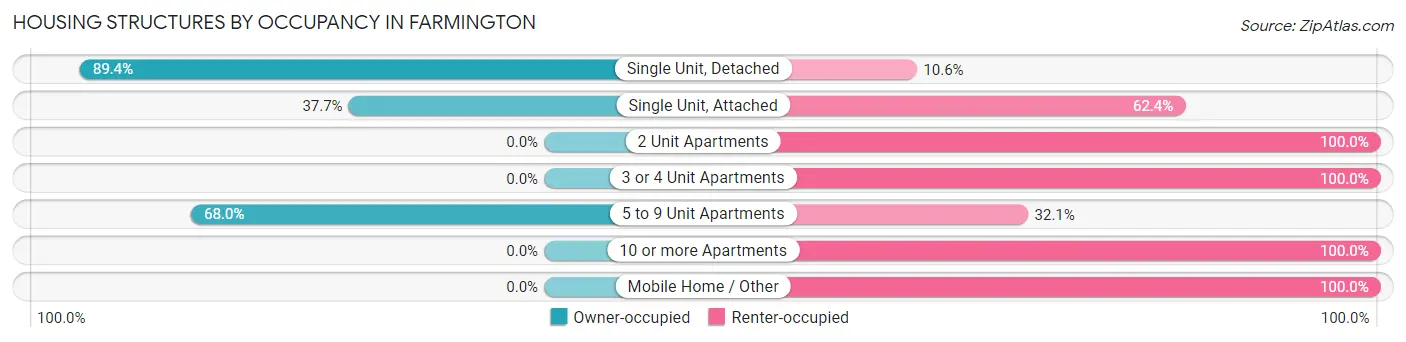
| Structure Type | Owner-occupied | Renter-occupied |
| Single Unit, Detached | 1,974 (89.4%) | 235 (10.6%) |
| Single Unit, Attached | 32 (37.7%) | 53 (62.4%) |
| 2 Unit Apartments | 0 (0.0%) | 176 (100.0%) |
| 3 or 4 Unit Apartments | 0 (0.0%) | 49 (100.0%) |
| 5 to 9 Unit Apartments | 53 (67.9%) | 25 (32.1%) |
| 10 or more Apartments | 0 (0.0%) | 77 (100.0%) |
| Mobile Home / Other | 0 (0.0%) | 42 (100.0%) |
| Total | 2,059 (75.8%) | 657 (24.2%) |
Housing Structures by Number of Rooms in Farmington
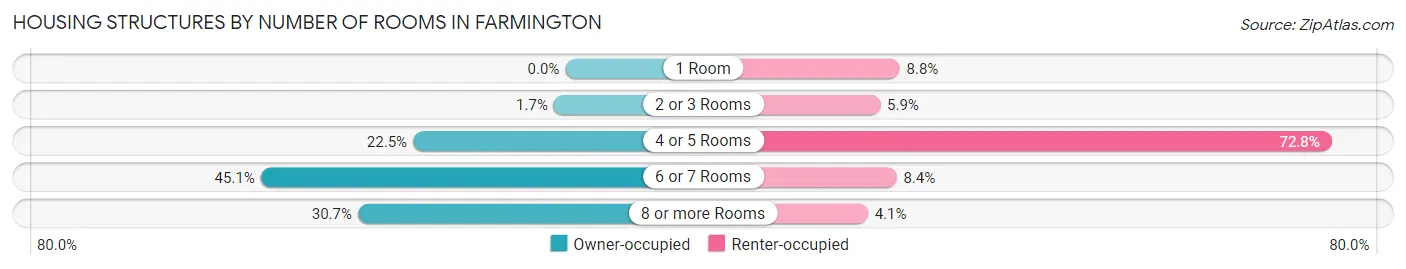
| Number of Rooms | Owner-occupied | Renter-occupied |
| 1 Room | 0 (0.0%) | 58 (8.8%) |
| 2 or 3 Rooms | 35 (1.7%) | 39 (5.9%) |
| 4 or 5 Rooms | 464 (22.5%) | 478 (72.8%) |
| 6 or 7 Rooms | 928 (45.1%) | 55 (8.4%) |
| 8 or more Rooms | 632 (30.7%) | 27 (4.1%) |
| Total | 2,059 (100.0%) | 657 (100.0%) |
Housing Structure by Heating Type in Farmington
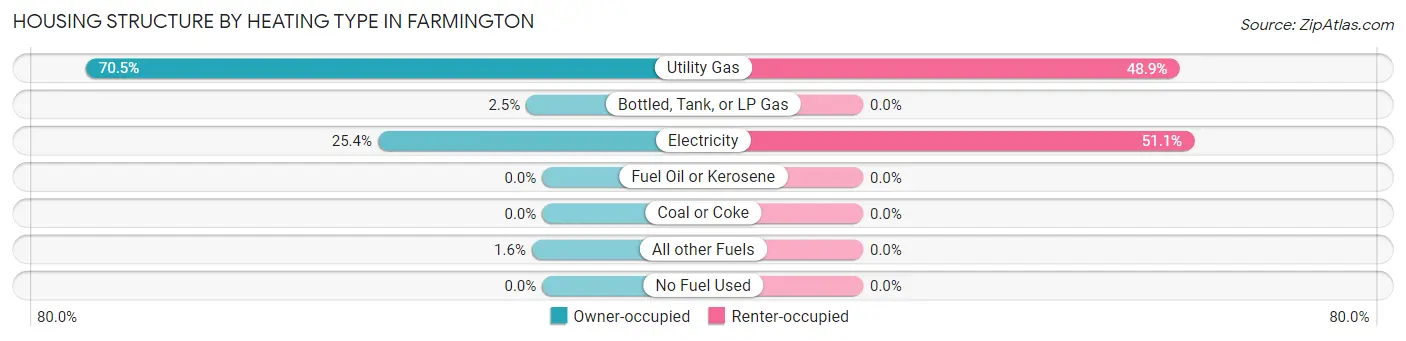
| Heating Type | Owner-occupied | Renter-occupied |
| Utility Gas | 1,452 (70.5%) | 321 (48.9%) |
| Bottled, Tank, or LP Gas | 51 (2.5%) | 0 (0.0%) |
| Electricity | 523 (25.4%) | 336 (51.1%) |
| Fuel Oil or Kerosene | 0 (0.0%) | 0 (0.0%) |
| Coal or Coke | 0 (0.0%) | 0 (0.0%) |
| All other Fuels | 33 (1.6%) | 0 (0.0%) |
| No Fuel Used | 0 (0.0%) | 0 (0.0%) |
| Total | 2,059 (100.0%) | 657 (100.0%) |
Household Vehicle Usage in Farmington
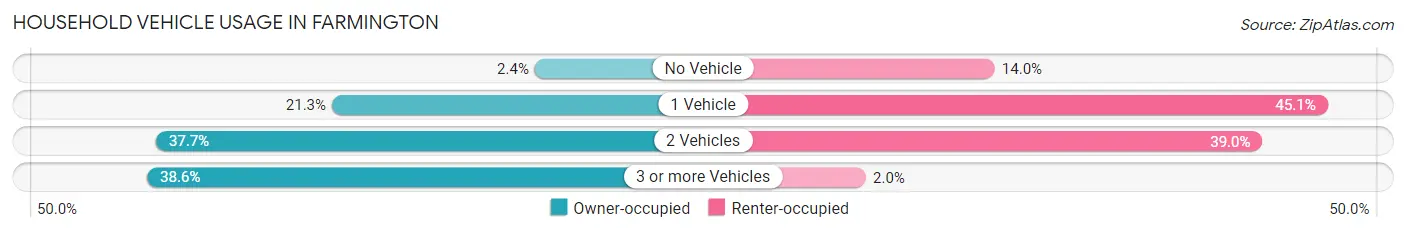
| Vehicles per Household | Owner-occupied | Renter-occupied |
| No Vehicle | 49 (2.4%) | 92 (14.0%) |
| 1 Vehicle | 439 (21.3%) | 296 (45.1%) |
| 2 Vehicles | 777 (37.7%) | 256 (39.0%) |
| 3 or more Vehicles | 794 (38.6%) | 13 (2.0%) |
| Total | 2,059 (100.0%) | 657 (100.0%) |
Real Estate & Mortgages in Farmington
Real Estate and Mortgage Overview in Farmington
| Characteristic | Without Mortgage | With Mortgage |
| Housing Units | 626 | 1,433 |
| Median Property Value | $201,400 | $223,900 |
| Median Household Income | $74,250 | $207 |
| Monthly Housing Costs | $470 | $49 |
| Real Estate Taxes | $1,207 | $78 |
Property Value by Mortgage Status in Farmington
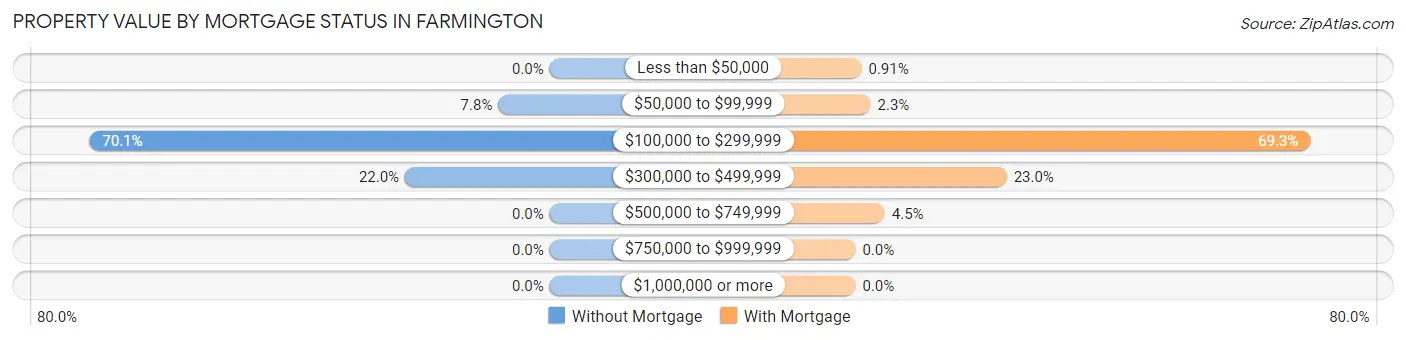
| Property Value | Without Mortgage | With Mortgage |
| Less than $50,000 | 0 (0.0%) | 13 (0.9%) |
| $50,000 to $99,999 | 49 (7.8%) | 33 (2.3%) |
| $100,000 to $299,999 | 439 (70.1%) | 993 (69.3%) |
| $300,000 to $499,999 | 138 (22.0%) | 330 (23.0%) |
| $500,000 to $749,999 | 0 (0.0%) | 64 (4.5%) |
| $750,000 to $999,999 | 0 (0.0%) | 0 (0.0%) |
| $1,000,000 or more | 0 (0.0%) | 0 (0.0%) |
| Total | 626 (100.0%) | 1,433 (100.0%) |
Household Income by Mortgage Status in Farmington
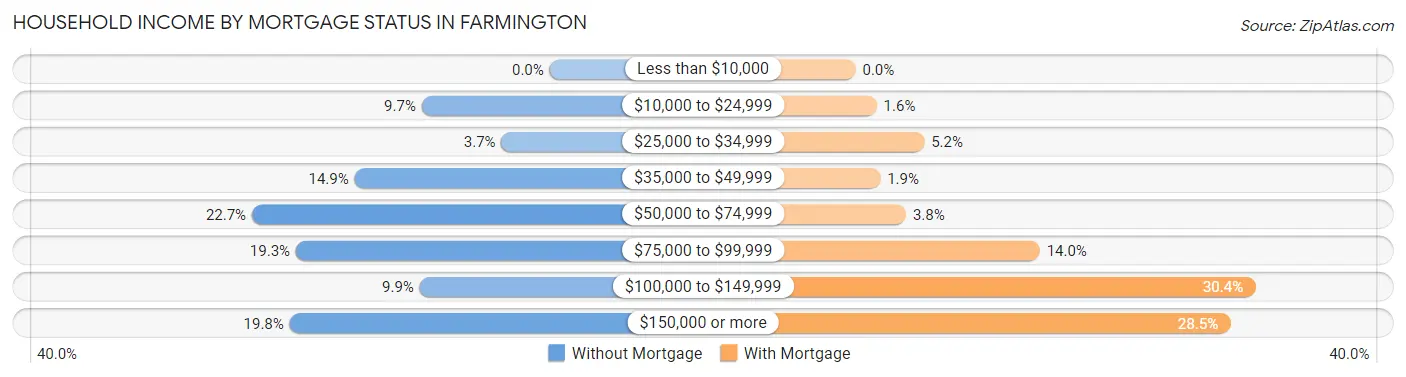
| Household Income | Without Mortgage | With Mortgage |
| Less than $10,000 | 0 (0.0%) | 0 (0.0%) |
| $10,000 to $24,999 | 61 (9.7%) | 23 (1.6%) |
| $25,000 to $34,999 | 23 (3.7%) | 75 (5.2%) |
| $35,000 to $49,999 | 93 (14.9%) | 27 (1.9%) |
| $50,000 to $74,999 | 142 (22.7%) | 55 (3.8%) |
| $75,000 to $99,999 | 121 (19.3%) | 201 (14.0%) |
| $100,000 to $149,999 | 62 (9.9%) | 436 (30.4%) |
| $150,000 or more | 124 (19.8%) | 409 (28.5%) |
| Total | 626 (100.0%) | 1,433 (100.0%) |
Property Value to Household Income Ratio in Farmington
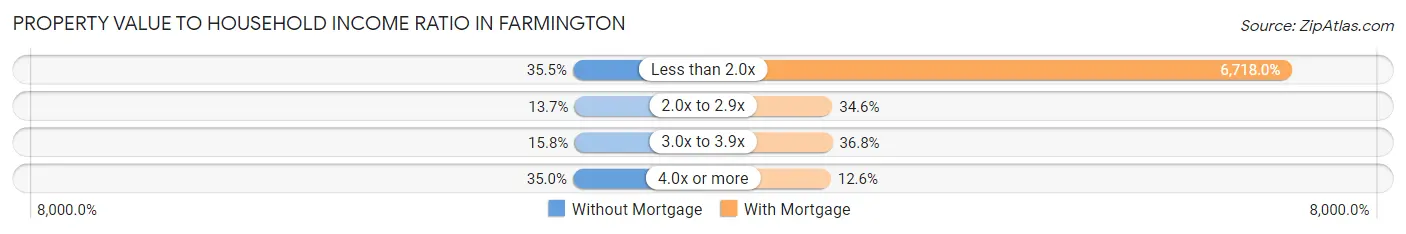
| Value-to-Income Ratio | Without Mortgage | With Mortgage |
| Less than 2.0x | 222 (35.5%) | 96,269 (6,718.0%) |
| 2.0x to 2.9x | 86 (13.7%) | 496 (34.6%) |
| 3.0x to 3.9x | 99 (15.8%) | 527 (36.8%) |
| 4.0x or more | 219 (35.0%) | 180 (12.6%) |
| Total | 626 (100.0%) | 1,433 (100.0%) |
Real Estate Taxes by Mortgage Status in Farmington
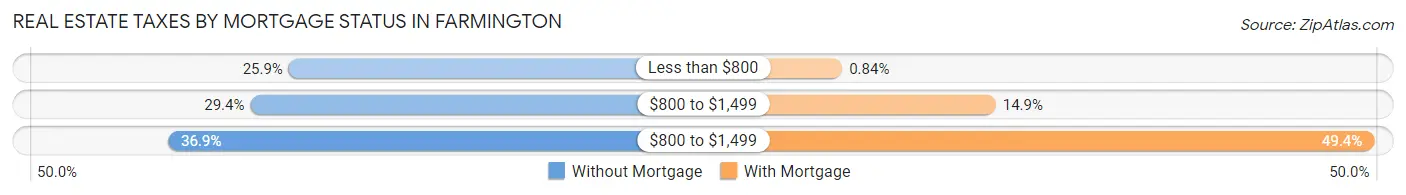
| Property Taxes | Without Mortgage | With Mortgage |
| Less than $800 | 162 (25.9%) | 12 (0.8%) |
| $800 to $1,499 | 184 (29.4%) | 213 (14.9%) |
| $800 to $1,499 | 231 (36.9%) | 708 (49.4%) |
| Total | 626 (100.0%) | 1,433 (100.0%) |
Health & Disability in Farmington
Health Insurance Coverage by Age in Farmington
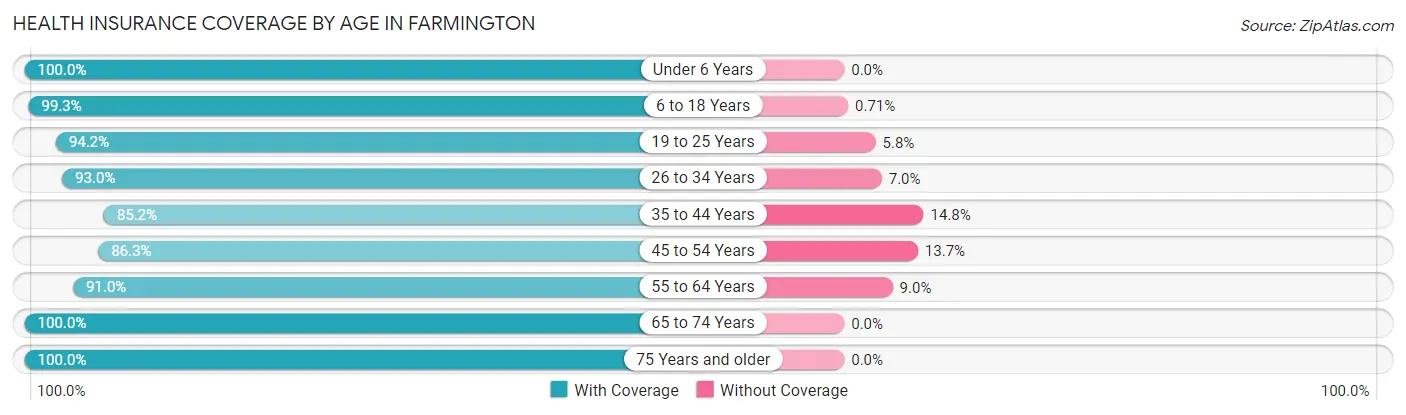
| Age Bracket | With Coverage | Without Coverage |
| Under 6 Years | 628 (100.0%) | 0 (0.0%) |
| 6 to 18 Years | 2,227 (99.3%) | 16 (0.7%) |
| 19 to 25 Years | 274 (94.2%) | 17 (5.8%) |
| 26 to 34 Years | 878 (93.0%) | 66 (7.0%) |
| 35 to 44 Years | 1,337 (85.2%) | 232 (14.8%) |
| 45 to 54 Years | 622 (86.3%) | 99 (13.7%) |
| 55 to 64 Years | 484 (91.0%) | 48 (9.0%) |
| 65 to 74 Years | 452 (100.0%) | 0 (0.0%) |
| 75 Years and older | 611 (100.0%) | 0 (0.0%) |
| Total | 7,513 (94.0%) | 478 (6.0%) |
Health Insurance Coverage by Citizenship Status in Farmington
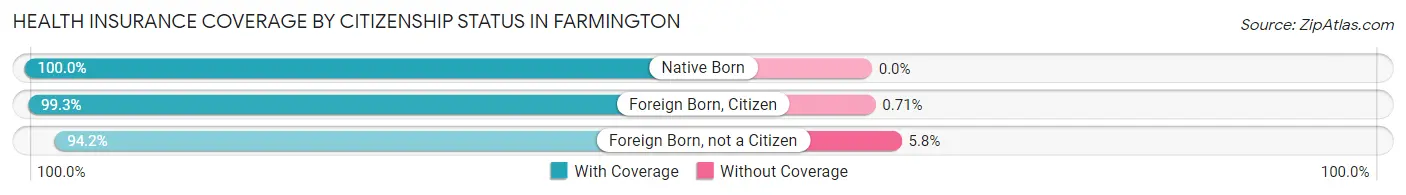
| Citizenship Status | With Coverage | Without Coverage |
| Native Born | 628 (100.0%) | 0 (0.0%) |
| Foreign Born, Citizen | 2,227 (99.3%) | 16 (0.7%) |
| Foreign Born, not a Citizen | 274 (94.2%) | 17 (5.8%) |
Health Insurance Coverage by Household Income in Farmington
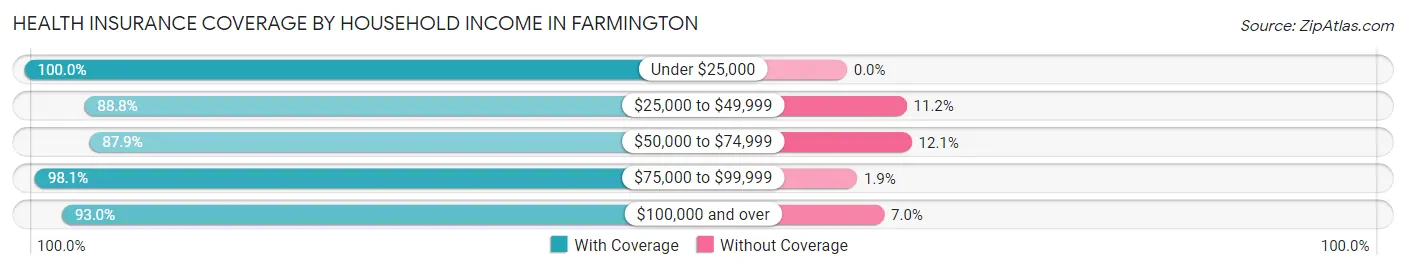
| Household Income | With Coverage | Without Coverage |
| Under $25,000 | 381 (100.0%) | 0 (0.0%) |
| $25,000 to $49,999 | 650 (88.8%) | 82 (11.2%) |
| $50,000 to $74,999 | 934 (87.9%) | 129 (12.1%) |
| $75,000 to $99,999 | 2,701 (98.1%) | 53 (1.9%) |
| $100,000 and over | 2,847 (93.0%) | 214 (7.0%) |
Public vs Private Health Insurance Coverage by Age in Farmington
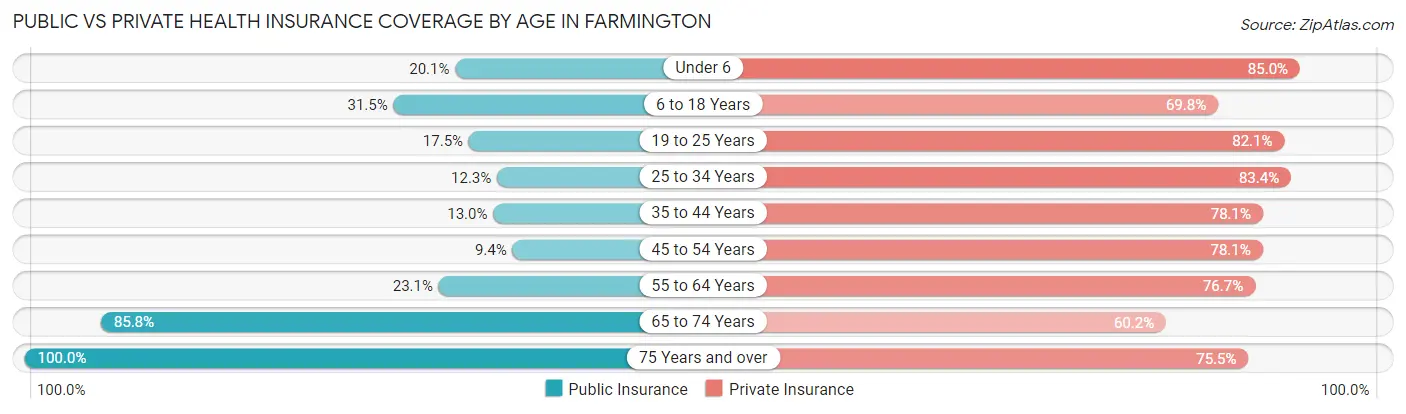
| Age Bracket | Public Insurance | Private Insurance |
| Under 6 | 126 (20.1%) | 534 (85.0%) |
| 6 to 18 Years | 707 (31.5%) | 1,566 (69.8%) |
| 19 to 25 Years | 51 (17.5%) | 239 (82.1%) |
| 25 to 34 Years | 116 (12.3%) | 787 (83.4%) |
| 35 to 44 Years | 204 (13.0%) | 1,226 (78.1%) |
| 45 to 54 Years | 68 (9.4%) | 563 (78.1%) |
| 55 to 64 Years | 123 (23.1%) | 408 (76.7%) |
| 65 to 74 Years | 388 (85.8%) | 272 (60.2%) |
| 75 Years and over | 611 (100.0%) | 461 (75.4%) |
| Total | 2,394 (30.0%) | 6,056 (75.8%) |
Disability Status by Sex by Age in Farmington
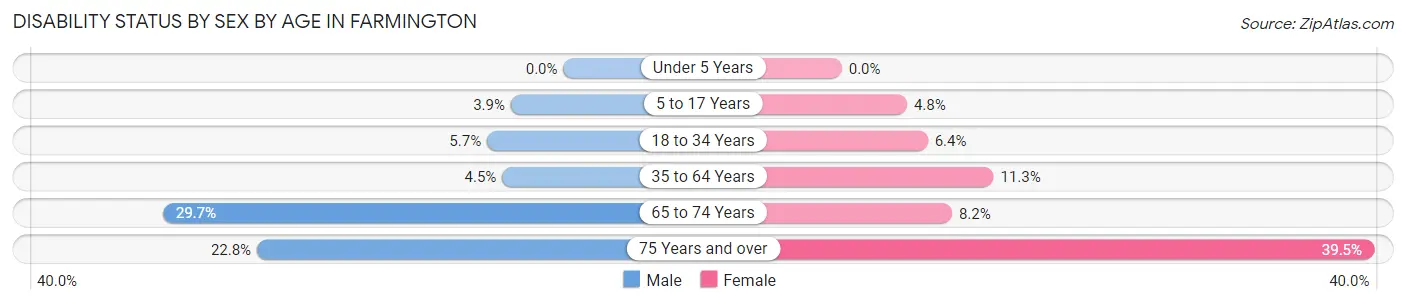
| Age Bracket | Male | Female |
| Under 5 Years | 0 (0.0%) | 0 (0.0%) |
| 5 to 17 Years | 45 (3.9%) | 42 (4.8%) |
| 18 to 34 Years | 39 (5.7%) | 49 (6.4%) |
| 35 to 64 Years | 60 (4.5%) | 169 (11.3%) |
| 65 to 74 Years | 69 (29.7%) | 18 (8.2%) |
| 75 Years and over | 48 (22.8%) | 158 (39.5%) |
Disability Class by Sex by Age in Farmington
Disability Class: Hearing Difficulty
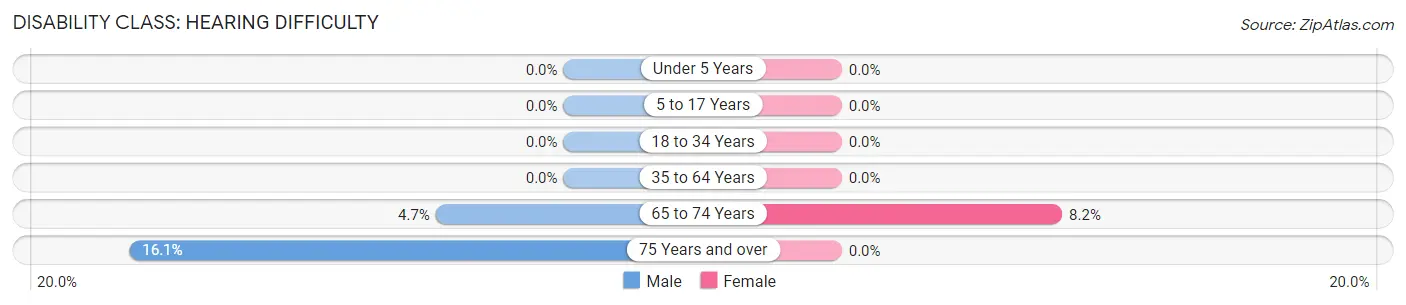
| Age Bracket | Male | Female |
| Under 5 Years | 0 (0.0%) | 0 (0.0%) |
| 5 to 17 Years | 0 (0.0%) | 0 (0.0%) |
| 18 to 34 Years | 0 (0.0%) | 0 (0.0%) |
| 35 to 64 Years | 0 (0.0%) | 0 (0.0%) |
| 65 to 74 Years | 11 (4.7%) | 18 (8.2%) |
| 75 Years and over | 34 (16.1%) | 0 (0.0%) |
Disability Class: Vision Difficulty
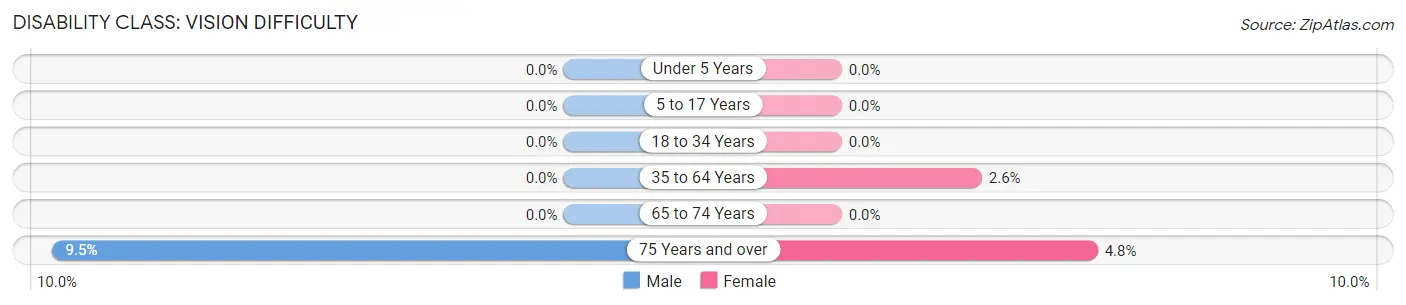
| Age Bracket | Male | Female |
| Under 5 Years | 0 (0.0%) | 0 (0.0%) |
| 5 to 17 Years | 0 (0.0%) | 0 (0.0%) |
| 18 to 34 Years | 0 (0.0%) | 0 (0.0%) |
| 35 to 64 Years | 0 (0.0%) | 39 (2.6%) |
| 65 to 74 Years | 0 (0.0%) | 0 (0.0%) |
| 75 Years and over | 20 (9.5%) | 19 (4.8%) |
Disability Class: Cognitive Difficulty
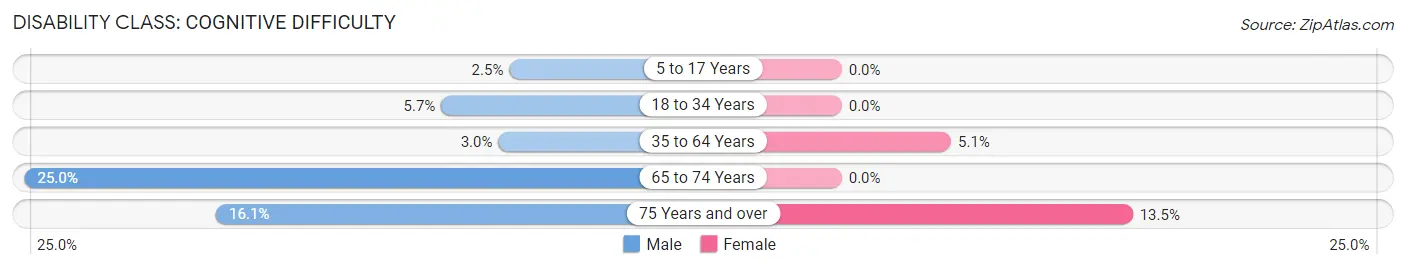
| Age Bracket | Male | Female |
| 5 to 17 Years | 29 (2.5%) | 0 (0.0%) |
| 18 to 34 Years | 39 (5.7%) | 0 (0.0%) |
| 35 to 64 Years | 40 (3.0%) | 76 (5.1%) |
| 65 to 74 Years | 58 (25.0%) | 0 (0.0%) |
| 75 Years and over | 34 (16.1%) | 54 (13.5%) |
Disability Class: Ambulatory Difficulty
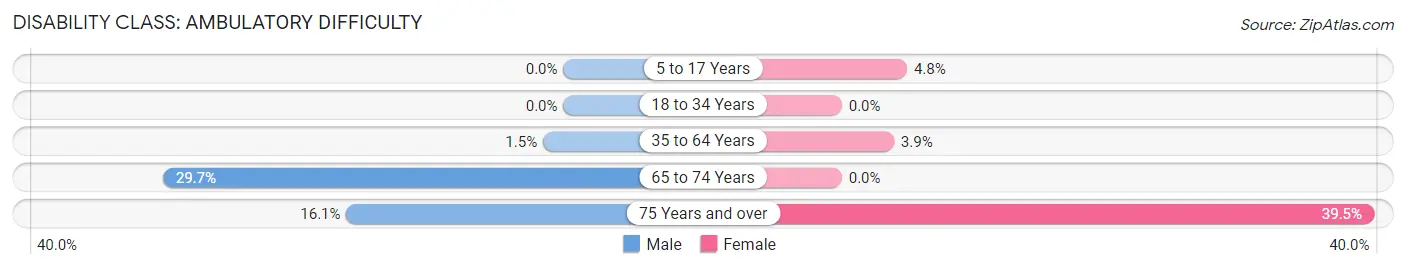
| Age Bracket | Male | Female |
| 5 to 17 Years | 0 (0.0%) | 42 (4.8%) |
| 18 to 34 Years | 0 (0.0%) | 0 (0.0%) |
| 35 to 64 Years | 20 (1.5%) | 58 (3.9%) |
| 65 to 74 Years | 69 (29.7%) | 0 (0.0%) |
| 75 Years and over | 34 (16.1%) | 158 (39.5%) |
Disability Class: Self-Care Difficulty
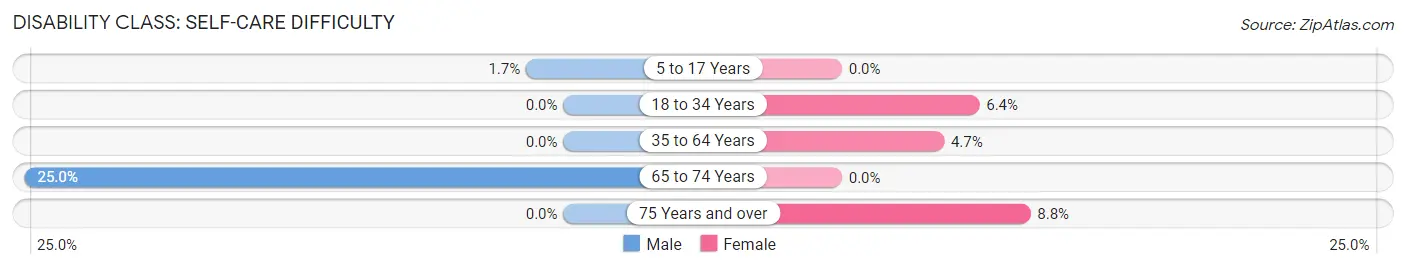
| Age Bracket | Male | Female |
| 5 to 17 Years | 20 (1.7%) | 0 (0.0%) |
| 18 to 34 Years | 0 (0.0%) | 49 (6.4%) |
| 35 to 64 Years | 0 (0.0%) | 71 (4.7%) |
| 65 to 74 Years | 58 (25.0%) | 0 (0.0%) |
| 75 Years and over | 0 (0.0%) | 35 (8.7%) |
Technology Access in Farmington
Computing Device Access in Farmington
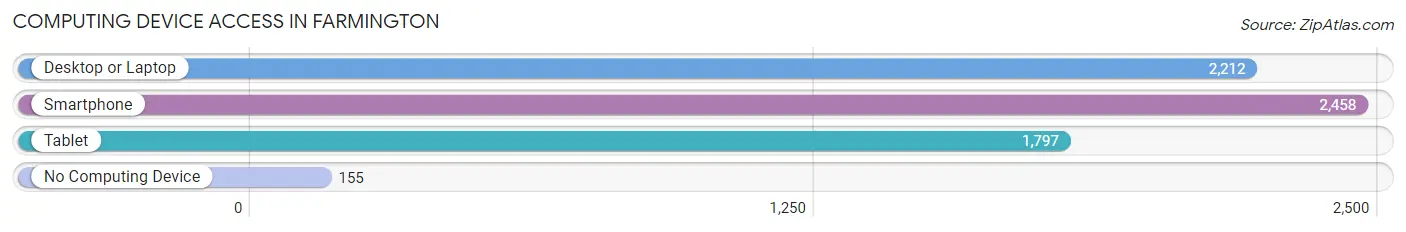
| Device Type | # Households | % Households |
| Desktop or Laptop | 2,212 | 81.4% |
| Smartphone | 2,458 | 90.5% |
| Tablet | 1,797 | 66.2% |
| No Computing Device | 155 | 5.7% |
| Total | 2,716 | 100.0% |
Internet Access in Farmington
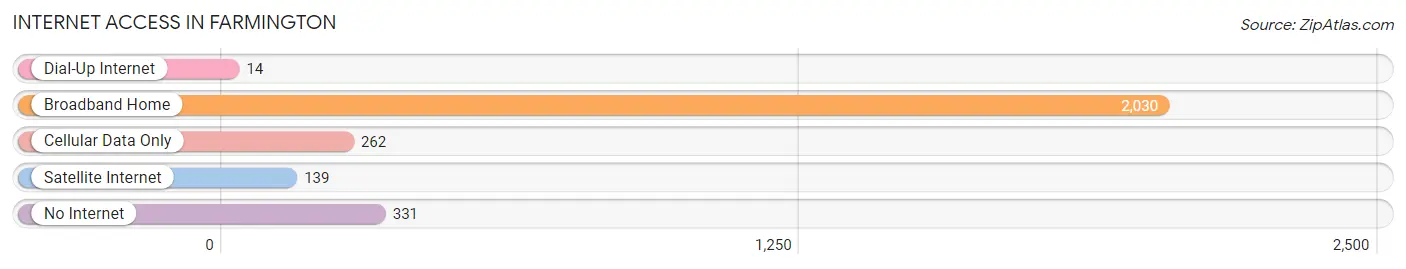
| Internet Type | # Households | % Households |
| Dial-Up Internet | 14 | 0.5% |
| Broadband Home | 2,030 | 74.7% |
| Cellular Data Only | 262 | 9.7% |
| Satellite Internet | 139 | 5.1% |
| No Internet | 331 | 12.2% |
| Total | 2,716 | 100.0% |
Farmington Summary
History
The city of Farmington, Arkansas is located in Washington County in the northwest corner of the state. It is situated in the foothills of the Ozark Mountains and is part of the Fayetteville-Springdale-Rogers Metropolitan Statistical Area. The city was founded in 1828 and was originally known as “Farmington Station” due to its location on the St. Louis and San Francisco Railroad. The city was officially incorporated in 1875 and has since grown to a population of over 5,000 people.
The city of Farmington has a rich history that dates back to the early 1800s. The area was first settled by Native Americans, including the Osage, Cherokee, and Quapaw tribes. The first white settlers arrived in the area in the early 1800s and began to establish farms and businesses. The city was officially founded in 1828 and was named after the nearby town of Farmington, Missouri.
The city of Farmington has played an important role in the history of the state of Arkansas. During the Civil War, the city was the site of a major battle between Union and Confederate forces. The Battle of Prairie Grove was fought on December 7, 1862 and resulted in a Confederate victory. The city was also the site of a major battle during the Civil War, the Battle of Fayetteville.
Geography
Farmington is located in the northwest corner of Arkansas in Washington County. It is situated in the foothills of the Ozark Mountains and is part of the Fayetteville-Springdale-Rogers Metropolitan Statistical Area. The city is located at the intersection of Interstate 540 and U.S. Route 62. The city is located approximately 30 miles north of Fayetteville and 40 miles south of Bentonville.
The city of Farmington has a total area of 4.3 square miles, all of which is land. The city is located at an elevation of 1,072 feet above sea level. The city is located in a humid subtropical climate zone and experiences hot, humid summers and mild winters. The average annual temperature is around 63 degrees Fahrenheit.
Economy
The economy of Farmington is largely based on agriculture and manufacturing. The city is home to several large agricultural operations, including poultry farms, cattle farms, and vegetable farms. The city is also home to several manufacturing companies, including a furniture factory, a plastics factory, and a metal fabrication plant.
The city of Farmington is also home to several retail stores, restaurants, and other businesses. The city is home to several banks, a hospital, and a post office. The city is also home to several churches and schools.
Demographics
As of the 2010 census, the city of Farmington had a population of 5,084 people. The racial makeup of the city was 94.3% White, 1.2% African American, 0.7% Native American, 0.4% Asian, 0.1% Pacific Islander, 1.3% from other races, and 2.0% from two or more races. Hispanic or Latino of any race were 3.3% of the population.
The median household income in Farmington was $41,944 and the median family income was $50,917. The per capita income for the city was $20,945. About 11.3% of families and 14.2% of the population were below the poverty line, including 19.2% of those under age 18 and 8.2% of those age 65 or over.
Common Questions
What is Per Capita Income in Farmington?
Per Capita income in Farmington is $31,547.
What is the Median Family Income in Farmington?
Median Family Income in Farmington is $95,504.
What is the Median Household income in Farmington?
Median Household Income in Farmington is $83,783.
What is Income or Wage Gap in Farmington?
Income or Wage Gap in Farmington is 45.0%.
Women in Farmington earn 55.0 cents for every dollar earned by a man.
What is Inequality or Gini Index in Farmington?
Inequality or Gini Index in Farmington is 0.35.
What is the Total Population of Farmington?
Total Population of Farmington is 7,991.
What is the Total Male Population of Farmington?
Total Male Population of Farmington is 3,882.
What is the Total Female Population of Farmington?
Total Female Population of Farmington is 4,109.
What is the Ratio of Males per 100 Females in Farmington?
There are 94.48 Males per 100 Females in Farmington.
What is the Ratio of Females per 100 Males in Farmington?
There are 105.85 Females per 100 Males in Farmington.
What is the Median Population Age in Farmington?
Median Population Age in Farmington is 34.4 Years.
What is the Average Family Size in Farmington
Average Family Size in Farmington is 3.6 People.
What is the Average Household Size in Farmington
Average Household Size in Farmington is 2.9 People.
How Large is the Labor Force in Farmington?
There are 3,327 People in the Labor Forcein in Farmington.
What is the Percentage of People in the Labor Force in Farmington?
59.8% of People are in the Labor Force in Farmington.
What is the Unemployment Rate in Farmington?
Unemployment Rate in Farmington is 0.4%.