Marshall, AR Map & Demographics
Marshall Map
Marshall Overview
$17,299
PER CAPITA INCOME
$49,250
AVG FAMILY INCOME
$28,290
AVG HOUSEHOLD INCOME
10.4%
WAGE / INCOME GAP [ % ]
89.6¢/ $1
WAGE / INCOME GAP [ $ ]
$8,240
FAMILY INCOME DEFICIT
0.44
INEQUALITY / GINI INDEX
1,384
TOTAL POPULATION
644
MALE POPULATION
740
FEMALE POPULATION
87.03
MALES / 100 FEMALES
114.91
FEMALES / 100 MALES
52.3
MEDIAN AGE
3.5
AVG FAMILY SIZE
2.4
AVG HOUSEHOLD SIZE
426
LABOR FORCE [ PEOPLE ]
36.4%
PERCENT IN LABOR FORCE
3.3%
UNEMPLOYMENT RATE
Marshall Zip Codes
Marshall Area Codes
Income in Marshall
Income Overview in Marshall
Per Capita Income in Marshall is $17,299, while median incomes of families and households are $49,250 and $28,290 respectively.
| Characteristic | Number | Measure |
| Per Capita Income | 1,384 | $17,299 |
| Median Family Income | 262 | $49,250 |
| Mean Family Income | 262 | $53,327 |
| Median Household Income | 553 | $28,290 |
| Mean Household Income | 553 | $37,314 |
| Income Deficit | 262 | $8,240 |
| Wage / Income Gap (%) | 1,384 | 10.43% |
| Wage / Income Gap ($) | 1,384 | 89.57¢ per $1 |
| Gini / Inequality Index | 1,384 | 0.44 |
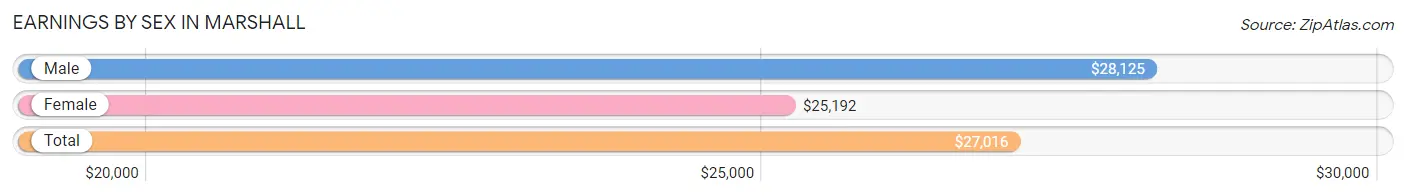
Earnings by Sex in Marshall
Average Earnings in Marshall are $27,016, $28,125 for men and $25,192 for women, a difference of 10.4%.
| Sex | Number | Average Earnings |
| Male | 226 (51.4%) | $28,125 |
| Female | 214 (48.6%) | $25,192 |
| Total | 440 (100.0%) | $27,016 |
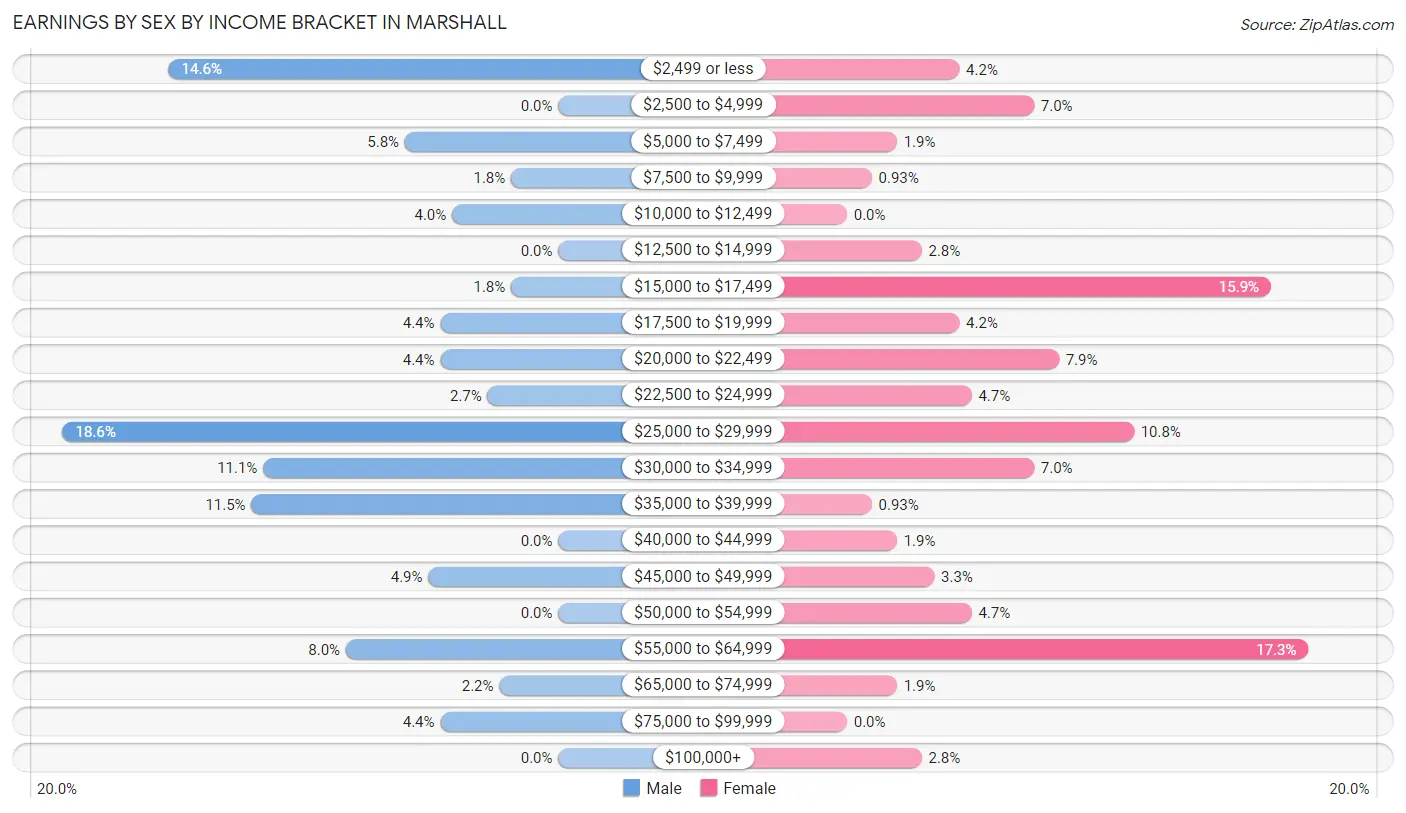
Earnings by Sex by Income Bracket in Marshall
The most common earnings brackets in Marshall are $25,000 to $29,999 for men (42 | 18.6%) and $55,000 to $64,999 for women (37 | 17.3%).
| Income | Male | Female |
| $2,499 or less | 33 (14.6%) | 9 (4.2%) |
| $2,500 to $4,999 | 0 (0.0%) | 15 (7.0%) |
| $5,000 to $7,499 | 13 (5.8%) | 4 (1.9%) |
| $7,500 to $9,999 | 4 (1.8%) | 2 (0.9%) |
| $10,000 to $12,499 | 9 (4.0%) | 0 (0.0%) |
| $12,500 to $14,999 | 0 (0.0%) | 6 (2.8%) |
| $15,000 to $17,499 | 4 (1.8%) | 34 (15.9%) |
| $17,500 to $19,999 | 10 (4.4%) | 9 (4.2%) |
| $20,000 to $22,499 | 10 (4.4%) | 17 (7.9%) |
| $22,500 to $24,999 | 6 (2.6%) | 10 (4.7%) |
| $25,000 to $29,999 | 42 (18.6%) | 23 (10.7%) |
| $30,000 to $34,999 | 25 (11.1%) | 15 (7.0%) |
| $35,000 to $39,999 | 26 (11.5%) | 2 (0.9%) |
| $40,000 to $44,999 | 0 (0.0%) | 4 (1.9%) |
| $45,000 to $49,999 | 11 (4.9%) | 7 (3.3%) |
| $50,000 to $54,999 | 0 (0.0%) | 10 (4.7%) |
| $55,000 to $64,999 | 18 (8.0%) | 37 (17.3%) |
| $65,000 to $74,999 | 5 (2.2%) | 4 (1.9%) |
| $75,000 to $99,999 | 10 (4.4%) | 0 (0.0%) |
| $100,000+ | 0 (0.0%) | 6 (2.8%) |
| Total | 226 (100.0%) | 214 (100.0%) |
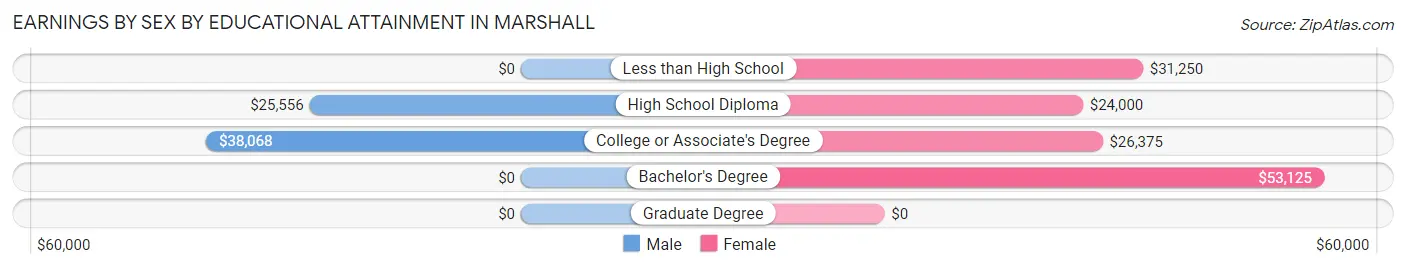
Earnings by Sex by Educational Attainment in Marshall
Average earnings in Marshall are $29,063 for men and $28,375 for women, a difference of 2.4%. Men with an educational attainment of college or associate's degree enjoy the highest average annual earnings of $38,068, while those with high school diploma education earn the least with $25,556. Women with an educational attainment of bachelor's degree earn the most with the average annual earnings of $53,125, while those with high school diploma education have the smallest earnings of $24,000.
| Educational Attainment | Male Income | Female Income |
| Less than High School | - | - |
| High School Diploma | $25,556 | $24,000 |
| College or Associate's Degree | $38,068 | $26,375 |
| Bachelor's Degree | - | - |
| Graduate Degree | - | - |
| Total | $29,063 | $28,375 |
Family Income in Marshall
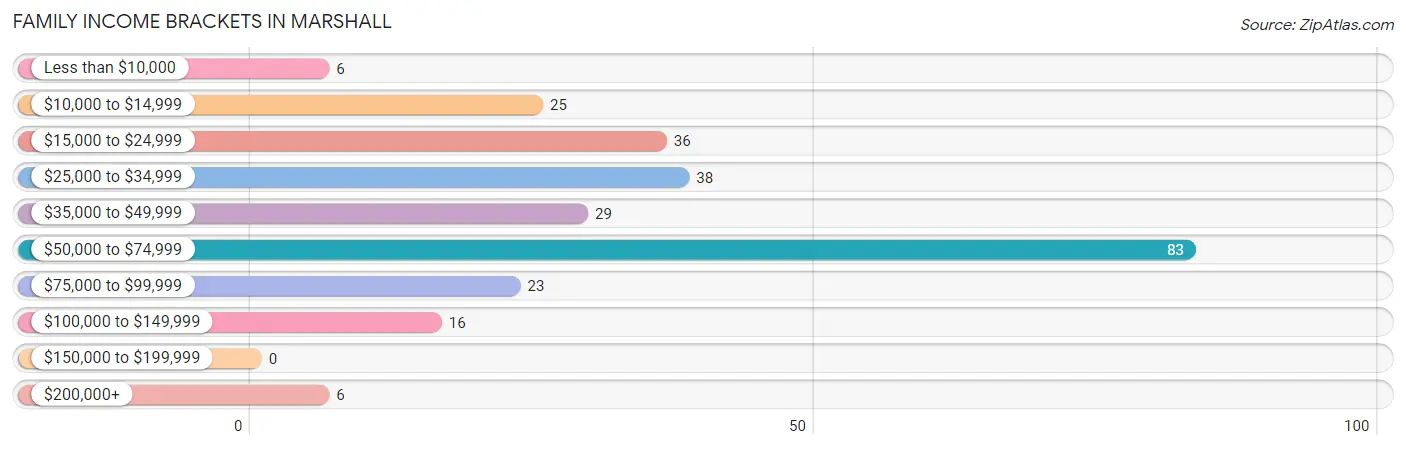
Family Income Brackets in Marshall
According to the Marshall family income data, there are 83 families falling into the $50,000 to $74,999 income range, which is the most common income bracket and makes up 31.7% of all families.
| Income Bracket | # Families | % Families |
| Less than $10,000 | 6 | 2.3% |
| $10,000 to $14,999 | 25 | 9.5% |
| $15,000 to $24,999 | 36 | 13.7% |
| $25,000 to $34,999 | 38 | 14.5% |
| $35,000 to $49,999 | 29 | 11.1% |
| $50,000 to $74,999 | 83 | 31.7% |
| $75,000 to $99,999 | 23 | 8.8% |
| $100,000 to $149,999 | 16 | 6.1% |
| $150,000 to $199,999 | 0 | 0.0% |
| $200,000+ | 6 | 2.3% |
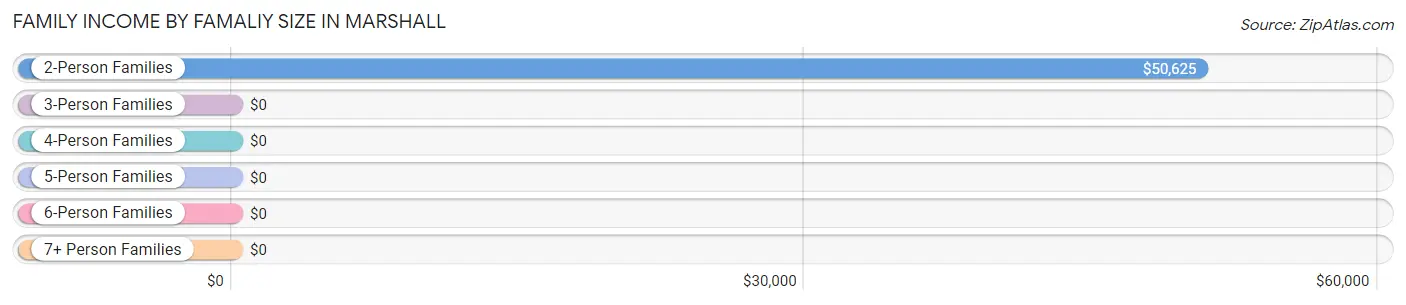
Family Income by Famaliy Size in Marshall
2-person families (145 | 55.3%) account for the highest median family income in Marshall with $50,625 per family, while 2-person families (145 | 55.3%) have the highest median income of $25,312 per family member.
| Income Bracket | # Families | Median Income |
| 2-Person Families | 145 (55.3%) | $50,625 |
| 3-Person Families | 87 (33.2%) | $0 |
| 4-Person Families | 25 (9.5%) | $0 |
| 5-Person Families | 5 (1.9%) | $0 |
| 6-Person Families | 0 (0.0%) | $0 |
| 7+ Person Families | 0 (0.0%) | $0 |
| Total | 262 (100.0%) | $49,250 |
Family Income by Number of Earners in Marshall
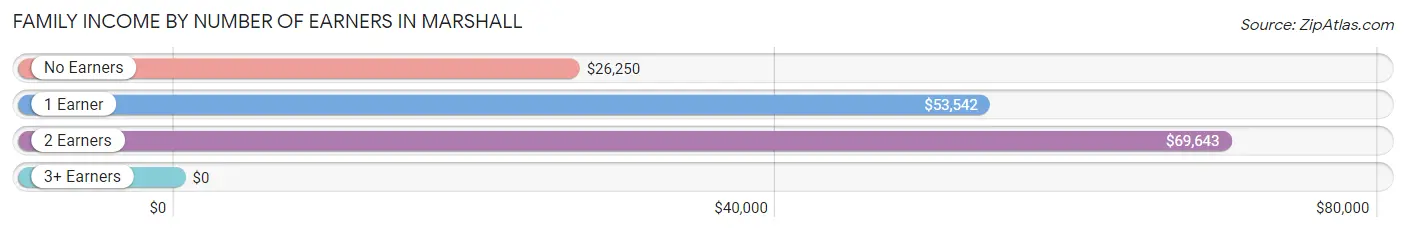
| Number of Earners | # Families | Median Income |
| No Earners | 57 (21.8%) | $26,250 |
| 1 Earner | 116 (44.3%) | $53,542 |
| 2 Earners | 78 (29.8%) | $69,643 |
| 3+ Earners | 11 (4.2%) | $0 |
| Total | 262 (100.0%) | $49,250 |
Household Income in Marshall
Household Income Brackets in Marshall
With 102 households falling in the category, the $10,000 to $14,999 income range is the most frequent in Marshall, accounting for 18.4% of all households.
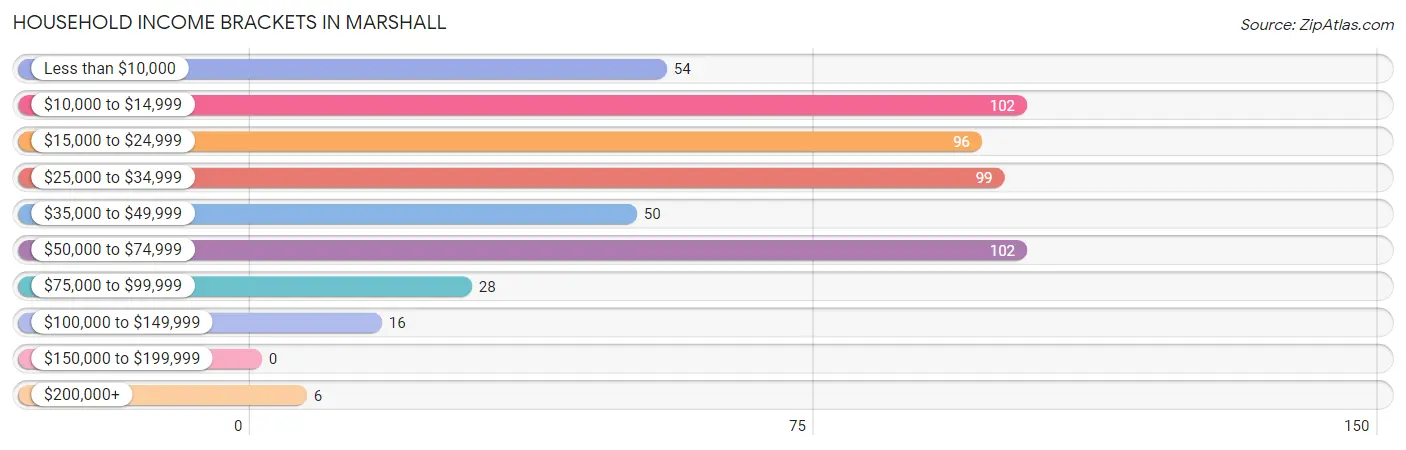
| Income Bracket | # Households | % Households |
| Less than $10,000 | 54 | 9.8% |
| $10,000 to $14,999 | 102 | 18.4% |
| $15,000 to $24,999 | 96 | 17.4% |
| $25,000 to $34,999 | 99 | 17.9% |
| $35,000 to $49,999 | 50 | 9.0% |
| $50,000 to $74,999 | 102 | 18.4% |
| $75,000 to $99,999 | 28 | 5.1% |
| $100,000 to $149,999 | 16 | 2.9% |
| $150,000 to $199,999 | 0 | 0.0% |
| $200,000+ | 6 | 1.1% |
Household Income by Householder Age in Marshall
The median household income in Marshall is $28,290, with the highest median household income of $43,688 found in the 25 to 44 years age bracket for the primary householder. A total of 145 households (26.2%) fall into this category. Meanwhile, the 15 to 24 years age bracket for the primary householder has the lowest median household income of $0, with 23 households (4.2%) in this group.
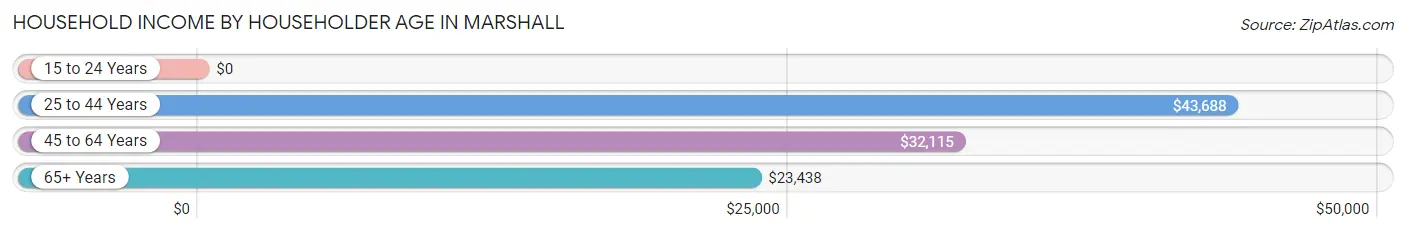
| Income Bracket | # Households | Median Income |
| 15 to 24 Years | 23 (4.2%) | $0 |
| 25 to 44 Years | 145 (26.2%) | $43,688 |
| 45 to 64 Years | 106 (19.2%) | $32,115 |
| 65+ Years | 279 (50.4%) | $23,438 |
| Total | 553 (100.0%) | $28,290 |
Poverty in Marshall
Income Below Poverty by Sex and Age in Marshall
With 18.2% poverty level for males and 43.0% for females among the residents of Marshall, 35 to 44 year old males and 5 year old females are the most vulnerable to poverty, with 44 males (51.2%) and 2 females (100.0%) in their respective age groups living below the poverty level.
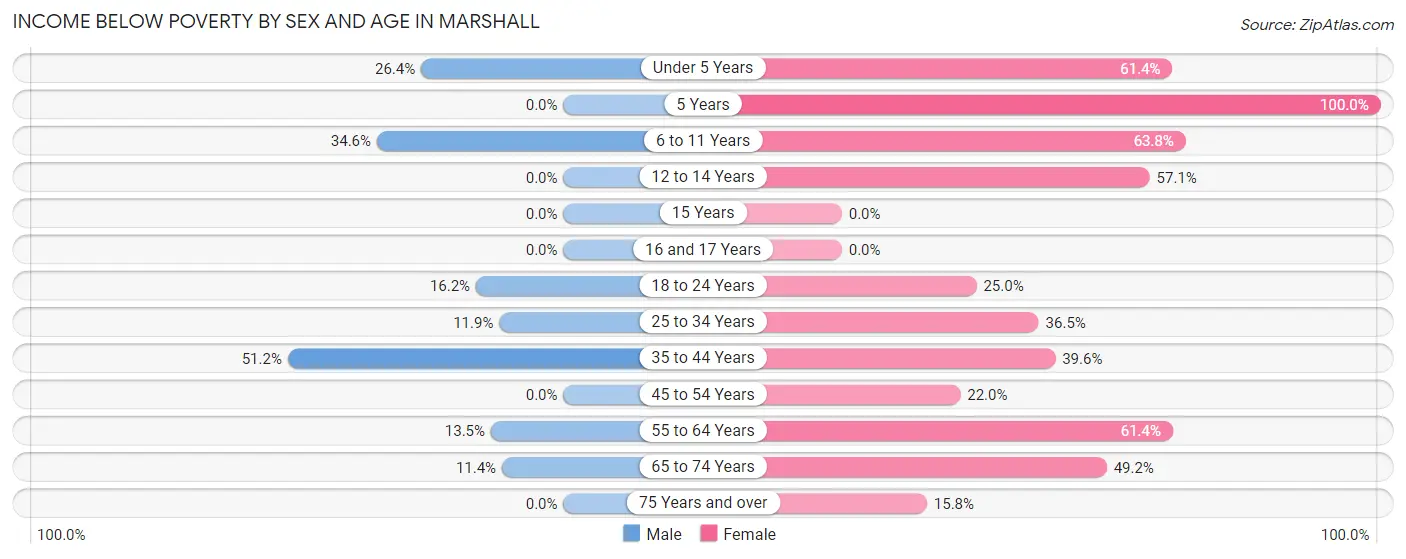
| Age Bracket | Male | Female |
| Under 5 Years | 14 (26.4%) | 27 (61.4%) |
| 5 Years | 0 (0.0%) | 2 (100.0%) |
| 6 to 11 Years | 9 (34.6%) | 30 (63.8%) |
| 12 to 14 Years | 0 (0.0%) | 4 (57.1%) |
| 15 Years | 0 (0.0%) | 0 (0.0%) |
| 16 and 17 Years | 0 (0.0%) | 0 (0.0%) |
| 18 to 24 Years | 6 (16.2%) | 12 (25.0%) |
| 25 to 34 Years | 5 (11.9%) | 38 (36.5%) |
| 35 to 44 Years | 44 (51.2%) | 21 (39.6%) |
| 45 to 54 Years | 0 (0.0%) | 11 (22.0%) |
| 55 to 64 Years | 7 (13.5%) | 86 (61.4%) |
| 65 to 74 Years | 22 (11.4%) | 59 (49.2%) |
| 75 Years and over | 0 (0.0%) | 15 (15.8%) |
| Total | 107 (18.2%) | 305 (43.0%) |
Income Above Poverty by Sex and Age in Marshall
According to the poverty statistics in Marshall, males aged 12 to 14 years and females aged 75 years and over are the age groups that are most secure financially, with 100.0% of males and 84.2% of females in these age groups living above the poverty line.
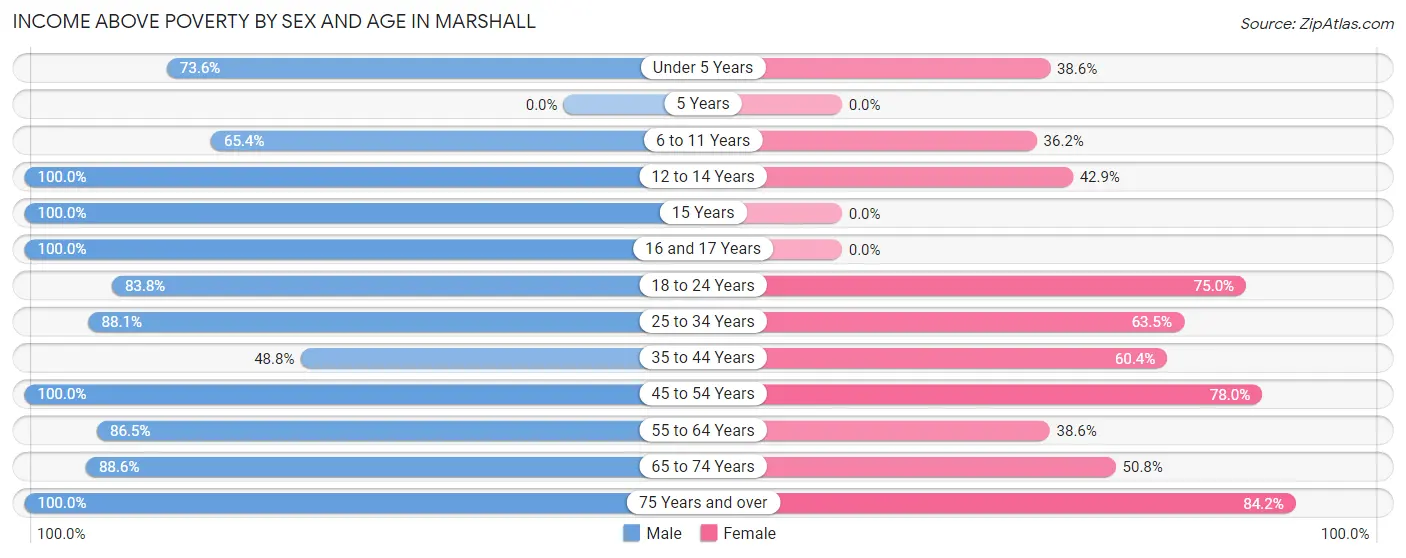
| Age Bracket | Male | Female |
| Under 5 Years | 39 (73.6%) | 17 (38.6%) |
| 5 Years | 0 (0.0%) | 0 (0.0%) |
| 6 to 11 Years | 17 (65.4%) | 17 (36.2%) |
| 12 to 14 Years | 10 (100.0%) | 3 (42.9%) |
| 15 Years | 24 (100.0%) | 0 (0.0%) |
| 16 and 17 Years | 21 (100.0%) | 0 (0.0%) |
| 18 to 24 Years | 31 (83.8%) | 36 (75.0%) |
| 25 to 34 Years | 37 (88.1%) | 66 (63.5%) |
| 35 to 44 Years | 42 (48.8%) | 32 (60.4%) |
| 45 to 54 Years | 34 (100.0%) | 39 (78.0%) |
| 55 to 64 Years | 45 (86.5%) | 54 (38.6%) |
| 65 to 74 Years | 171 (88.6%) | 61 (50.8%) |
| 75 Years and over | 10 (100.0%) | 80 (84.2%) |
| Total | 481 (81.8%) | 405 (57.0%) |
Income Below Poverty Among Married-Couple Families in Marshall
The poverty statistics for married-couple families in Marshall show that 12.6% or 23 of the total 182 families live below the poverty line. Families with 3 or 4 children have the highest poverty rate of 100.0%, comprising of 2 families. On the other hand, families with 1 or 2 children have the lowest poverty rate of 4.3%, which includes 2 families.
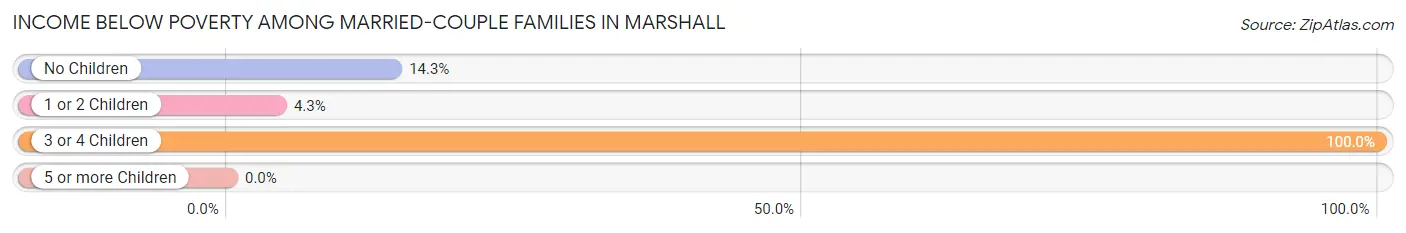
| Children | Above Poverty | Below Poverty |
| No Children | 114 (85.7%) | 19 (14.3%) |
| 1 or 2 Children | 45 (95.7%) | 2 (4.3%) |
| 3 or 4 Children | 0 (0.0%) | 2 (100.0%) |
| 5 or more Children | 0 (0.0%) | 0 (0.0%) |
| Total | 159 (87.4%) | 23 (12.6%) |
Income Below Poverty Among Single-Parent Households in Marshall
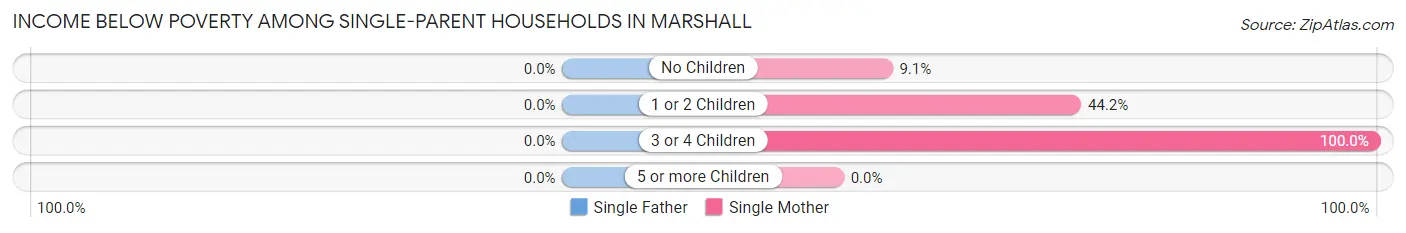
| Children | Single Father | Single Mother |
| No Children | 0 (0.0%) | 2 (9.1%) |
| 1 or 2 Children | 0 (0.0%) | 23 (44.2%) |
| 3 or 4 Children | 0 (0.0%) | 4 (100.0%) |
| 5 or more Children | 0 (0.0%) | 0 (0.0%) |
| Total | 0 (0.0%) | 29 (37.2%) |
Income Below Poverty Among Married-Couple vs Single-Parent Households in Marshall
The poverty data for Marshall shows that 23 of the married-couple family households (12.6%) and 29 of the single-parent households (36.2%) are living below the poverty level. Within the married-couple family households, those with 3 or 4 children have the highest poverty rate, with 2 households (100.0%) falling below the poverty line. Among the single-parent households, those with 3 or 4 children have the highest poverty rate, with 4 household (100.0%) living below poverty.
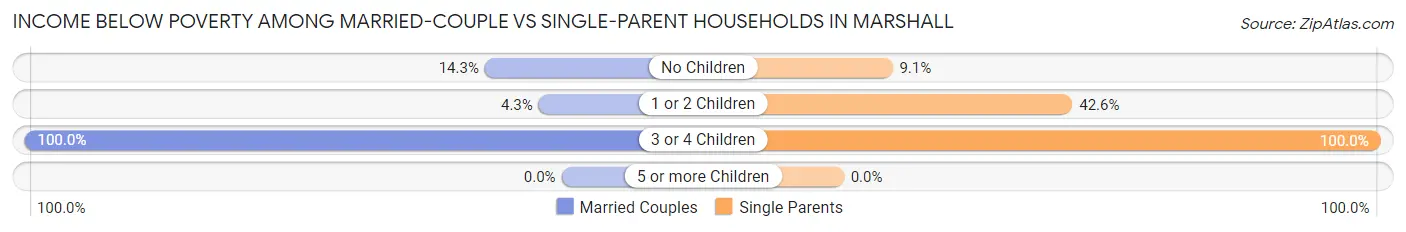
| Children | Married-Couple Families | Single-Parent Households |
| No Children | 19 (14.3%) | 2 (9.1%) |
| 1 or 2 Children | 2 (4.3%) | 23 (42.6%) |
| 3 or 4 Children | 2 (100.0%) | 4 (100.0%) |
| 5 or more Children | 0 (0.0%) | 0 (0.0%) |
| Total | 23 (12.6%) | 29 (36.2%) |
Race in Marshall
The most populous races in Marshall are White / Caucasian (1,200 | 86.7%), Two or more Races (157 | 11.3%), and Hispanic or Latino (39 | 2.8%).
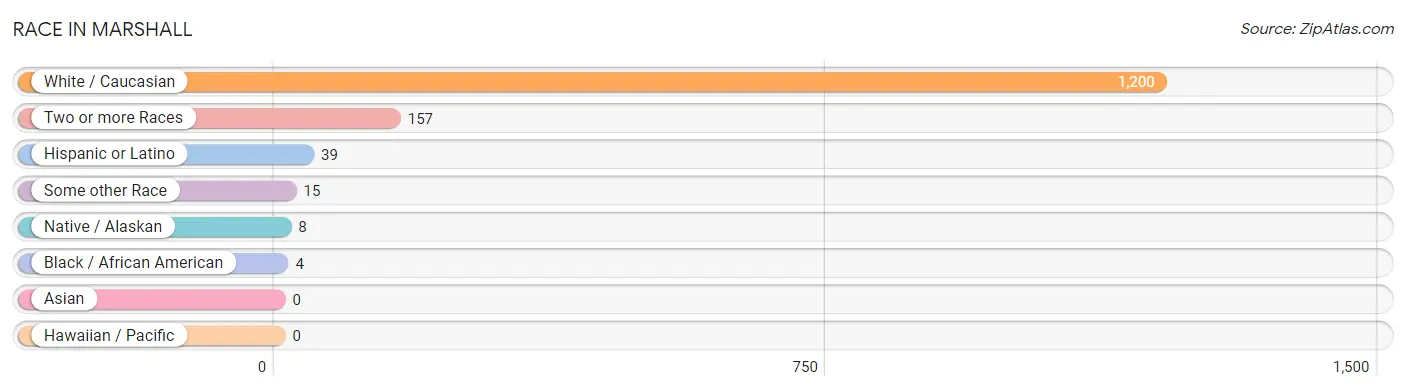
| Race | # Population | % Population |
| Asian | 0 | 0.0% |
| Black / African American | 4 | 0.3% |
| Hawaiian / Pacific | 0 | 0.0% |
| Hispanic or Latino | 39 | 2.8% |
| Native / Alaskan | 8 | 0.6% |
| White / Caucasian | 1,200 | 86.7% |
| Two or more Races | 157 | 11.3% |
| Some other Race | 15 | 1.1% |
| Total | 1,384 | 100.0% |
Ancestry in Marshall
The most populous ancestries reported in Marshall are English (173 | 12.5%), Irish (151 | 10.9%), German (78 | 5.6%), American (73 | 5.3%), and Mexican (39 | 2.8%), together accounting for 37.1% of all Marshall residents.
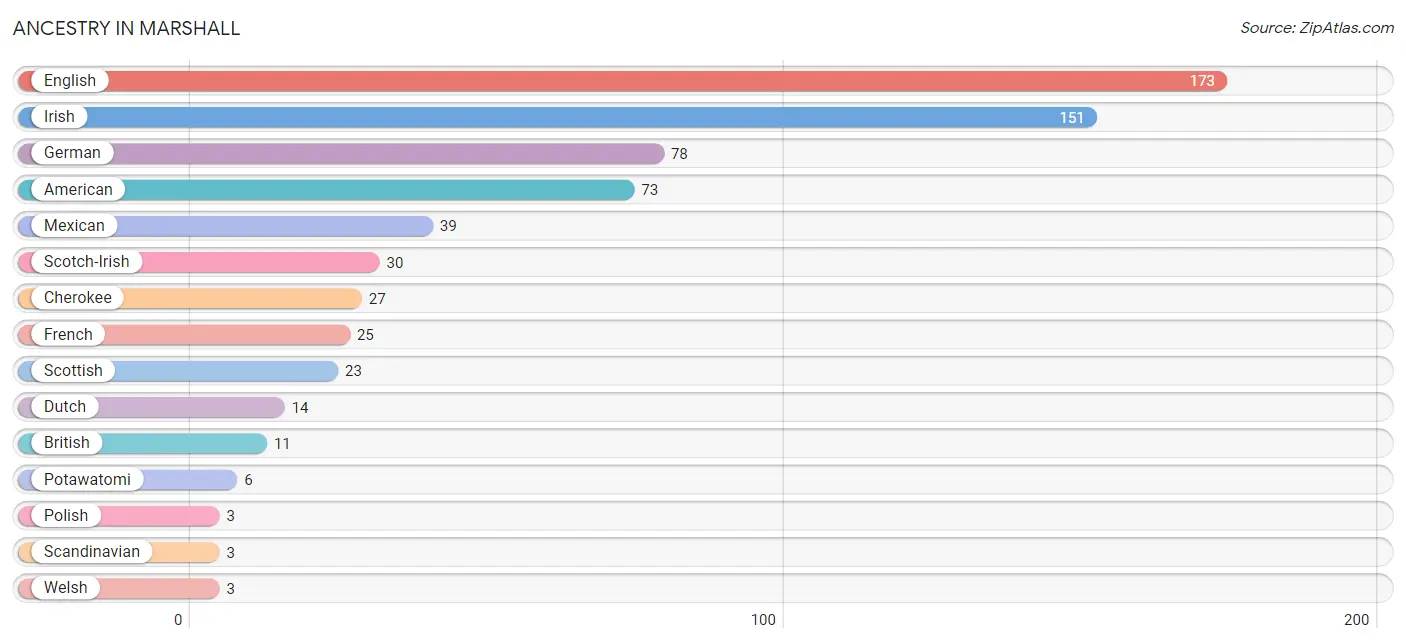
| Ancestry | # Population | % Population |
| American | 73 | 5.3% |
| British | 11 | 0.8% |
| Cherokee | 27 | 1.9% |
| Dutch | 14 | 1.0% |
| English | 173 | 12.5% |
| French | 25 | 1.8% |
| German | 78 | 5.6% |
| Irish | 151 | 10.9% |
| Mexican | 39 | 2.8% |
| Polish | 3 | 0.2% |
| Potawatomi | 6 | 0.4% |
| Scandinavian | 3 | 0.2% |
| Scotch-Irish | 30 | 2.2% |
| Scottish | 23 | 1.7% |
| Welsh | 3 | 0.2% | View All 15 Rows |
Immigrants in Marshall

| Immigration Origin | # Population | % Population | View All 0 Rows |
Sex and Age in Marshall
Sex and Age in Marshall
The most populous age groups in Marshall are 65 to 69 Years (160 | 24.8%) for men and 65 to 69 Years (95 | 12.8%) for women.
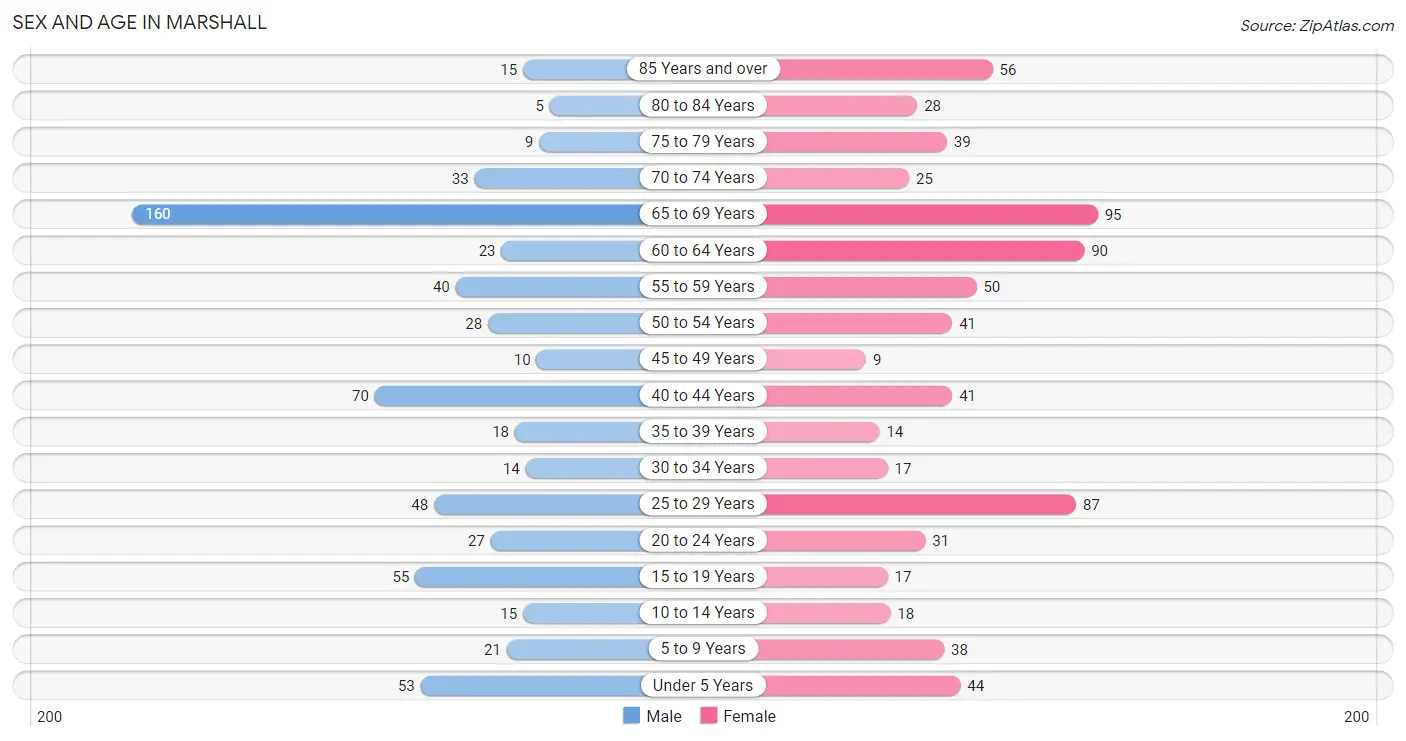
| Age Bracket | Male | Female |
| Under 5 Years | 53 (8.2%) | 44 (5.9%) |
| 5 to 9 Years | 21 (3.3%) | 38 (5.1%) |
| 10 to 14 Years | 15 (2.3%) | 18 (2.4%) |
| 15 to 19 Years | 55 (8.5%) | 17 (2.3%) |
| 20 to 24 Years | 27 (4.2%) | 31 (4.2%) |
| 25 to 29 Years | 48 (7.4%) | 87 (11.8%) |
| 30 to 34 Years | 14 (2.2%) | 17 (2.3%) |
| 35 to 39 Years | 18 (2.8%) | 14 (1.9%) |
| 40 to 44 Years | 70 (10.9%) | 41 (5.5%) |
| 45 to 49 Years | 10 (1.5%) | 9 (1.2%) |
| 50 to 54 Years | 28 (4.3%) | 41 (5.5%) |
| 55 to 59 Years | 40 (6.2%) | 50 (6.8%) |
| 60 to 64 Years | 23 (3.6%) | 90 (12.2%) |
| 65 to 69 Years | 160 (24.8%) | 95 (12.8%) |
| 70 to 74 Years | 33 (5.1%) | 25 (3.4%) |
| 75 to 79 Years | 9 (1.4%) | 39 (5.3%) |
| 80 to 84 Years | 5 (0.8%) | 28 (3.8%) |
| 85 Years and over | 15 (2.3%) | 56 (7.6%) |
| Total | 644 (100.0%) | 740 (100.0%) |
Families and Households in Marshall
Median Family Size in Marshall
The median family size in Marshall is 3.48 persons per family, with single female/mother families (78 | 29.8%) accounting for the largest median family size of 3.95 persons per family. On the other hand, single male/father families (2 | 0.8%) represent the smallest median family size with 2.50 persons per family.
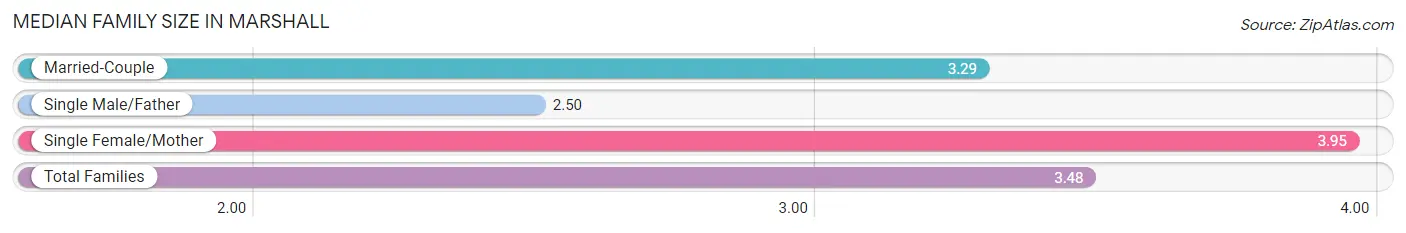
| Family Type | # Families | Family Size |
| Married-Couple | 182 (69.5%) | 3.29 |
| Single Male/Father | 2 (0.8%) | 2.50 |
| Single Female/Mother | 78 (29.8%) | 3.95 |
| Total Families | 262 (100.0%) | 3.48 |
Median Household Size in Marshall
The median household size in Marshall is 2.35 persons per household, with single female/mother households (78 | 14.1%) accounting for the largest median household size of 4.23 persons per household. non-family households (291 | 52.6%) represent the smallest median household size with 1.25 persons per household.
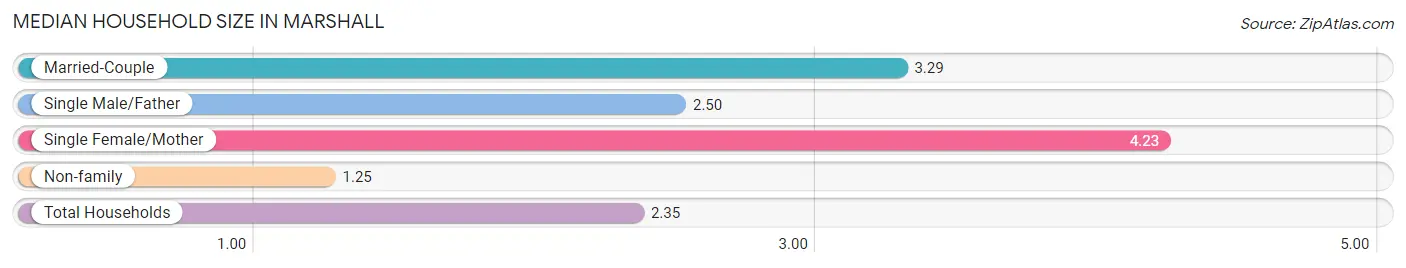
| Household Type | # Households | Household Size |
| Married-Couple | 182 (32.9%) | 3.29 |
| Single Male/Father | 2 (0.4%) | 2.50 |
| Single Female/Mother | 78 (14.1%) | 4.23 |
| Non-family | 291 (52.6%) | 1.25 |
| Total Households | 553 (100.0%) | 2.35 |
Household Size by Marriage Status in Marshall
Out of a total of 553 households in Marshall, 262 (47.4%) are family households, while 291 (52.6%) are nonfamily households. The most numerous type of family households are 2-person households, comprising 141, and the most common type of nonfamily households are 1-person households, comprising 252.
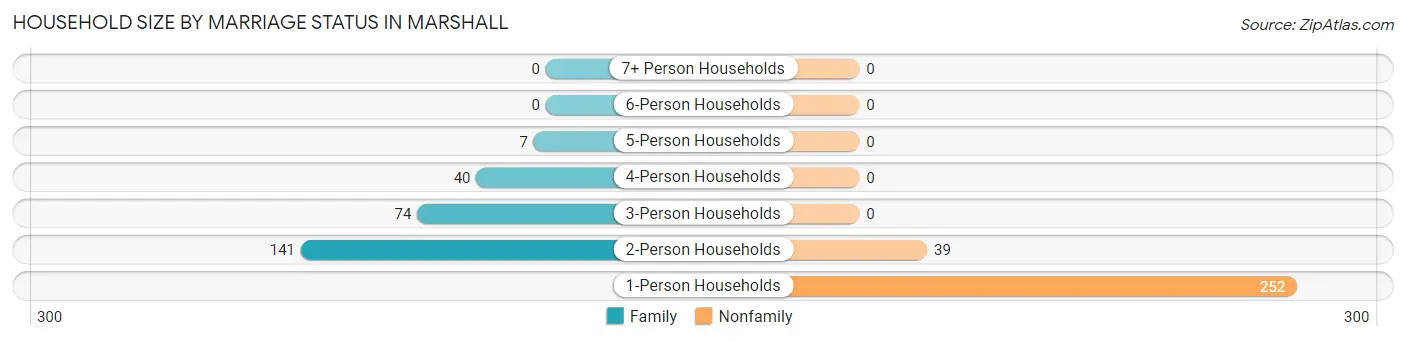
| Household Size | Family Households | Nonfamily Households |
| 1-Person Households | - | 252 (45.6%) |
| 2-Person Households | 141 (25.5%) | 39 (7.0%) |
| 3-Person Households | 74 (13.4%) | 0 (0.0%) |
| 4-Person Households | 40 (7.2%) | 0 (0.0%) |
| 5-Person Households | 7 (1.3%) | 0 (0.0%) |
| 6-Person Households | 0 (0.0%) | 0 (0.0%) |
| 7+ Person Households | 0 (0.0%) | 0 (0.0%) |
| Total | 262 (47.4%) | 291 (52.6%) |
Female Fertility in Marshall
Fertility by Age in Marshall
Average fertility rate in Marshall is 22.0 births per 1,000 women. Women in the age bracket of 15 to 19 years have the highest fertility rate with 176.0 births per 1,000 women. Women in the age bracket of 15 to 19 years acount for 60.0% of all women with births.
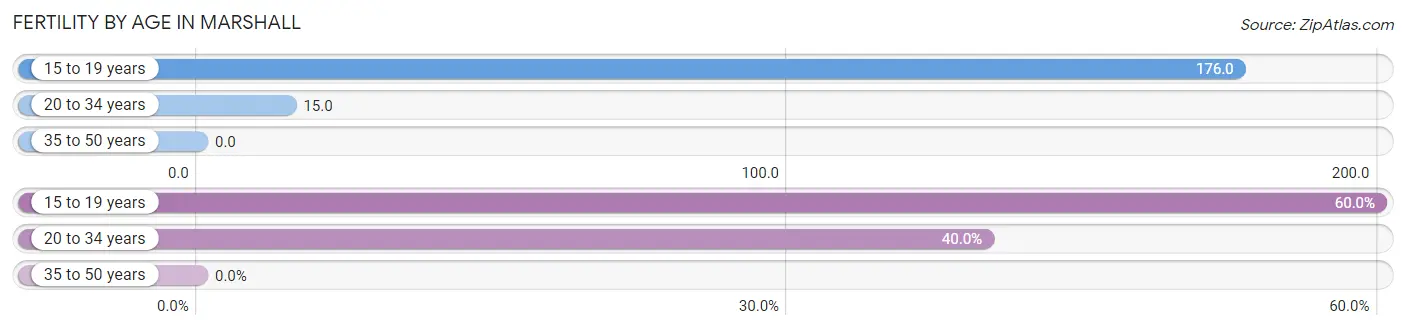
| Age Bracket | Women with Births | Births / 1,000 Women |
| 15 to 19 years | 3 (60.0%) | 176.0 |
| 20 to 34 years | 2 (40.0%) | 15.0 |
| 35 to 50 years | 0 (0.0%) | 0.0 |
| Total | 5 (100.0%) | 22.0 |
Fertility by Age by Marriage Status in Marshall
40.0% of women with births (5) in Marshall are married. The highest percentage of unmarried women with births falls into 15 to 19 years age bracket with 100.0% of them unmarried at the time of birth, while the lowest percentage of unmarried women with births belong to 20 to 34 years age bracket with 0.0% of them unmarried.
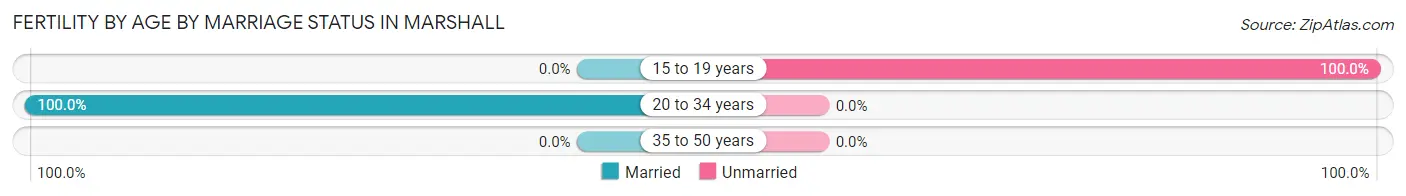
| Age Bracket | Married | Unmarried |
| 15 to 19 years | 0 (0.0%) | 3 (100.0%) |
| 20 to 34 years | 2 (100.0%) | 0 (0.0%) |
| 35 to 50 years | 0 (0.0%) | 0 (0.0%) |
| Total | 2 (40.0%) | 3 (60.0%) |
Fertility by Education in Marshall
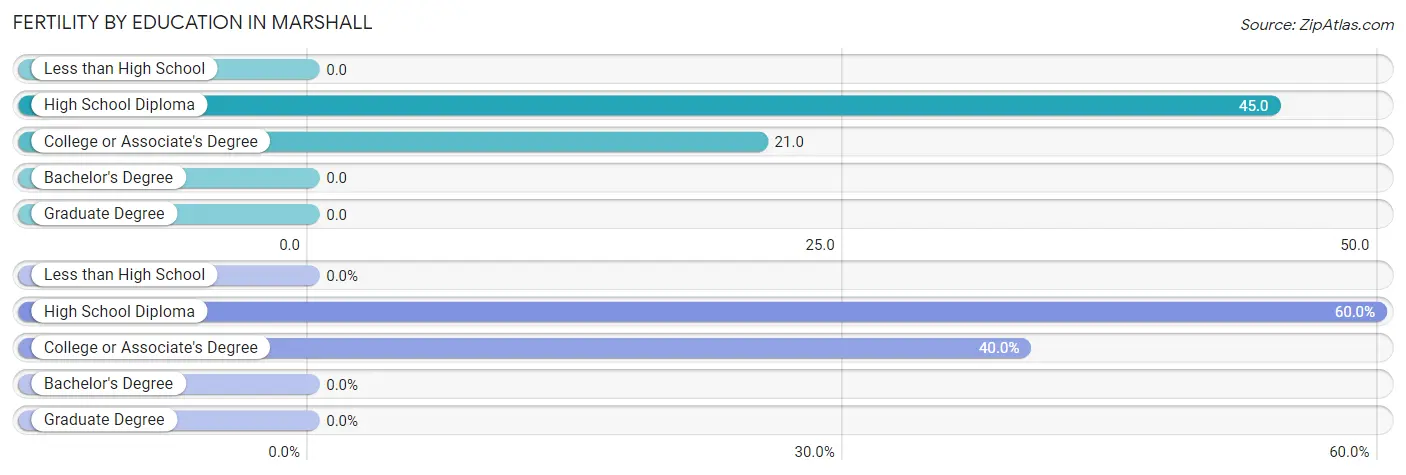
| Educational Attainment | Women with Births | Births / 1,000 Women |
| Less than High School | 0 (0.0%) | 0.0 |
| High School Diploma | 3 (60.0%) | 45.0 |
| College or Associate's Degree | 2 (40.0%) | 21.0 |
| Bachelor's Degree | 0 (0.0%) | 0.0 |
| Graduate Degree | 0 (0.0%) | 0.0 |
| Total | 5 (100.0%) | 22.0 |
Fertility by Education by Marriage Status in Marshall
60.0% of women with births in Marshall are unmarried. Women with the educational attainment of college or associate's degree are most likely to be married with 100.0% of them married at childbirth, while women with the educational attainment of high school diploma are least likely to be married with 100.0% of them unmarried at childbirth.
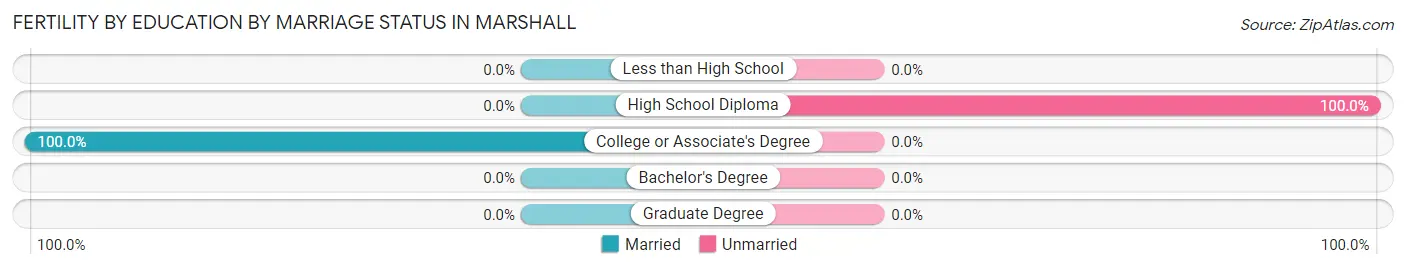
| Educational Attainment | Married | Unmarried |
| Less than High School | 0 (0.0%) | 0 (0.0%) |
| High School Diploma | 0 (0.0%) | 3 (100.0%) |
| College or Associate's Degree | 2 (100.0%) | 0 (0.0%) |
| Bachelor's Degree | 0 (0.0%) | 0 (0.0%) |
| Graduate Degree | 0 (0.0%) | 0 (0.0%) |
| Total | 2 (40.0%) | 3 (60.0%) |
Employment Characteristics in Marshall
Employment by Class of Employer in Marshall
Among the 406 employed individuals in Marshall, private company employees (250 | 61.6%), local government employees (42 | 10.3%), and not-for-profit organizations (37 | 9.1%) make up the most common classes of employment.
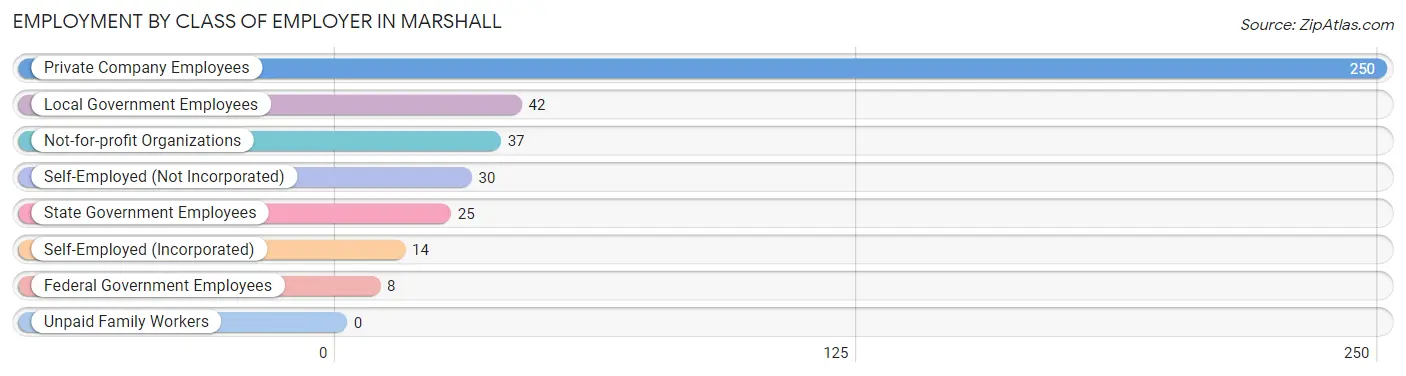
| Employer Class | # Employees | % Employees |
| Private Company Employees | 250 | 61.6% |
| Self-Employed (Incorporated) | 14 | 3.5% |
| Self-Employed (Not Incorporated) | 30 | 7.4% |
| Not-for-profit Organizations | 37 | 9.1% |
| Local Government Employees | 42 | 10.3% |
| State Government Employees | 25 | 6.2% |
| Federal Government Employees | 8 | 2.0% |
| Unpaid Family Workers | 0 | 0.0% |
| Total | 406 | 100.0% |
Employment Status by Age in Marshall
According to the labor force statistics for Marshall, out of the total population over 16 years of age (1,171), 36.4% or 426 individuals are in the labor force, with 3.3% or 14 of them unemployed. The age group with the highest labor force participation rate is 25 to 29 years, with 79.3% or 107 individuals in the labor force. Within the labor force, the 60 to 64 years age range has the highest percentage of unemployed individuals, with 30.0% or 3 of them being unemployed.
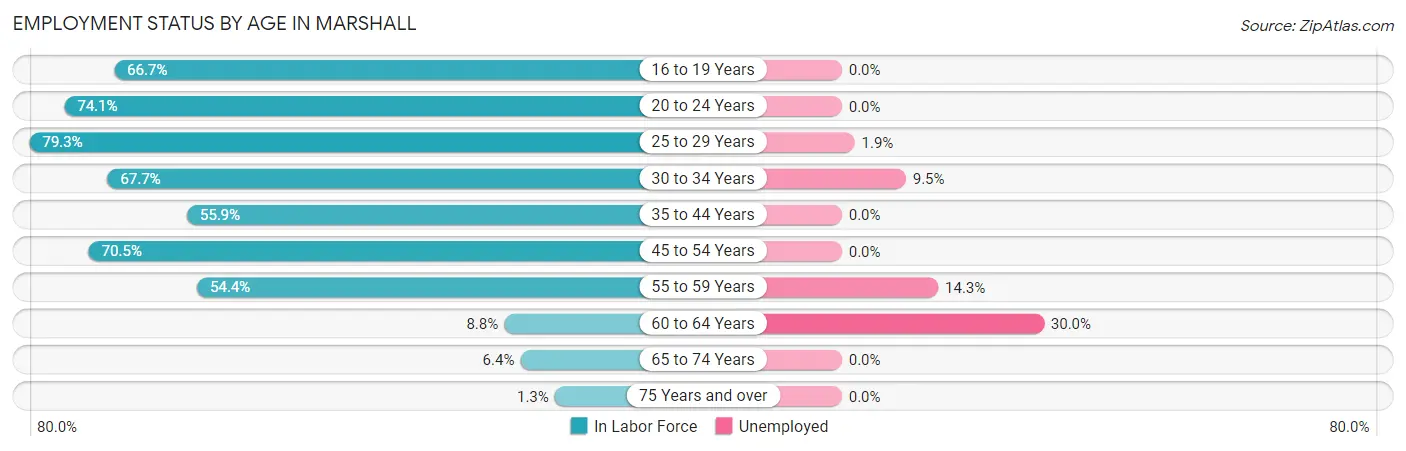
| Age Bracket | In Labor Force | Unemployed |
| 16 to 19 Years | 32 (66.7%) | 0 (0.0%) |
| 20 to 24 Years | 43 (74.1%) | 0 (0.0%) |
| 25 to 29 Years | 107 (79.3%) | 2 (1.9%) |
| 30 to 34 Years | 21 (67.7%) | 2 (9.5%) |
| 35 to 44 Years | 80 (55.9%) | 0 (0.0%) |
| 45 to 54 Years | 62 (70.5%) | 0 (0.0%) |
| 55 to 59 Years | 49 (54.4%) | 7 (14.3%) |
| 60 to 64 Years | 10 (8.8%) | 3 (30.0%) |
| 65 to 74 Years | 20 (6.4%) | 0 (0.0%) |
| 75 Years and over | 2 (1.3%) | 0 (0.0%) |
| Total | 426 (36.4%) | 14 (3.3%) |
Employment Status by Educational Attainment in Marshall
According to labor force statistics for Marshall, 54.8% of individuals (329) out of the total population between 25 and 64 years of age (600) are in the labor force, with 4.3% or 14 of them being unemployed. The group with the highest labor force participation rate are those with the educational attainment of college / associate degree, with 79.7% or 114 individuals in the labor force. Within the labor force, individuals with less than high school education have the highest percentage of unemployment, with 18.2% or 4 of them being unemployed.
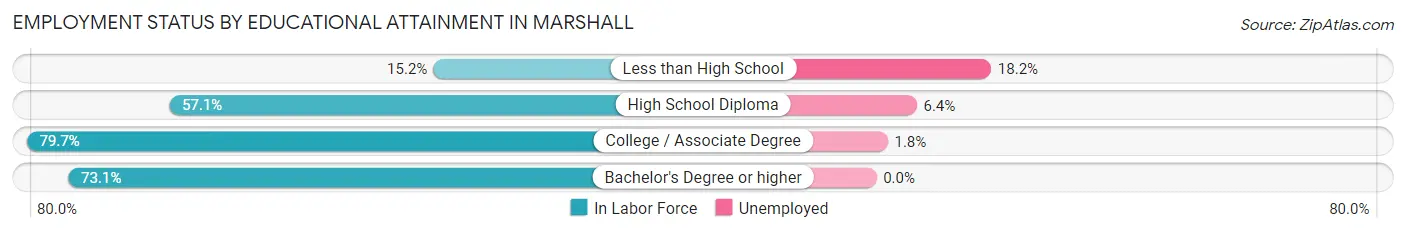
| Educational Attainment | In Labor Force | Unemployed |
| Less than High School | 22 (15.2%) | 26 (18.2%) |
| High School Diploma | 125 (57.1%) | 14 (6.4%) |
| College / Associate Degree | 114 (79.7%) | 3 (1.8%) |
| Bachelor's Degree or higher | 68 (73.1%) | 0 (0.0%) |
| Total | 329 (54.8%) | 26 (4.3%) |
Employment Occupations by Sex in Marshall
Management, Business, Science and Arts Occupations
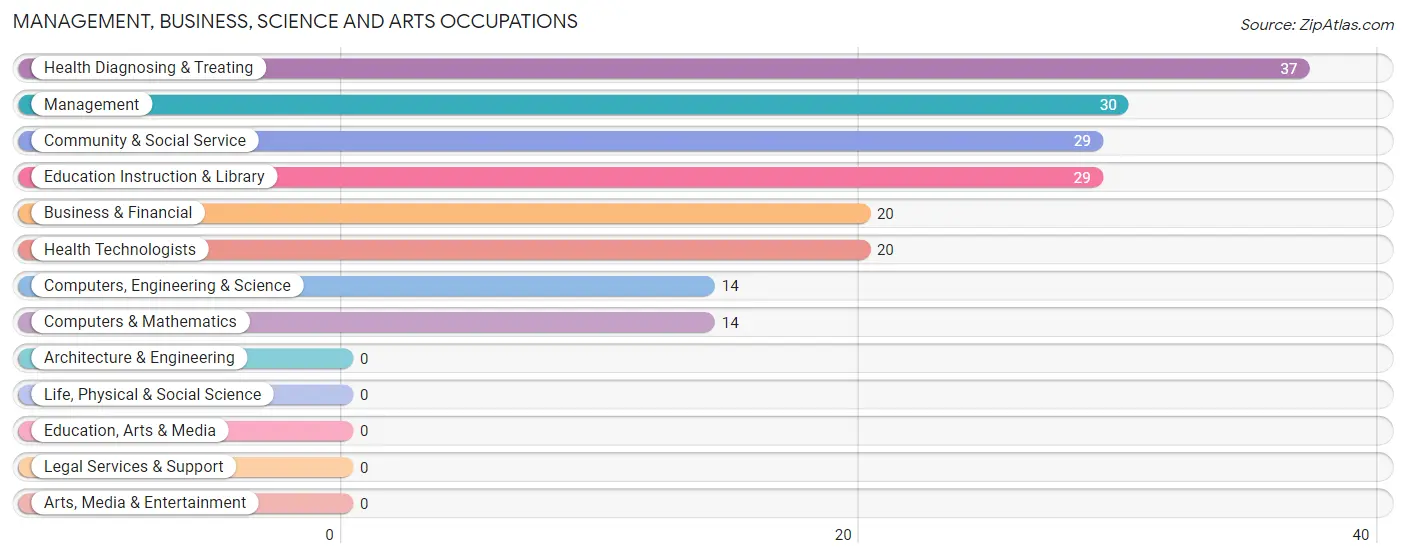
The most common Management, Business, Science and Arts occupations in Marshall are Health Diagnosing & Treating (37 | 9.0%), Management (30 | 7.3%), Community & Social Service (29 | 7.0%), Education Instruction & Library (29 | 7.0%), and Business & Financial (20 | 4.9%).
Management, Business, Science and Arts Occupations by Sex
Within the Management, Business, Science and Arts occupations in Marshall, the most male-oriented occupations are Management (80.0%), Business & Financial (80.0%), and Computers, Engineering & Science (50.0%), while the most female-oriented occupations are Community & Social Service (100.0%), Education Instruction & Library (100.0%), and Health Diagnosing & Treating (100.0%).
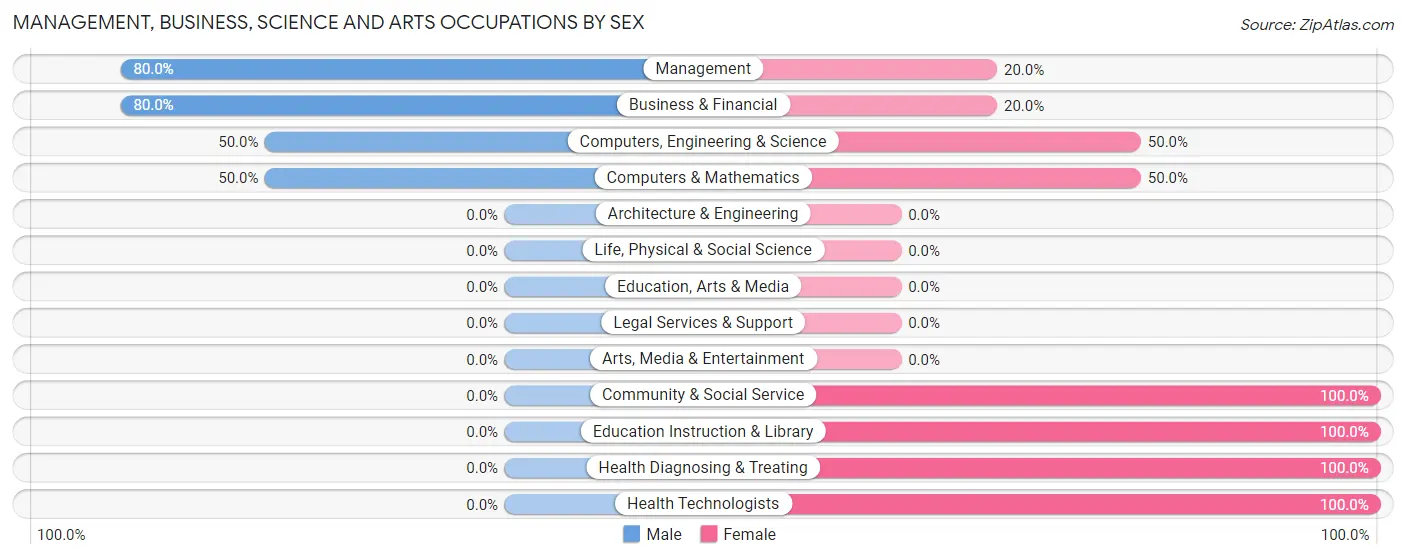
| Occupation | Male | Female |
| Management | 24 (80.0%) | 6 (20.0%) |
| Business & Financial | 16 (80.0%) | 4 (20.0%) |
| Computers, Engineering & Science | 7 (50.0%) | 7 (50.0%) |
| Computers & Mathematics | 7 (50.0%) | 7 (50.0%) |
| Architecture & Engineering | 0 (0.0%) | 0 (0.0%) |
| Life, Physical & Social Science | 0 (0.0%) | 0 (0.0%) |
| Community & Social Service | 0 (0.0%) | 29 (100.0%) |
| Education, Arts & Media | 0 (0.0%) | 0 (0.0%) |
| Legal Services & Support | 0 (0.0%) | 0 (0.0%) |
| Education Instruction & Library | 0 (0.0%) | 29 (100.0%) |
| Arts, Media & Entertainment | 0 (0.0%) | 0 (0.0%) |
| Health Diagnosing & Treating | 0 (0.0%) | 37 (100.0%) |
| Health Technologists | 0 (0.0%) | 20 (100.0%) |
| Total (Category) | 47 (36.1%) | 83 (63.8%) |
| Total (Overall) | 198 (48.1%) | 214 (51.9%) |
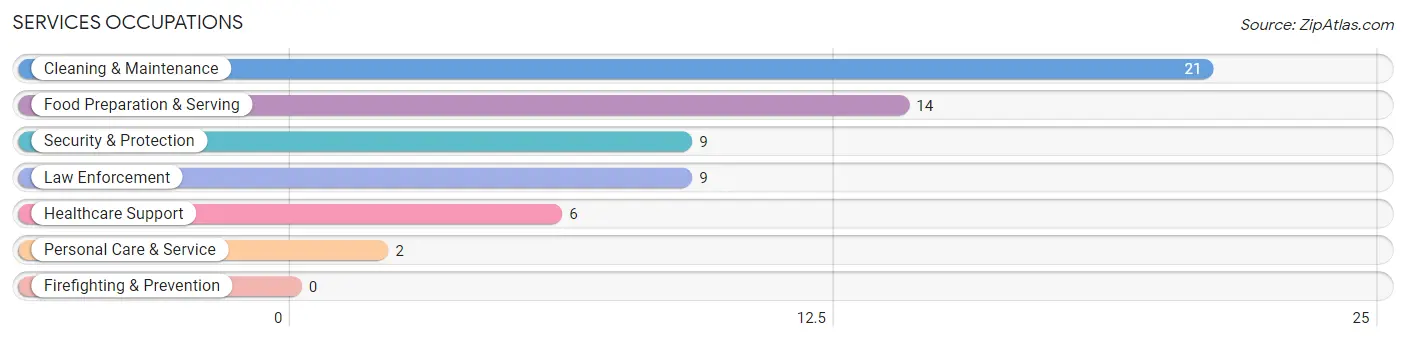
Services Occupations
The most common Services occupations in Marshall are Cleaning & Maintenance (21 | 5.1%), Food Preparation & Serving (14 | 3.4%), Security & Protection (9 | 2.2%), Law Enforcement (9 | 2.2%), and Healthcare Support (6 | 1.5%).
Services Occupations by Sex
Within the Services occupations in Marshall, the most male-oriented occupations are Security & Protection (100.0%), Law Enforcement (100.0%), and Cleaning & Maintenance (100.0%), while the most female-oriented occupations are Healthcare Support (100.0%), Food Preparation & Serving (100.0%), and Personal Care & Service (100.0%).
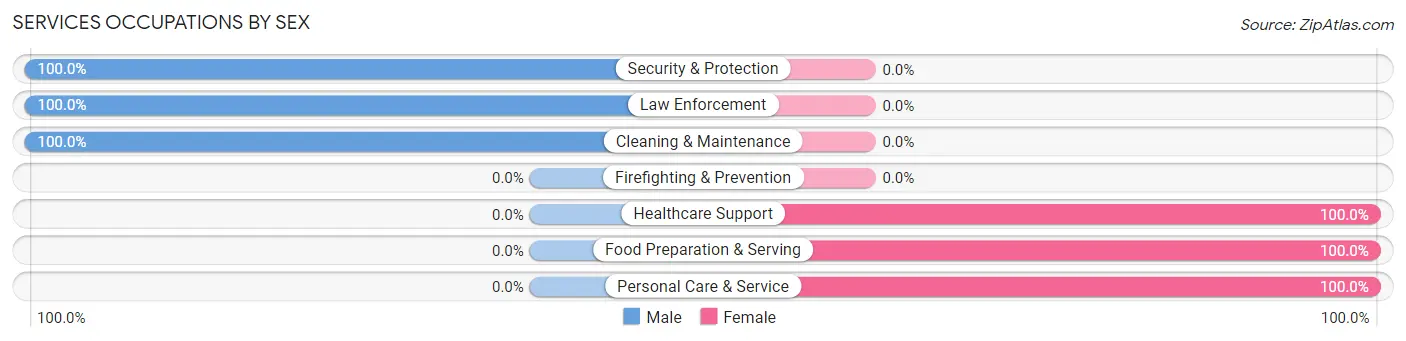
| Occupation | Male | Female |
| Healthcare Support | 0 (0.0%) | 6 (100.0%) |
| Security & Protection | 9 (100.0%) | 0 (0.0%) |
| Firefighting & Prevention | 0 (0.0%) | 0 (0.0%) |
| Law Enforcement | 9 (100.0%) | 0 (0.0%) |
| Food Preparation & Serving | 0 (0.0%) | 14 (100.0%) |
| Cleaning & Maintenance | 21 (100.0%) | 0 (0.0%) |
| Personal Care & Service | 0 (0.0%) | 2 (100.0%) |
| Total (Category) | 30 (57.7%) | 22 (42.3%) |
| Total (Overall) | 198 (48.1%) | 214 (51.9%) |
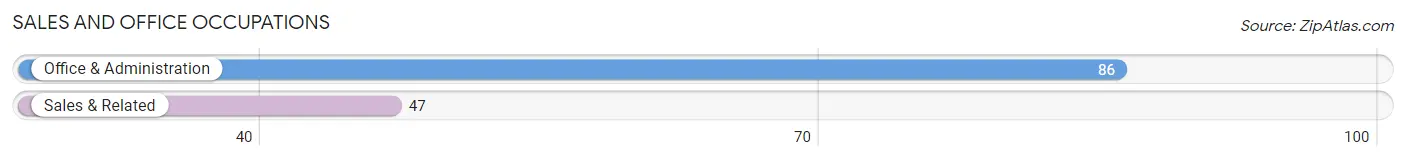
Sales and Office Occupations
The most common Sales and Office occupations in Marshall are Office & Administration (86 | 20.9%), and Sales & Related (47 | 11.4%).
Sales and Office Occupations by Sex
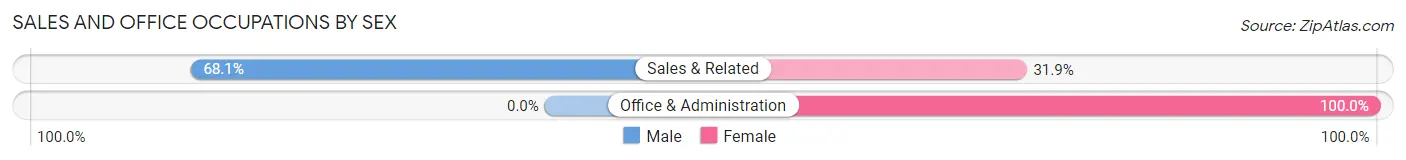
| Occupation | Male | Female |
| Sales & Related | 32 (68.1%) | 15 (31.9%) |
| Office & Administration | 0 (0.0%) | 86 (100.0%) |
| Total (Category) | 32 (24.1%) | 101 (75.9%) |
| Total (Overall) | 198 (48.1%) | 214 (51.9%) |
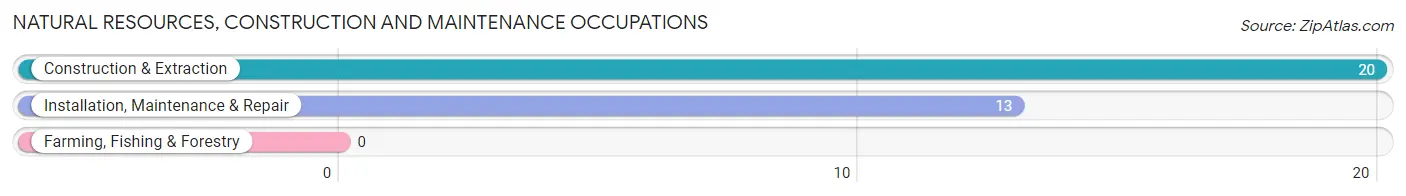
Natural Resources, Construction and Maintenance Occupations
The most common Natural Resources, Construction and Maintenance occupations in Marshall are Construction & Extraction (20 | 4.9%), and Installation, Maintenance & Repair (13 | 3.2%).
Natural Resources, Construction and Maintenance Occupations by Sex
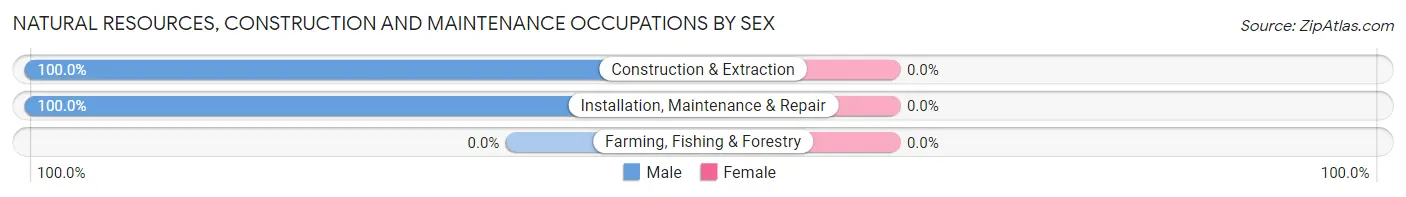
| Occupation | Male | Female |
| Farming, Fishing & Forestry | 0 (0.0%) | 0 (0.0%) |
| Construction & Extraction | 20 (100.0%) | 0 (0.0%) |
| Installation, Maintenance & Repair | 13 (100.0%) | 0 (0.0%) |
| Total (Category) | 33 (100.0%) | 0 (0.0%) |
| Total (Overall) | 198 (48.1%) | 214 (51.9%) |
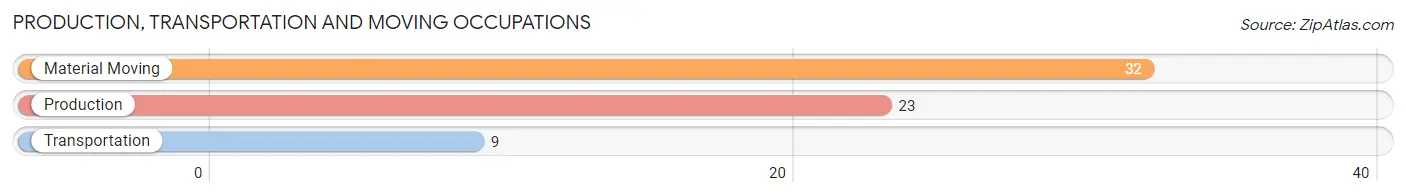
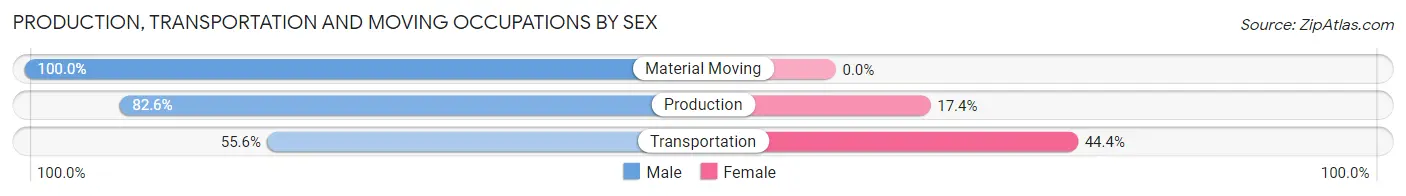
Production, Transportation and Moving Occupations
The most common Production, Transportation and Moving occupations in Marshall are Material Moving (32 | 7.8%), Production (23 | 5.6%), and Transportation (9 | 2.2%).
Production, Transportation and Moving Occupations by Sex
| Occupation | Male | Female |
| Production | 19 (82.6%) | 4 (17.4%) |
| Transportation | 5 (55.6%) | 4 (44.4%) |
| Material Moving | 32 (100.0%) | 0 (0.0%) |
| Total (Category) | 56 (87.5%) | 8 (12.5%) |
| Total (Overall) | 198 (48.1%) | 214 (51.9%) |
Employment Industries by Sex in Marshall
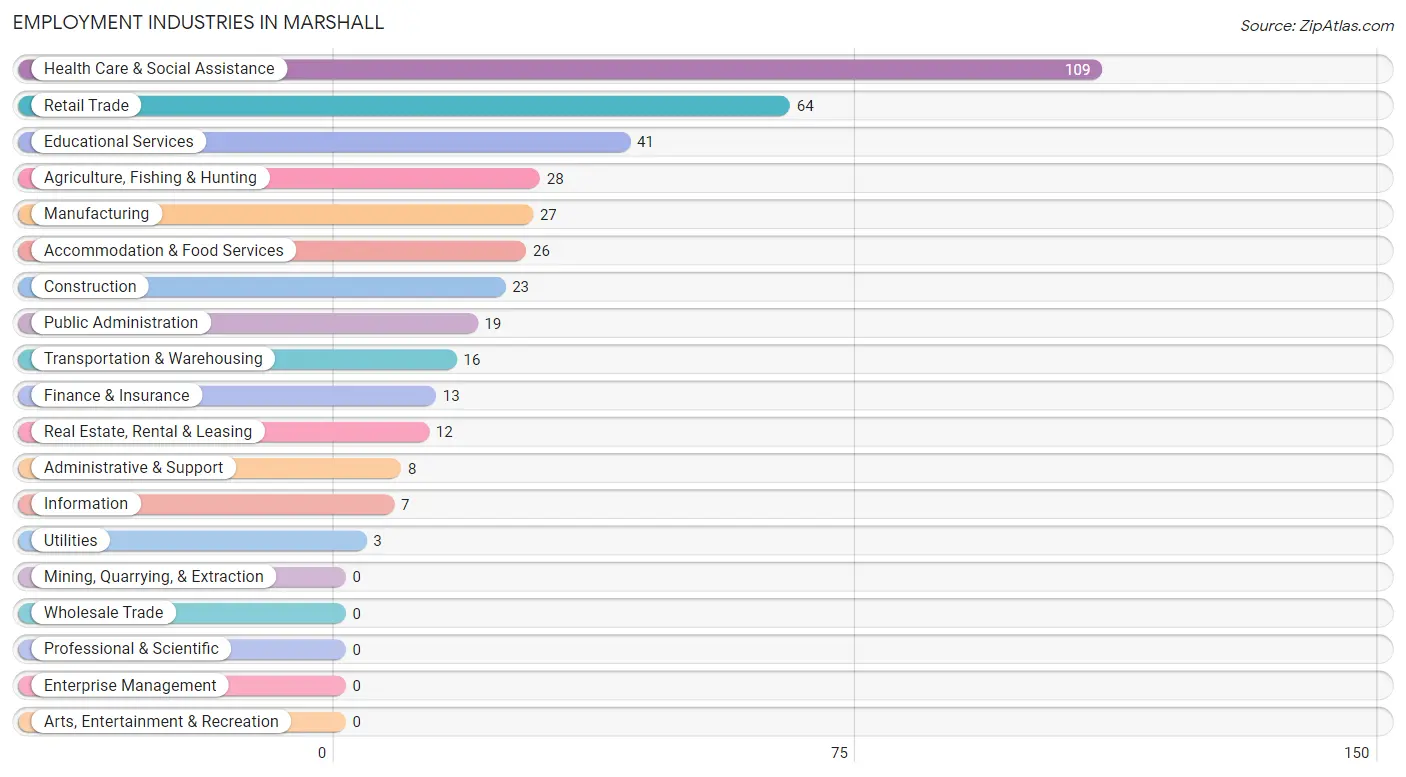
Employment Industries in Marshall
The major employment industries in Marshall include Health Care & Social Assistance (109 | 26.5%), Retail Trade (64 | 15.5%), Educational Services (41 | 10.0%), Agriculture, Fishing & Hunting (28 | 6.8%), and Manufacturing (27 | 6.6%).
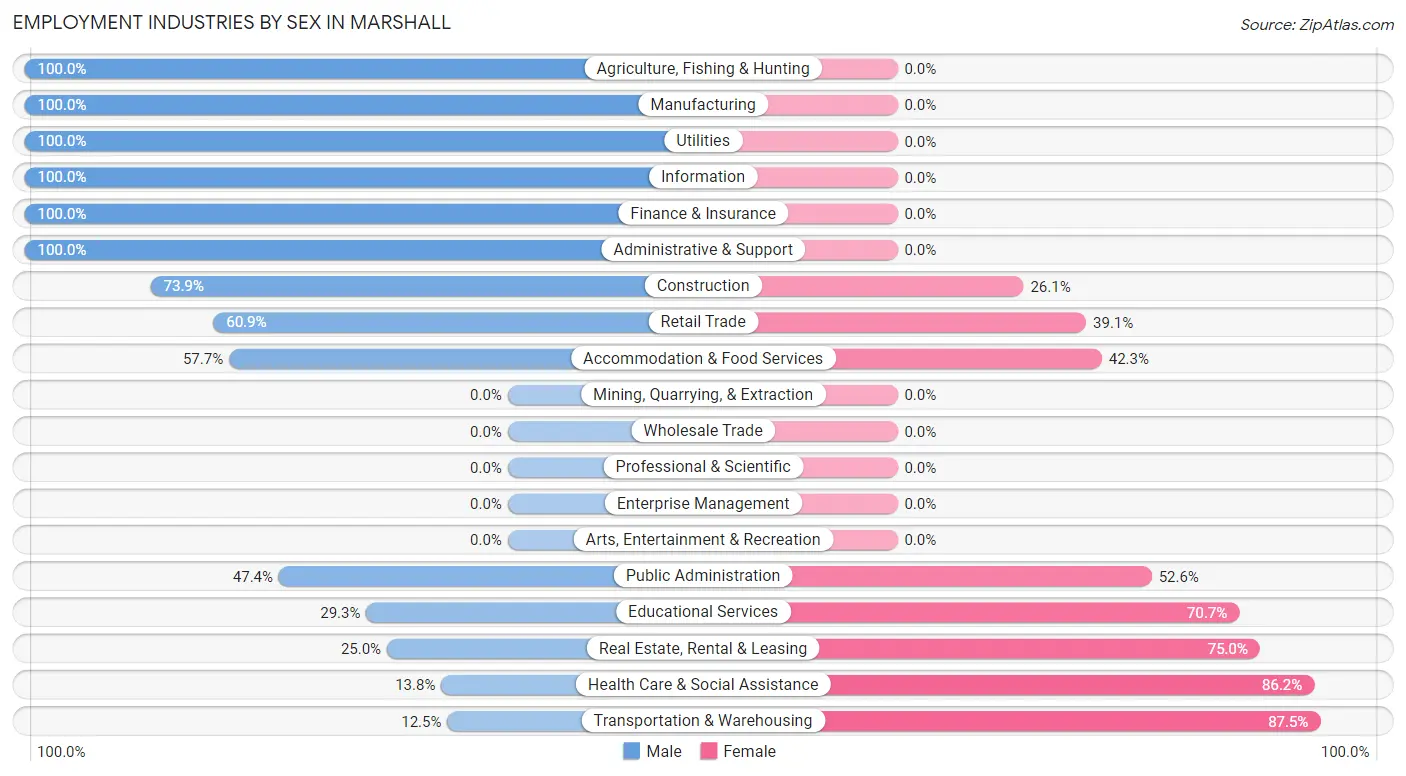
Employment Industries by Sex in Marshall
The Marshall industries that see more men than women are Agriculture, Fishing & Hunting (100.0%), Manufacturing (100.0%), and Utilities (100.0%), whereas the industries that tend to have a higher number of women are Transportation & Warehousing (87.5%), Health Care & Social Assistance (86.2%), and Real Estate, Rental & Leasing (75.0%).
| Industry | Male | Female |
| Agriculture, Fishing & Hunting | 28 (100.0%) | 0 (0.0%) |
| Mining, Quarrying, & Extraction | 0 (0.0%) | 0 (0.0%) |
| Construction | 17 (73.9%) | 6 (26.1%) |
| Manufacturing | 27 (100.0%) | 0 (0.0%) |
| Wholesale Trade | 0 (0.0%) | 0 (0.0%) |
| Retail Trade | 39 (60.9%) | 25 (39.1%) |
| Transportation & Warehousing | 2 (12.5%) | 14 (87.5%) |
| Utilities | 3 (100.0%) | 0 (0.0%) |
| Information | 7 (100.0%) | 0 (0.0%) |
| Finance & Insurance | 13 (100.0%) | 0 (0.0%) |
| Real Estate, Rental & Leasing | 3 (25.0%) | 9 (75.0%) |
| Professional & Scientific | 0 (0.0%) | 0 (0.0%) |
| Enterprise Management | 0 (0.0%) | 0 (0.0%) |
| Administrative & Support | 8 (100.0%) | 0 (0.0%) |
| Educational Services | 12 (29.3%) | 29 (70.7%) |
| Health Care & Social Assistance | 15 (13.8%) | 94 (86.2%) |
| Arts, Entertainment & Recreation | 0 (0.0%) | 0 (0.0%) |
| Accommodation & Food Services | 15 (57.7%) | 11 (42.3%) |
| Public Administration | 9 (47.4%) | 10 (52.6%) |
| Total | 198 (48.1%) | 214 (51.9%) |
Education in Marshall
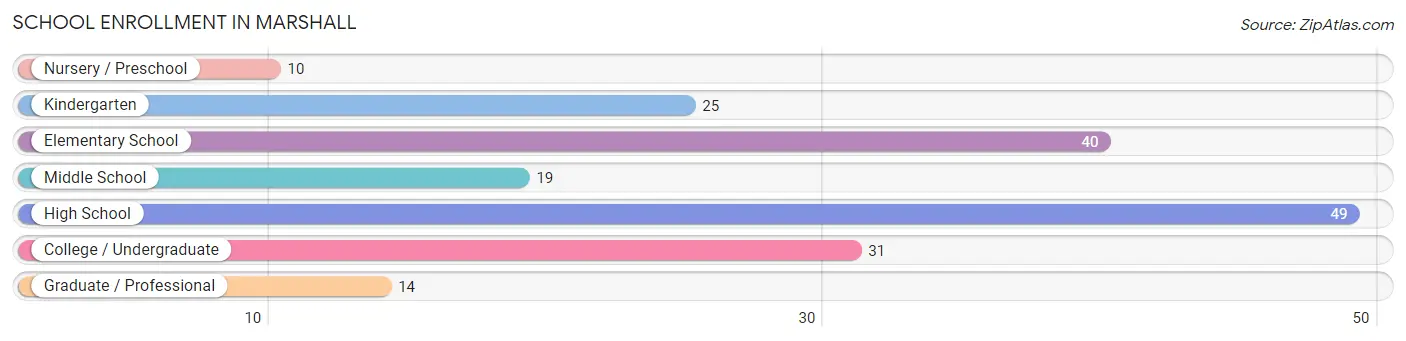
School Enrollment in Marshall
The most common levels of schooling among the 188 students in Marshall are high school (49 | 26.1%), elementary school (40 | 21.3%), and college / undergraduate (31 | 16.5%).
| School Level | # Students | % Students |
| Nursery / Preschool | 10 | 5.3% |
| Kindergarten | 25 | 13.3% |
| Elementary School | 40 | 21.3% |
| Middle School | 19 | 10.1% |
| High School | 49 | 26.1% |
| College / Undergraduate | 31 | 16.5% |
| Graduate / Professional | 14 | 7.4% |
| Total | 188 | 100.0% |
School Enrollment by Age by Funding Source in Marshall
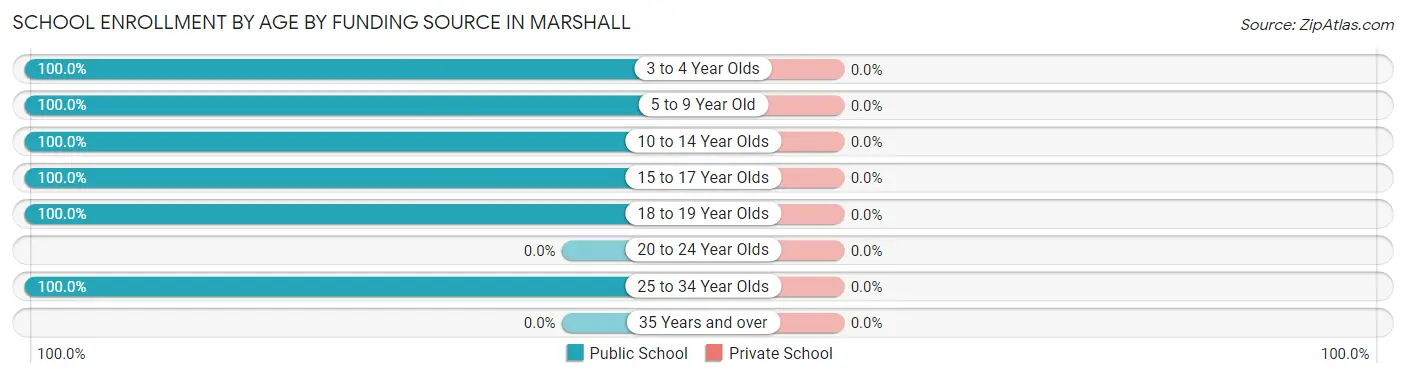
| Age Bracket | Public School | Private School |
| 3 to 4 Year Olds | 10 (100.0%) | 0 (0.0%) |
| 5 to 9 Year Old | 55 (100.0%) | 0 (0.0%) |
| 10 to 14 Year Olds | 33 (100.0%) | 0 (0.0%) |
| 15 to 17 Year Olds | 45 (100.0%) | 0 (0.0%) |
| 18 to 19 Year Olds | 14 (100.0%) | 0 (0.0%) |
| 20 to 24 Year Olds | 0 (0.0%) | 0 (0.0%) |
| 25 to 34 Year Olds | 31 (100.0%) | 0 (0.0%) |
| 35 Years and over | 0 (0.0%) | 0 (0.0%) |
| Total | 188 (100.0%) | 0 (0.0%) |
Educational Attainment by Field of Study in Marshall
Education (55 | 35.3%), business (49 | 31.4%), science & technology (22 | 14.1%), social sciences (21 | 13.5%), and physical & health sciences (4 | 2.6%) are the most common fields of study among 156 individuals in Marshall who have obtained a bachelor's degree or higher.
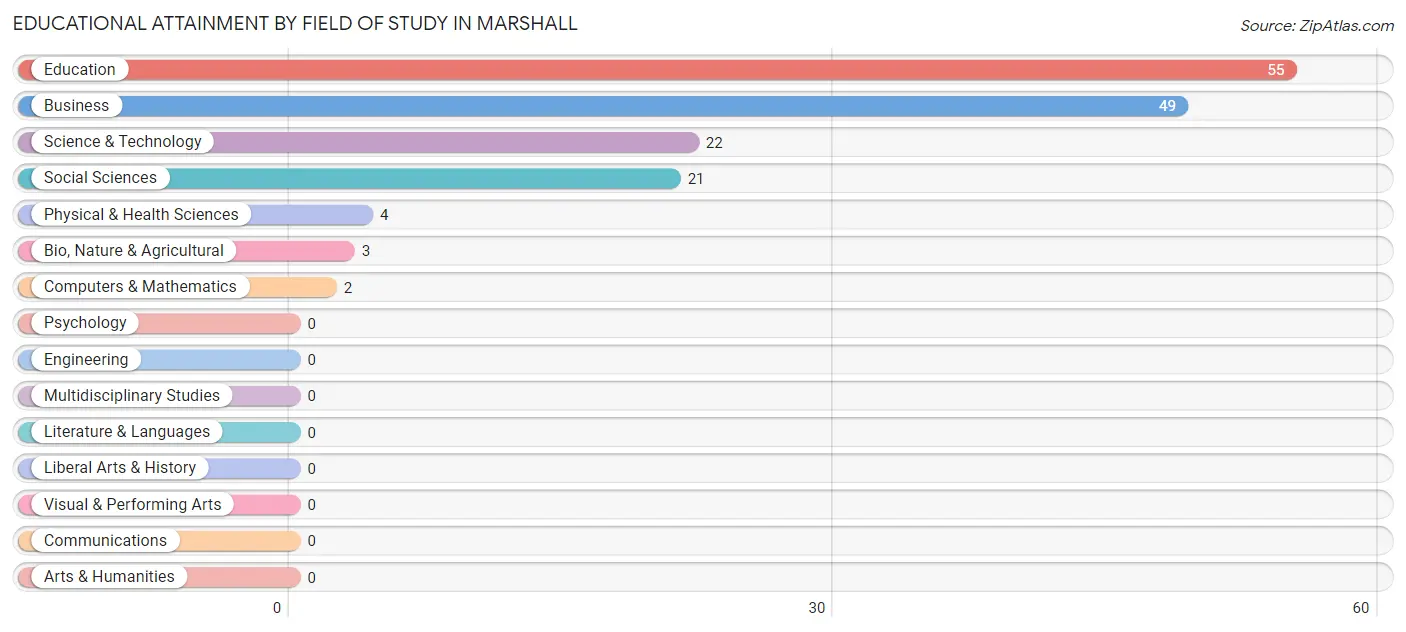
| Field of Study | # Graduates | % Graduates |
| Computers & Mathematics | 2 | 1.3% |
| Bio, Nature & Agricultural | 3 | 1.9% |
| Physical & Health Sciences | 4 | 2.6% |
| Psychology | 0 | 0.0% |
| Social Sciences | 21 | 13.5% |
| Engineering | 0 | 0.0% |
| Multidisciplinary Studies | 0 | 0.0% |
| Science & Technology | 22 | 14.1% |
| Business | 49 | 31.4% |
| Education | 55 | 35.3% |
| Literature & Languages | 0 | 0.0% |
| Liberal Arts & History | 0 | 0.0% |
| Visual & Performing Arts | 0 | 0.0% |
| Communications | 0 | 0.0% |
| Arts & Humanities | 0 | 0.0% |
| Total | 156 | 100.0% |
Transportation & Commute in Marshall
Vehicle Availability by Sex in Marshall
The most prevalent vehicle ownership categories in Marshall are males with 2 vehicles (78, accounting for 40.2%) and females with 2 vehicles (105, making up 36.8%).
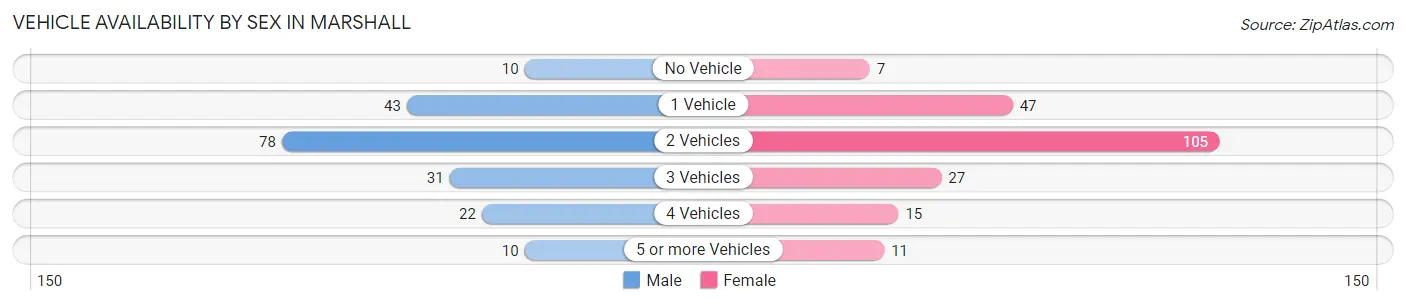
| Vehicles Available | Male | Female |
| No Vehicle | 10 (5.1%) | 7 (3.3%) |
| 1 Vehicle | 43 (22.2%) | 47 (22.2%) |
| 2 Vehicles | 78 (40.2%) | 105 (49.5%) |
| 3 Vehicles | 31 (16.0%) | 27 (12.7%) |
| 4 Vehicles | 22 (11.3%) | 15 (7.1%) |
| 5 or more Vehicles | 10 (5.1%) | 11 (5.2%) |
| Total | 194 (100.0%) | 212 (100.0%) |
Commute Time in Marshall
The most frequently occuring commute durations in Marshall are less than 5 minutes (120 commuters, 30.8%), 5 to 9 minutes (119 commuters, 30.6%), and 45 to 59 minutes (54 commuters, 13.9%).
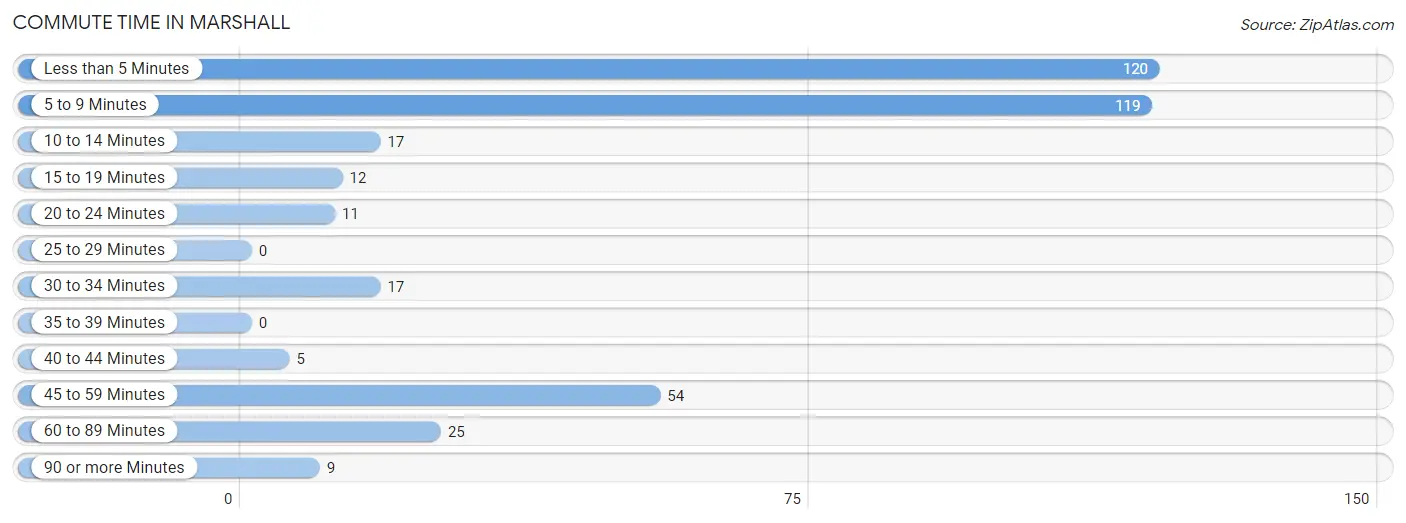
| Commute Time | # Commuters | % Commuters |
| Less than 5 Minutes | 120 | 30.8% |
| 5 to 9 Minutes | 119 | 30.6% |
| 10 to 14 Minutes | 17 | 4.4% |
| 15 to 19 Minutes | 12 | 3.1% |
| 20 to 24 Minutes | 11 | 2.8% |
| 25 to 29 Minutes | 0 | 0.0% |
| 30 to 34 Minutes | 17 | 4.4% |
| 35 to 39 Minutes | 0 | 0.0% |
| 40 to 44 Minutes | 5 | 1.3% |
| 45 to 59 Minutes | 54 | 13.9% |
| 60 to 89 Minutes | 25 | 6.4% |
| 90 or more Minutes | 9 | 2.3% |
Commute Time by Sex in Marshall
The most common commute times in Marshall are 5 to 9 minutes (62 commuters, 32.0%) for males and less than 5 minutes (68 commuters, 34.9%) for females.
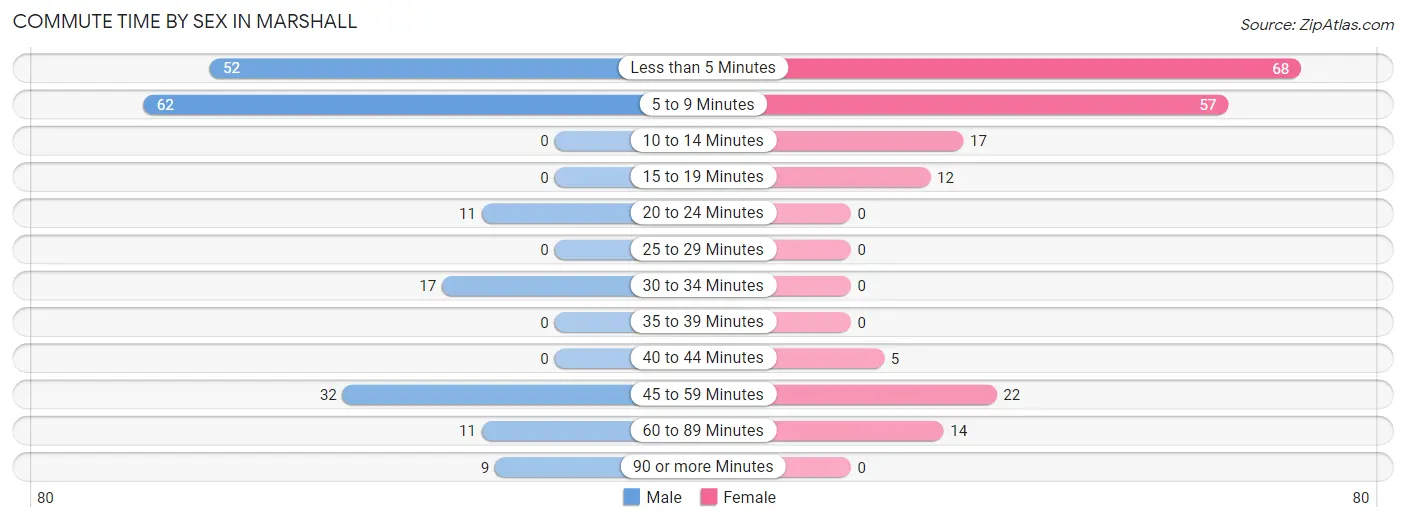
| Commute Time | Male | Female |
| Less than 5 Minutes | 52 (26.8%) | 68 (34.9%) |
| 5 to 9 Minutes | 62 (32.0%) | 57 (29.2%) |
| 10 to 14 Minutes | 0 (0.0%) | 17 (8.7%) |
| 15 to 19 Minutes | 0 (0.0%) | 12 (6.1%) |
| 20 to 24 Minutes | 11 (5.7%) | 0 (0.0%) |
| 25 to 29 Minutes | 0 (0.0%) | 0 (0.0%) |
| 30 to 34 Minutes | 17 (8.8%) | 0 (0.0%) |
| 35 to 39 Minutes | 0 (0.0%) | 0 (0.0%) |
| 40 to 44 Minutes | 0 (0.0%) | 5 (2.6%) |
| 45 to 59 Minutes | 32 (16.5%) | 22 (11.3%) |
| 60 to 89 Minutes | 11 (5.7%) | 14 (7.2%) |
| 90 or more Minutes | 9 (4.6%) | 0 (0.0%) |
Time of Departure to Work by Sex in Marshall
The most frequent times of departure to work in Marshall are 12:00 AM to 4:59 AM (36, 18.6%) for males and 7:00 AM to 7:29 AM (43, 22.1%) for females.
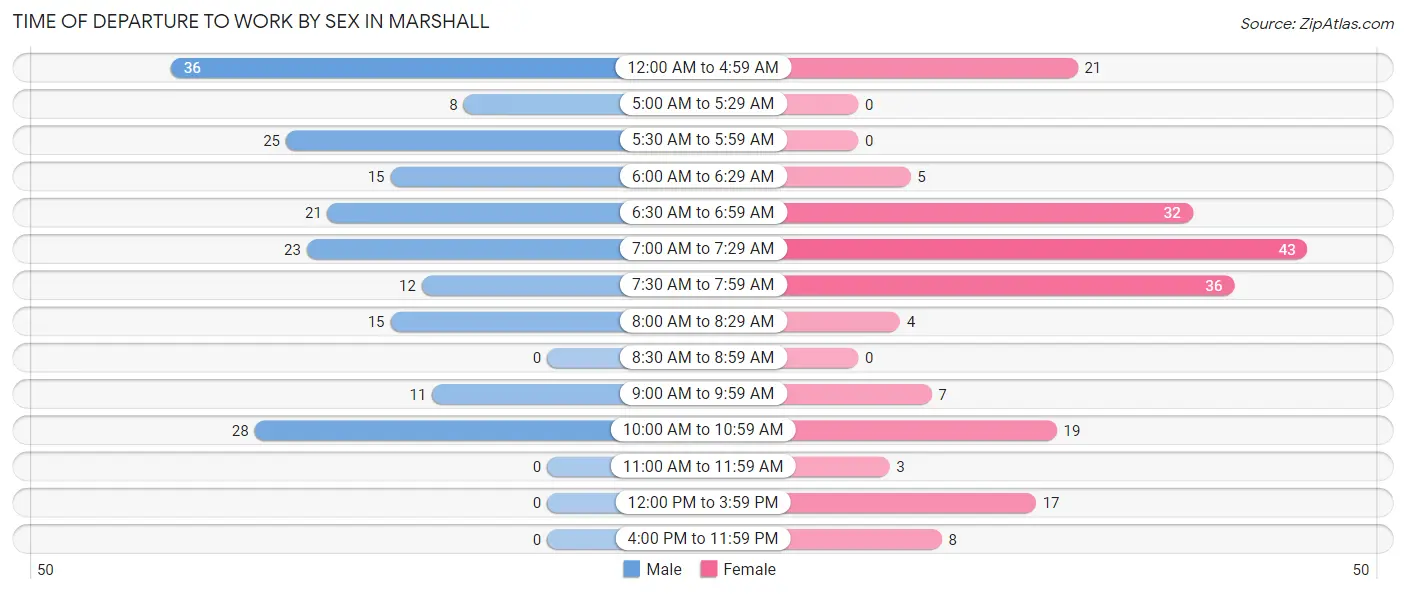
| Time of Departure | Male | Female |
| 12:00 AM to 4:59 AM | 36 (18.6%) | 21 (10.8%) |
| 5:00 AM to 5:29 AM | 8 (4.1%) | 0 (0.0%) |
| 5:30 AM to 5:59 AM | 25 (12.9%) | 0 (0.0%) |
| 6:00 AM to 6:29 AM | 15 (7.7%) | 5 (2.6%) |
| 6:30 AM to 6:59 AM | 21 (10.8%) | 32 (16.4%) |
| 7:00 AM to 7:29 AM | 23 (11.9%) | 43 (22.1%) |
| 7:30 AM to 7:59 AM | 12 (6.2%) | 36 (18.5%) |
| 8:00 AM to 8:29 AM | 15 (7.7%) | 4 (2.1%) |
| 8:30 AM to 8:59 AM | 0 (0.0%) | 0 (0.0%) |
| 9:00 AM to 9:59 AM | 11 (5.7%) | 7 (3.6%) |
| 10:00 AM to 10:59 AM | 28 (14.4%) | 19 (9.7%) |
| 11:00 AM to 11:59 AM | 0 (0.0%) | 3 (1.5%) |
| 12:00 PM to 3:59 PM | 0 (0.0%) | 17 (8.7%) |
| 4:00 PM to 11:59 PM | 0 (0.0%) | 8 (4.1%) |
| Total | 194 (100.0%) | 195 (100.0%) |
Housing Occupancy in Marshall
Occupancy by Ownership in Marshall
Of the total 553 dwellings in Marshall, owner-occupied units account for 272 (49.2%), while renter-occupied units make up 281 (50.8%).
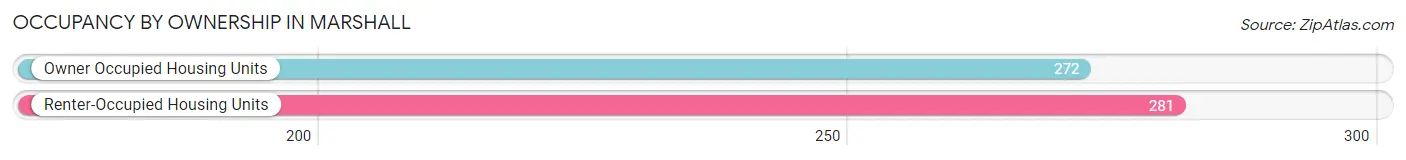
| Occupancy | # Housing Units | % Housing Units |
| Owner Occupied Housing Units | 272 | 49.2% |
| Renter-Occupied Housing Units | 281 | 50.8% |
| Total Occupied Housing Units | 553 | 100.0% |
Occupancy by Household Size in Marshall

| Household Size | # Housing Units | % Housing Units |
| 1-Person Household | 252 | 45.6% |
| 2-Person Household | 180 | 32.6% |
| 3-Person Household | 74 | 13.4% |
| 4+ Person Household | 47 | 8.5% |
| Total Housing Units | 553 | 100.0% |
Occupancy by Ownership by Household Size in Marshall
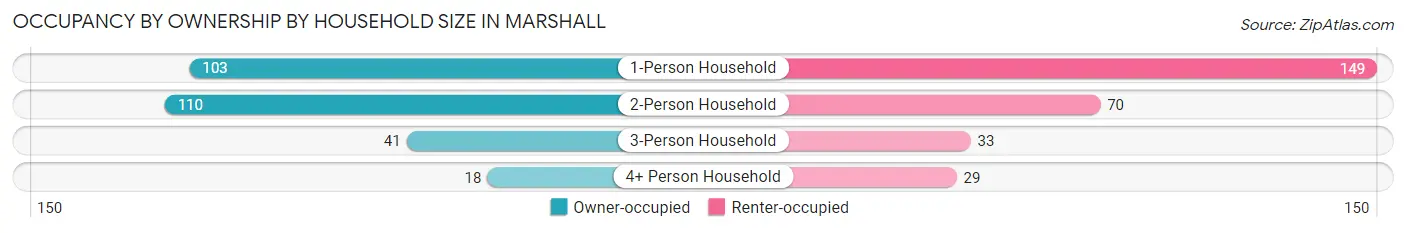
| Household Size | Owner-occupied | Renter-occupied |
| 1-Person Household | 103 (40.9%) | 149 (59.1%) |
| 2-Person Household | 110 (61.1%) | 70 (38.9%) |
| 3-Person Household | 41 (55.4%) | 33 (44.6%) |
| 4+ Person Household | 18 (38.3%) | 29 (61.7%) |
| Total Housing Units | 272 (49.2%) | 281 (50.8%) |
Occupancy by Educational Attainment in Marshall
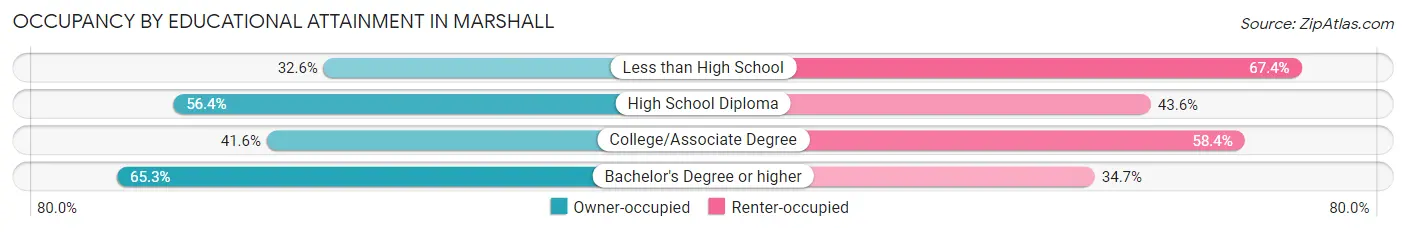
| Household Size | Owner-occupied | Renter-occupied |
| Less than High School | 28 (32.6%) | 58 (67.4%) |
| High School Diploma | 101 (56.4%) | 78 (43.6%) |
| College/Associate Degree | 79 (41.6%) | 111 (58.4%) |
| Bachelor's Degree or higher | 64 (65.3%) | 34 (34.7%) |
Occupancy by Age of Householder in Marshall
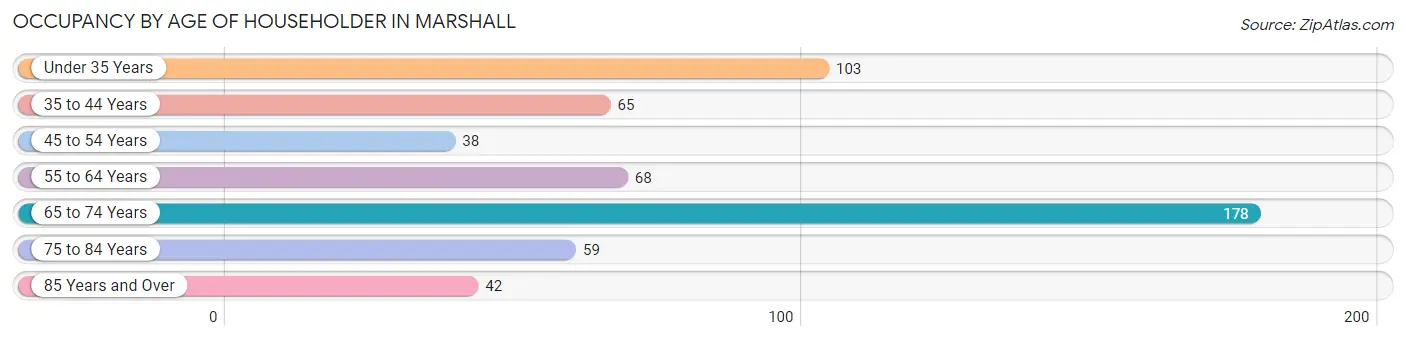
| Age Bracket | # Households | % Households |
| Under 35 Years | 103 | 18.6% |
| 35 to 44 Years | 65 | 11.7% |
| 45 to 54 Years | 38 | 6.9% |
| 55 to 64 Years | 68 | 12.3% |
| 65 to 74 Years | 178 | 32.2% |
| 75 to 84 Years | 59 | 10.7% |
| 85 Years and Over | 42 | 7.6% |
| Total | 553 | 100.0% |
Housing Finances in Marshall
Median Income by Occupancy in Marshall
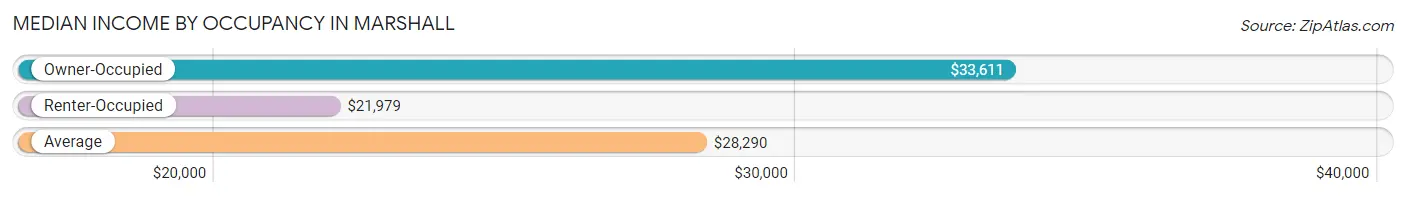
| Occupancy Type | # Households | Median Income |
| Owner-Occupied | 272 (49.2%) | $33,611 |
| Renter-Occupied | 281 (50.8%) | $21,979 |
| Average | 553 (100.0%) | $28,290 |
Occupancy by Householder Income Bracket in Marshall
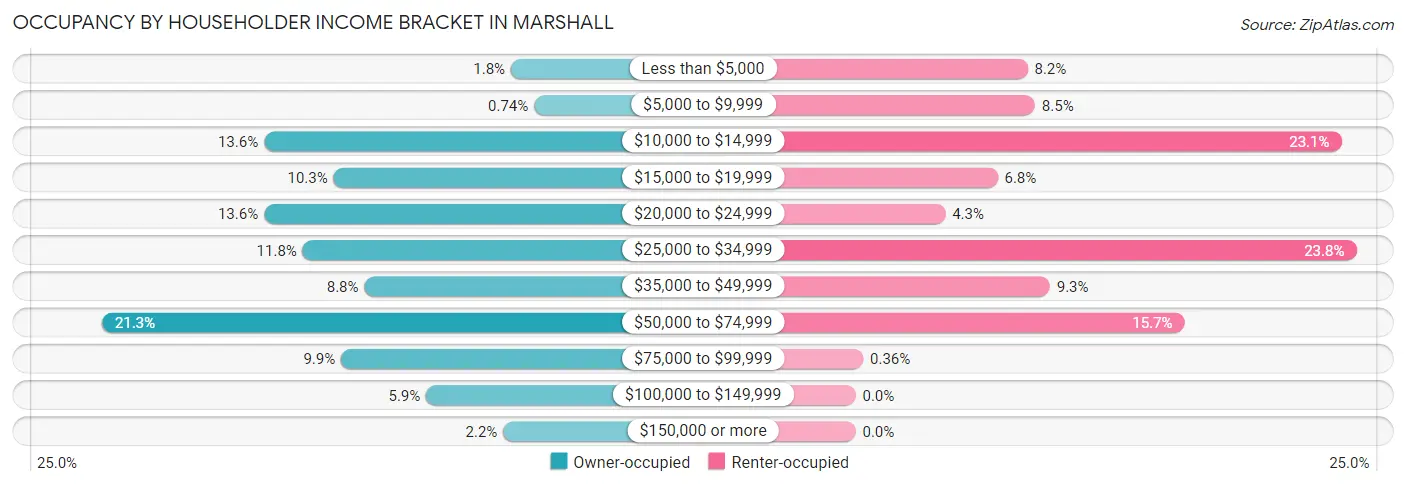
| Income Bracket | Owner-occupied | Renter-occupied |
| Less than $5,000 | 5 (1.8%) | 23 (8.2%) |
| $5,000 to $9,999 | 2 (0.7%) | 24 (8.5%) |
| $10,000 to $14,999 | 37 (13.6%) | 65 (23.1%) |
| $15,000 to $19,999 | 28 (10.3%) | 19 (6.8%) |
| $20,000 to $24,999 | 37 (13.6%) | 12 (4.3%) |
| $25,000 to $34,999 | 32 (11.8%) | 67 (23.8%) |
| $35,000 to $49,999 | 24 (8.8%) | 26 (9.2%) |
| $50,000 to $74,999 | 58 (21.3%) | 44 (15.7%) |
| $75,000 to $99,999 | 27 (9.9%) | 1 (0.4%) |
| $100,000 to $149,999 | 16 (5.9%) | 0 (0.0%) |
| $150,000 or more | 6 (2.2%) | 0 (0.0%) |
| Total | 272 (100.0%) | 281 (100.0%) |
Monthly Housing Cost Tiers in Marshall
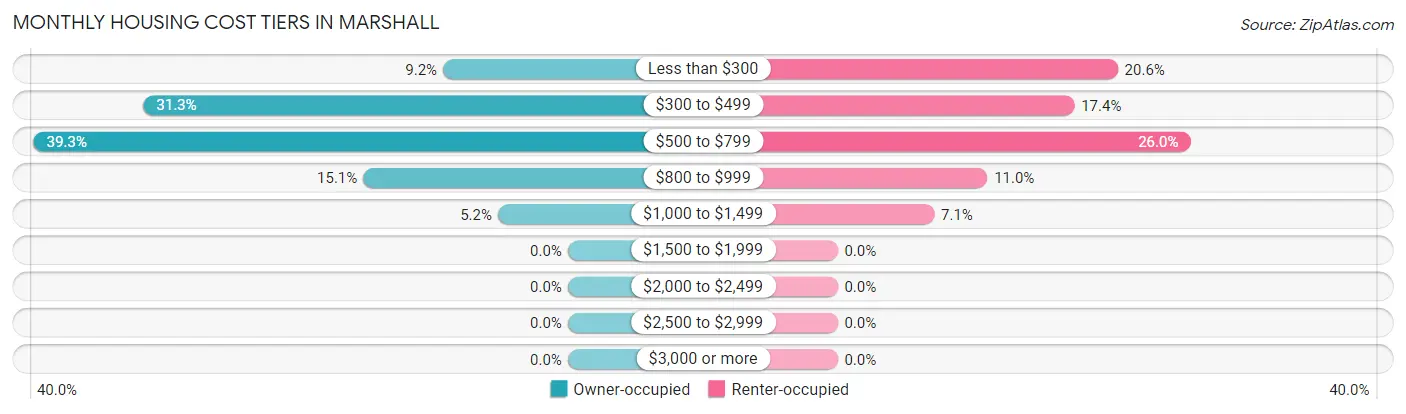
| Monthly Cost | Owner-occupied | Renter-occupied |
| Less than $300 | 25 (9.2%) | 58 (20.6%) |
| $300 to $499 | 85 (31.2%) | 49 (17.4%) |
| $500 to $799 | 107 (39.3%) | 73 (26.0%) |
| $800 to $999 | 41 (15.1%) | 31 (11.0%) |
| $1,000 to $1,499 | 14 (5.1%) | 20 (7.1%) |
| $1,500 to $1,999 | 0 (0.0%) | 0 (0.0%) |
| $2,000 to $2,499 | 0 (0.0%) | 0 (0.0%) |
| $2,500 to $2,999 | 0 (0.0%) | 0 (0.0%) |
| $3,000 or more | 0 (0.0%) | 0 (0.0%) |
| Total | 272 (100.0%) | 281 (100.0%) |
Physical Housing Characteristics in Marshall
Housing Structures in Marshall
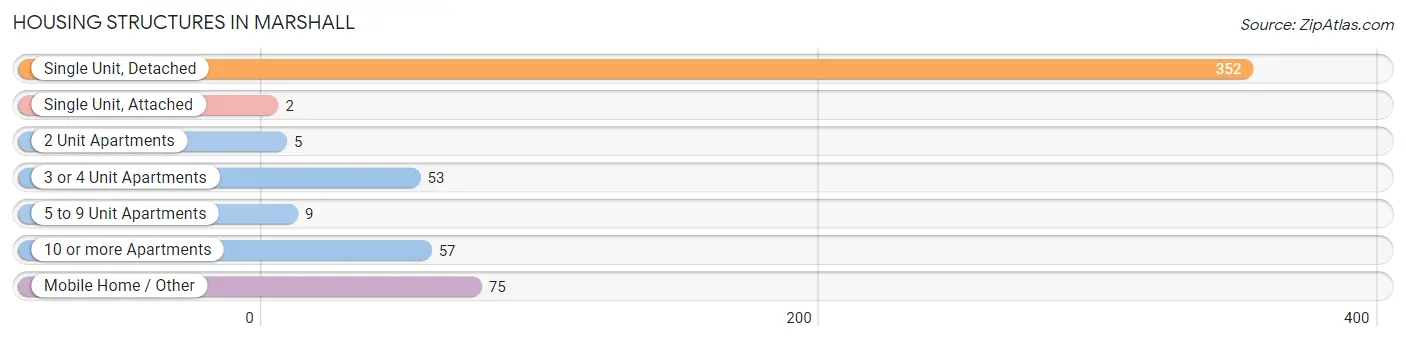
| Structure Type | # Housing Units | % Housing Units |
| Single Unit, Detached | 352 | 63.6% |
| Single Unit, Attached | 2 | 0.4% |
| 2 Unit Apartments | 5 | 0.9% |
| 3 or 4 Unit Apartments | 53 | 9.6% |
| 5 to 9 Unit Apartments | 9 | 1.6% |
| 10 or more Apartments | 57 | 10.3% |
| Mobile Home / Other | 75 | 13.6% |
| Total | 553 | 100.0% |
Housing Structures by Occupancy in Marshall
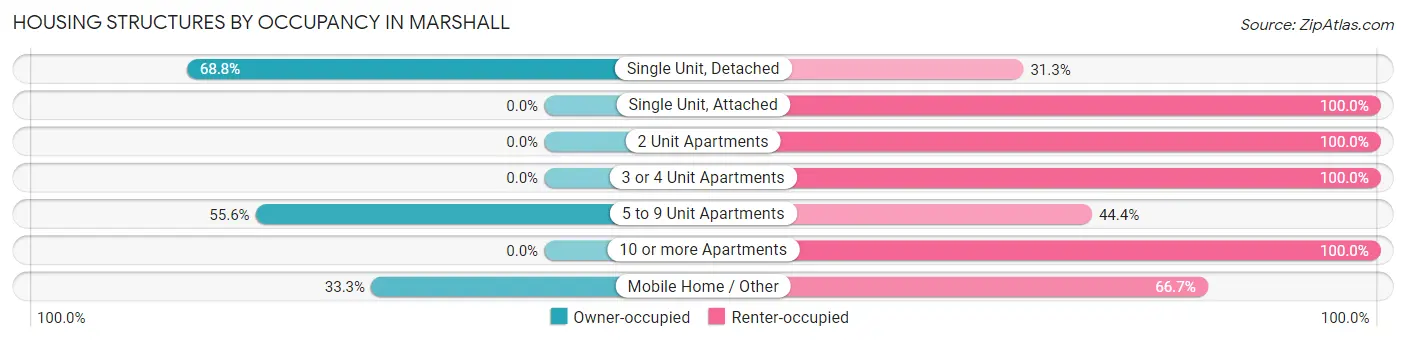
| Structure Type | Owner-occupied | Renter-occupied |
| Single Unit, Detached | 242 (68.8%) | 110 (31.2%) |
| Single Unit, Attached | 0 (0.0%) | 2 (100.0%) |
| 2 Unit Apartments | 0 (0.0%) | 5 (100.0%) |
| 3 or 4 Unit Apartments | 0 (0.0%) | 53 (100.0%) |
| 5 to 9 Unit Apartments | 5 (55.6%) | 4 (44.4%) |
| 10 or more Apartments | 0 (0.0%) | 57 (100.0%) |
| Mobile Home / Other | 25 (33.3%) | 50 (66.7%) |
| Total | 272 (49.2%) | 281 (50.8%) |
Housing Structures by Number of Rooms in Marshall
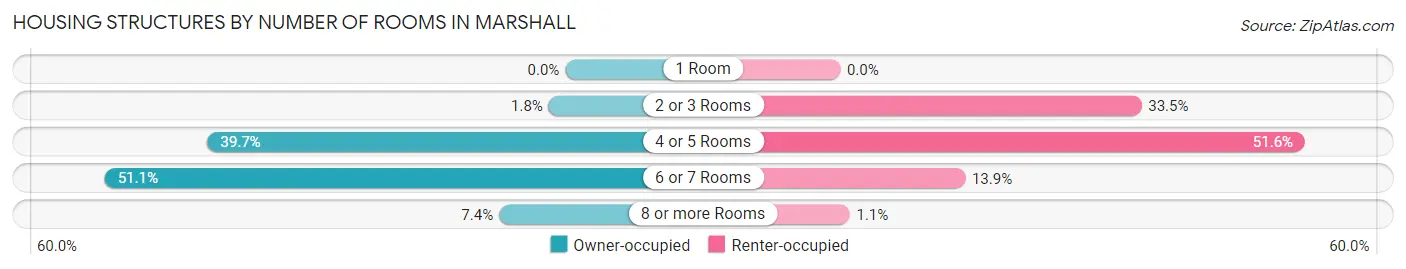
| Number of Rooms | Owner-occupied | Renter-occupied |
| 1 Room | 0 (0.0%) | 0 (0.0%) |
| 2 or 3 Rooms | 5 (1.8%) | 94 (33.5%) |
| 4 or 5 Rooms | 108 (39.7%) | 145 (51.6%) |
| 6 or 7 Rooms | 139 (51.1%) | 39 (13.9%) |
| 8 or more Rooms | 20 (7.3%) | 3 (1.1%) |
| Total | 272 (100.0%) | 281 (100.0%) |
Housing Structure by Heating Type in Marshall
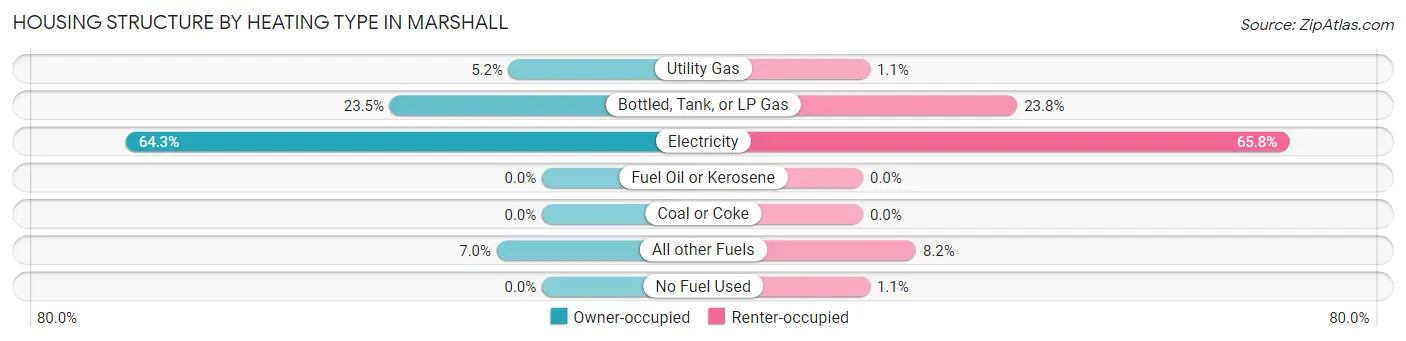
| Heating Type | Owner-occupied | Renter-occupied |
| Utility Gas | 14 (5.1%) | 3 (1.1%) |
| Bottled, Tank, or LP Gas | 64 (23.5%) | 67 (23.8%) |
| Electricity | 175 (64.3%) | 185 (65.8%) |
| Fuel Oil or Kerosene | 0 (0.0%) | 0 (0.0%) |
| Coal or Coke | 0 (0.0%) | 0 (0.0%) |
| All other Fuels | 19 (7.0%) | 23 (8.2%) |
| No Fuel Used | 0 (0.0%) | 3 (1.1%) |
| Total | 272 (100.0%) | 281 (100.0%) |
Household Vehicle Usage in Marshall
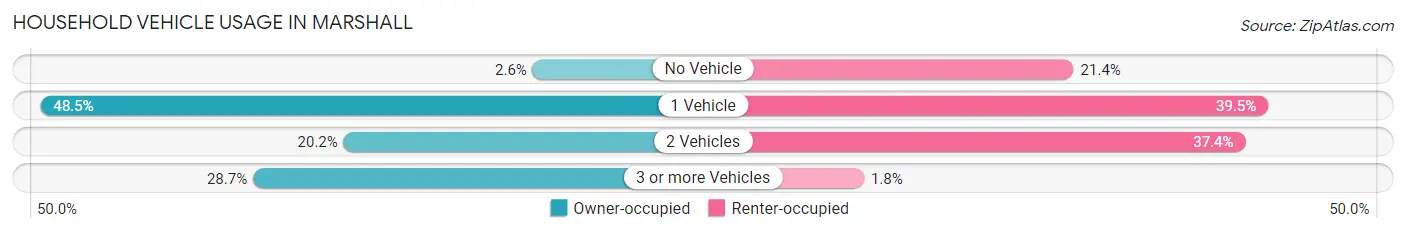
| Vehicles per Household | Owner-occupied | Renter-occupied |
| No Vehicle | 7 (2.6%) | 60 (21.3%) |
| 1 Vehicle | 132 (48.5%) | 111 (39.5%) |
| 2 Vehicles | 55 (20.2%) | 105 (37.4%) |
| 3 or more Vehicles | 78 (28.7%) | 5 (1.8%) |
| Total | 272 (100.0%) | 281 (100.0%) |
Real Estate & Mortgages in Marshall
Real Estate and Mortgage Overview in Marshall
| Characteristic | Without Mortgage | With Mortgage |
| Housing Units | 177 | 95 |
| Median Property Value | $100,500 | $97,500 |
| Median Household Income | $28,603 | $6 |
| Monthly Housing Costs | $442 | $0 |
| Real Estate Taxes | $747 | $3 |
Property Value by Mortgage Status in Marshall
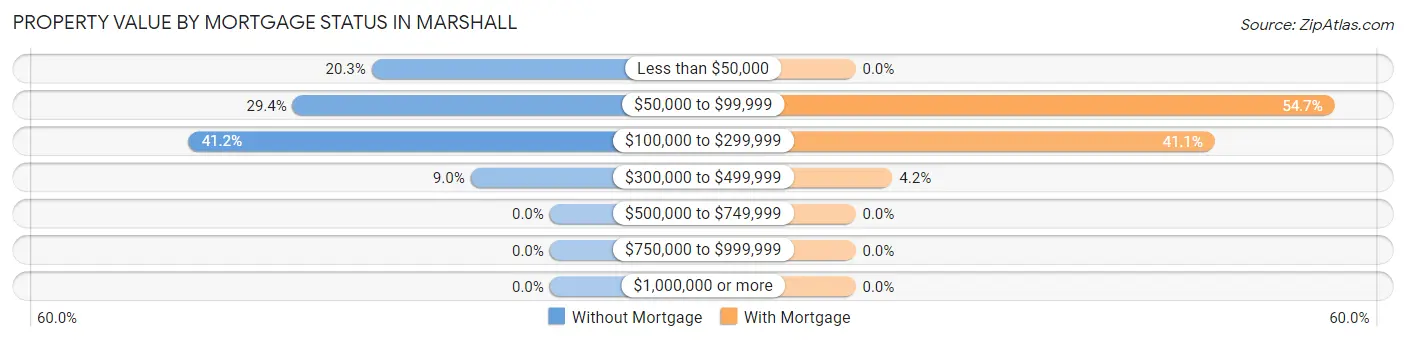
| Property Value | Without Mortgage | With Mortgage |
| Less than $50,000 | 36 (20.3%) | 0 (0.0%) |
| $50,000 to $99,999 | 52 (29.4%) | 52 (54.7%) |
| $100,000 to $299,999 | 73 (41.2%) | 39 (41.0%) |
| $300,000 to $499,999 | 16 (9.0%) | 4 (4.2%) |
| $500,000 to $749,999 | 0 (0.0%) | 0 (0.0%) |
| $750,000 to $999,999 | 0 (0.0%) | 0 (0.0%) |
| $1,000,000 or more | 0 (0.0%) | 0 (0.0%) |
| Total | 177 (100.0%) | 95 (100.0%) |
Household Income by Mortgage Status in Marshall
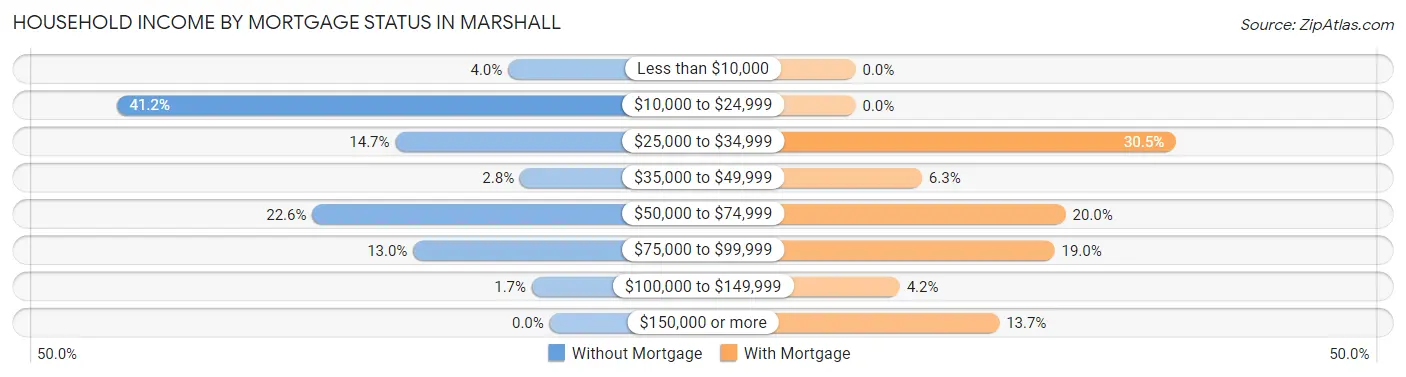
| Household Income | Without Mortgage | With Mortgage |
| Less than $10,000 | 7 (4.0%) | 0 (0.0%) |
| $10,000 to $24,999 | 73 (41.2%) | 0 (0.0%) |
| $25,000 to $34,999 | 26 (14.7%) | 29 (30.5%) |
| $35,000 to $49,999 | 5 (2.8%) | 6 (6.3%) |
| $50,000 to $74,999 | 40 (22.6%) | 19 (20.0%) |
| $75,000 to $99,999 | 23 (13.0%) | 18 (19.0%) |
| $100,000 to $149,999 | 3 (1.7%) | 4 (4.2%) |
| $150,000 or more | 0 (0.0%) | 13 (13.7%) |
| Total | 177 (100.0%) | 95 (100.0%) |
Property Value to Household Income Ratio in Marshall
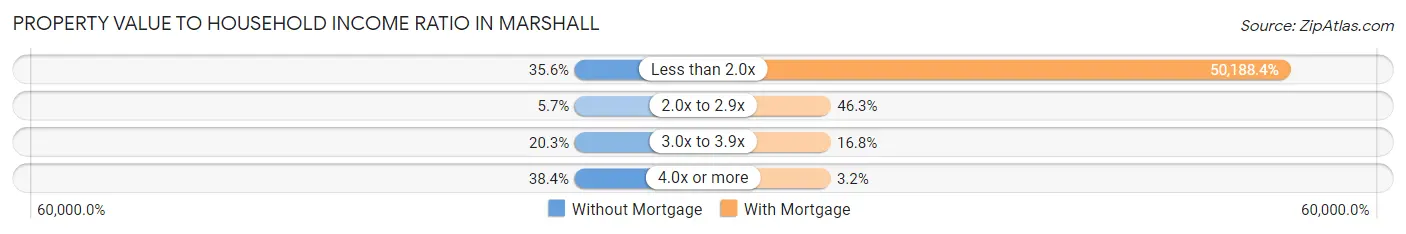
| Value-to-Income Ratio | Without Mortgage | With Mortgage |
| Less than 2.0x | 63 (35.6%) | 47,679 (50,188.4%) |
| 2.0x to 2.9x | 10 (5.7%) | 44 (46.3%) |
| 3.0x to 3.9x | 36 (20.3%) | 16 (16.8%) |
| 4.0x or more | 68 (38.4%) | 3 (3.2%) |
| Total | 177 (100.0%) | 95 (100.0%) |
Real Estate Taxes by Mortgage Status in Marshall
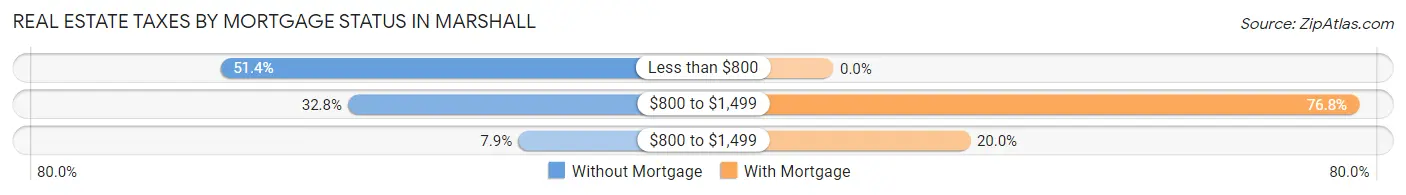
| Property Taxes | Without Mortgage | With Mortgage |
| Less than $800 | 91 (51.4%) | 0 (0.0%) |
| $800 to $1,499 | 58 (32.8%) | 73 (76.8%) |
| $800 to $1,499 | 14 (7.9%) | 19 (20.0%) |
| Total | 177 (100.0%) | 95 (100.0%) |
Health & Disability in Marshall
Health Insurance Coverage by Age in Marshall
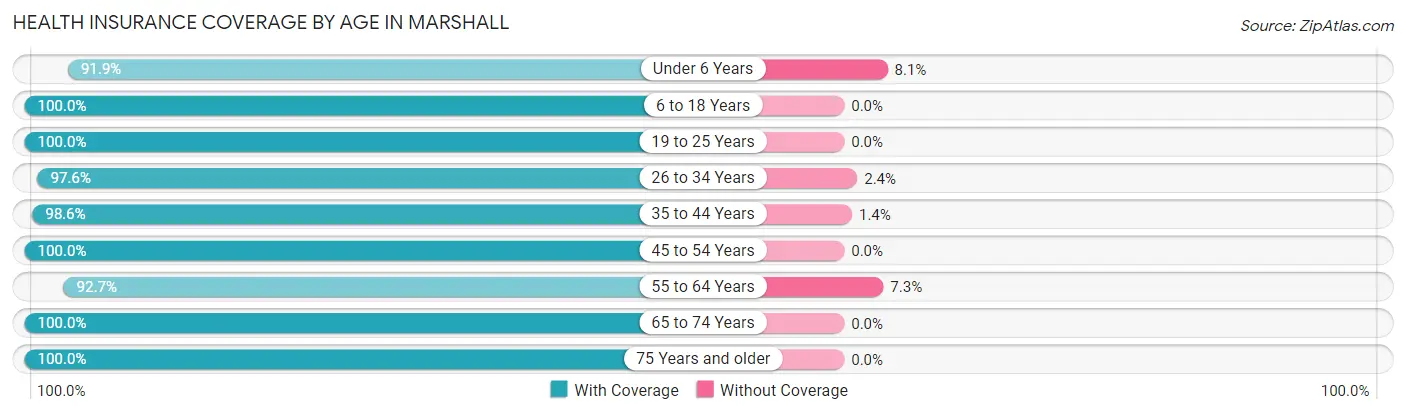
| Age Bracket | With Coverage | Without Coverage |
| Under 6 Years | 91 (91.9%) | 8 (8.1%) |
| 6 to 18 Years | 142 (100.0%) | 0 (0.0%) |
| 19 to 25 Years | 100 (100.0%) | 0 (0.0%) |
| 26 to 34 Years | 121 (97.6%) | 3 (2.4%) |
| 35 to 44 Years | 137 (98.6%) | 2 (1.4%) |
| 45 to 54 Years | 84 (100.0%) | 0 (0.0%) |
| 55 to 64 Years | 178 (92.7%) | 14 (7.3%) |
| 65 to 74 Years | 313 (100.0%) | 0 (0.0%) |
| 75 Years and older | 105 (100.0%) | 0 (0.0%) |
| Total | 1,271 (97.9%) | 27 (2.1%) |
Health Insurance Coverage by Citizenship Status in Marshall
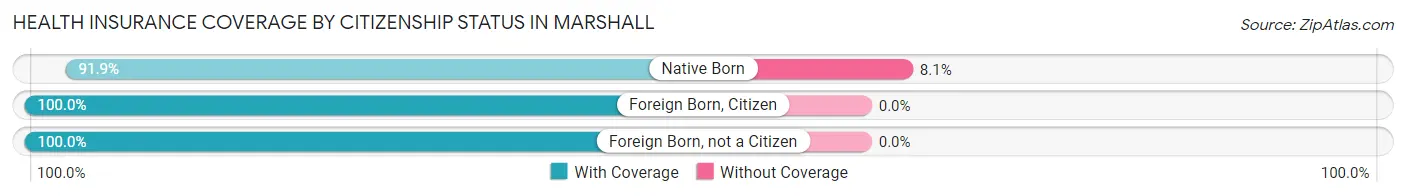
| Citizenship Status | With Coverage | Without Coverage |
| Native Born | 91 (91.9%) | 8 (8.1%) |
| Foreign Born, Citizen | 142 (100.0%) | 0 (0.0%) |
| Foreign Born, not a Citizen | 100 (100.0%) | 0 (0.0%) |
Health Insurance Coverage by Household Income in Marshall
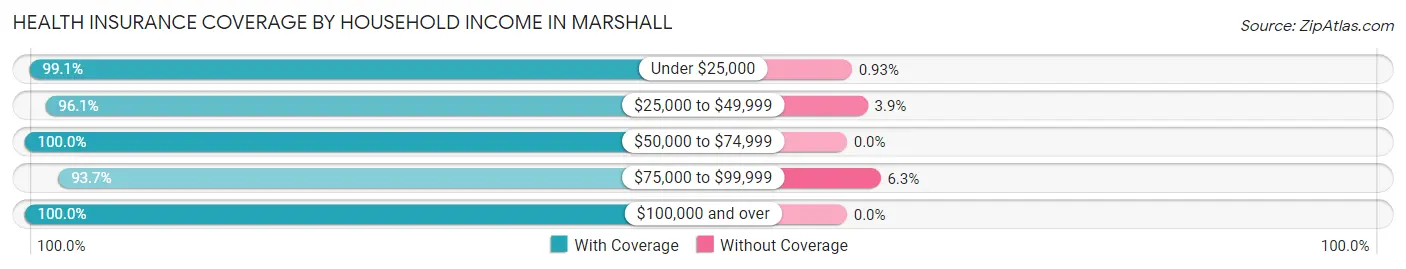
| Household Income | With Coverage | Without Coverage |
| Under $25,000 | 424 (99.1%) | 4 (0.9%) |
| $25,000 to $49,999 | 394 (96.1%) | 16 (3.9%) |
| $50,000 to $74,999 | 281 (100.0%) | 0 (0.0%) |
| $75,000 to $99,999 | 104 (93.7%) | 7 (6.3%) |
| $100,000 and over | 68 (100.0%) | 0 (0.0%) |
Public vs Private Health Insurance Coverage by Age in Marshall
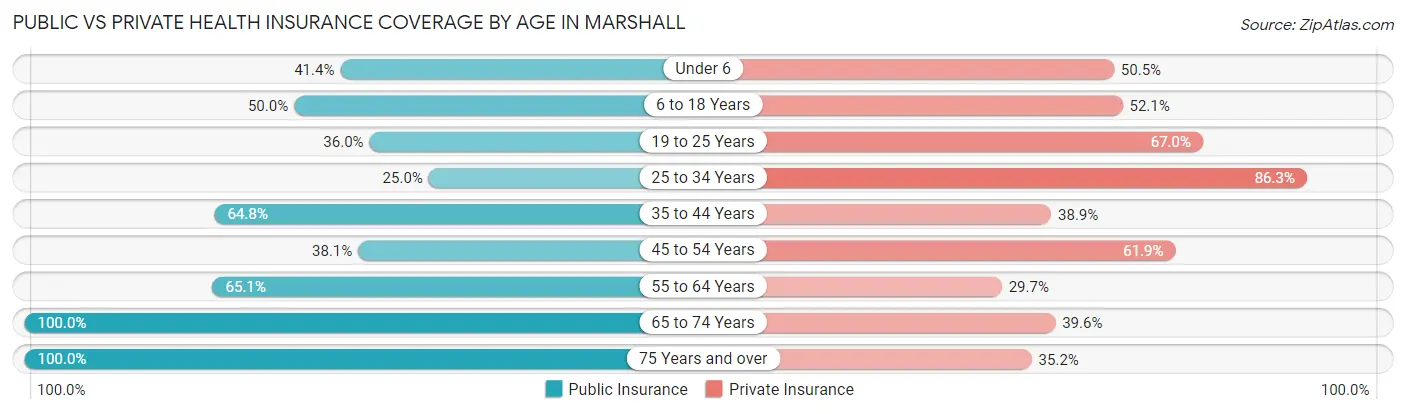
| Age Bracket | Public Insurance | Private Insurance |
| Under 6 | 41 (41.4%) | 50 (50.5%) |
| 6 to 18 Years | 71 (50.0%) | 74 (52.1%) |
| 19 to 25 Years | 36 (36.0%) | 67 (67.0%) |
| 25 to 34 Years | 31 (25.0%) | 107 (86.3%) |
| 35 to 44 Years | 90 (64.7%) | 54 (38.9%) |
| 45 to 54 Years | 32 (38.1%) | 52 (61.9%) |
| 55 to 64 Years | 125 (65.1%) | 57 (29.7%) |
| 65 to 74 Years | 313 (100.0%) | 124 (39.6%) |
| 75 Years and over | 105 (100.0%) | 37 (35.2%) |
| Total | 844 (65.0%) | 622 (47.9%) |
Disability Status by Sex by Age in Marshall
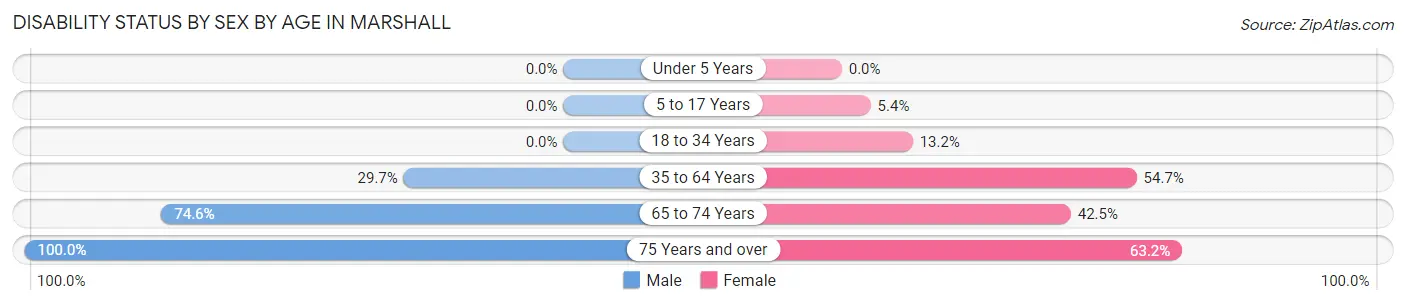
| Age Bracket | Male | Female |
| Under 5 Years | 0 (0.0%) | 0 (0.0%) |
| 5 to 17 Years | 0 (0.0%) | 3 (5.4%) |
| 18 to 34 Years | 0 (0.0%) | 20 (13.2%) |
| 35 to 64 Years | 51 (29.6%) | 133 (54.7%) |
| 65 to 74 Years | 144 (74.6%) | 51 (42.5%) |
| 75 Years and over | 10 (100.0%) | 60 (63.2%) |
Disability Class by Sex by Age in Marshall
Disability Class: Hearing Difficulty
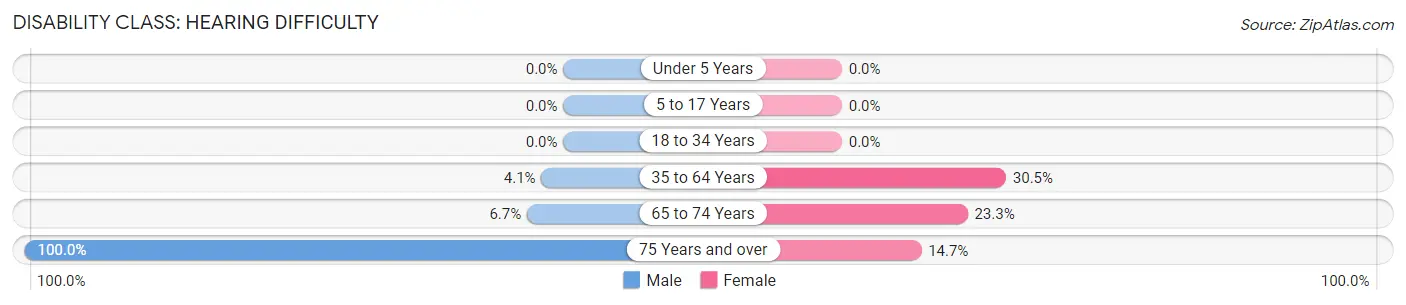
| Age Bracket | Male | Female |
| Under 5 Years | 0 (0.0%) | 0 (0.0%) |
| 5 to 17 Years | 0 (0.0%) | 0 (0.0%) |
| 18 to 34 Years | 0 (0.0%) | 0 (0.0%) |
| 35 to 64 Years | 7 (4.1%) | 74 (30.4%) |
| 65 to 74 Years | 13 (6.7%) | 28 (23.3%) |
| 75 Years and over | 10 (100.0%) | 14 (14.7%) |
Disability Class: Vision Difficulty
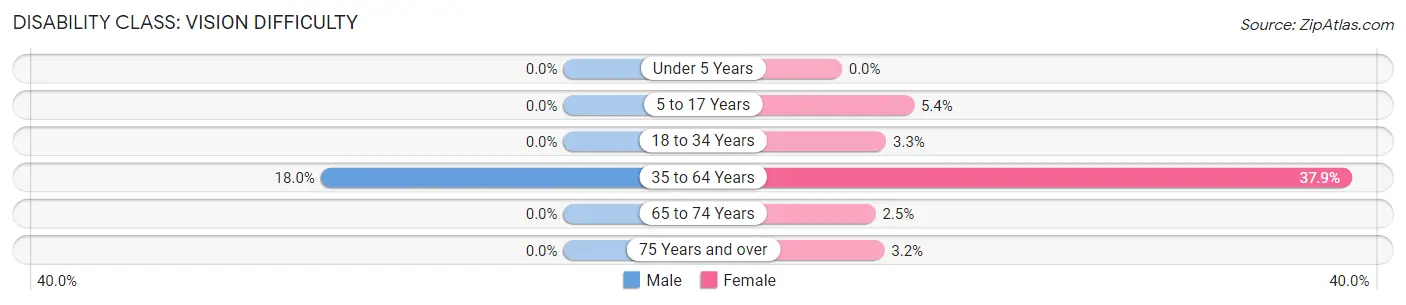
| Age Bracket | Male | Female |
| Under 5 Years | 0 (0.0%) | 0 (0.0%) |
| 5 to 17 Years | 0 (0.0%) | 3 (5.4%) |
| 18 to 34 Years | 0 (0.0%) | 5 (3.3%) |
| 35 to 64 Years | 31 (18.0%) | 92 (37.9%) |
| 65 to 74 Years | 0 (0.0%) | 3 (2.5%) |
| 75 Years and over | 0 (0.0%) | 3 (3.2%) |
Disability Class: Cognitive Difficulty
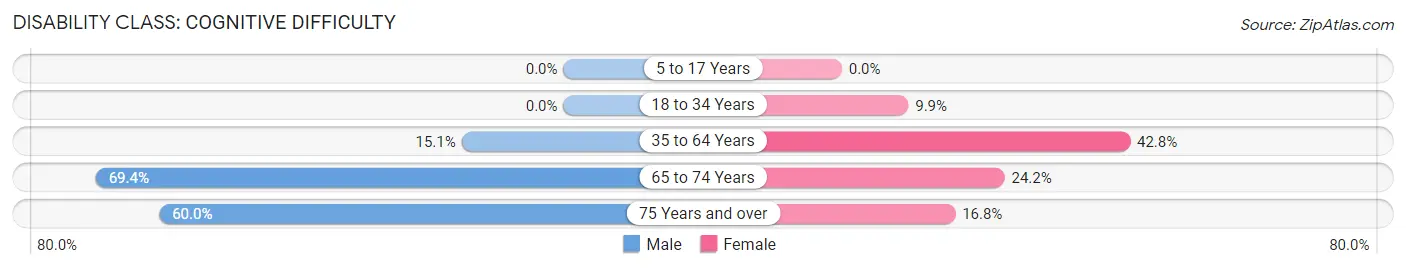
| Age Bracket | Male | Female |
| 5 to 17 Years | 0 (0.0%) | 0 (0.0%) |
| 18 to 34 Years | 0 (0.0%) | 15 (9.9%) |
| 35 to 64 Years | 26 (15.1%) | 104 (42.8%) |
| 65 to 74 Years | 134 (69.4%) | 29 (24.2%) |
| 75 Years and over | 6 (60.0%) | 16 (16.8%) |
Disability Class: Ambulatory Difficulty
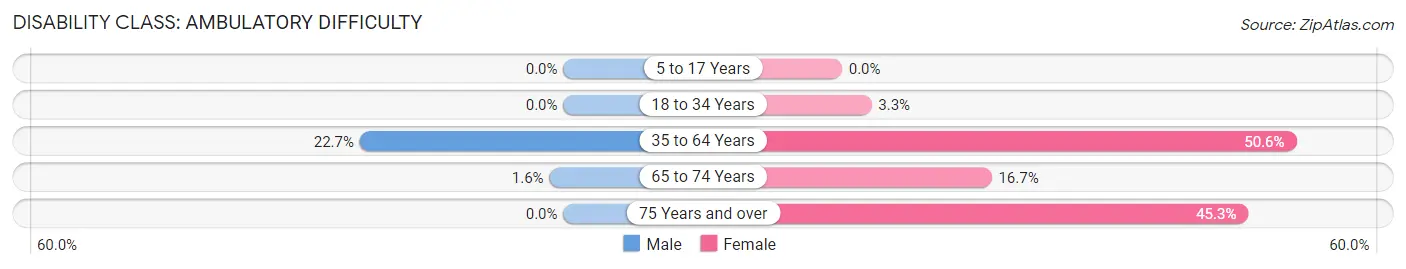
| Age Bracket | Male | Female |
| 5 to 17 Years | 0 (0.0%) | 0 (0.0%) |
| 18 to 34 Years | 0 (0.0%) | 5 (3.3%) |
| 35 to 64 Years | 39 (22.7%) | 123 (50.6%) |
| 65 to 74 Years | 3 (1.5%) | 20 (16.7%) |
| 75 Years and over | 0 (0.0%) | 43 (45.3%) |
Disability Class: Self-Care Difficulty
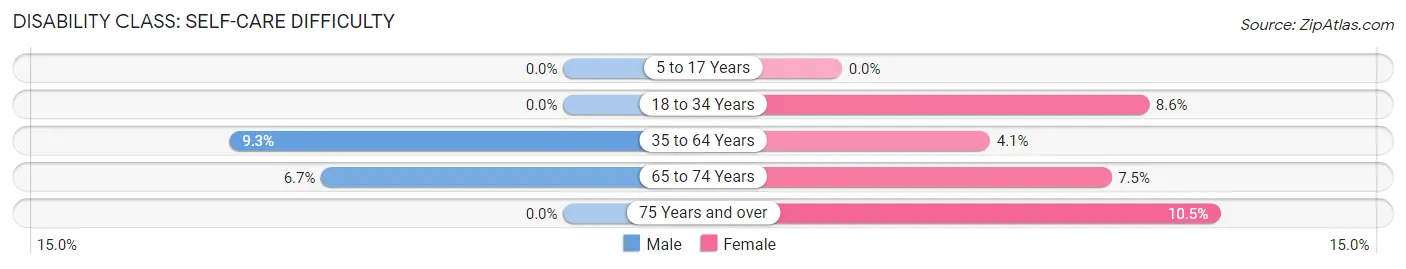
| Age Bracket | Male | Female |
| 5 to 17 Years | 0 (0.0%) | 0 (0.0%) |
| 18 to 34 Years | 0 (0.0%) | 13 (8.6%) |
| 35 to 64 Years | 16 (9.3%) | 10 (4.1%) |
| 65 to 74 Years | 13 (6.7%) | 9 (7.5%) |
| 75 Years and over | 0 (0.0%) | 10 (10.5%) |
Technology Access in Marshall
Computing Device Access in Marshall
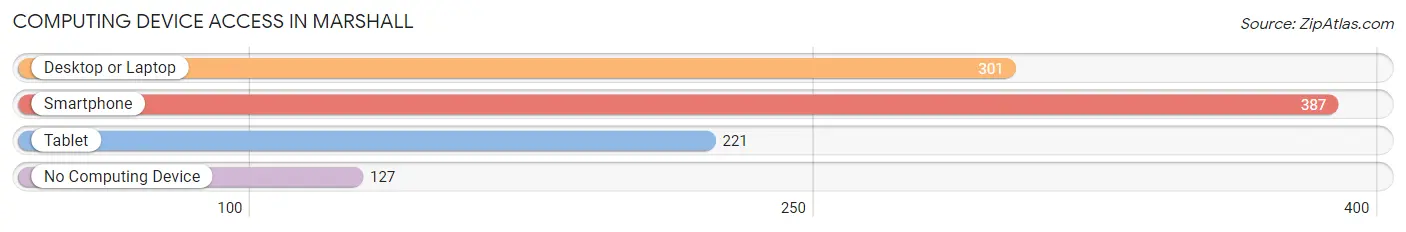
| Device Type | # Households | % Households |
| Desktop or Laptop | 301 | 54.4% |
| Smartphone | 387 | 70.0% |
| Tablet | 221 | 40.0% |
| No Computing Device | 127 | 23.0% |
| Total | 553 | 100.0% |
Internet Access in Marshall
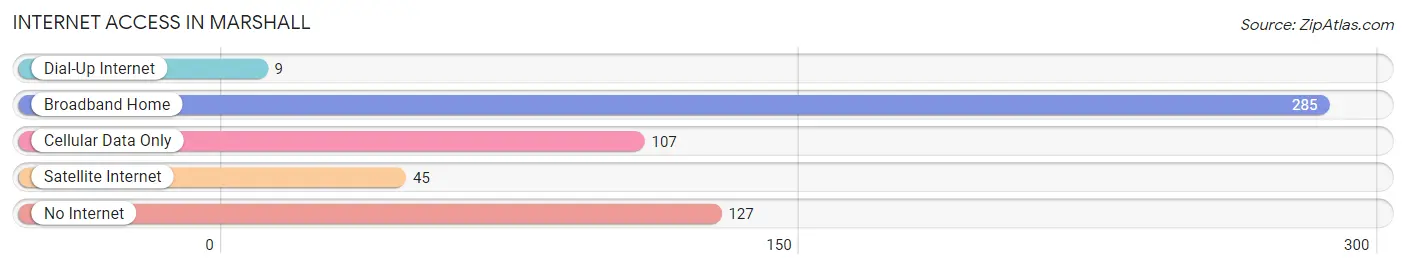
| Internet Type | # Households | % Households |
| Dial-Up Internet | 9 | 1.6% |
| Broadband Home | 285 | 51.5% |
| Cellular Data Only | 107 | 19.4% |
| Satellite Internet | 45 | 8.1% |
| No Internet | 127 | 23.0% |
| Total | 553 | 100.0% |
Marshall Summary
Marshall, Arkansas is a small city located in Searcy County in the north-central part of the state. It is situated on the banks of the White River, and is the county seat of Searcy County. The city has a population of 1,845 people, according to the 2010 census.
Marshall is located in the Ozark Mountains, and is surrounded by rolling hills and forests. The city is situated at the intersection of two major highways, US Highway 65 and Arkansas Highway 27. The city is also located near the Buffalo National River, which is a popular destination for outdoor recreation.
The economy of Marshall is largely based on agriculture and tourism. The city is home to several farms, and the surrounding area is known for its production of cotton, soybeans, and other crops. The city is also home to several tourist attractions, including the Searcy County Museum, the Searcy County Courthouse, and the Searcy County Historical Society.
The demographics of Marshall are largely white, with a small African American population. The median household income is $30,845, and the median age is 41. The city has a high rate of poverty, with nearly one-third of the population living below the poverty line.
Marshall is served by the Marshall Public School District, which includes two elementary schools, one middle school, and one high school. The city is also home to several churches, including the First United Methodist Church, the First Baptist Church, and the Church of Christ.
Marshall is a small city with a rich history and a vibrant economy. The city is home to several tourist attractions, and the surrounding area is known for its agricultural production. The city has a diverse population, and the median household income is slightly below the national average. Marshall is a great place to live and work, and is a great place to visit.
Common Questions
What is Per Capita Income in Marshall?
Per Capita income in Marshall is $17,299.
What is the Median Family Income in Marshall?
Median Family Income in Marshall is $49,250.
What is the Median Household income in Marshall?
Median Household Income in Marshall is $28,290.
What is Income or Wage Gap in Marshall?
Income or Wage Gap in Marshall is 10.4%.
Women in Marshall earn 89.6 cents for every dollar earned by a man.
What is Family Income Deficit in Marshall?
Family Income Deficit in Marshall is $8,240.
Families that are below poverty line in Marshall earn $8,240 less on average than the poverty threshold level.
What is Inequality or Gini Index in Marshall?
Inequality or Gini Index in Marshall is 0.44.
What is the Total Population of Marshall?
Total Population of Marshall is 1,384.
What is the Total Male Population of Marshall?
Total Male Population of Marshall is 644.
What is the Total Female Population of Marshall?
Total Female Population of Marshall is 740.
What is the Ratio of Males per 100 Females in Marshall?
There are 87.03 Males per 100 Females in Marshall.
What is the Ratio of Females per 100 Males in Marshall?
There are 114.91 Females per 100 Males in Marshall.
What is the Median Population Age in Marshall?
Median Population Age in Marshall is 52.3 Years.
What is the Average Family Size in Marshall
Average Family Size in Marshall is 3.5 People.
What is the Average Household Size in Marshall
Average Household Size in Marshall is 2.4 People.
How Large is the Labor Force in Marshall?
There are 426 People in the Labor Forcein in Marshall.
What is the Percentage of People in the Labor Force in Marshall?
36.4% of People are in the Labor Force in Marshall.
What is the Unemployment Rate in Marshall?
Unemployment Rate in Marshall is 3.3%.