Star City, AR Map & Demographics
Star City Map
Star City Overview
$26,265
PER CAPITA INCOME
$66,607
AVG FAMILY INCOME
$58,929
AVG HOUSEHOLD INCOME
2.5%
WAGE / INCOME GAP [ % ]
97.5¢/ $1
WAGE / INCOME GAP [ $ ]
$11,171
FAMILY INCOME DEFICIT
0.45
INEQUALITY / GINI INDEX
2,299
TOTAL POPULATION
919
MALE POPULATION
1,380
FEMALE POPULATION
66.59
MALES / 100 FEMALES
150.16
FEMALES / 100 MALES
36.3
MEDIAN AGE
3.5
AVG FAMILY SIZE
2.9
AVG HOUSEHOLD SIZE
1,067
LABOR FORCE [ PEOPLE ]
60.6%
PERCENT IN LABOR FORCE
2.3%
UNEMPLOYMENT RATE
Star City Zip Codes
Star City Area Codes
Income in Star City
Income Overview in Star City
Per Capita Income in Star City is $26,265, while median incomes of families and households are $66,607 and $58,929 respectively.
| Characteristic | Number | Measure |
| Per Capita Income | 2,299 | $26,265 |
| Median Family Income | 552 | $66,607 |
| Mean Family Income | 552 | $91,061 |
| Median Household Income | 762 | $58,929 |
| Mean Household Income | 762 | $78,267 |
| Income Deficit | 552 | $11,171 |
| Wage / Income Gap (%) | 2,299 | 2.47% |
| Wage / Income Gap ($) | 2,299 | 97.53¢ per $1 |
| Gini / Inequality Index | 2,299 | 0.45 |
Earnings by Sex in Star City
Average Earnings in Star City are $40,086, $40,500 for men and $39,500 for women, a difference of 2.5%.
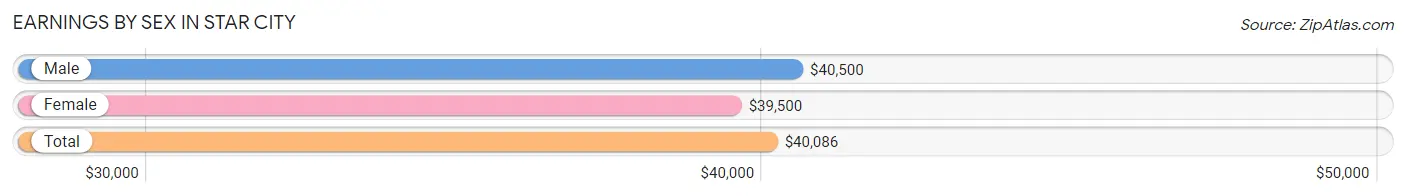
| Sex | Number | Average Earnings |
| Male | 394 (36.9%) | $40,500 |
| Female | 674 (63.1%) | $39,500 |
| Total | 1,068 (100.0%) | $40,086 |
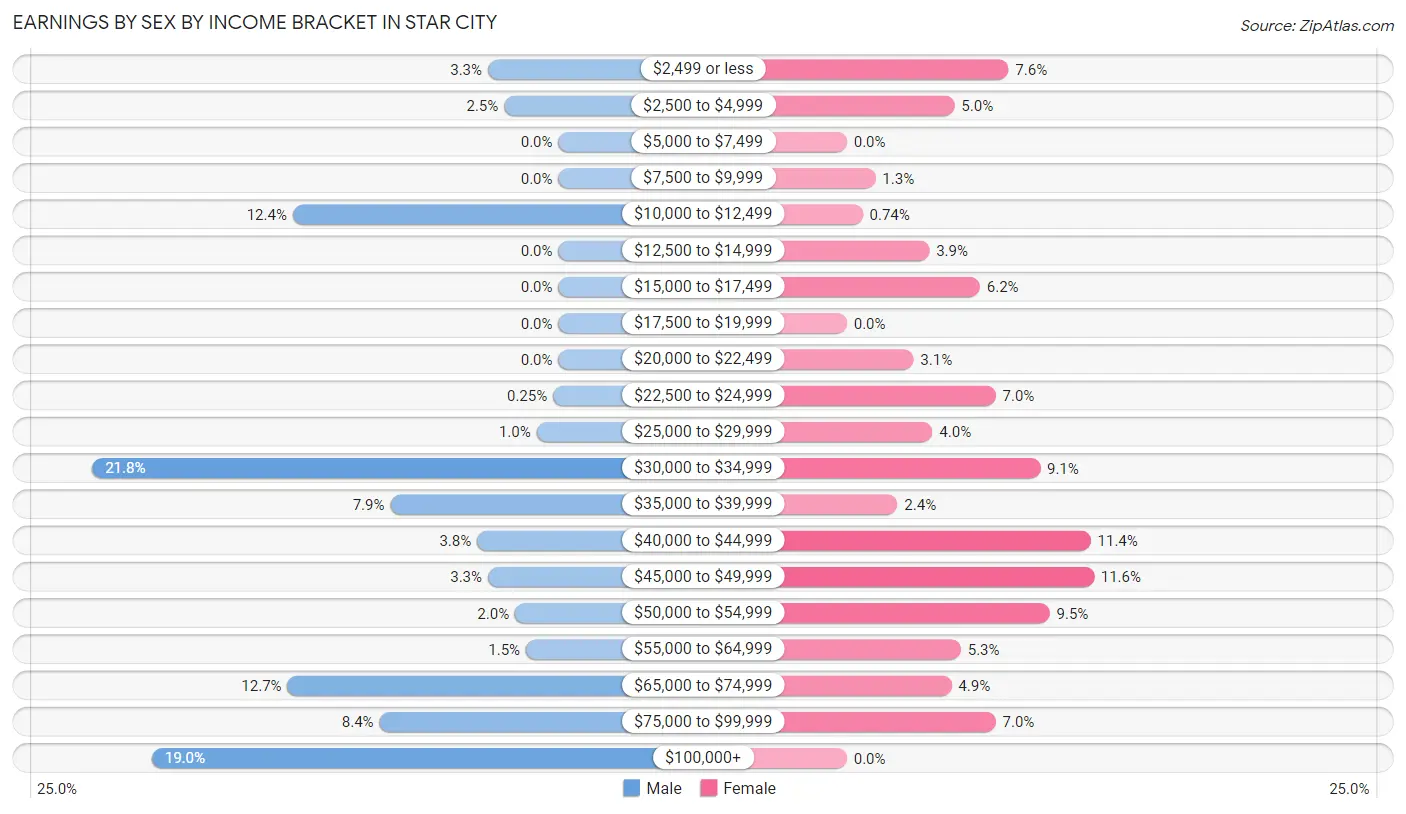
Earnings by Sex by Income Bracket in Star City
The most common earnings brackets in Star City are $30,000 to $34,999 for men (86 | 21.8%) and $45,000 to $49,999 for women (78 | 11.6%).
| Income | Male | Female |
| $2,499 or less | 13 (3.3%) | 51 (7.6%) |
| $2,500 to $4,999 | 10 (2.5%) | 34 (5.0%) |
| $5,000 to $7,499 | 0 (0.0%) | 0 (0.0%) |
| $7,500 to $9,999 | 0 (0.0%) | 9 (1.3%) |
| $10,000 to $12,499 | 49 (12.4%) | 5 (0.7%) |
| $12,500 to $14,999 | 0 (0.0%) | 26 (3.9%) |
| $15,000 to $17,499 | 0 (0.0%) | 42 (6.2%) |
| $17,500 to $19,999 | 0 (0.0%) | 0 (0.0%) |
| $20,000 to $22,499 | 0 (0.0%) | 21 (3.1%) |
| $22,500 to $24,999 | 1 (0.3%) | 47 (7.0%) |
| $25,000 to $29,999 | 4 (1.0%) | 27 (4.0%) |
| $30,000 to $34,999 | 86 (21.8%) | 61 (9.0%) |
| $35,000 to $39,999 | 31 (7.9%) | 16 (2.4%) |
| $40,000 to $44,999 | 15 (3.8%) | 77 (11.4%) |
| $45,000 to $49,999 | 13 (3.3%) | 78 (11.6%) |
| $50,000 to $54,999 | 8 (2.0%) | 64 (9.5%) |
| $55,000 to $64,999 | 6 (1.5%) | 36 (5.3%) |
| $65,000 to $74,999 | 50 (12.7%) | 33 (4.9%) |
| $75,000 to $99,999 | 33 (8.4%) | 47 (7.0%) |
| $100,000+ | 75 (19.0%) | 0 (0.0%) |
| Total | 394 (100.0%) | 674 (100.0%) |
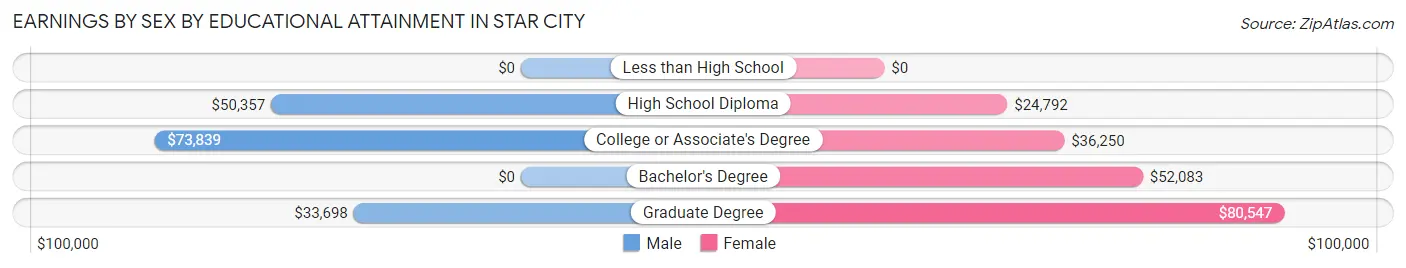
Earnings by Sex by Educational Attainment in Star City
Average earnings in Star City are $71,250 for men and $40,357 for women, a difference of 43.4%. Men with an educational attainment of college or associate's degree enjoy the highest average annual earnings of $73,839, while those with graduate degree education earn the least with $33,698. Women with an educational attainment of graduate degree earn the most with the average annual earnings of $80,547, while those with high school diploma education have the smallest earnings of $24,792.
| Educational Attainment | Male Income | Female Income |
| Less than High School | - | - |
| High School Diploma | $50,357 | $24,792 |
| College or Associate's Degree | $73,839 | $36,250 |
| Bachelor's Degree | - | - |
| Graduate Degree | $33,698 | $80,547 |
| Total | $71,250 | $40,357 |
Family Income in Star City
Family Income Brackets in Star City
According to the Star City family income data, there are 106 families falling into the $15,000 to $24,999 income range, which is the most common income bracket and makes up 19.2% of all families. Conversely, the less than $10,000 income bracket is the least frequent group with only 1 families (0.2%) belonging to this category.
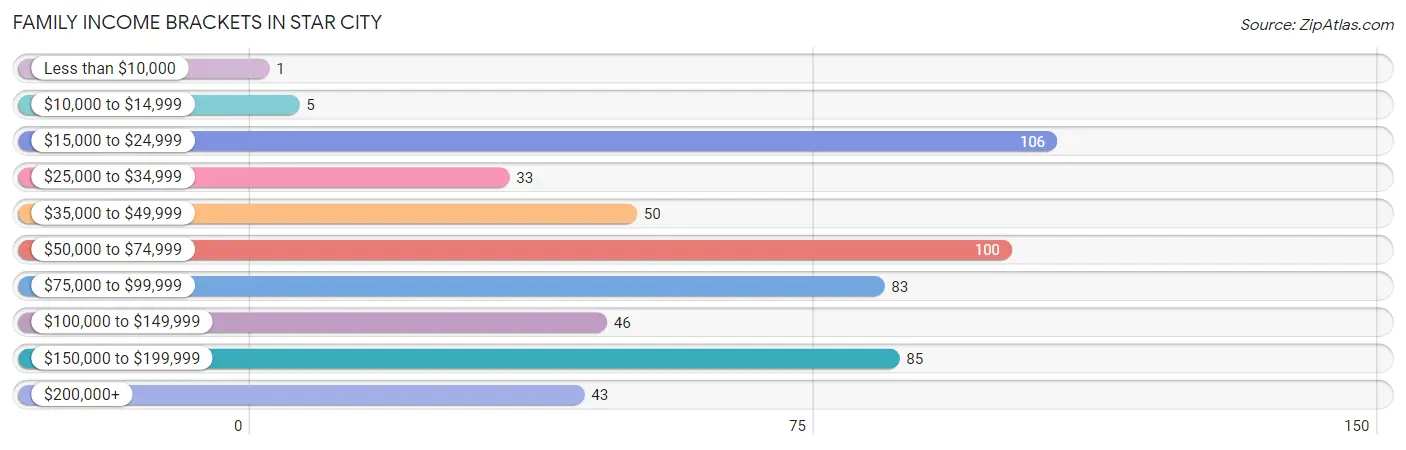
| Income Bracket | # Families | % Families |
| Less than $10,000 | 1 | 0.2% |
| $10,000 to $14,999 | 5 | 0.9% |
| $15,000 to $24,999 | 106 | 19.2% |
| $25,000 to $34,999 | 33 | 6.0% |
| $35,000 to $49,999 | 50 | 9.1% |
| $50,000 to $74,999 | 100 | 18.1% |
| $75,000 to $99,999 | 83 | 15.0% |
| $100,000 to $149,999 | 46 | 8.3% |
| $150,000 to $199,999 | 85 | 15.4% |
| $200,000+ | 43 | 7.8% |
Family Income by Famaliy Size in Star City
3-person families (136 | 24.6%) account for the highest median family income in Star City with $99,018 per family, while 3-person families (136 | 24.6%) have the highest median income of $33,006 per family member.
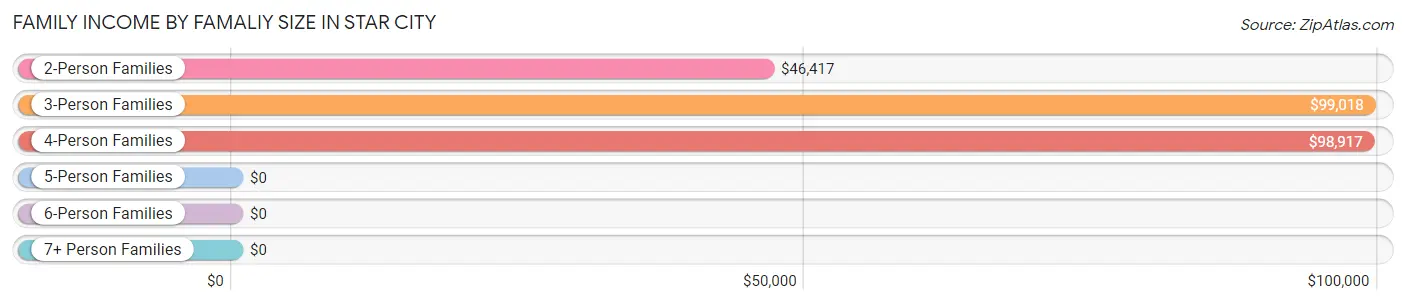
| Income Bracket | # Families | Median Income |
| 2-Person Families | 217 (39.3%) | $46,417 |
| 3-Person Families | 136 (24.6%) | $99,018 |
| 4-Person Families | 125 (22.6%) | $98,917 |
| 5-Person Families | 42 (7.6%) | $0 |
| 6-Person Families | 0 (0.0%) | $0 |
| 7+ Person Families | 32 (5.8%) | $0 |
| Total | 552 (100.0%) | $66,607 |
Family Income by Number of Earners in Star City
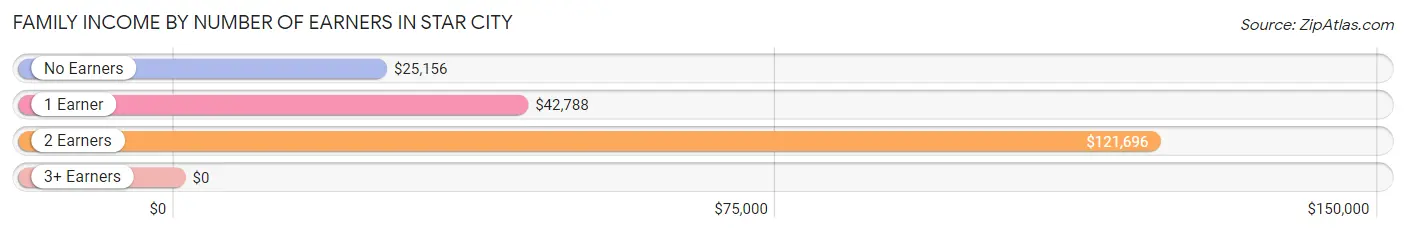
| Number of Earners | # Families | Median Income |
| No Earners | 133 (24.1%) | $25,156 |
| 1 Earner | 119 (21.6%) | $42,788 |
| 2 Earners | 249 (45.1%) | $121,696 |
| 3+ Earners | 51 (9.2%) | $0 |
| Total | 552 (100.0%) | $66,607 |
Household Income in Star City
Household Income Brackets in Star City
With 133 households falling in the category, the $50,000 to $74,999 income range is the most frequent in Star City, accounting for 17.4% of all households. In contrast, only 20 households (2.6%) fall into the less than $10,000 income bracket, making it the least populous group.
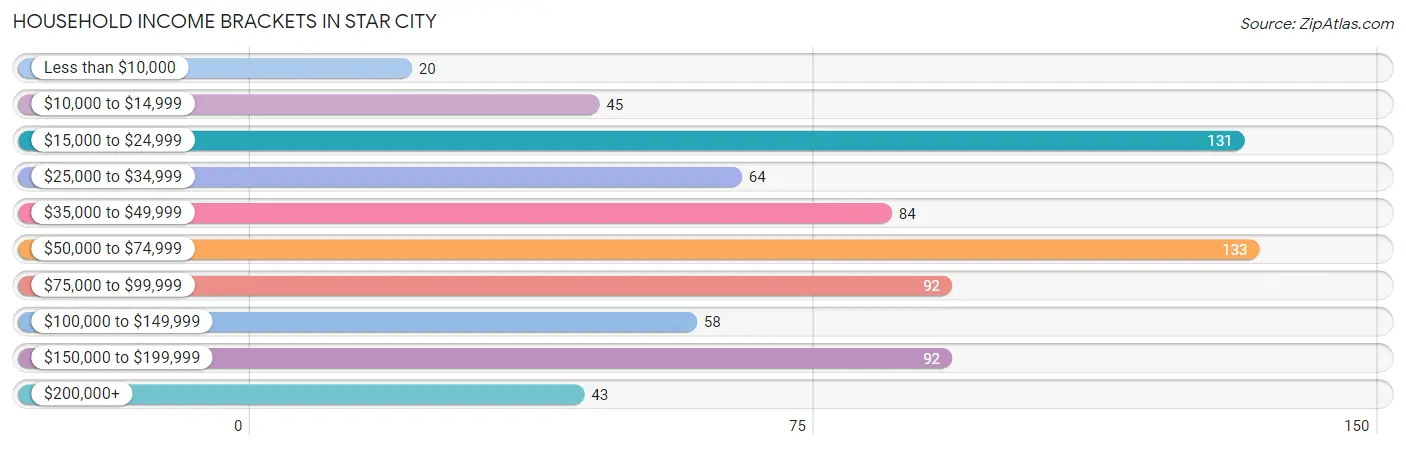
| Income Bracket | # Households | % Households |
| Less than $10,000 | 20 | 2.6% |
| $10,000 to $14,999 | 45 | 5.9% |
| $15,000 to $24,999 | 131 | 17.2% |
| $25,000 to $34,999 | 64 | 8.4% |
| $35,000 to $49,999 | 84 | 11.0% |
| $50,000 to $74,999 | 133 | 17.5% |
| $75,000 to $99,999 | 92 | 12.1% |
| $100,000 to $149,999 | 58 | 7.6% |
| $150,000 to $199,999 | 92 | 12.1% |
| $200,000+ | 43 | 5.6% |
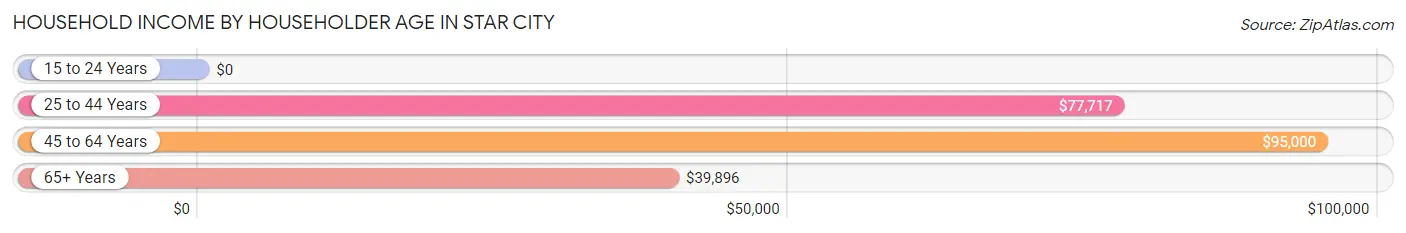
Household Income by Householder Age in Star City
The median household income in Star City is $58,929, with the highest median household income of $95,000 found in the 45 to 64 years age bracket for the primary householder. A total of 210 households (27.6%) fall into this category. Meanwhile, the 15 to 24 years age bracket for the primary householder has the lowest median household income of $0, with 27 households (3.5%) in this group.
| Income Bracket | # Households | Median Income |
| 15 to 24 Years | 27 (3.5%) | $0 |
| 25 to 44 Years | 278 (36.5%) | $77,717 |
| 45 to 64 Years | 210 (27.6%) | $95,000 |
| 65+ Years | 247 (32.4%) | $39,896 |
| Total | 762 (100.0%) | $58,929 |
Poverty in Star City
Income Below Poverty by Sex and Age in Star City
With 12.7% poverty level for males and 20.0% for females among the residents of Star City, under 5 year old males and 12 to 14 year old females are the most vulnerable to poverty, with 19 males (32.2%) and 30 females (50.8%) in their respective age groups living below the poverty level.
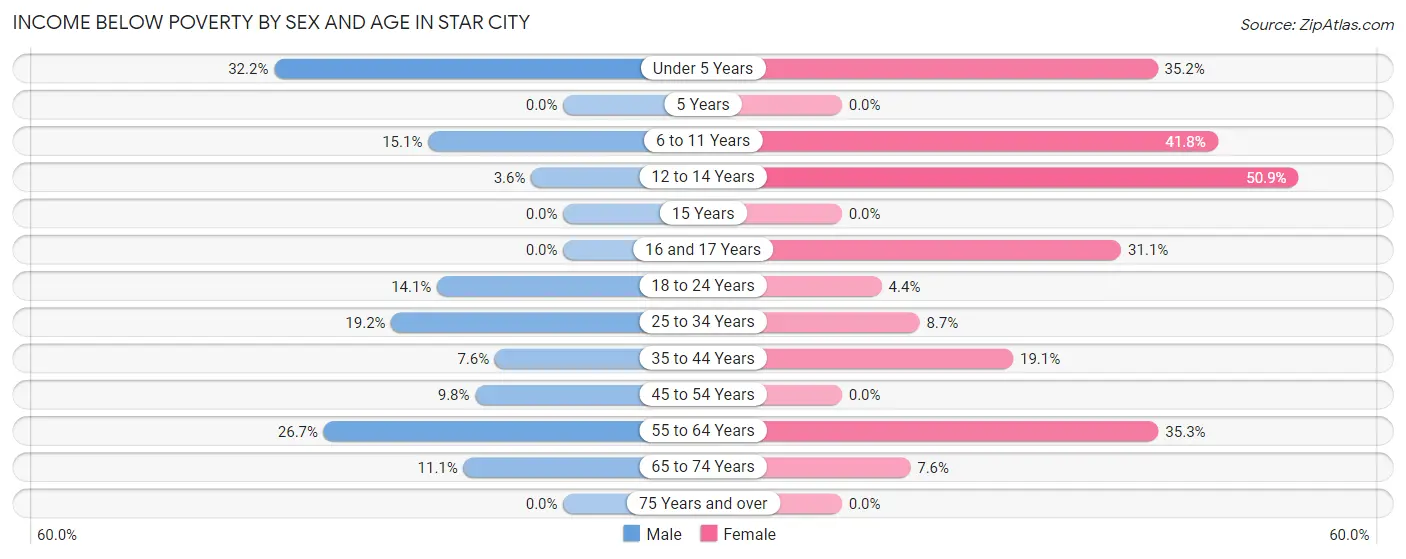
| Age Bracket | Male | Female |
| Under 5 Years | 19 (32.2%) | 51 (35.2%) |
| 5 Years | 0 (0.0%) | 0 (0.0%) |
| 6 to 11 Years | 14 (15.0%) | 41 (41.8%) |
| 12 to 14 Years | 2 (3.6%) | 30 (50.8%) |
| 15 Years | 0 (0.0%) | 0 (0.0%) |
| 16 and 17 Years | 0 (0.0%) | 14 (31.1%) |
| 18 to 24 Years | 17 (14.1%) | 4 (4.4%) |
| 25 to 34 Years | 18 (19.2%) | 16 (8.6%) |
| 35 to 44 Years | 7 (7.6%) | 37 (19.1%) |
| 45 to 54 Years | 10 (9.8%) | 0 (0.0%) |
| 55 to 64 Years | 12 (26.7%) | 61 (35.3%) |
| 65 to 74 Years | 10 (11.1%) | 9 (7.6%) |
| 75 Years and over | 0 (0.0%) | 0 (0.0%) |
| Total | 109 (12.7%) | 263 (20.0%) |
Income Above Poverty by Sex and Age in Star City
According to the poverty statistics in Star City, males aged 5 years and females aged 5 years are the age groups that are most secure financially, with 100.0% of males and 100.0% of females in these age groups living above the poverty line.
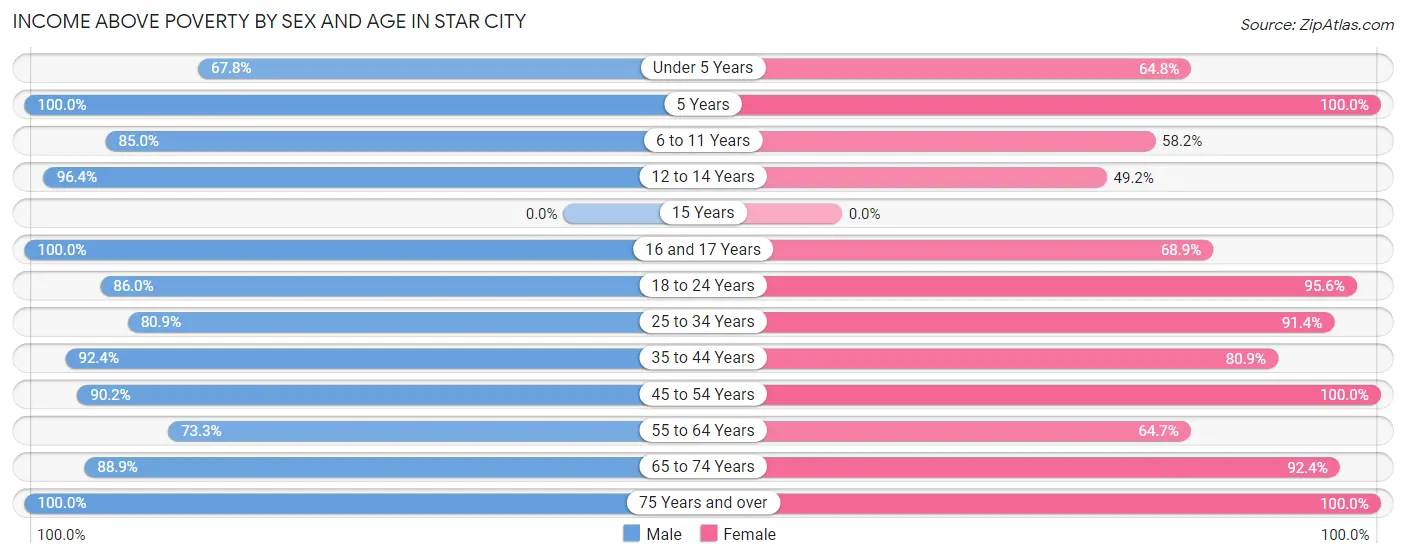
| Age Bracket | Male | Female |
| Under 5 Years | 40 (67.8%) | 94 (64.8%) |
| 5 Years | 2 (100.0%) | 26 (100.0%) |
| 6 to 11 Years | 79 (85.0%) | 57 (58.2%) |
| 12 to 14 Years | 54 (96.4%) | 29 (49.1%) |
| 15 Years | 0 (0.0%) | 0 (0.0%) |
| 16 and 17 Years | 45 (100.0%) | 31 (68.9%) |
| 18 to 24 Years | 104 (86.0%) | 86 (95.6%) |
| 25 to 34 Years | 76 (80.8%) | 169 (91.3%) |
| 35 to 44 Years | 85 (92.4%) | 157 (80.9%) |
| 45 to 54 Years | 92 (90.2%) | 107 (100.0%) |
| 55 to 64 Years | 33 (73.3%) | 112 (64.7%) |
| 65 to 74 Years | 80 (88.9%) | 109 (92.4%) |
| 75 Years and over | 62 (100.0%) | 78 (100.0%) |
| Total | 752 (87.3%) | 1,055 (80.0%) |
Income Below Poverty Among Married-Couple Families in Star City
The poverty statistics for married-couple families in Star City show that 6.1% or 22 of the total 362 families live below the poverty line. Families with 3 or 4 children have the highest poverty rate of 57.1%, comprising of 8 families. On the other hand, families with no children have the lowest poverty rate of 4.0%, which includes 5 families.
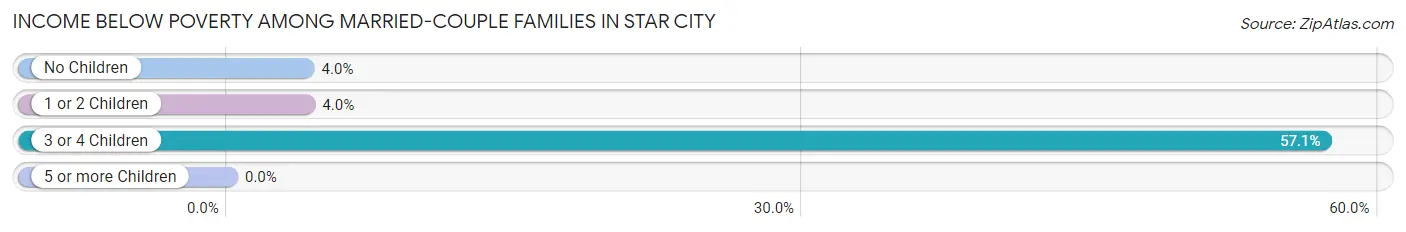
| Children | Above Poverty | Below Poverty |
| No Children | 120 (96.0%) | 5 (4.0%) |
| 1 or 2 Children | 214 (96.0%) | 9 (4.0%) |
| 3 or 4 Children | 6 (42.9%) | 8 (57.1%) |
| 5 or more Children | 0 (0.0%) | 0 (0.0%) |
| Total | 340 (93.9%) | 22 (6.1%) |
Income Below Poverty Among Single-Parent Households in Star City
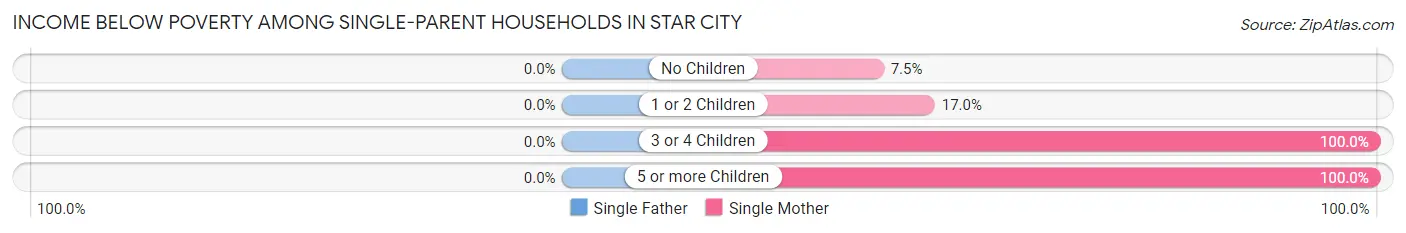
| Children | Single Father | Single Mother |
| No Children | 0 (0.0%) | 5 (7.5%) |
| 1 or 2 Children | 0 (0.0%) | 9 (17.0%) |
| 3 or 4 Children | 0 (0.0%) | 9 (100.0%) |
| 5 or more Children | 0 (0.0%) | 28 (100.0%) |
| Total | 0 (0.0%) | 51 (32.5%) |
Income Below Poverty Among Married-Couple vs Single-Parent Households in Star City
The poverty data for Star City shows that 22 of the married-couple family households (6.1%) and 51 of the single-parent households (26.8%) are living below the poverty level. Within the married-couple family households, those with 3 or 4 children have the highest poverty rate, with 8 households (57.1%) falling below the poverty line. Among the single-parent households, those with 3 or 4 children have the highest poverty rate, with 9 household (100.0%) living below poverty.
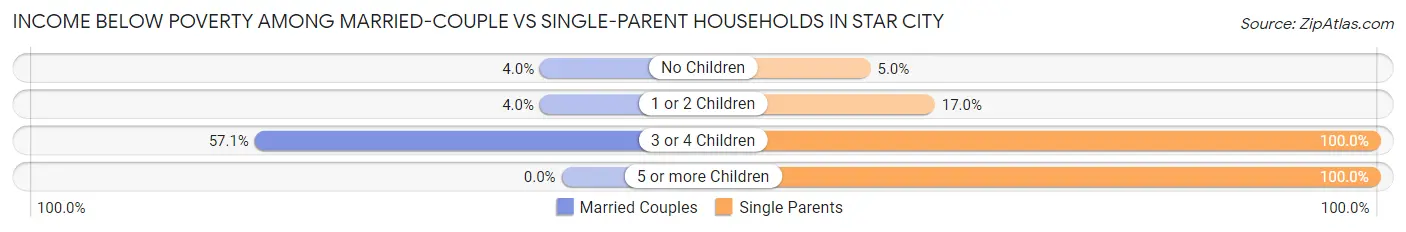
| Children | Married-Couple Families | Single-Parent Households |
| No Children | 5 (4.0%) | 5 (5.0%) |
| 1 or 2 Children | 9 (4.0%) | 9 (17.0%) |
| 3 or 4 Children | 8 (57.1%) | 9 (100.0%) |
| 5 or more Children | 0 (0.0%) | 28 (100.0%) |
| Total | 22 (6.1%) | 51 (26.8%) |
Race in Star City
The most populous races in Star City are White / Caucasian (1,775 | 77.2%), Black / African American (403 | 17.5%), and Two or more Races (75 | 3.3%).
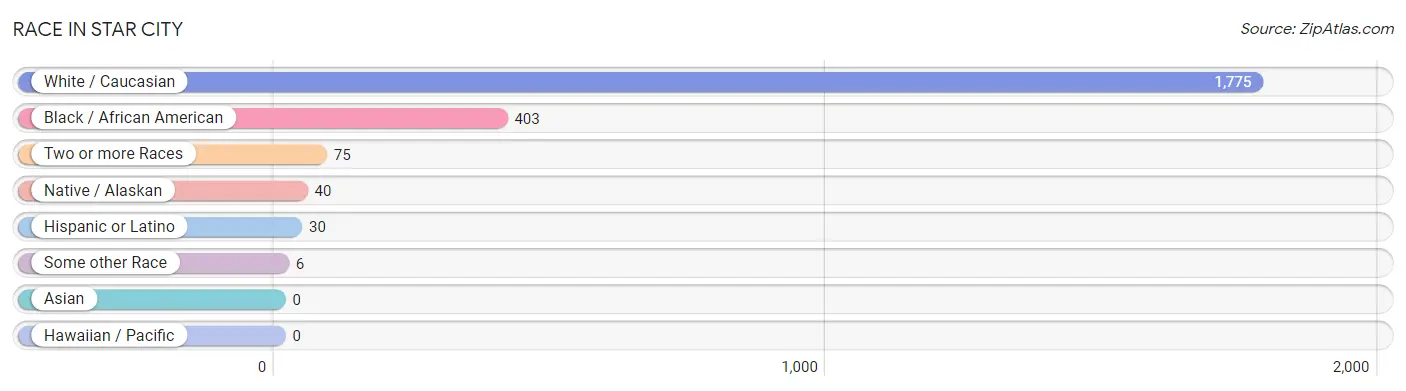
| Race | # Population | % Population |
| Asian | 0 | 0.0% |
| Black / African American | 403 | 17.5% |
| Hawaiian / Pacific | 0 | 0.0% |
| Hispanic or Latino | 30 | 1.3% |
| Native / Alaskan | 40 | 1.7% |
| White / Caucasian | 1,775 | 77.2% |
| Two or more Races | 75 | 3.3% |
| Some other Race | 6 | 0.3% |
| Total | 2,299 | 100.0% |
Ancestry in Star City
The most populous ancestries reported in Star City are American (307 | 13.4%), English (183 | 8.0%), German (152 | 6.6%), Irish (145 | 6.3%), and African (118 | 5.1%), together accounting for 39.4% of all Star City residents.
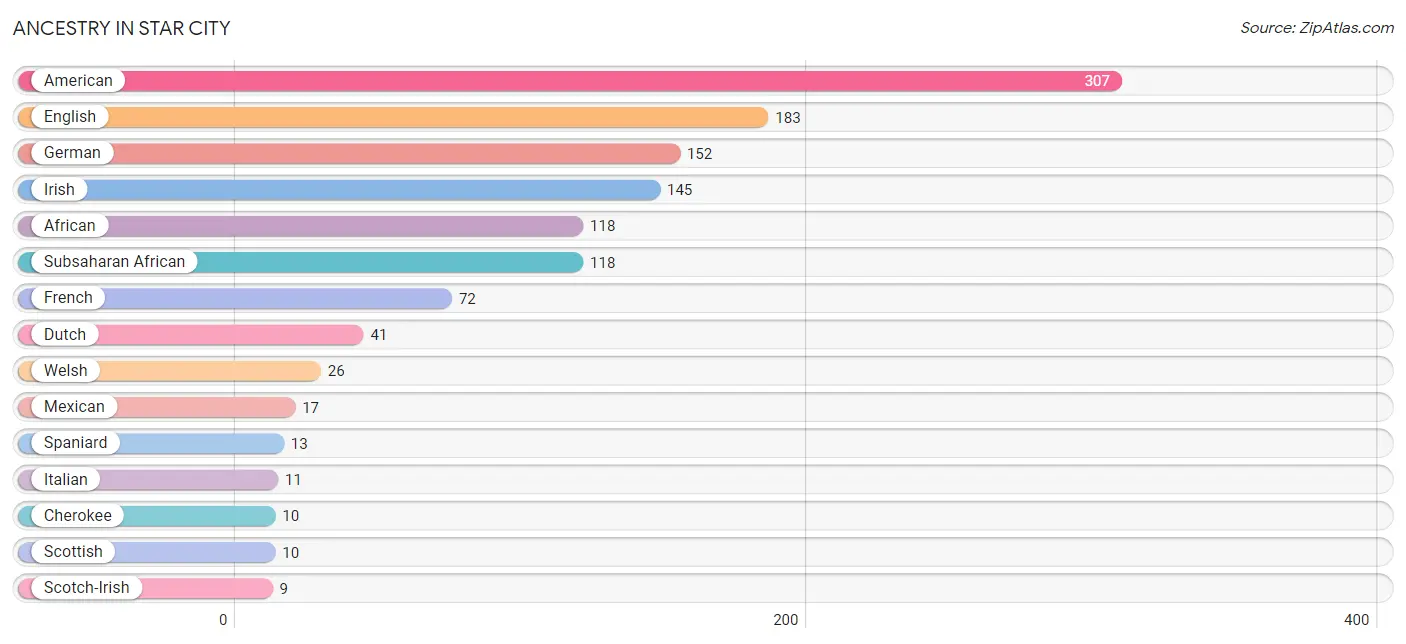
| Ancestry | # Population | % Population |
| African | 118 | 5.1% |
| American | 307 | 13.4% |
| British | 8 | 0.4% |
| Cherokee | 10 | 0.4% |
| Dutch | 41 | 1.8% |
| English | 183 | 8.0% |
| French | 72 | 3.1% |
| German | 152 | 6.6% |
| Irish | 145 | 6.3% |
| Italian | 11 | 0.5% |
| Mexican | 17 | 0.7% |
| Samoan | 5 | 0.2% |
| Scotch-Irish | 9 | 0.4% |
| Scottish | 10 | 0.4% |
| Serbian | 7 | 0.3% |
| Spaniard | 13 | 0.6% |
| Subsaharan African | 118 | 5.1% |
| Welsh | 26 | 1.1% | View All 18 Rows |
Immigrants in Star City
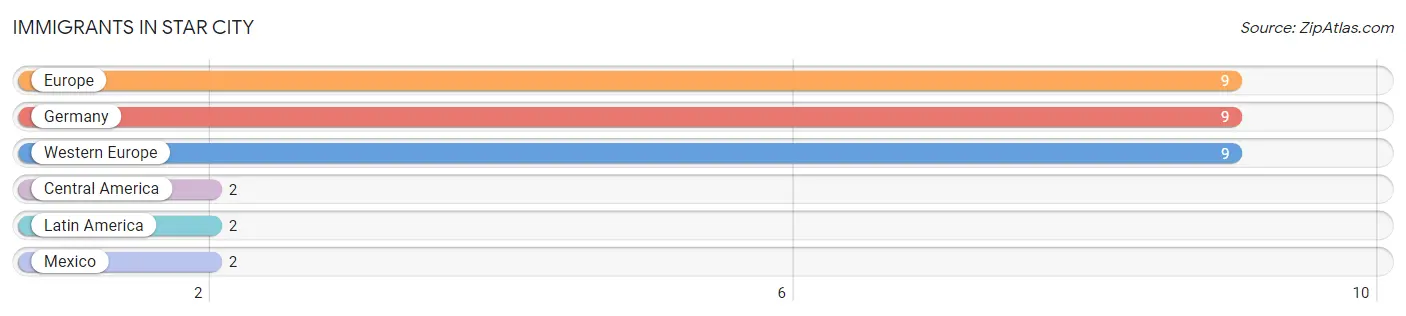
The most numerous immigrant groups reported in Star City came from Europe (9 | 0.4%), Germany (9 | 0.4%), Western Europe (9 | 0.4%), Central America (2 | 0.1%), and Latin America (2 | 0.1%), together accounting for 1.3% of all Star City residents.
| Immigration Origin | # Population | % Population |
| Central America | 2 | 0.1% |
| Europe | 9 | 0.4% |
| Germany | 9 | 0.4% |
| Latin America | 2 | 0.1% |
| Mexico | 2 | 0.1% |
| Western Europe | 9 | 0.4% | View All 6 Rows |
Sex and Age in Star City
Sex and Age in Star City
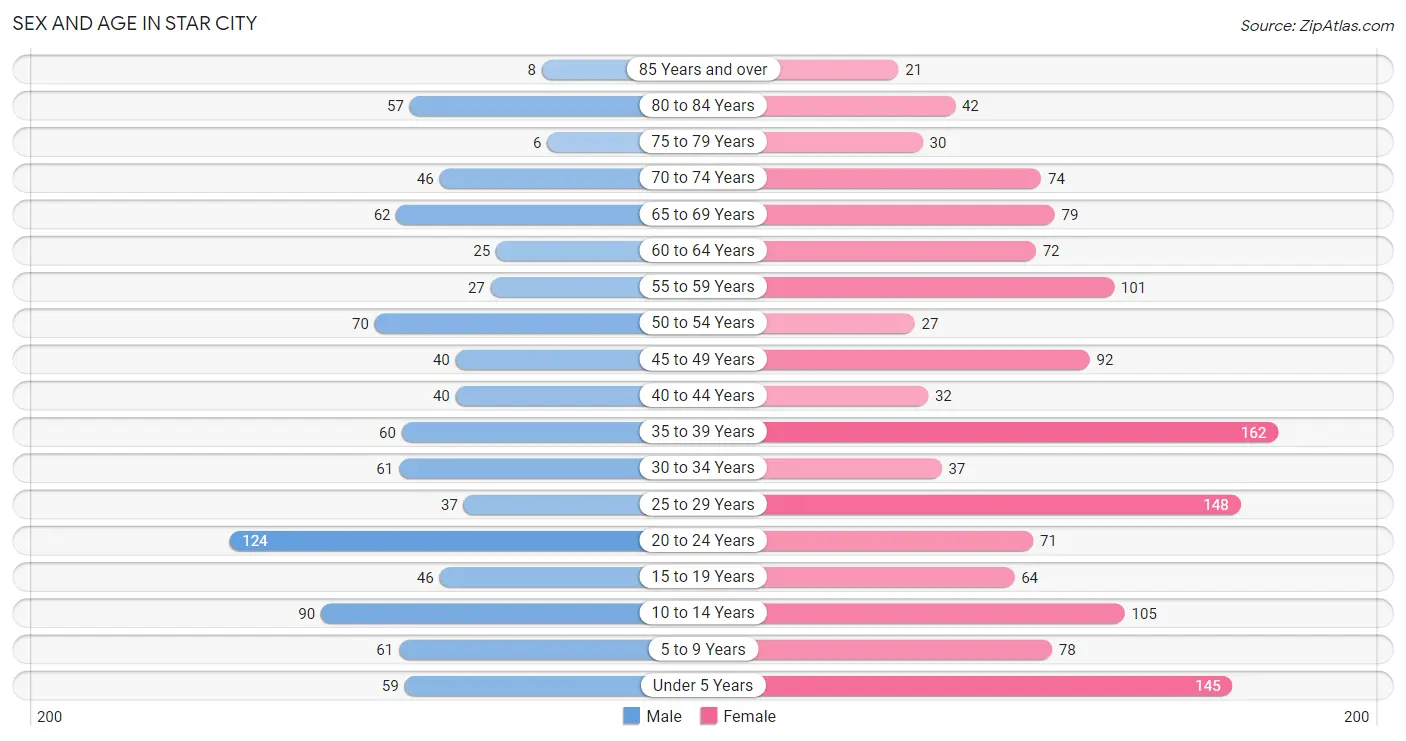
The most populous age groups in Star City are 20 to 24 Years (124 | 13.5%) for men and 35 to 39 Years (162 | 11.7%) for women.
| Age Bracket | Male | Female |
| Under 5 Years | 59 (6.4%) | 145 (10.5%) |
| 5 to 9 Years | 61 (6.6%) | 78 (5.7%) |
| 10 to 14 Years | 90 (9.8%) | 105 (7.6%) |
| 15 to 19 Years | 46 (5.0%) | 64 (4.6%) |
| 20 to 24 Years | 124 (13.5%) | 71 (5.1%) |
| 25 to 29 Years | 37 (4.0%) | 148 (10.7%) |
| 30 to 34 Years | 61 (6.6%) | 37 (2.7%) |
| 35 to 39 Years | 60 (6.5%) | 162 (11.7%) |
| 40 to 44 Years | 40 (4.3%) | 32 (2.3%) |
| 45 to 49 Years | 40 (4.3%) | 92 (6.7%) |
| 50 to 54 Years | 70 (7.6%) | 27 (2.0%) |
| 55 to 59 Years | 27 (2.9%) | 101 (7.3%) |
| 60 to 64 Years | 25 (2.7%) | 72 (5.2%) |
| 65 to 69 Years | 62 (6.8%) | 79 (5.7%) |
| 70 to 74 Years | 46 (5.0%) | 74 (5.4%) |
| 75 to 79 Years | 6 (0.6%) | 30 (2.2%) |
| 80 to 84 Years | 57 (6.2%) | 42 (3.0%) |
| 85 Years and over | 8 (0.9%) | 21 (1.5%) |
| Total | 919 (100.0%) | 1,380 (100.0%) |
Families and Households in Star City
Median Family Size in Star City
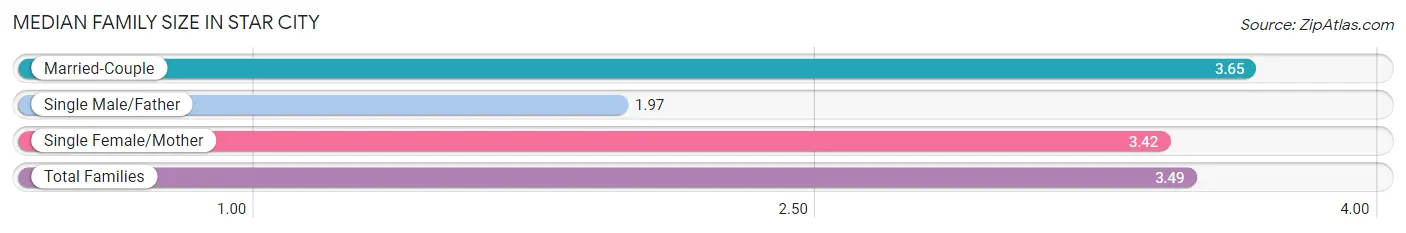
The median family size in Star City is 3.49 persons per family, with married-couple families (362 | 65.6%) accounting for the largest median family size of 3.65 persons per family. On the other hand, single male/father families (33 | 6.0%) represent the smallest median family size with 1.97 persons per family.
| Family Type | # Families | Family Size |
| Married-Couple | 362 (65.6%) | 3.65 |
| Single Male/Father | 33 (6.0%) | 1.97 |
| Single Female/Mother | 157 (28.4%) | 3.42 |
| Total Families | 552 (100.0%) | 3.49 |
Median Household Size in Star City
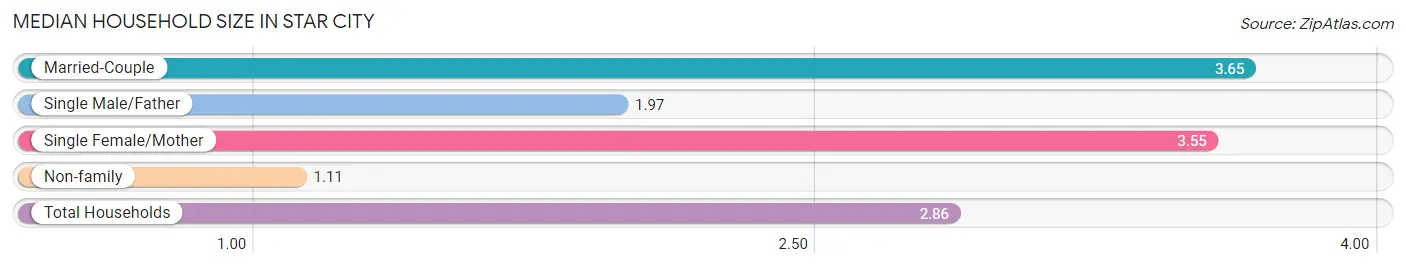
The median household size in Star City is 2.86 persons per household, with married-couple households (362 | 47.5%) accounting for the largest median household size of 3.65 persons per household. non-family households (210 | 27.6%) represent the smallest median household size with 1.11 persons per household.
| Household Type | # Households | Household Size |
| Married-Couple | 362 (47.5%) | 3.65 |
| Single Male/Father | 33 (4.3%) | 1.97 |
| Single Female/Mother | 157 (20.6%) | 3.55 |
| Non-family | 210 (27.6%) | 1.11 |
| Total Households | 762 (100.0%) | 2.86 |
Household Size by Marriage Status in Star City
Out of a total of 762 households in Star City, 552 (72.4%) are family households, while 210 (27.6%) are nonfamily households. The most numerous type of family households are 2-person households, comprising 203, and the most common type of nonfamily households are 1-person households, comprising 182.
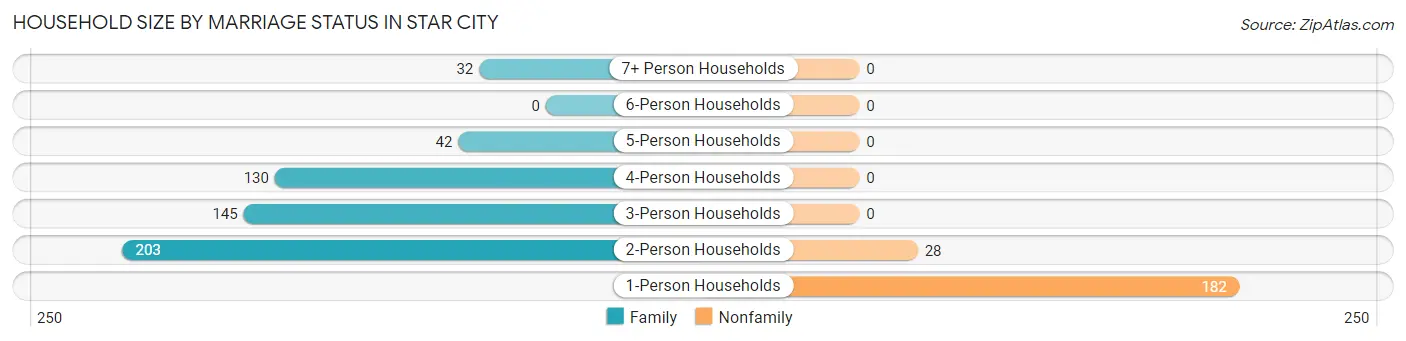
| Household Size | Family Households | Nonfamily Households |
| 1-Person Households | - | 182 (23.9%) |
| 2-Person Households | 203 (26.6%) | 28 (3.7%) |
| 3-Person Households | 145 (19.0%) | 0 (0.0%) |
| 4-Person Households | 130 (17.1%) | 0 (0.0%) |
| 5-Person Households | 42 (5.5%) | 0 (0.0%) |
| 6-Person Households | 0 (0.0%) | 0 (0.0%) |
| 7+ Person Households | 32 (4.2%) | 0 (0.0%) |
| Total | 552 (72.4%) | 210 (27.6%) |
Female Fertility in Star City
Fertility by Age in Star City
Average fertility rate in Star City is 45.0 births per 1,000 women. Women in the age bracket of 20 to 34 years have the highest fertility rate with 105.0 births per 1,000 women. Women in the age bracket of 20 to 34 years acount for 100.0% of all women with births.
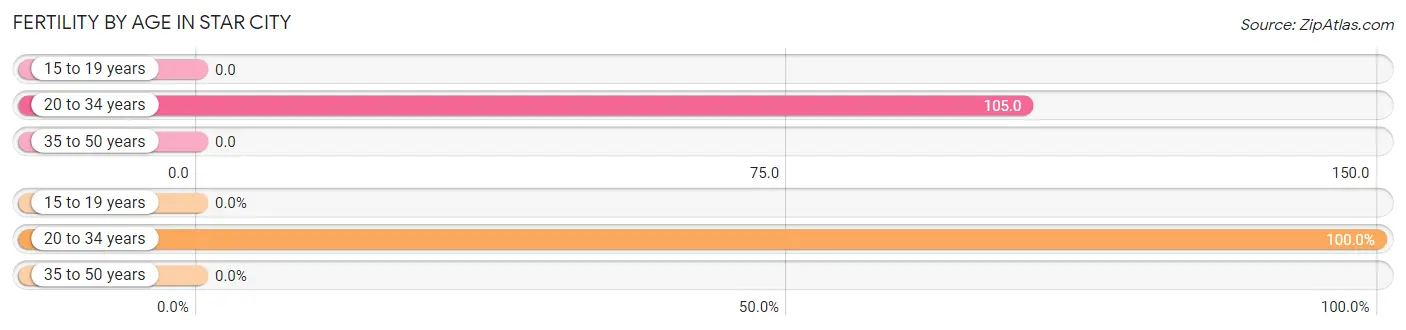
| Age Bracket | Women with Births | Births / 1,000 Women |
| 15 to 19 years | 0 (0.0%) | 0.0 |
| 20 to 34 years | 27 (100.0%) | 105.0 |
| 35 to 50 years | 0 (0.0%) | 0.0 |
| Total | 27 (100.0%) | 45.0 |
Fertility by Age by Marriage Status in Star City
51.9% of women with births (27) in Star City are married. The highest percentage of unmarried women with births falls into 20 to 34 years age bracket with 48.1% of them unmarried at the time of birth, while the lowest percentage of unmarried women with births belong to 20 to 34 years age bracket with 48.2% of them unmarried.
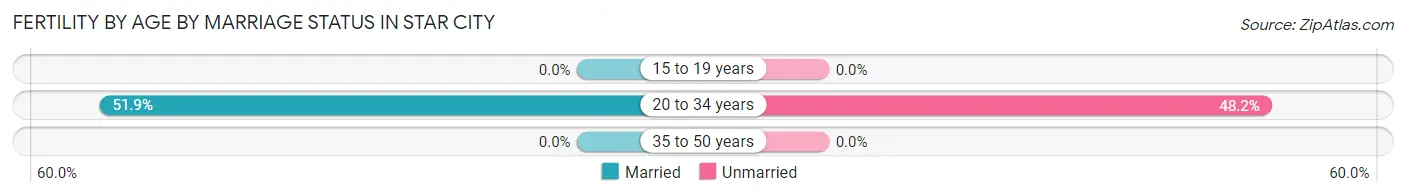
| Age Bracket | Married | Unmarried |
| 15 to 19 years | 0 (0.0%) | 0 (0.0%) |
| 20 to 34 years | 14 (51.8%) | 13 (48.1%) |
| 35 to 50 years | 0 (0.0%) | 0 (0.0%) |
| Total | 14 (51.8%) | 13 (48.1%) |
Fertility by Education in Star City
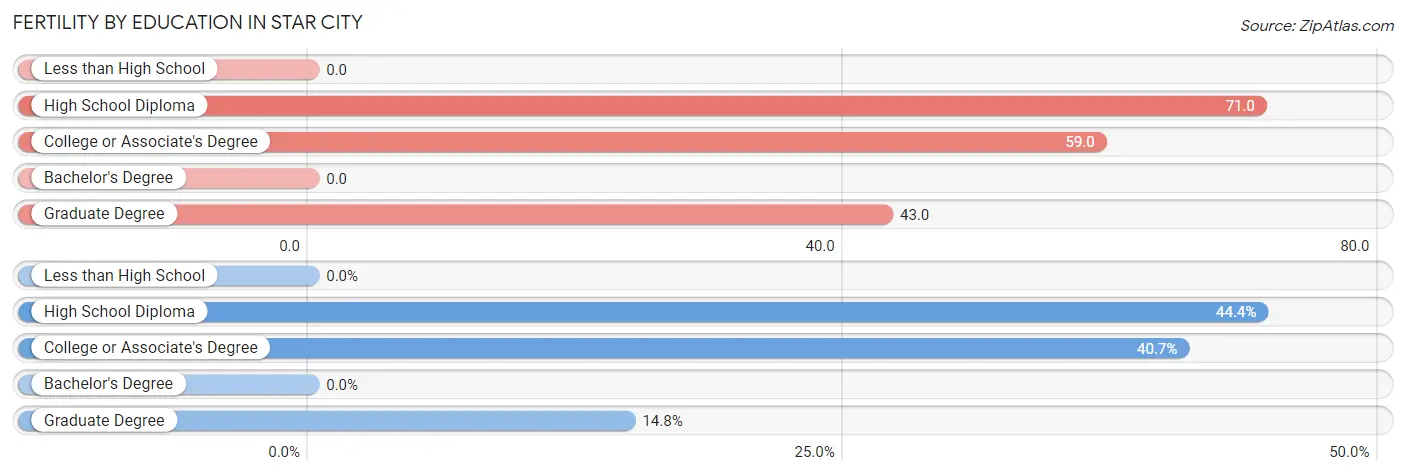
| Educational Attainment | Women with Births | Births / 1,000 Women |
| Less than High School | 0 (0.0%) | 0.0 |
| High School Diploma | 12 (44.4%) | 71.0 |
| College or Associate's Degree | 11 (40.7%) | 59.0 |
| Bachelor's Degree | 0 (0.0%) | 0.0 |
| Graduate Degree | 4 (14.8%) | 43.0 |
| Total | 27 (100.0%) | 45.0 |
Fertility by Education by Marriage Status in Star City
48.1% of women with births in Star City are unmarried. Women with the educational attainment of graduate degree are most likely to be married with 100.0% of them married at childbirth, while women with the educational attainment of high school diploma are least likely to be married with 100.0% of them unmarried at childbirth.
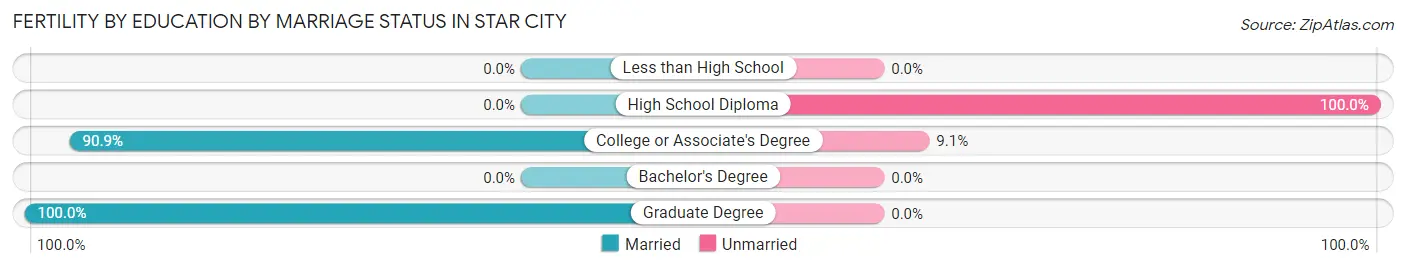
| Educational Attainment | Married | Unmarried |
| Less than High School | 0 (0.0%) | 0 (0.0%) |
| High School Diploma | 0 (0.0%) | 12 (100.0%) |
| College or Associate's Degree | 10 (90.9%) | 1 (9.1%) |
| Bachelor's Degree | 0 (0.0%) | 0 (0.0%) |
| Graduate Degree | 4 (100.0%) | 0 (0.0%) |
| Total | 14 (51.8%) | 13 (48.1%) |
Employment Characteristics in Star City
Employment by Class of Employer in Star City
Among the 1,009 employed individuals in Star City, private company employees (664 | 65.8%), local government employees (145 | 14.4%), and state government employees (124 | 12.3%) make up the most common classes of employment.
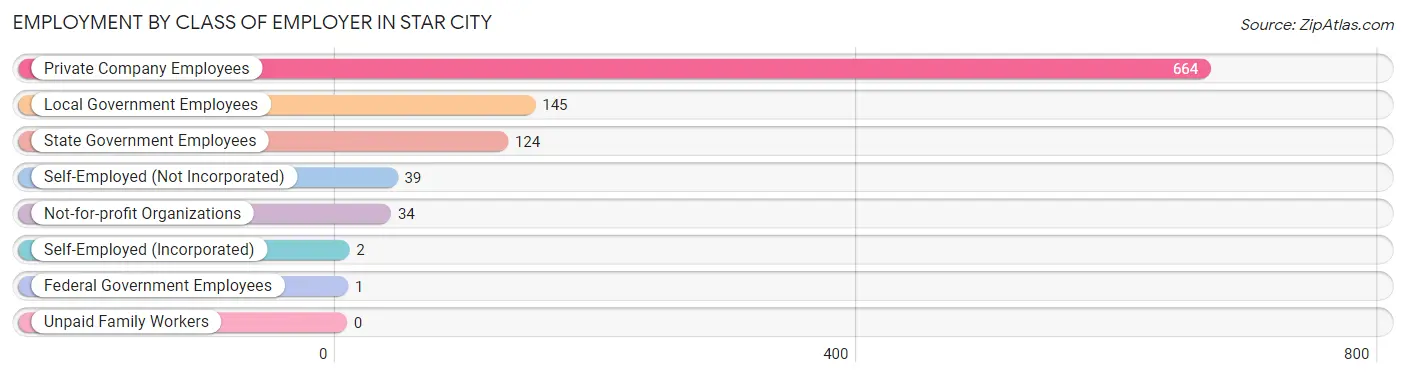
| Employer Class | # Employees | % Employees |
| Private Company Employees | 664 | 65.8% |
| Self-Employed (Incorporated) | 2 | 0.2% |
| Self-Employed (Not Incorporated) | 39 | 3.9% |
| Not-for-profit Organizations | 34 | 3.4% |
| Local Government Employees | 145 | 14.4% |
| State Government Employees | 124 | 12.3% |
| Federal Government Employees | 1 | 0.1% |
| Unpaid Family Workers | 0 | 0.0% |
| Total | 1,009 | 100.0% |
Employment Status by Age in Star City
According to the labor force statistics for Star City, out of the total population over 16 years of age (1,761), 60.6% or 1,067 individuals are in the labor force, with 2.3% or 25 of them unemployed. The age group with the highest labor force participation rate is 25 to 29 years, with 94.6% or 175 individuals in the labor force. Within the labor force, the 30 to 34 years age range has the highest percentage of unemployed individuals, with 22.0% or 18 of them being unemployed.
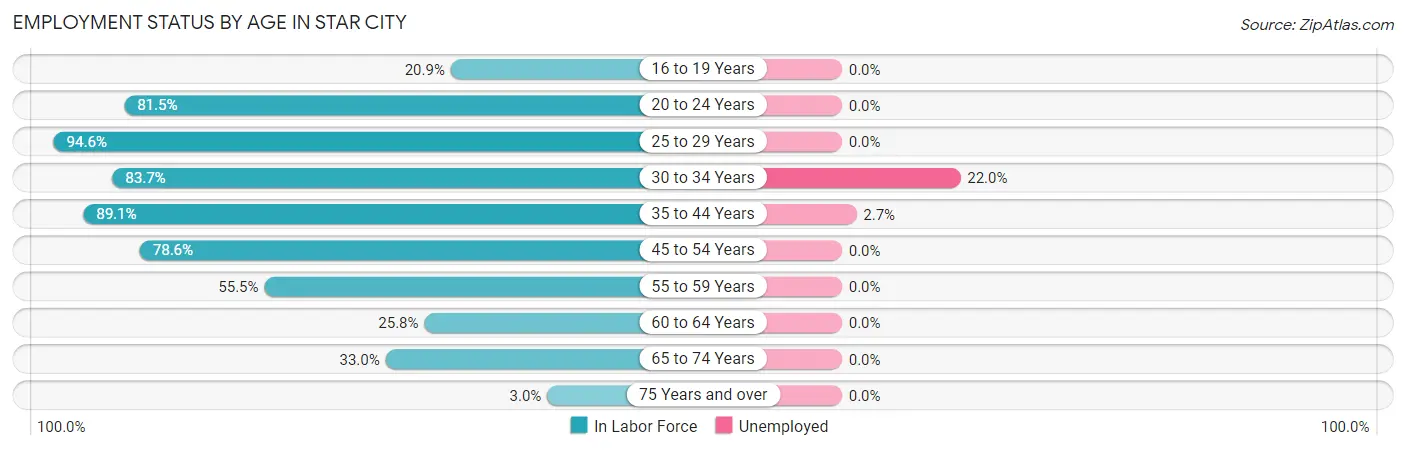
| Age Bracket | In Labor Force | Unemployed |
| 16 to 19 Years | 23 (20.9%) | 0 (0.0%) |
| 20 to 24 Years | 159 (81.5%) | 0 (0.0%) |
| 25 to 29 Years | 175 (94.6%) | 0 (0.0%) |
| 30 to 34 Years | 82 (83.7%) | 18 (22.0%) |
| 35 to 44 Years | 262 (89.1%) | 7 (2.7%) |
| 45 to 54 Years | 180 (78.6%) | 0 (0.0%) |
| 55 to 59 Years | 71 (55.5%) | 0 (0.0%) |
| 60 to 64 Years | 25 (25.8%) | 0 (0.0%) |
| 65 to 74 Years | 86 (33.0%) | 0 (0.0%) |
| 75 Years and over | 5 (3.0%) | 0 (0.0%) |
| Total | 1,067 (60.6%) | 25 (2.3%) |
Employment Status by Educational Attainment in Star City
According to labor force statistics for Star City, 77.1% of individuals (795) out of the total population between 25 and 64 years of age (1,031) are in the labor force, with 3.1% or 25 of them being unemployed. The group with the highest labor force participation rate are those with the educational attainment of bachelor's degree or higher, with 93.6% or 190 individuals in the labor force. Within the labor force, individuals with bachelor's degree or higher education have the highest percentage of unemployment, with 3.7% or 7 of them being unemployed.
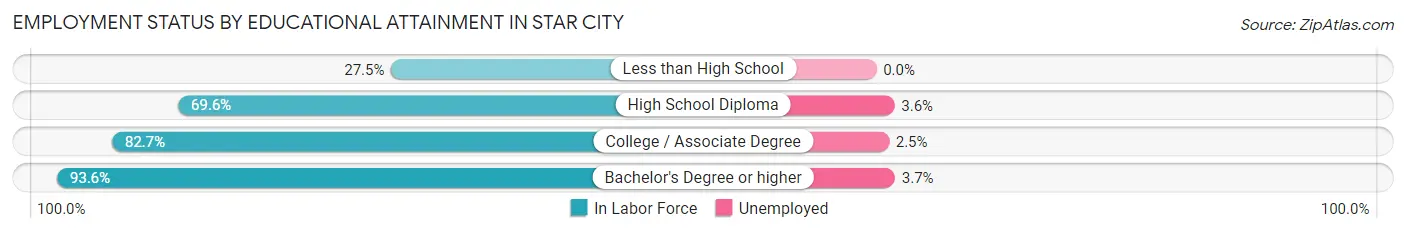
| Educational Attainment | In Labor Force | Unemployed |
| Less than High School | 14 (27.5%) | 0 (0.0%) |
| High School Diploma | 275 (69.6%) | 14 (3.6%) |
| College / Associate Degree | 316 (82.7%) | 10 (2.5%) |
| Bachelor's Degree or higher | 190 (93.6%) | 8 (3.7%) |
| Total | 795 (77.1%) | 32 (3.1%) |
Employment Occupations by Sex in Star City
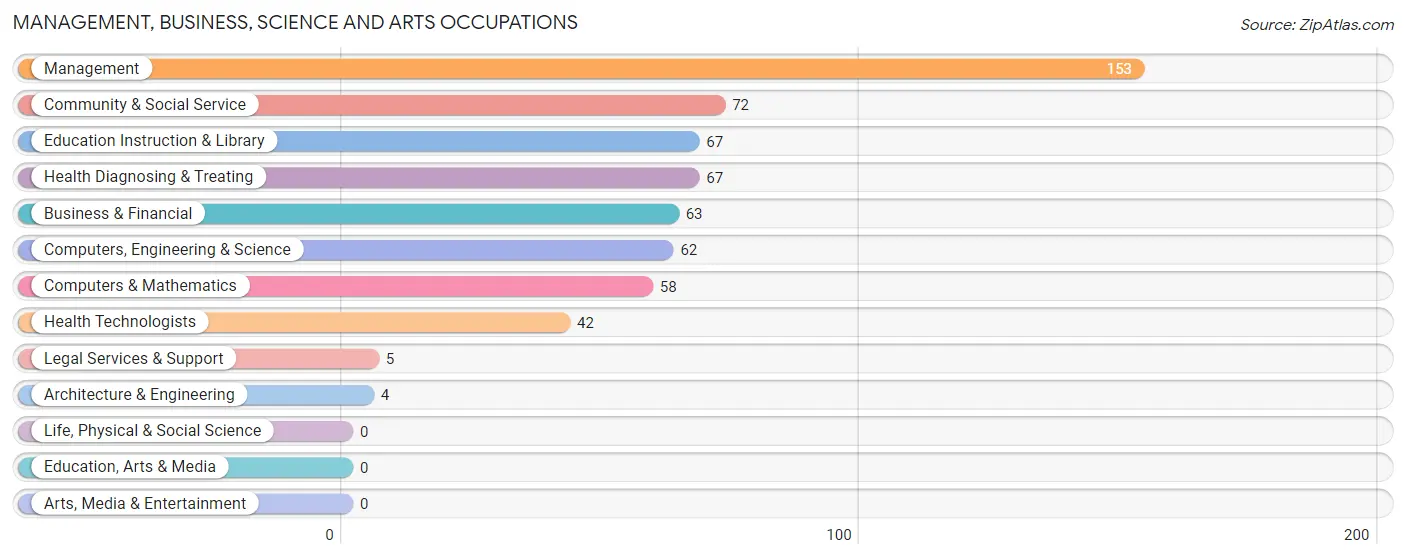
Management, Business, Science and Arts Occupations
The most common Management, Business, Science and Arts occupations in Star City are Management (153 | 14.7%), Community & Social Service (72 | 6.9%), Education Instruction & Library (67 | 6.4%), Health Diagnosing & Treating (67 | 6.4%), and Business & Financial (63 | 6.0%).
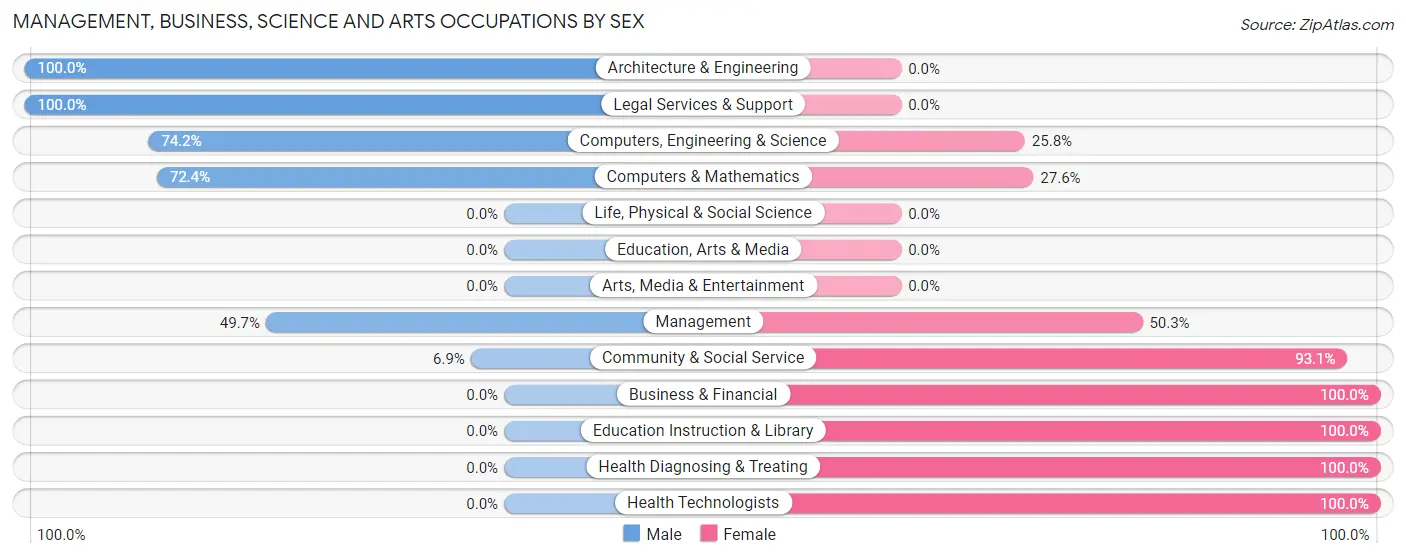
Management, Business, Science and Arts Occupations by Sex
Within the Management, Business, Science and Arts occupations in Star City, the most male-oriented occupations are Architecture & Engineering (100.0%), Legal Services & Support (100.0%), and Computers, Engineering & Science (74.2%), while the most female-oriented occupations are Business & Financial (100.0%), Education Instruction & Library (100.0%), and Health Diagnosing & Treating (100.0%).
| Occupation | Male | Female |
| Management | 76 (49.7%) | 77 (50.3%) |
| Business & Financial | 0 (0.0%) | 63 (100.0%) |
| Computers, Engineering & Science | 46 (74.2%) | 16 (25.8%) |
| Computers & Mathematics | 42 (72.4%) | 16 (27.6%) |
| Architecture & Engineering | 4 (100.0%) | 0 (0.0%) |
| Life, Physical & Social Science | 0 (0.0%) | 0 (0.0%) |
| Community & Social Service | 5 (6.9%) | 67 (93.1%) |
| Education, Arts & Media | 0 (0.0%) | 0 (0.0%) |
| Legal Services & Support | 5 (100.0%) | 0 (0.0%) |
| Education Instruction & Library | 0 (0.0%) | 67 (100.0%) |
| Arts, Media & Entertainment | 0 (0.0%) | 0 (0.0%) |
| Health Diagnosing & Treating | 0 (0.0%) | 67 (100.0%) |
| Health Technologists | 0 (0.0%) | 42 (100.0%) |
| Total (Category) | 127 (30.5%) | 290 (69.5%) |
| Total (Overall) | 372 (35.7%) | 671 (64.3%) |
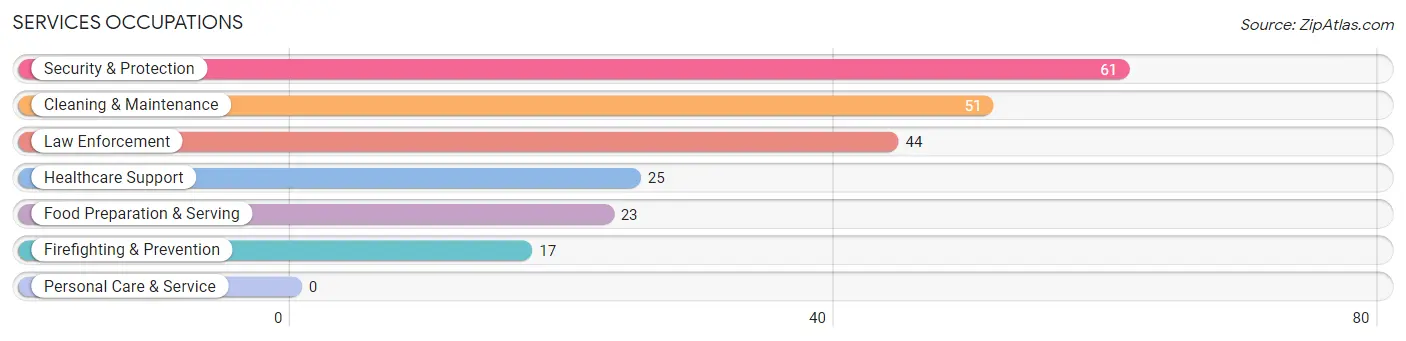
Services Occupations
The most common Services occupations in Star City are Security & Protection (61 | 5.9%), Cleaning & Maintenance (51 | 4.9%), Law Enforcement (44 | 4.2%), Healthcare Support (25 | 2.4%), and Food Preparation & Serving (23 | 2.2%).
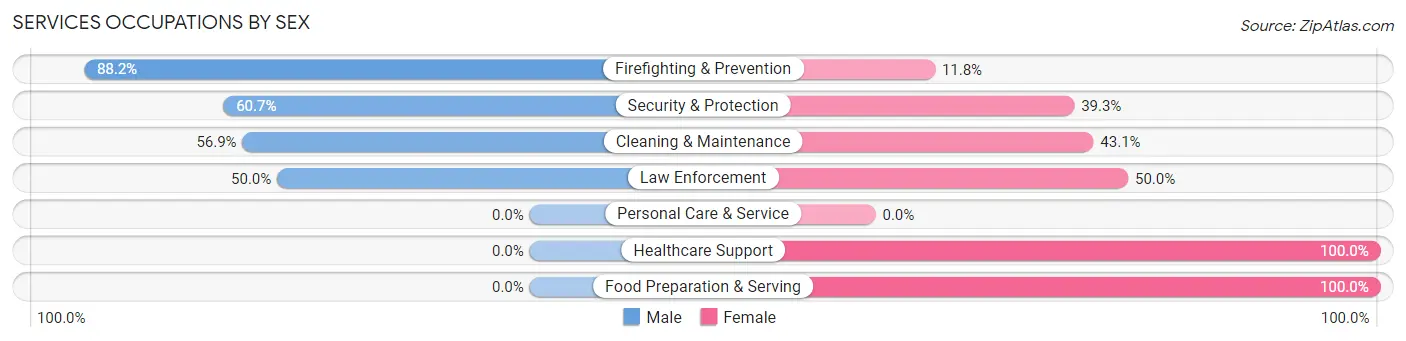
Services Occupations by Sex
Within the Services occupations in Star City, the most male-oriented occupations are Firefighting & Prevention (88.2%), Security & Protection (60.7%), and Cleaning & Maintenance (56.9%), while the most female-oriented occupations are Healthcare Support (100.0%), Food Preparation & Serving (100.0%), and Law Enforcement (50.0%).
| Occupation | Male | Female |
| Healthcare Support | 0 (0.0%) | 25 (100.0%) |
| Security & Protection | 37 (60.7%) | 24 (39.3%) |
| Firefighting & Prevention | 15 (88.2%) | 2 (11.8%) |
| Law Enforcement | 22 (50.0%) | 22 (50.0%) |
| Food Preparation & Serving | 0 (0.0%) | 23 (100.0%) |
| Cleaning & Maintenance | 29 (56.9%) | 22 (43.1%) |
| Personal Care & Service | 0 (0.0%) | 0 (0.0%) |
| Total (Category) | 66 (41.2%) | 94 (58.8%) |
| Total (Overall) | 372 (35.7%) | 671 (64.3%) |
Sales and Office Occupations
The most common Sales and Office occupations in Star City are Office & Administration (129 | 12.4%), and Sales & Related (126 | 12.1%).
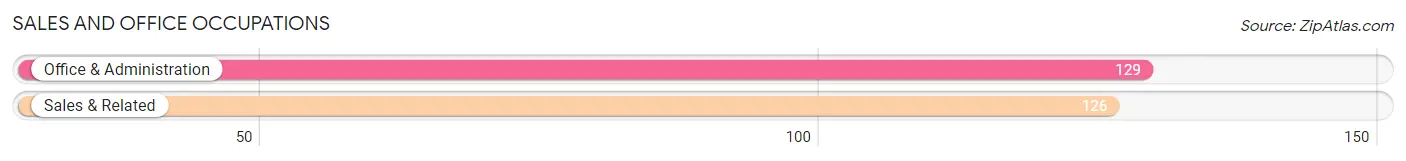
Sales and Office Occupations by Sex

| Occupation | Male | Female |
| Sales & Related | 31 (24.6%) | 95 (75.4%) |
| Office & Administration | 0 (0.0%) | 129 (100.0%) |
| Total (Category) | 31 (12.2%) | 224 (87.8%) |
| Total (Overall) | 372 (35.7%) | 671 (64.3%) |
Natural Resources, Construction and Maintenance Occupations
The most common Natural Resources, Construction and Maintenance occupations in Star City are Farming, Fishing & Forestry (48 | 4.6%), and Construction & Extraction (18 | 1.7%).
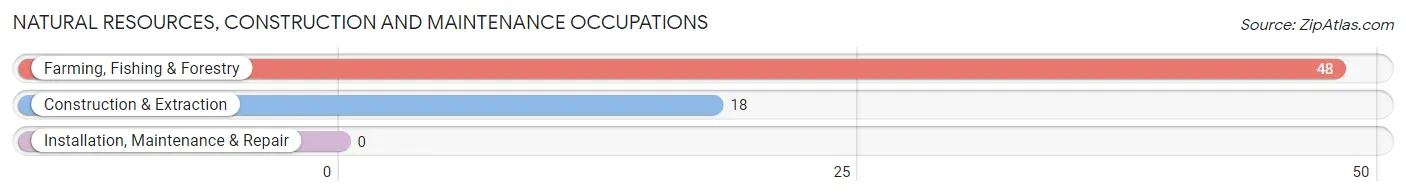
Natural Resources, Construction and Maintenance Occupations by Sex

| Occupation | Male | Female |
| Farming, Fishing & Forestry | 48 (100.0%) | 0 (0.0%) |
| Construction & Extraction | 13 (72.2%) | 5 (27.8%) |
| Installation, Maintenance & Repair | 0 (0.0%) | 0 (0.0%) |
| Total (Category) | 61 (92.4%) | 5 (7.6%) |
| Total (Overall) | 372 (35.7%) | 671 (64.3%) |
Production, Transportation and Moving Occupations
The most common Production, Transportation and Moving occupations in Star City are Production (89 | 8.5%), Transportation (43 | 4.1%), and Material Moving (13 | 1.3%).
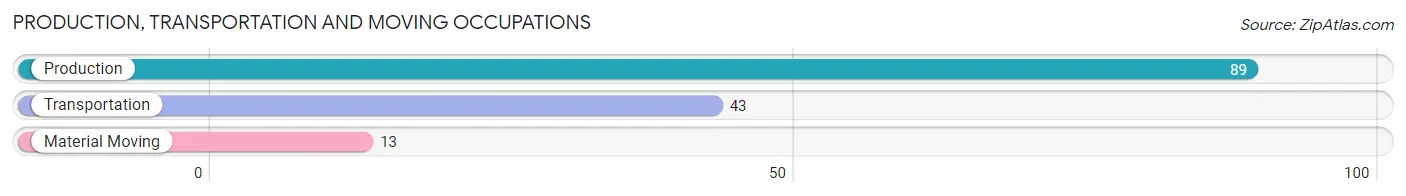
Production, Transportation and Moving Occupations by Sex
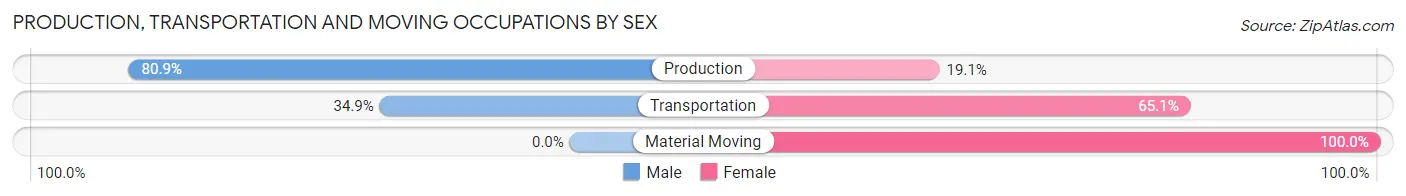
| Occupation | Male | Female |
| Production | 72 (80.9%) | 17 (19.1%) |
| Transportation | 15 (34.9%) | 28 (65.1%) |
| Material Moving | 0 (0.0%) | 13 (100.0%) |
| Total (Category) | 87 (60.0%) | 58 (40.0%) |
| Total (Overall) | 372 (35.7%) | 671 (64.3%) |
Employment Industries by Sex in Star City
Employment Industries in Star City
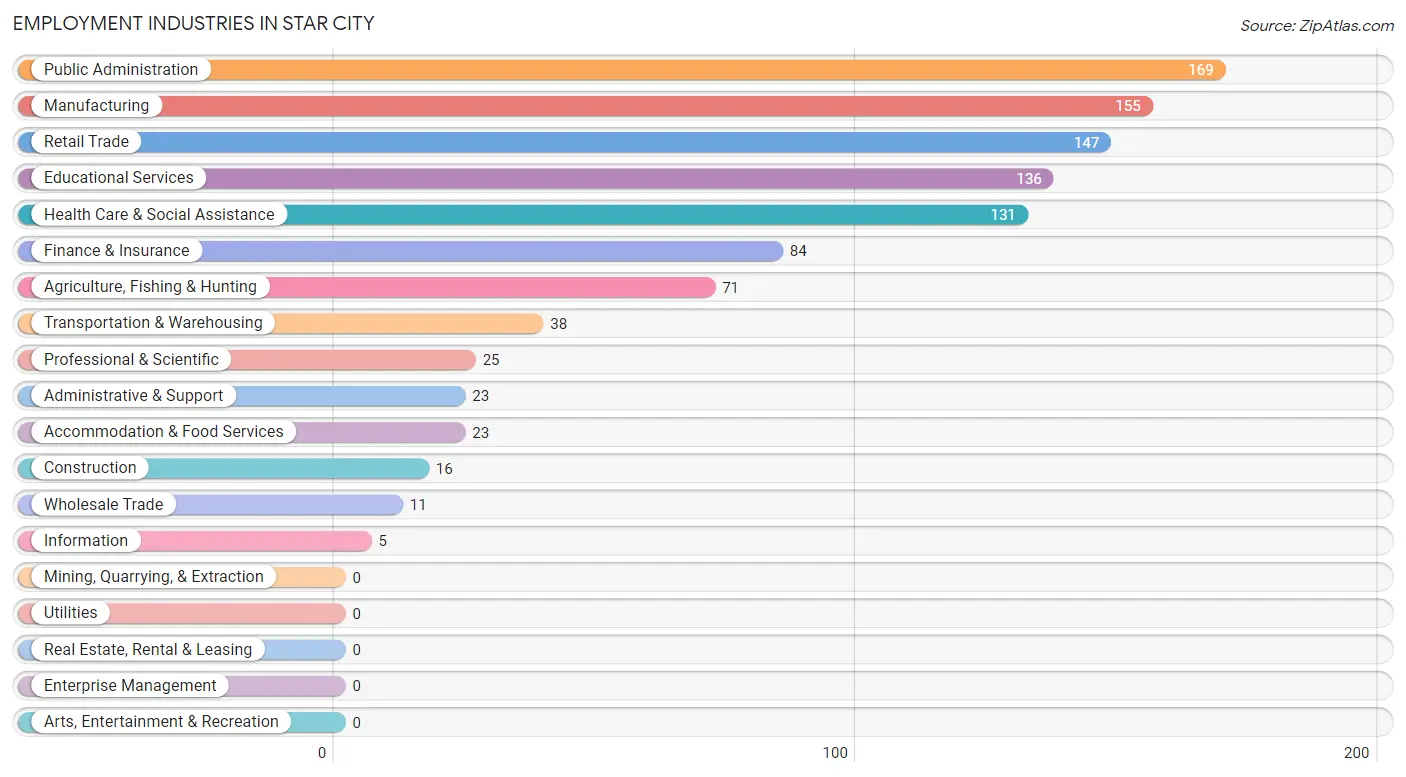
The major employment industries in Star City include Public Administration (169 | 16.2%), Manufacturing (155 | 14.9%), Retail Trade (147 | 14.1%), Educational Services (136 | 13.0%), and Health Care & Social Assistance (131 | 12.6%).
Employment Industries by Sex in Star City
The Star City industries that see more men than women are Agriculture, Fishing & Hunting (100.0%), Wholesale Trade (100.0%), and Manufacturing (76.1%), whereas the industries that tend to have a higher number of women are Information (100.0%), Administrative & Support (100.0%), and Health Care & Social Assistance (100.0%).
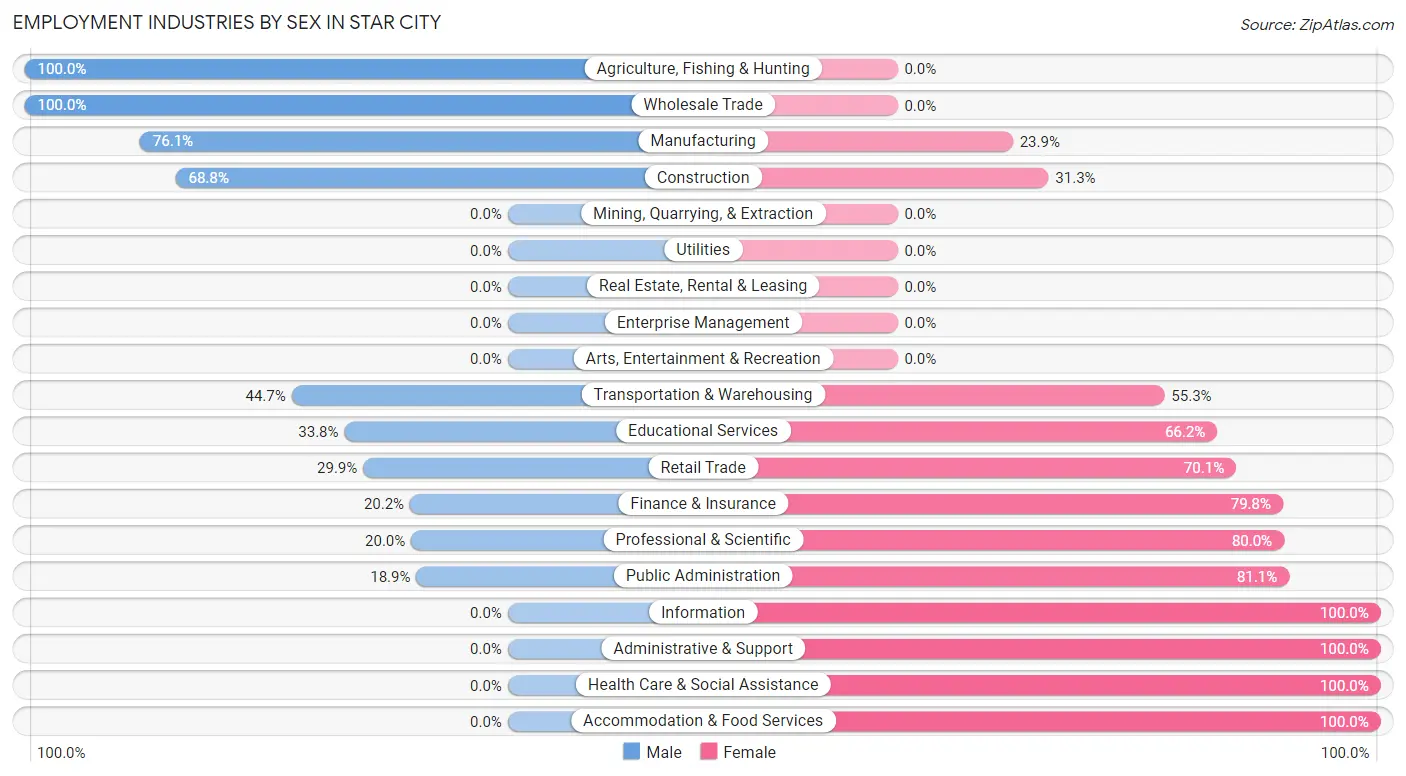
| Industry | Male | Female |
| Agriculture, Fishing & Hunting | 71 (100.0%) | 0 (0.0%) |
| Mining, Quarrying, & Extraction | 0 (0.0%) | 0 (0.0%) |
| Construction | 11 (68.8%) | 5 (31.2%) |
| Manufacturing | 118 (76.1%) | 37 (23.9%) |
| Wholesale Trade | 11 (100.0%) | 0 (0.0%) |
| Retail Trade | 44 (29.9%) | 103 (70.1%) |
| Transportation & Warehousing | 17 (44.7%) | 21 (55.3%) |
| Utilities | 0 (0.0%) | 0 (0.0%) |
| Information | 0 (0.0%) | 5 (100.0%) |
| Finance & Insurance | 17 (20.2%) | 67 (79.8%) |
| Real Estate, Rental & Leasing | 0 (0.0%) | 0 (0.0%) |
| Professional & Scientific | 5 (20.0%) | 20 (80.0%) |
| Enterprise Management | 0 (0.0%) | 0 (0.0%) |
| Administrative & Support | 0 (0.0%) | 23 (100.0%) |
| Educational Services | 46 (33.8%) | 90 (66.2%) |
| Health Care & Social Assistance | 0 (0.0%) | 131 (100.0%) |
| Arts, Entertainment & Recreation | 0 (0.0%) | 0 (0.0%) |
| Accommodation & Food Services | 0 (0.0%) | 23 (100.0%) |
| Public Administration | 32 (18.9%) | 137 (81.1%) |
| Total | 372 (35.7%) | 671 (64.3%) |
Education in Star City
School Enrollment in Star City
The most common levels of schooling among the 577 students in Star City are high school (141 | 24.4%), middle school (133 | 23.1%), and elementary school (126 | 21.8%).
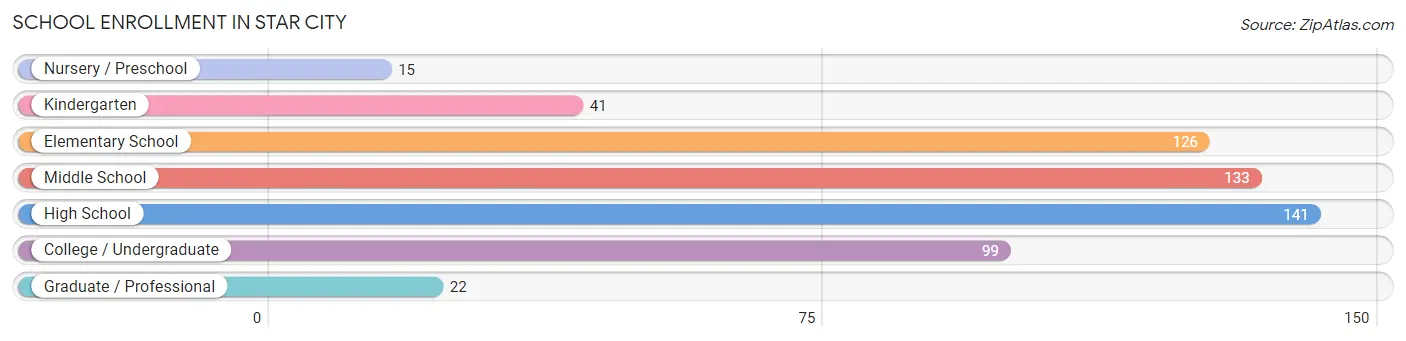
| School Level | # Students | % Students |
| Nursery / Preschool | 15 | 2.6% |
| Kindergarten | 41 | 7.1% |
| Elementary School | 126 | 21.8% |
| Middle School | 133 | 23.1% |
| High School | 141 | 24.4% |
| College / Undergraduate | 99 | 17.2% |
| Graduate / Professional | 22 | 3.8% |
| Total | 577 | 100.0% |
School Enrollment by Age by Funding Source in Star City
Out of a total of 577 students who are enrolled in schools in Star City, 128 (22.2%) attend a private institution, while the remaining 449 (77.8%) are enrolled in public schools. The age group of 3 to 4 year olds has the highest likelihood of being enrolled in private schools, with 13 (100.0% in the age bracket) enrolled. Conversely, the age group of 10 to 14 year olds has the lowest likelihood of being enrolled in a private school, with 195 (100.0% in the age bracket) attending a public institution.
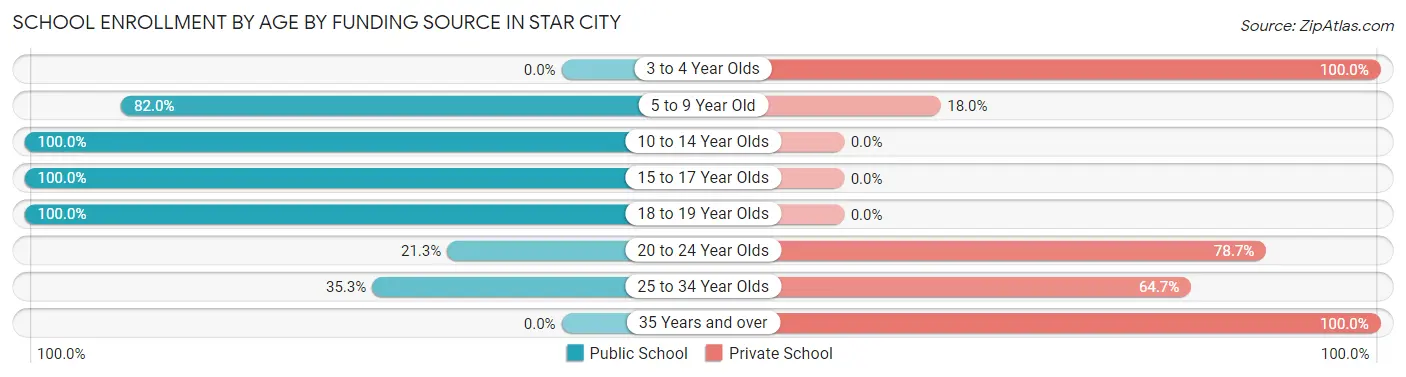
| Age Bracket | Public School | Private School |
| 3 to 4 Year Olds | 0 (0.0%) | 13 (100.0%) |
| 5 to 9 Year Old | 114 (82.0%) | 25 (18.0%) |
| 10 to 14 Year Olds | 195 (100.0%) | 0 (0.0%) |
| 15 to 17 Year Olds | 90 (100.0%) | 0 (0.0%) |
| 18 to 19 Year Olds | 19 (100.0%) | 0 (0.0%) |
| 20 to 24 Year Olds | 13 (21.3%) | 48 (78.7%) |
| 25 to 34 Year Olds | 18 (35.3%) | 33 (64.7%) |
| 35 Years and over | 0 (0.0%) | 9 (100.0%) |
| Total | 449 (77.8%) | 128 (22.2%) |
Educational Attainment by Field of Study in Star City
Business (76 | 26.2%), bio, nature & agricultural (64 | 22.1%), education (60 | 20.7%), liberal arts & history (32 | 11.0%), and science & technology (21 | 7.2%) are the most common fields of study among 290 individuals in Star City who have obtained a bachelor's degree or higher.
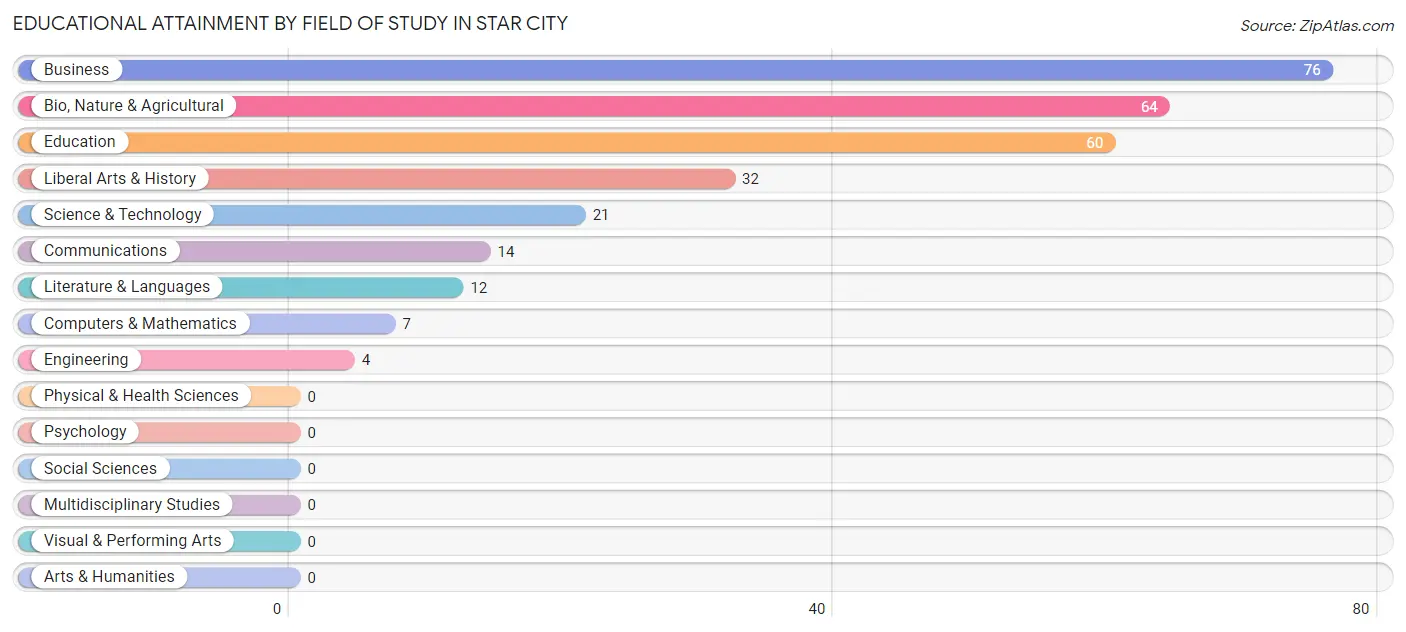
| Field of Study | # Graduates | % Graduates |
| Computers & Mathematics | 7 | 2.4% |
| Bio, Nature & Agricultural | 64 | 22.1% |
| Physical & Health Sciences | 0 | 0.0% |
| Psychology | 0 | 0.0% |
| Social Sciences | 0 | 0.0% |
| Engineering | 4 | 1.4% |
| Multidisciplinary Studies | 0 | 0.0% |
| Science & Technology | 21 | 7.2% |
| Business | 76 | 26.2% |
| Education | 60 | 20.7% |
| Literature & Languages | 12 | 4.1% |
| Liberal Arts & History | 32 | 11.0% |
| Visual & Performing Arts | 0 | 0.0% |
| Communications | 14 | 4.8% |
| Arts & Humanities | 0 | 0.0% |
| Total | 290 | 100.0% |
Transportation & Commute in Star City
Vehicle Availability by Sex in Star City
The most prevalent vehicle ownership categories in Star City are males with 2 vehicles (123, accounting for 33.5%) and females with 2 vehicles (197, making up 19.2%).
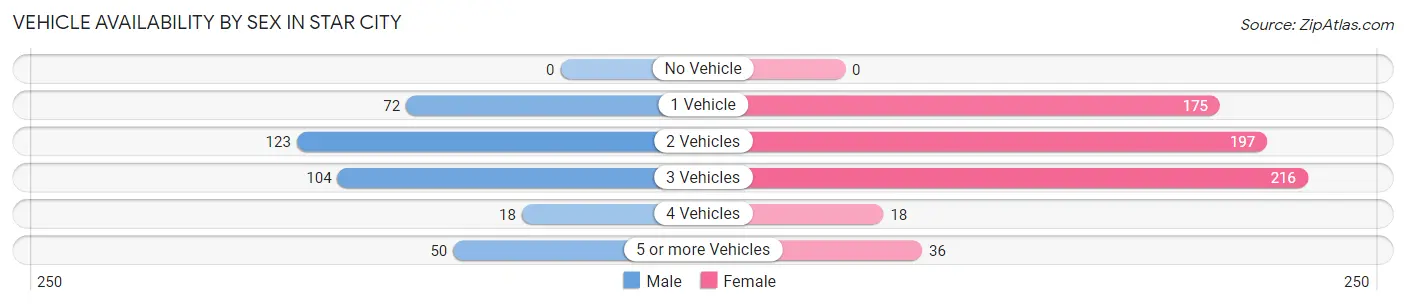
| Vehicles Available | Male | Female |
| No Vehicle | 0 (0.0%) | 0 (0.0%) |
| 1 Vehicle | 72 (19.6%) | 175 (27.3%) |
| 2 Vehicles | 123 (33.5%) | 197 (30.7%) |
| 3 Vehicles | 104 (28.3%) | 216 (33.6%) |
| 4 Vehicles | 18 (4.9%) | 18 (2.8%) |
| 5 or more Vehicles | 50 (13.6%) | 36 (5.6%) |
| Total | 367 (100.0%) | 642 (100.0%) |
Commute Time in Star City
The most frequently occuring commute durations in Star City are 5 to 9 minutes (294 commuters, 30.0%), 30 to 34 minutes (248 commuters, 25.3%), and 20 to 24 minutes (132 commuters, 13.5%).
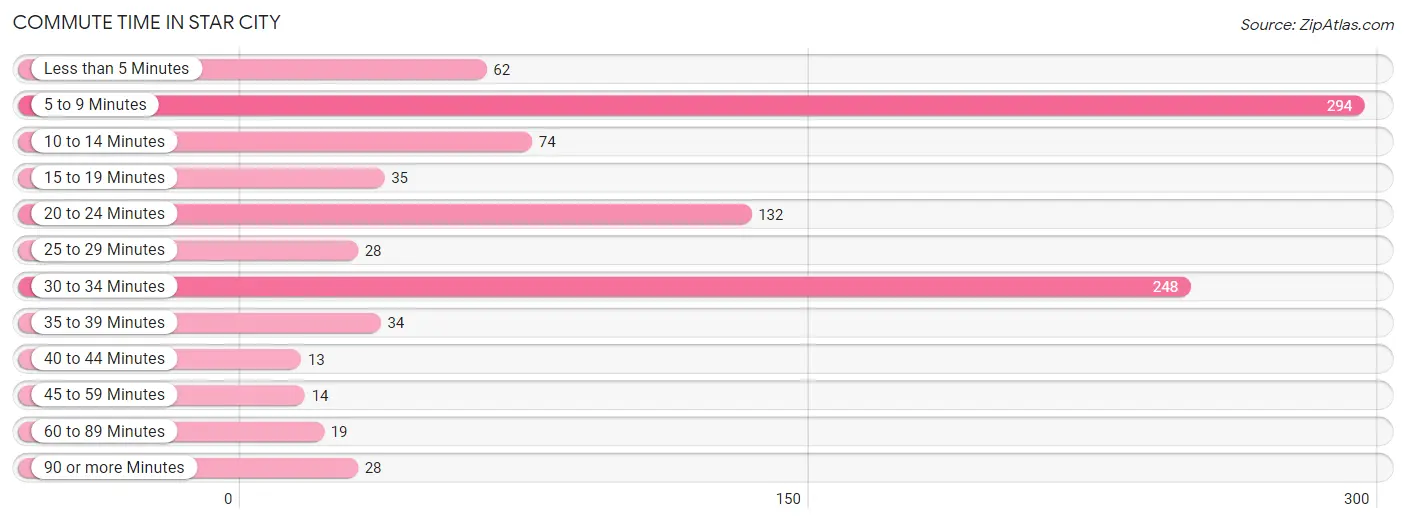
| Commute Time | # Commuters | % Commuters |
| Less than 5 Minutes | 62 | 6.3% |
| 5 to 9 Minutes | 294 | 30.0% |
| 10 to 14 Minutes | 74 | 7.5% |
| 15 to 19 Minutes | 35 | 3.6% |
| 20 to 24 Minutes | 132 | 13.5% |
| 25 to 29 Minutes | 28 | 2.9% |
| 30 to 34 Minutes | 248 | 25.3% |
| 35 to 39 Minutes | 34 | 3.5% |
| 40 to 44 Minutes | 13 | 1.3% |
| 45 to 59 Minutes | 14 | 1.4% |
| 60 to 89 Minutes | 19 | 1.9% |
| 90 or more Minutes | 28 | 2.9% |
Commute Time by Sex in Star City
The most common commute times in Star City are 30 to 34 minutes (156 commuters, 42.5%) for males and 5 to 9 minutes (203 commuters, 33.1%) for females.
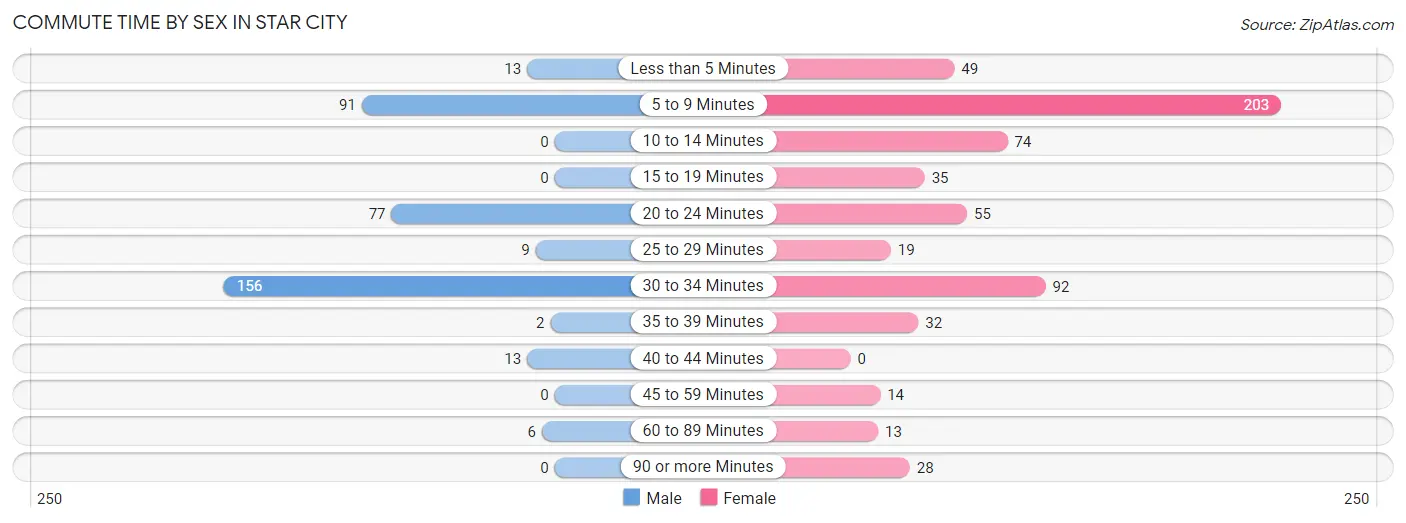
| Commute Time | Male | Female |
| Less than 5 Minutes | 13 (3.5%) | 49 (8.0%) |
| 5 to 9 Minutes | 91 (24.8%) | 203 (33.1%) |
| 10 to 14 Minutes | 0 (0.0%) | 74 (12.0%) |
| 15 to 19 Minutes | 0 (0.0%) | 35 (5.7%) |
| 20 to 24 Minutes | 77 (21.0%) | 55 (9.0%) |
| 25 to 29 Minutes | 9 (2.5%) | 19 (3.1%) |
| 30 to 34 Minutes | 156 (42.5%) | 92 (15.0%) |
| 35 to 39 Minutes | 2 (0.5%) | 32 (5.2%) |
| 40 to 44 Minutes | 13 (3.5%) | 0 (0.0%) |
| 45 to 59 Minutes | 0 (0.0%) | 14 (2.3%) |
| 60 to 89 Minutes | 6 (1.6%) | 13 (2.1%) |
| 90 or more Minutes | 0 (0.0%) | 28 (4.6%) |
Time of Departure to Work by Sex in Star City
The most frequent times of departure to work in Star City are 6:30 AM to 6:59 AM (106, 28.9%) for males and 7:30 AM to 7:59 AM (239, 38.9%) for females.
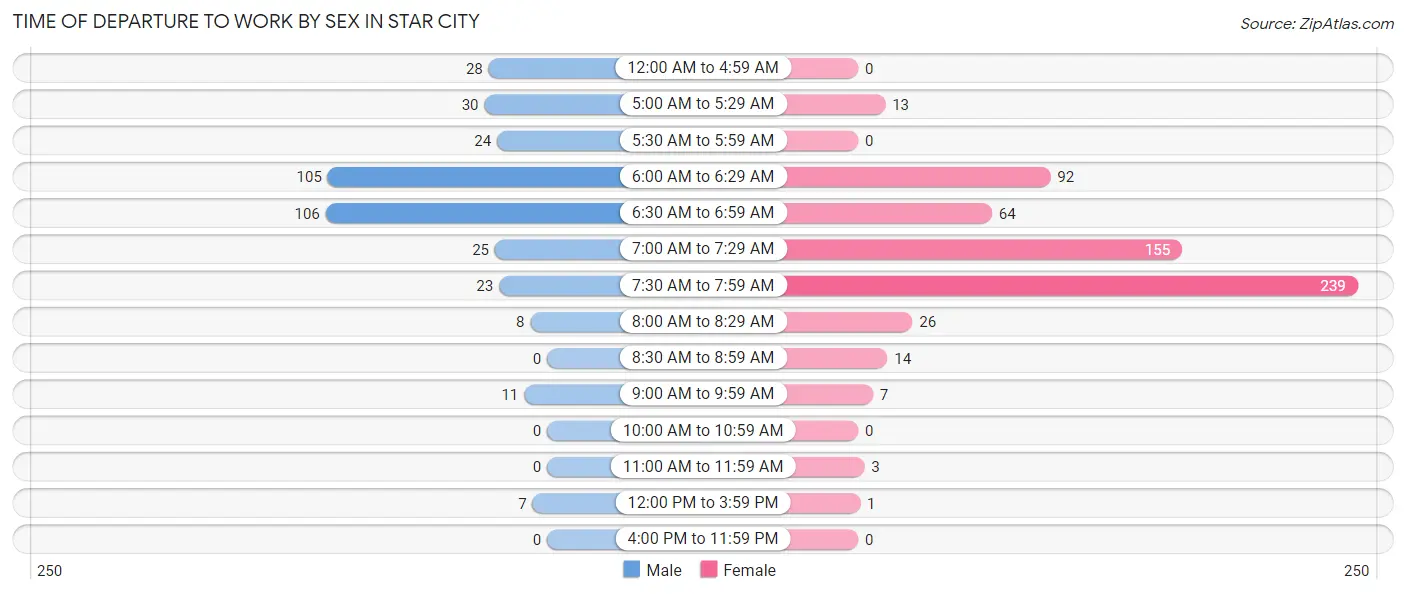
| Time of Departure | Male | Female |
| 12:00 AM to 4:59 AM | 28 (7.6%) | 0 (0.0%) |
| 5:00 AM to 5:29 AM | 30 (8.2%) | 13 (2.1%) |
| 5:30 AM to 5:59 AM | 24 (6.5%) | 0 (0.0%) |
| 6:00 AM to 6:29 AM | 105 (28.6%) | 92 (15.0%) |
| 6:30 AM to 6:59 AM | 106 (28.9%) | 64 (10.4%) |
| 7:00 AM to 7:29 AM | 25 (6.8%) | 155 (25.2%) |
| 7:30 AM to 7:59 AM | 23 (6.3%) | 239 (38.9%) |
| 8:00 AM to 8:29 AM | 8 (2.2%) | 26 (4.2%) |
| 8:30 AM to 8:59 AM | 0 (0.0%) | 14 (2.3%) |
| 9:00 AM to 9:59 AM | 11 (3.0%) | 7 (1.1%) |
| 10:00 AM to 10:59 AM | 0 (0.0%) | 0 (0.0%) |
| 11:00 AM to 11:59 AM | 0 (0.0%) | 3 (0.5%) |
| 12:00 PM to 3:59 PM | 7 (1.9%) | 1 (0.2%) |
| 4:00 PM to 11:59 PM | 0 (0.0%) | 0 (0.0%) |
| Total | 367 (100.0%) | 614 (100.0%) |
Housing Occupancy in Star City
Occupancy by Ownership in Star City
Of the total 762 dwellings in Star City, owner-occupied units account for 588 (77.2%), while renter-occupied units make up 174 (22.8%).
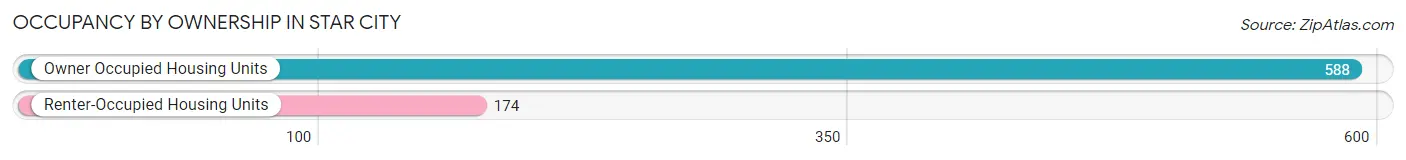
| Occupancy | # Housing Units | % Housing Units |
| Owner Occupied Housing Units | 588 | 77.2% |
| Renter-Occupied Housing Units | 174 | 22.8% |
| Total Occupied Housing Units | 762 | 100.0% |
Occupancy by Household Size in Star City
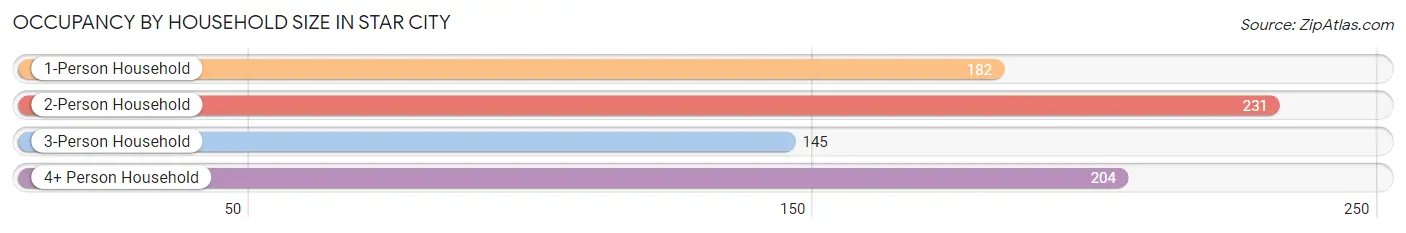
| Household Size | # Housing Units | % Housing Units |
| 1-Person Household | 182 | 23.9% |
| 2-Person Household | 231 | 30.3% |
| 3-Person Household | 145 | 19.0% |
| 4+ Person Household | 204 | 26.8% |
| Total Housing Units | 762 | 100.0% |
Occupancy by Ownership by Household Size in Star City
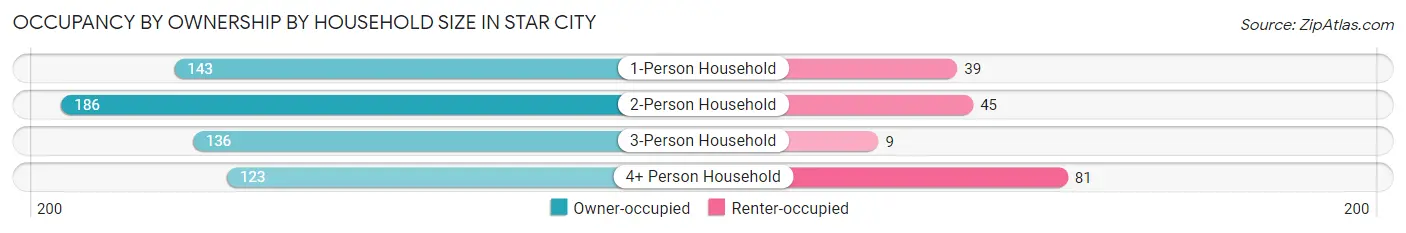
| Household Size | Owner-occupied | Renter-occupied |
| 1-Person Household | 143 (78.6%) | 39 (21.4%) |
| 2-Person Household | 186 (80.5%) | 45 (19.5%) |
| 3-Person Household | 136 (93.8%) | 9 (6.2%) |
| 4+ Person Household | 123 (60.3%) | 81 (39.7%) |
| Total Housing Units | 588 (77.2%) | 174 (22.8%) |
Occupancy by Educational Attainment in Star City
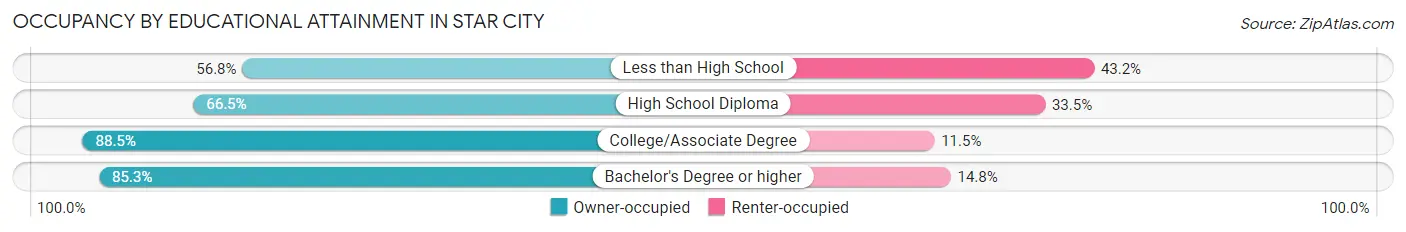
| Household Size | Owner-occupied | Renter-occupied |
| Less than High School | 50 (56.8%) | 38 (43.2%) |
| High School Diploma | 159 (66.5%) | 80 (33.5%) |
| College/Associate Degree | 223 (88.5%) | 29 (11.5%) |
| Bachelor's Degree or higher | 156 (85.3%) | 27 (14.7%) |
Occupancy by Age of Householder in Star City
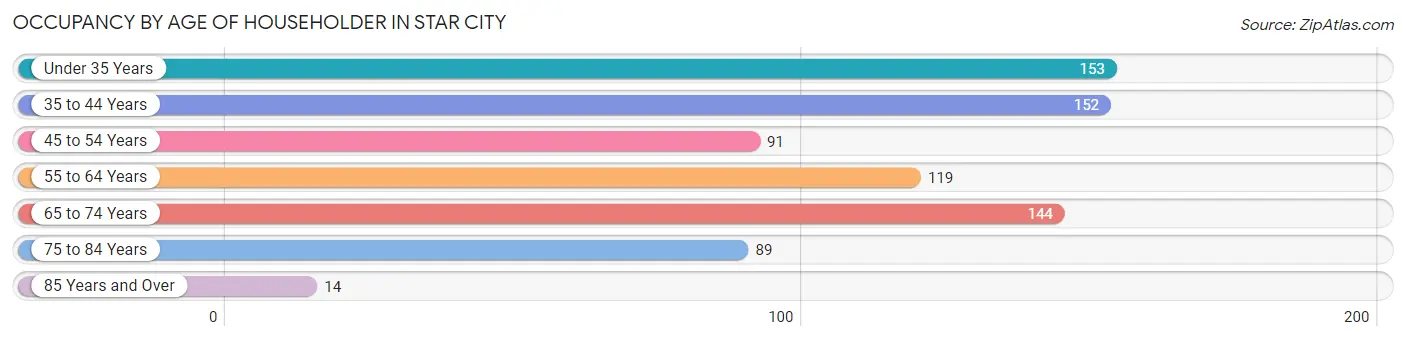
| Age Bracket | # Households | % Households |
| Under 35 Years | 153 | 20.1% |
| 35 to 44 Years | 152 | 20.0% |
| 45 to 54 Years | 91 | 11.9% |
| 55 to 64 Years | 119 | 15.6% |
| 65 to 74 Years | 144 | 18.9% |
| 75 to 84 Years | 89 | 11.7% |
| 85 Years and Over | 14 | 1.8% |
| Total | 762 | 100.0% |
Housing Finances in Star City
Median Income by Occupancy in Star City
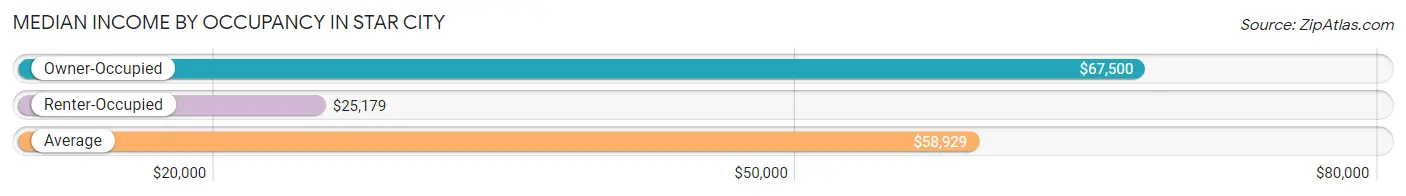
| Occupancy Type | # Households | Median Income |
| Owner-Occupied | 588 (77.2%) | $67,500 |
| Renter-Occupied | 174 (22.8%) | $25,179 |
| Average | 762 (100.0%) | $58,929 |
Occupancy by Householder Income Bracket in Star City
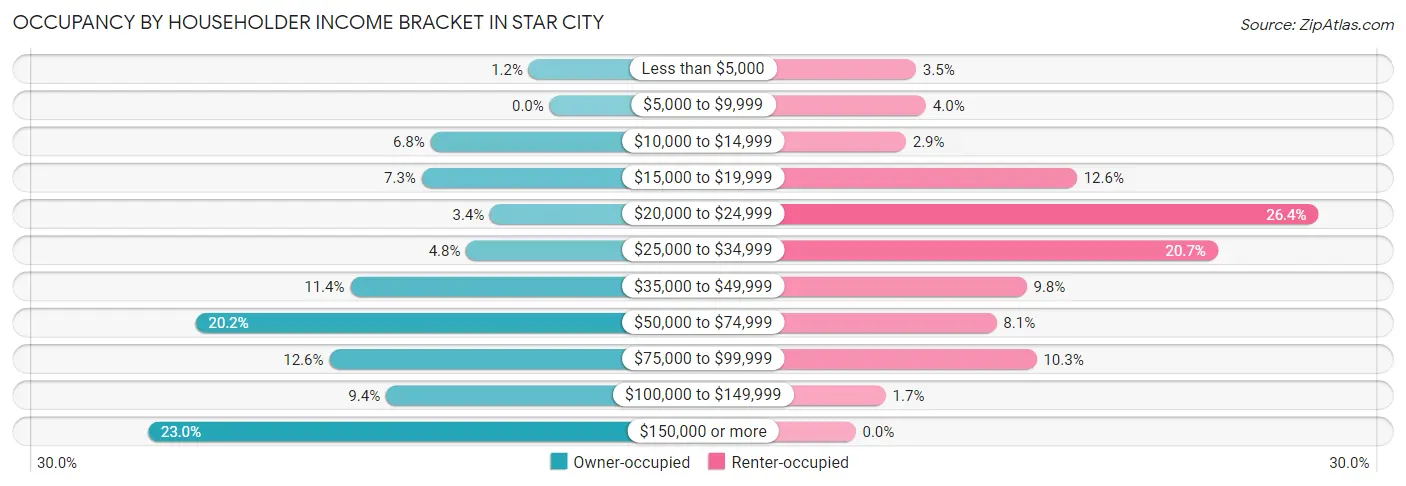
| Income Bracket | Owner-occupied | Renter-occupied |
| Less than $5,000 | 7 (1.2%) | 6 (3.5%) |
| $5,000 to $9,999 | 0 (0.0%) | 7 (4.0%) |
| $10,000 to $14,999 | 40 (6.8%) | 5 (2.9%) |
| $15,000 to $19,999 | 43 (7.3%) | 22 (12.6%) |
| $20,000 to $24,999 | 20 (3.4%) | 46 (26.4%) |
| $25,000 to $34,999 | 28 (4.8%) | 36 (20.7%) |
| $35,000 to $49,999 | 67 (11.4%) | 17 (9.8%) |
| $50,000 to $74,999 | 119 (20.2%) | 14 (8.1%) |
| $75,000 to $99,999 | 74 (12.6%) | 18 (10.3%) |
| $100,000 to $149,999 | 55 (9.3%) | 3 (1.7%) |
| $150,000 or more | 135 (23.0%) | 0 (0.0%) |
| Total | 588 (100.0%) | 174 (100.0%) |
Monthly Housing Cost Tiers in Star City
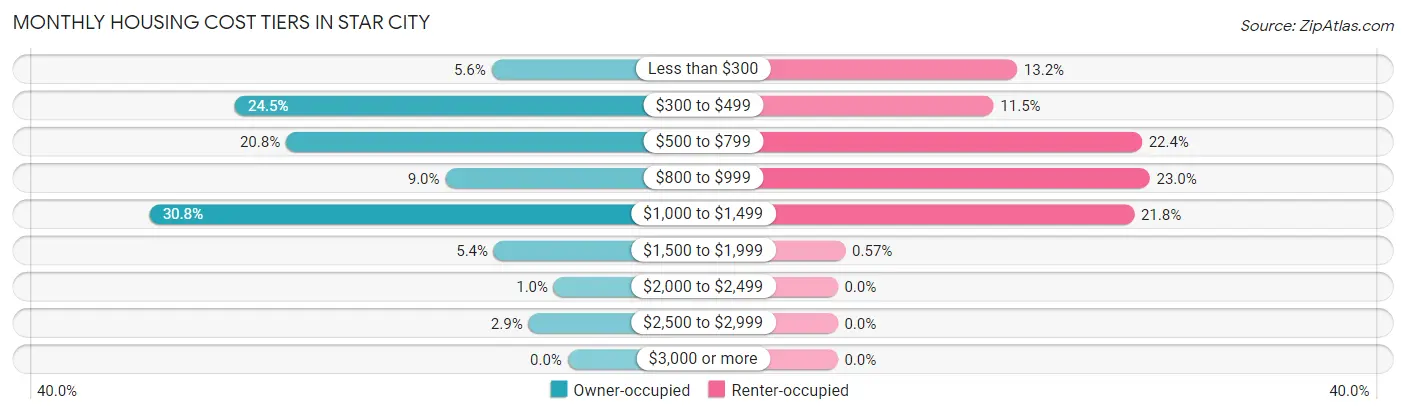
| Monthly Cost | Owner-occupied | Renter-occupied |
| Less than $300 | 33 (5.6%) | 23 (13.2%) |
| $300 to $499 | 144 (24.5%) | 20 (11.5%) |
| $500 to $799 | 122 (20.7%) | 39 (22.4%) |
| $800 to $999 | 53 (9.0%) | 40 (23.0%) |
| $1,000 to $1,499 | 181 (30.8%) | 38 (21.8%) |
| $1,500 to $1,999 | 32 (5.4%) | 1 (0.6%) |
| $2,000 to $2,499 | 6 (1.0%) | 0 (0.0%) |
| $2,500 to $2,999 | 17 (2.9%) | 0 (0.0%) |
| $3,000 or more | 0 (0.0%) | 0 (0.0%) |
| Total | 588 (100.0%) | 174 (100.0%) |
Physical Housing Characteristics in Star City
Housing Structures in Star City
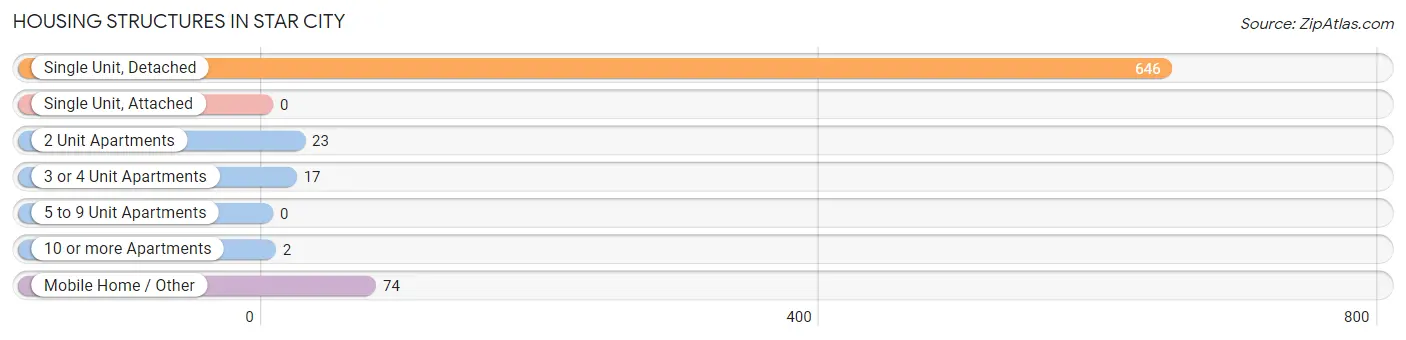
| Structure Type | # Housing Units | % Housing Units |
| Single Unit, Detached | 646 | 84.8% |
| Single Unit, Attached | 0 | 0.0% |
| 2 Unit Apartments | 23 | 3.0% |
| 3 or 4 Unit Apartments | 17 | 2.2% |
| 5 to 9 Unit Apartments | 0 | 0.0% |
| 10 or more Apartments | 2 | 0.3% |
| Mobile Home / Other | 74 | 9.7% |
| Total | 762 | 100.0% |
Housing Structures by Occupancy in Star City
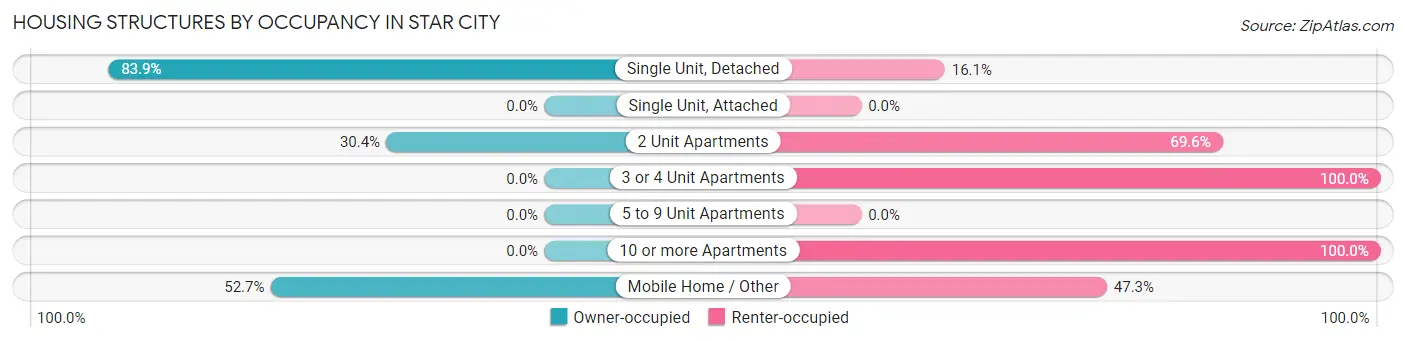
| Structure Type | Owner-occupied | Renter-occupied |
| Single Unit, Detached | 542 (83.9%) | 104 (16.1%) |
| Single Unit, Attached | 0 (0.0%) | 0 (0.0%) |
| 2 Unit Apartments | 7 (30.4%) | 16 (69.6%) |
| 3 or 4 Unit Apartments | 0 (0.0%) | 17 (100.0%) |
| 5 to 9 Unit Apartments | 0 (0.0%) | 0 (0.0%) |
| 10 or more Apartments | 0 (0.0%) | 2 (100.0%) |
| Mobile Home / Other | 39 (52.7%) | 35 (47.3%) |
| Total | 588 (77.2%) | 174 (22.8%) |
Housing Structures by Number of Rooms in Star City
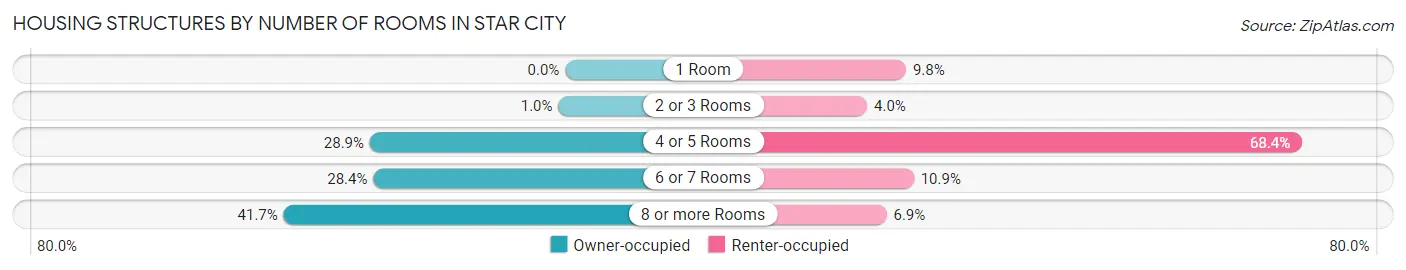
| Number of Rooms | Owner-occupied | Renter-occupied |
| 1 Room | 0 (0.0%) | 17 (9.8%) |
| 2 or 3 Rooms | 6 (1.0%) | 7 (4.0%) |
| 4 or 5 Rooms | 170 (28.9%) | 119 (68.4%) |
| 6 or 7 Rooms | 167 (28.4%) | 19 (10.9%) |
| 8 or more Rooms | 245 (41.7%) | 12 (6.9%) |
| Total | 588 (100.0%) | 174 (100.0%) |
Housing Structure by Heating Type in Star City
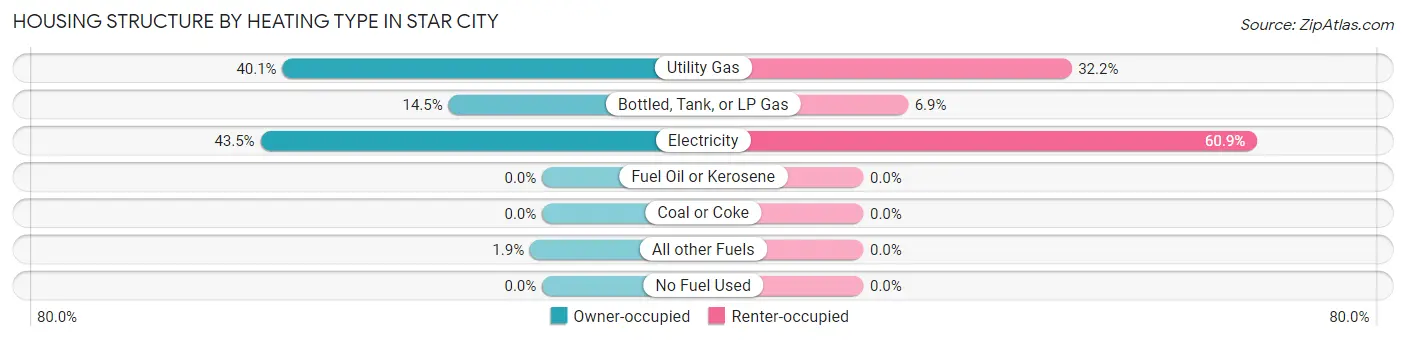
| Heating Type | Owner-occupied | Renter-occupied |
| Utility Gas | 236 (40.1%) | 56 (32.2%) |
| Bottled, Tank, or LP Gas | 85 (14.5%) | 12 (6.9%) |
| Electricity | 256 (43.5%) | 106 (60.9%) |
| Fuel Oil or Kerosene | 0 (0.0%) | 0 (0.0%) |
| Coal or Coke | 0 (0.0%) | 0 (0.0%) |
| All other Fuels | 11 (1.9%) | 0 (0.0%) |
| No Fuel Used | 0 (0.0%) | 0 (0.0%) |
| Total | 588 (100.0%) | 174 (100.0%) |
Household Vehicle Usage in Star City
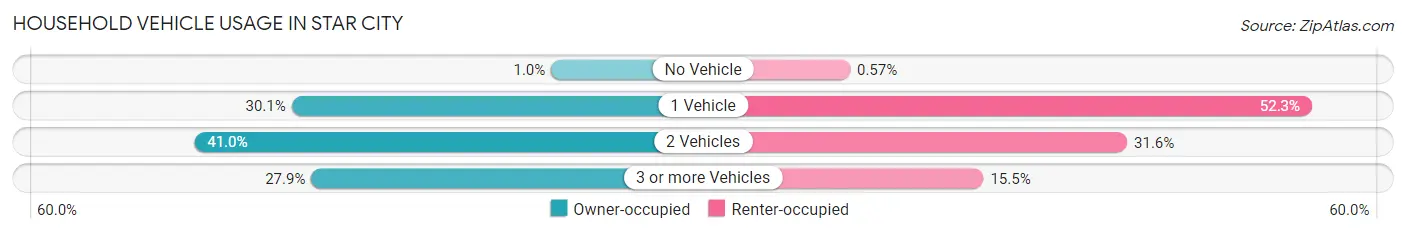
| Vehicles per Household | Owner-occupied | Renter-occupied |
| No Vehicle | 6 (1.0%) | 1 (0.6%) |
| 1 Vehicle | 177 (30.1%) | 91 (52.3%) |
| 2 Vehicles | 241 (41.0%) | 55 (31.6%) |
| 3 or more Vehicles | 164 (27.9%) | 27 (15.5%) |
| Total | 588 (100.0%) | 174 (100.0%) |
Real Estate & Mortgages in Star City
Real Estate and Mortgage Overview in Star City
| Characteristic | Without Mortgage | With Mortgage |
| Housing Units | 268 | 320 |
| Median Property Value | $120,300 | $116,100 |
| Median Household Income | $60,536 | $107 |
| Monthly Housing Costs | $443 | $0 |
| Real Estate Taxes | $832 | $44 |
Property Value by Mortgage Status in Star City
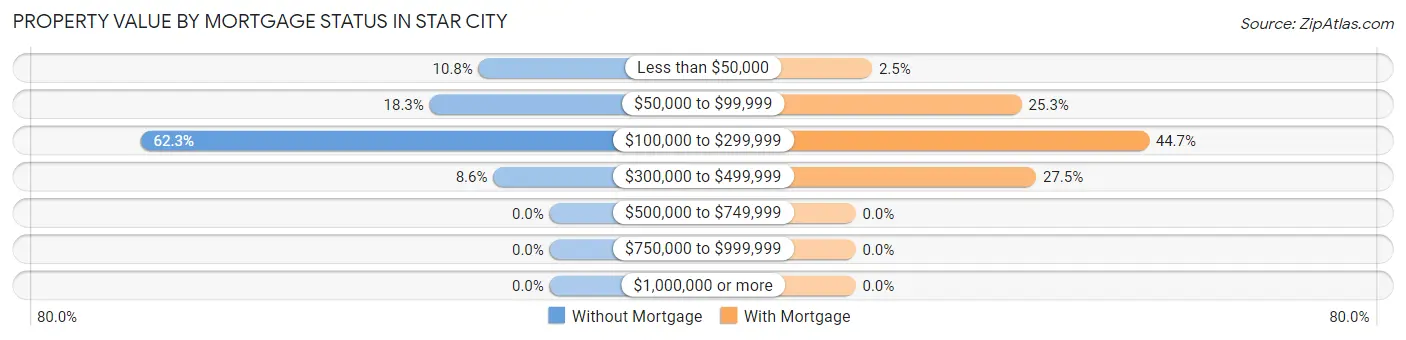
| Property Value | Without Mortgage | With Mortgage |
| Less than $50,000 | 29 (10.8%) | 8 (2.5%) |
| $50,000 to $99,999 | 49 (18.3%) | 81 (25.3%) |
| $100,000 to $299,999 | 167 (62.3%) | 143 (44.7%) |
| $300,000 to $499,999 | 23 (8.6%) | 88 (27.5%) |
| $500,000 to $749,999 | 0 (0.0%) | 0 (0.0%) |
| $750,000 to $999,999 | 0 (0.0%) | 0 (0.0%) |
| $1,000,000 or more | 0 (0.0%) | 0 (0.0%) |
| Total | 268 (100.0%) | 320 (100.0%) |
Household Income by Mortgage Status in Star City
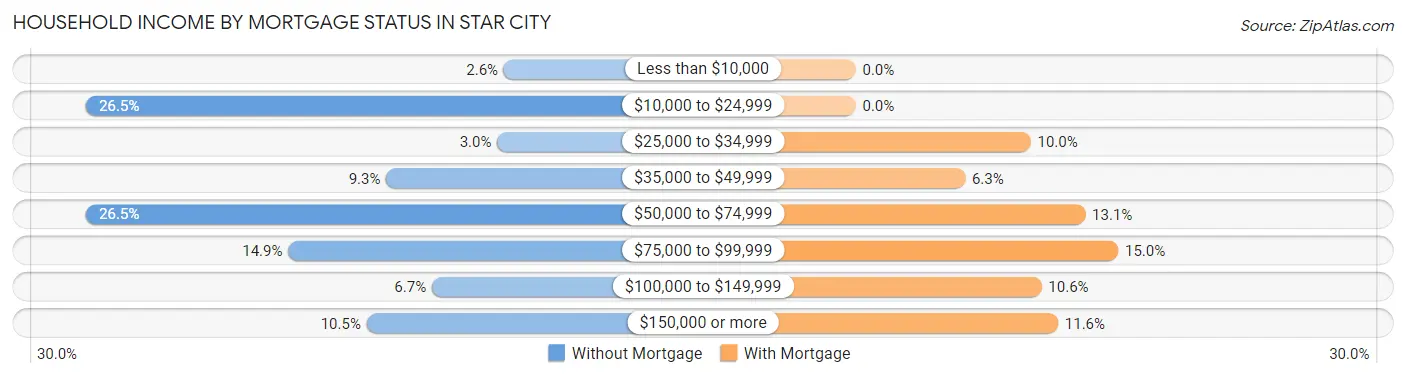
| Household Income | Without Mortgage | With Mortgage |
| Less than $10,000 | 7 (2.6%) | 0 (0.0%) |
| $10,000 to $24,999 | 71 (26.5%) | 0 (0.0%) |
| $25,000 to $34,999 | 8 (3.0%) | 32 (10.0%) |
| $35,000 to $49,999 | 25 (9.3%) | 20 (6.2%) |
| $50,000 to $74,999 | 71 (26.5%) | 42 (13.1%) |
| $75,000 to $99,999 | 40 (14.9%) | 48 (15.0%) |
| $100,000 to $149,999 | 18 (6.7%) | 34 (10.6%) |
| $150,000 or more | 28 (10.4%) | 37 (11.6%) |
| Total | 268 (100.0%) | 320 (100.0%) |
Property Value to Household Income Ratio in Star City
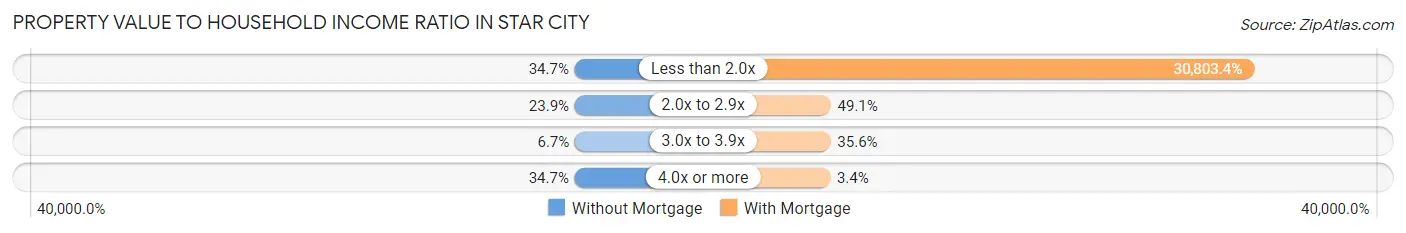
| Value-to-Income Ratio | Without Mortgage | With Mortgage |
| Less than 2.0x | 93 (34.7%) | 98,571 (30,803.4%) |
| 2.0x to 2.9x | 64 (23.9%) | 157 (49.1%) |
| 3.0x to 3.9x | 18 (6.7%) | 114 (35.6%) |
| 4.0x or more | 93 (34.7%) | 11 (3.4%) |
| Total | 268 (100.0%) | 320 (100.0%) |
Real Estate Taxes by Mortgage Status in Star City
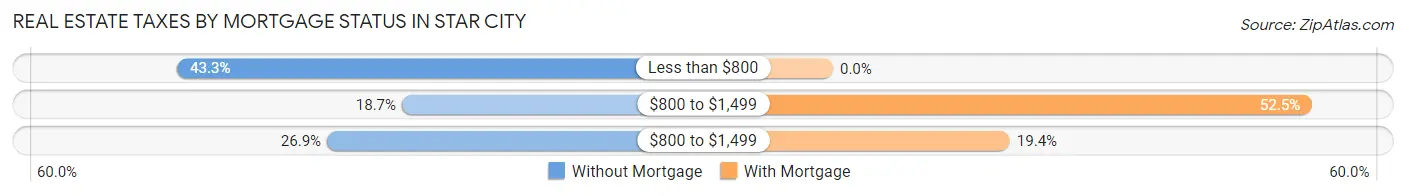
| Property Taxes | Without Mortgage | With Mortgage |
| Less than $800 | 116 (43.3%) | 0 (0.0%) |
| $800 to $1,499 | 50 (18.7%) | 168 (52.5%) |
| $800 to $1,499 | 72 (26.9%) | 62 (19.4%) |
| Total | 268 (100.0%) | 320 (100.0%) |
Health & Disability in Star City
Health Insurance Coverage by Age in Star City
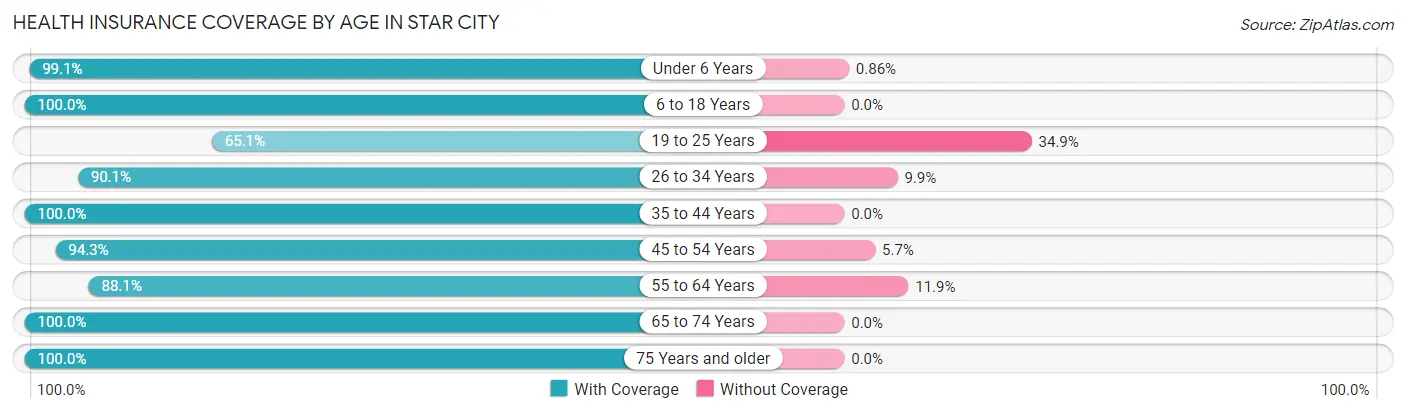
| Age Bracket | With Coverage | Without Coverage |
| Under 6 Years | 230 (99.1%) | 2 (0.9%) |
| 6 to 18 Years | 415 (100.0%) | 0 (0.0%) |
| 19 to 25 Years | 136 (65.1%) | 73 (34.9%) |
| 26 to 34 Years | 236 (90.1%) | 26 (9.9%) |
| 35 to 44 Years | 286 (100.0%) | 0 (0.0%) |
| 45 to 54 Years | 197 (94.3%) | 12 (5.7%) |
| 55 to 64 Years | 192 (88.1%) | 26 (11.9%) |
| 65 to 74 Years | 208 (100.0%) | 0 (0.0%) |
| 75 Years and older | 140 (100.0%) | 0 (0.0%) |
| Total | 2,040 (93.6%) | 139 (6.4%) |
Health Insurance Coverage by Citizenship Status in Star City

| Citizenship Status | With Coverage | Without Coverage |
| Native Born | 230 (99.1%) | 2 (0.9%) |
| Foreign Born, Citizen | 415 (100.0%) | 0 (0.0%) |
| Foreign Born, not a Citizen | 136 (65.1%) | 73 (34.9%) |
Health Insurance Coverage by Household Income in Star City
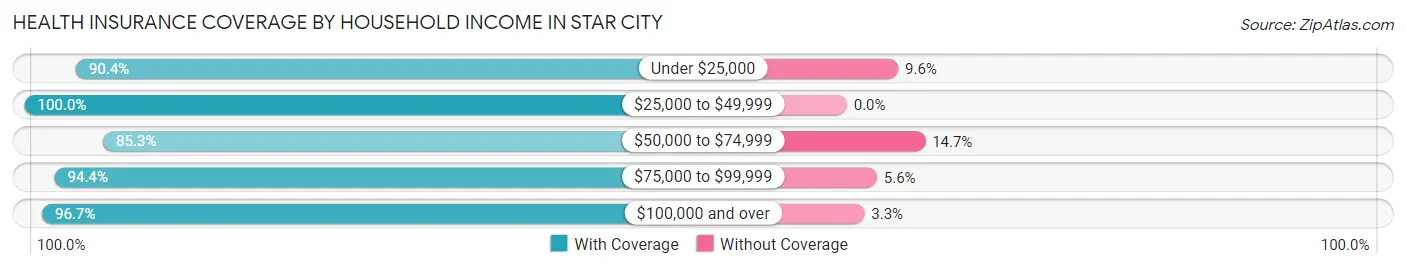
| Household Income | With Coverage | Without Coverage |
| Under $25,000 | 404 (90.4%) | 43 (9.6%) |
| $25,000 to $49,999 | 294 (100.0%) | 0 (0.0%) |
| $50,000 to $74,999 | 302 (85.3%) | 52 (14.7%) |
| $75,000 to $99,999 | 335 (94.4%) | 20 (5.6%) |
| $100,000 and over | 705 (96.7%) | 24 (3.3%) |
Public vs Private Health Insurance Coverage by Age in Star City
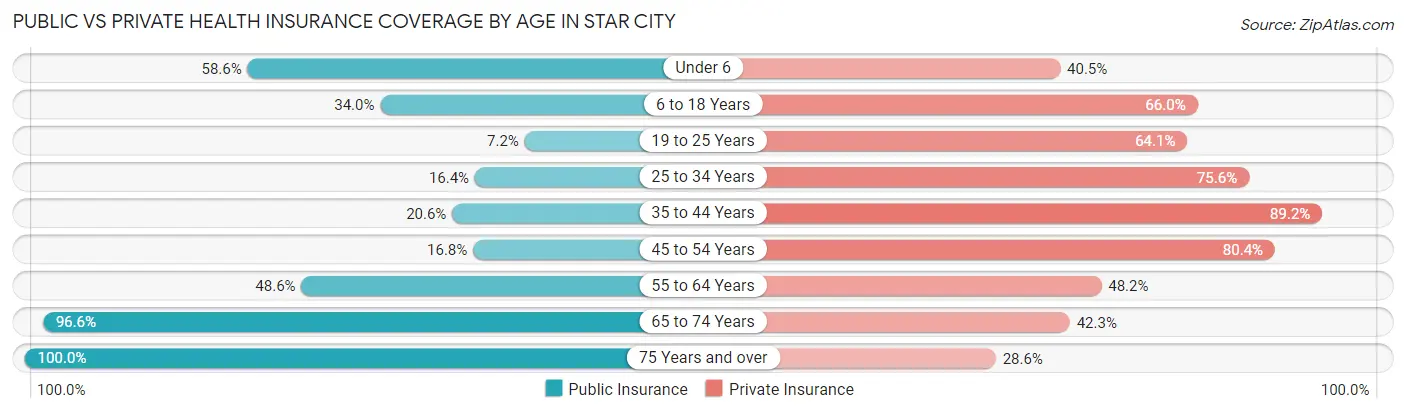
| Age Bracket | Public Insurance | Private Insurance |
| Under 6 | 136 (58.6%) | 94 (40.5%) |
| 6 to 18 Years | 141 (34.0%) | 274 (66.0%) |
| 19 to 25 Years | 15 (7.2%) | 134 (64.1%) |
| 25 to 34 Years | 43 (16.4%) | 198 (75.6%) |
| 35 to 44 Years | 59 (20.6%) | 255 (89.2%) |
| 45 to 54 Years | 35 (16.8%) | 168 (80.4%) |
| 55 to 64 Years | 106 (48.6%) | 105 (48.2%) |
| 65 to 74 Years | 201 (96.6%) | 88 (42.3%) |
| 75 Years and over | 140 (100.0%) | 40 (28.6%) |
| Total | 876 (40.2%) | 1,356 (62.2%) |
Disability Status by Sex by Age in Star City
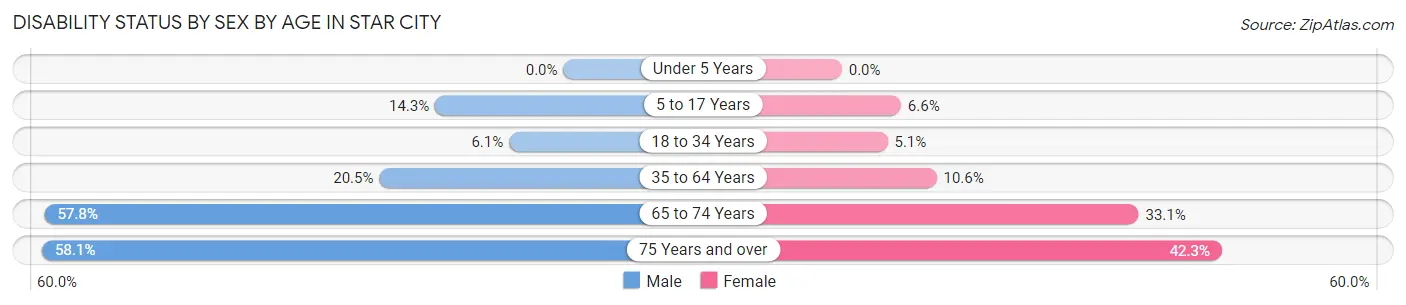
| Age Bracket | Male | Female |
| Under 5 Years | 0 (0.0%) | 0 (0.0%) |
| 5 to 17 Years | 28 (14.3%) | 15 (6.6%) |
| 18 to 34 Years | 13 (6.0%) | 14 (5.1%) |
| 35 to 64 Years | 49 (20.5%) | 50 (10.5%) |
| 65 to 74 Years | 52 (57.8%) | 39 (33.1%) |
| 75 Years and over | 36 (58.1%) | 33 (42.3%) |
Disability Class by Sex by Age in Star City
Disability Class: Hearing Difficulty
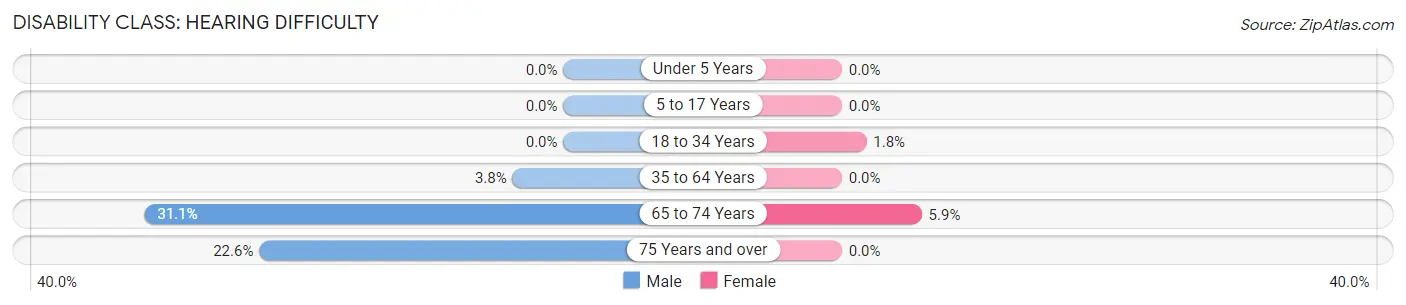
| Age Bracket | Male | Female |
| Under 5 Years | 0 (0.0%) | 0 (0.0%) |
| 5 to 17 Years | 0 (0.0%) | 0 (0.0%) |
| 18 to 34 Years | 0 (0.0%) | 5 (1.8%) |
| 35 to 64 Years | 9 (3.8%) | 0 (0.0%) |
| 65 to 74 Years | 28 (31.1%) | 7 (5.9%) |
| 75 Years and over | 14 (22.6%) | 0 (0.0%) |
Disability Class: Vision Difficulty
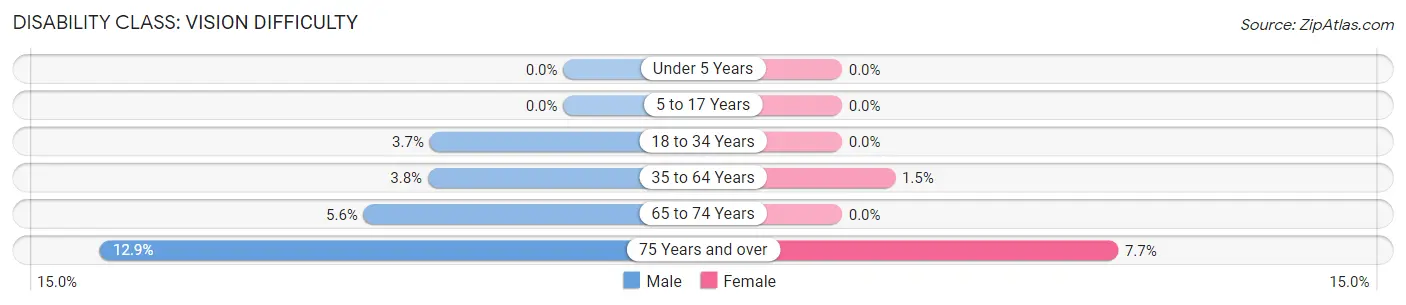
| Age Bracket | Male | Female |
| Under 5 Years | 0 (0.0%) | 0 (0.0%) |
| 5 to 17 Years | 0 (0.0%) | 0 (0.0%) |
| 18 to 34 Years | 8 (3.7%) | 0 (0.0%) |
| 35 to 64 Years | 9 (3.8%) | 7 (1.5%) |
| 65 to 74 Years | 5 (5.6%) | 0 (0.0%) |
| 75 Years and over | 8 (12.9%) | 6 (7.7%) |
Disability Class: Cognitive Difficulty
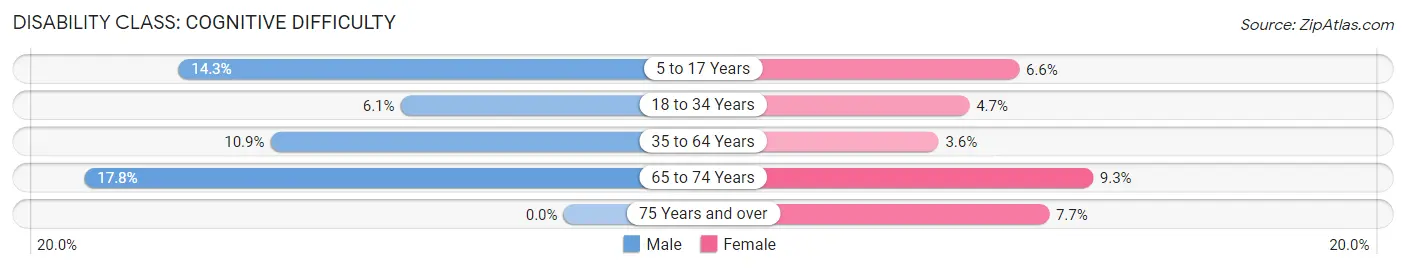
| Age Bracket | Male | Female |
| 5 to 17 Years | 28 (14.3%) | 15 (6.6%) |
| 18 to 34 Years | 13 (6.0%) | 13 (4.7%) |
| 35 to 64 Years | 26 (10.9%) | 17 (3.6%) |
| 65 to 74 Years | 16 (17.8%) | 11 (9.3%) |
| 75 Years and over | 0 (0.0%) | 6 (7.7%) |
Disability Class: Ambulatory Difficulty
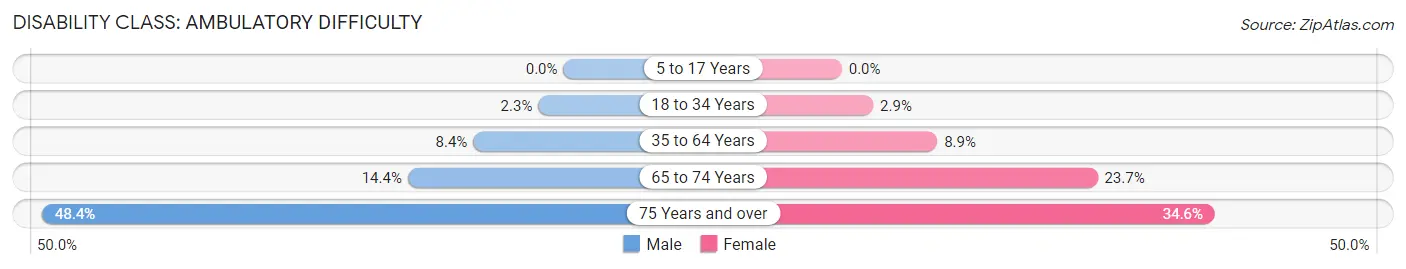
| Age Bracket | Male | Female |
| 5 to 17 Years | 0 (0.0%) | 0 (0.0%) |
| 18 to 34 Years | 5 (2.3%) | 8 (2.9%) |
| 35 to 64 Years | 20 (8.4%) | 42 (8.9%) |
| 65 to 74 Years | 13 (14.4%) | 28 (23.7%) |
| 75 Years and over | 30 (48.4%) | 27 (34.6%) |
Disability Class: Self-Care Difficulty
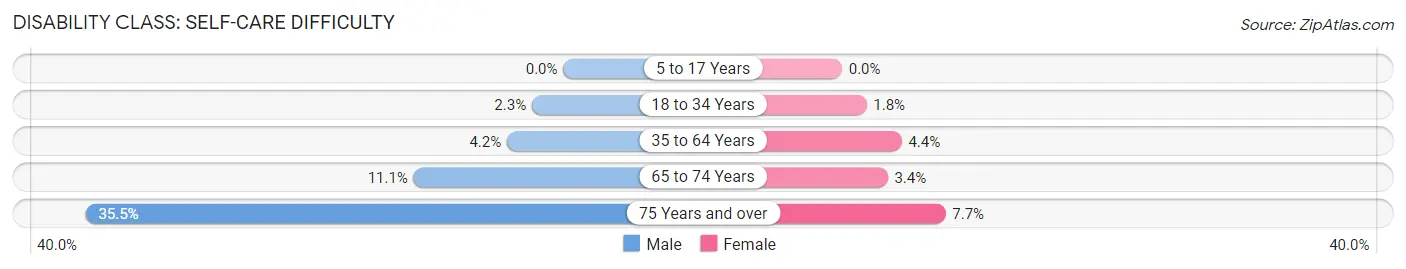
| Age Bracket | Male | Female |
| 5 to 17 Years | 0 (0.0%) | 0 (0.0%) |
| 18 to 34 Years | 5 (2.3%) | 5 (1.8%) |
| 35 to 64 Years | 10 (4.2%) | 21 (4.4%) |
| 65 to 74 Years | 10 (11.1%) | 4 (3.4%) |
| 75 Years and over | 22 (35.5%) | 6 (7.7%) |
Technology Access in Star City
Computing Device Access in Star City
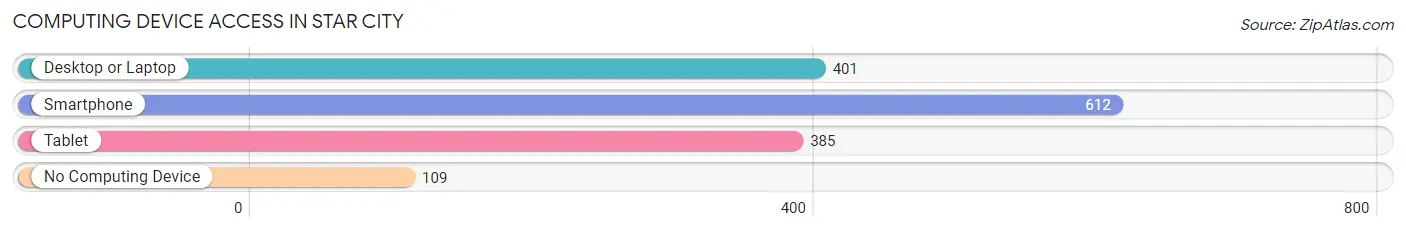
| Device Type | # Households | % Households |
| Desktop or Laptop | 401 | 52.6% |
| Smartphone | 612 | 80.3% |
| Tablet | 385 | 50.5% |
| No Computing Device | 109 | 14.3% |
| Total | 762 | 100.0% |
Internet Access in Star City
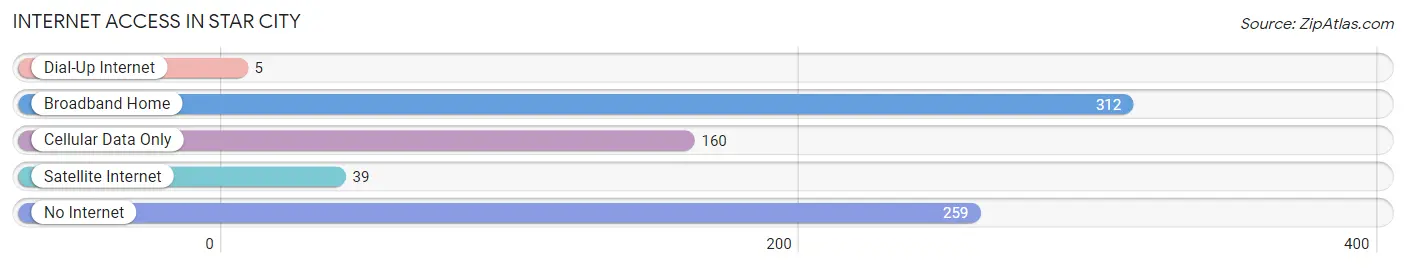
| Internet Type | # Households | % Households |
| Dial-Up Internet | 5 | 0.7% |
| Broadband Home | 312 | 40.9% |
| Cellular Data Only | 160 | 21.0% |
| Satellite Internet | 39 | 5.1% |
| No Internet | 259 | 34.0% |
| Total | 762 | 100.0% |
Star City Summary
Star City is a city located in Lincoln County, Arkansas, United States. It is the county seat of Lincoln County and is located in the southeastern part of the state. The population was 2,945 at the 2010 census.
Geography
Star City is located at 34°45'25" North, 91°37'17" West (34.756944, -91.621389). According to the United States Census Bureau, the city has a total area of 2.2 square miles (5.7 km2), all land.
History
Star City was founded in 1871 by the Star City Land Company. The company was formed by a group of investors from Little Rock, Arkansas, who purchased the land from the Choctaw Indians. The town was named after the star-shaped design of the original plat.
The first post office was established in 1872 and the first school was built in 1873. The town was incorporated in 1876.
In the early 1900s, Star City was a thriving agricultural center. The town was home to several cotton gins, a sawmill, a grist mill, and a brick factory.
In the 1950s, Star City began to experience a decline in population as many of its citizens moved away in search of better economic opportunities. The population of Star City has remained relatively stable since then.
Economy
Star City is a small rural community with a population of just over 2,900 people. The economy of Star City is largely based on agriculture and related industries. The town is home to several poultry processing plants, as well as a number of small businesses.
The town is also home to a number of manufacturing companies, including a furniture manufacturer, a plastic injection molding company, and a metal fabrication company.
Demographics
As of the 2010 census, there were 2,945 people, 1,093 households, and 745 families residing in the city. The population density was 1,323.2 people per square mile (509.7/km2). There were 1,183 housing units at an average density of 531.2 per square mile (204.9/km2). The racial makeup of the city was 79.2% White, 17.7% African American, 0.3% Native American, 0.3% Asian, 0.1% Pacific Islander, 0.7% from other races, and 1.9% from two or more races. Hispanic or Latino of any race were 2.2% of the population.
There were 1,093 households, out of which 33.2% had children under the age of 18 living with them, 46.2% were married couples living together, 17.2% had a female householder with no husband present, and 31.7% were non-families. 27.2% of all households were made up of individuals, and 12.7% had someone living alone who was 65 years of age or older. The average household size was 2.50 and the average family size was 3.02.
In the city, the population was spread out, with 25.7% under the age of 18, 8.7% from 18 to 24, 27.2% from 25 to 44, 22.7% from 45 to 64, and 15.7% who were 65 years of age or older. The median age was 36 years. For every 100 females, there were 87.2 males. For every 100 females age 18 and over, there were 82.3 males.
The median income for a household in the city was $27,917, and the median income for a family was $32,917. Males had a median income of $27,917 versus $20,000 for females. The per capita income for the city was $13,917. About 17.2% of families and 20.7% of the population were below the poverty line, including 28.2% of those under age 18 and 16.7% of those age 65 or over.
Common Questions
What is Per Capita Income in Star City?
Per Capita income in Star City is $26,265.
What is the Median Family Income in Star City?
Median Family Income in Star City is $66,607.
What is the Median Household income in Star City?
Median Household Income in Star City is $58,929.
What is Income or Wage Gap in Star City?
Income or Wage Gap in Star City is 2.5%.
Women in Star City earn 97.5 cents for every dollar earned by a man.
What is Family Income Deficit in Star City?
Family Income Deficit in Star City is $11,171.
Families that are below poverty line in Star City earn $11,171 less on average than the poverty threshold level.
What is Inequality or Gini Index in Star City?
Inequality or Gini Index in Star City is 0.45.
What is the Total Population of Star City?
Total Population of Star City is 2,299.
What is the Total Male Population of Star City?
Total Male Population of Star City is 919.
What is the Total Female Population of Star City?
Total Female Population of Star City is 1,380.
What is the Ratio of Males per 100 Females in Star City?
There are 66.59 Males per 100 Females in Star City.
What is the Ratio of Females per 100 Males in Star City?
There are 150.16 Females per 100 Males in Star City.
What is the Median Population Age in Star City?
Median Population Age in Star City is 36.3 Years.
What is the Average Family Size in Star City
Average Family Size in Star City is 3.5 People.
What is the Average Household Size in Star City
Average Household Size in Star City is 2.9 People.
How Large is the Labor Force in Star City?
There are 1,067 People in the Labor Forcein in Star City.
What is the Percentage of People in the Labor Force in Star City?
60.6% of People are in the Labor Force in Star City.
What is the Unemployment Rate in Star City?
Unemployment Rate in Star City is 2.3%.