Sweet Home, AR Map & Demographics
Sweet Home Map
Sweet Home Overview
$27,568
PER CAPITA INCOME
$23,192
AVG HOUSEHOLD INCOME
0.74
INEQUALITY / GINI INDEX
973
TOTAL POPULATION
604
MALE POPULATION
369
FEMALE POPULATION
163.69
MALES / 100 FEMALES
61.09
FEMALES / 100 MALES
38.3
MEDIAN AGE
5.1
AVG FAMILY SIZE
3.5
AVG HOUSEHOLD SIZE
440
LABOR FORCE [ PEOPLE ]
56.2%
PERCENT IN LABOR FORCE
11.6%
UNEMPLOYMENT RATE
Sweet Home Area Codes
Income in Sweet Home
Income Overview in Sweet Home
| Characteristic | Number | Measure |
| Per Capita Income | 973 | $27,568 |
| Median Family Income | 146 | $0 |
| Mean Family Income | 146 | $63,497 |
| Median Household Income | 274 | $23,192 |
| Mean Household Income | 274 | $82,565 |
| Income Deficit | 146 | $0 |
| Wage / Income Gap (%) | 973 | 0.00% |
| Wage / Income Gap ($) | 973 | 100.00¢ per $1 |
| Gini / Inequality Index | 973 | 0.74 |
Earnings by Sex in Sweet Home
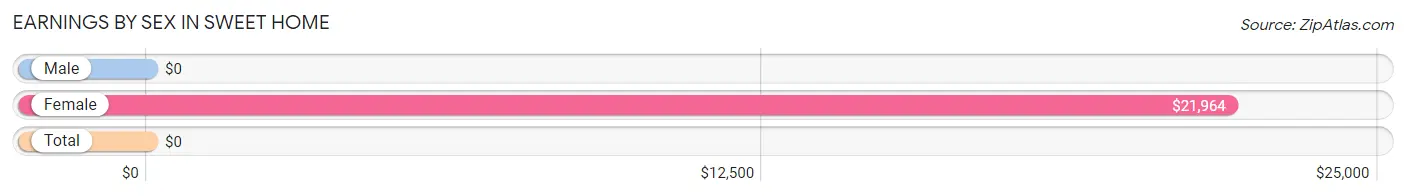
| Sex | Number | Average Earnings |
| Male | 246 (60.9%) | $0 |
| Female | 158 (39.1%) | $21,964 |
| Total | 404 (100.0%) | $0 |
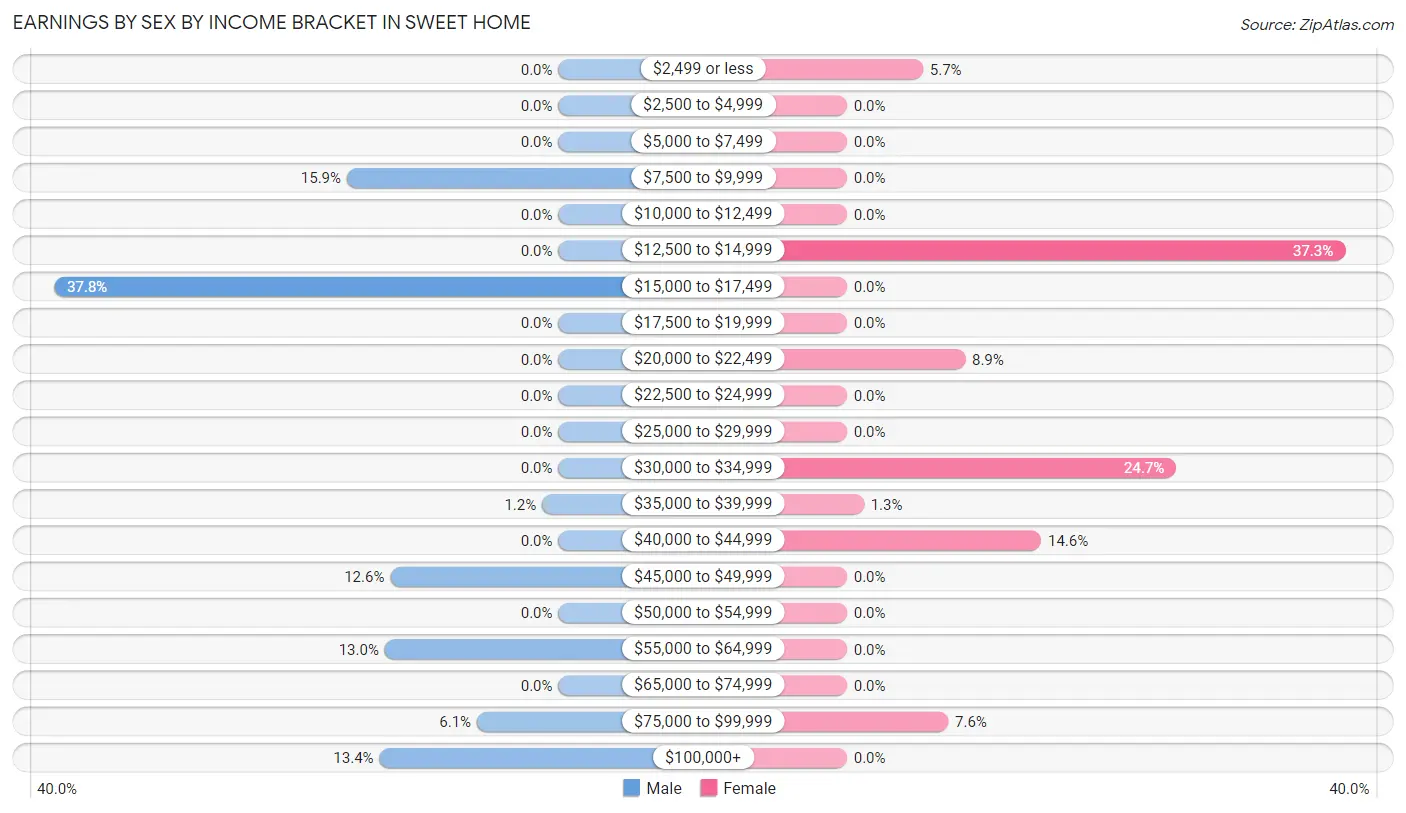
Earnings by Sex by Income Bracket in Sweet Home
The most common earnings brackets in Sweet Home are $15,000 to $17,499 for men (93 | 37.8%) and $12,500 to $14,999 for women (59 | 37.3%).
| Income | Male | Female |
| $2,499 or less | 0 (0.0%) | 9 (5.7%) |
| $2,500 to $4,999 | 0 (0.0%) | 0 (0.0%) |
| $5,000 to $7,499 | 0 (0.0%) | 0 (0.0%) |
| $7,500 to $9,999 | 39 (15.9%) | 0 (0.0%) |
| $10,000 to $12,499 | 0 (0.0%) | 0 (0.0%) |
| $12,500 to $14,999 | 0 (0.0%) | 59 (37.3%) |
| $15,000 to $17,499 | 93 (37.8%) | 0 (0.0%) |
| $17,500 to $19,999 | 0 (0.0%) | 0 (0.0%) |
| $20,000 to $22,499 | 0 (0.0%) | 14 (8.9%) |
| $22,500 to $24,999 | 0 (0.0%) | 0 (0.0%) |
| $25,000 to $29,999 | 0 (0.0%) | 0 (0.0%) |
| $30,000 to $34,999 | 0 (0.0%) | 39 (24.7%) |
| $35,000 to $39,999 | 3 (1.2%) | 2 (1.3%) |
| $40,000 to $44,999 | 0 (0.0%) | 23 (14.6%) |
| $45,000 to $49,999 | 31 (12.6%) | 0 (0.0%) |
| $50,000 to $54,999 | 0 (0.0%) | 0 (0.0%) |
| $55,000 to $64,999 | 32 (13.0%) | 0 (0.0%) |
| $65,000 to $74,999 | 0 (0.0%) | 0 (0.0%) |
| $75,000 to $99,999 | 15 (6.1%) | 12 (7.6%) |
| $100,000+ | 33 (13.4%) | 0 (0.0%) |
| Total | 246 (100.0%) | 158 (100.0%) |
Earnings by Sex by Educational Attainment in Sweet Home
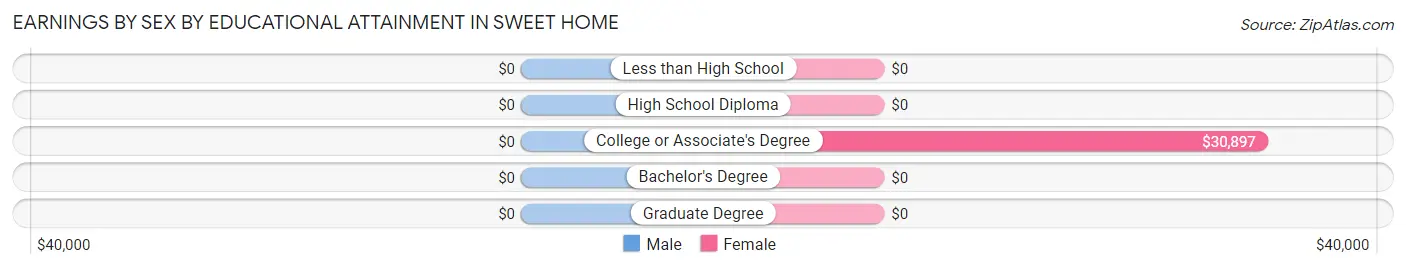
| Educational Attainment | Male Income | Female Income |
| Less than High School | - | - |
| High School Diploma | - | - |
| College or Associate's Degree | - | - |
| Bachelor's Degree | - | - |
| Graduate Degree | - | - |
| Total | - | - |
Family Income in Sweet Home
Family Income Brackets in Sweet Home
According to the Sweet Home family income data, there are 50 families falling into the $75,000 to $99,999 income range, which is the most common income bracket and makes up 34.3% of all families.
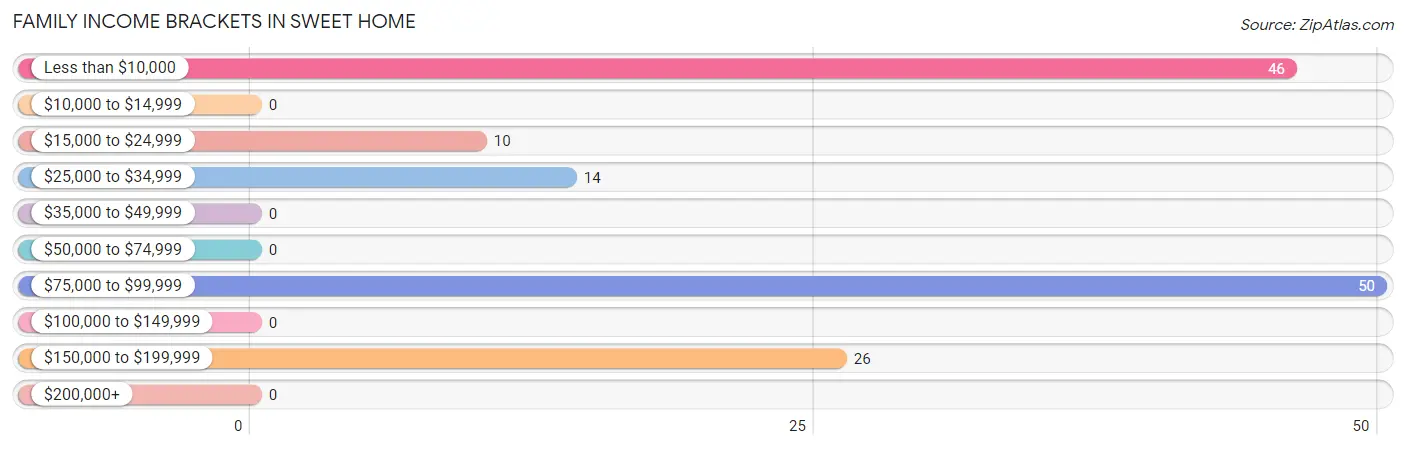
| Income Bracket | # Families | % Families |
| Less than $10,000 | 46 | 31.5% |
| $10,000 to $14,999 | 0 | 0.0% |
| $15,000 to $24,999 | 10 | 6.8% |
| $25,000 to $34,999 | 14 | 9.6% |
| $35,000 to $49,999 | 0 | 0.0% |
| $50,000 to $74,999 | 0 | 0.0% |
| $75,000 to $99,999 | 50 | 34.2% |
| $100,000 to $149,999 | 0 | 0.0% |
| $150,000 to $199,999 | 26 | 17.8% |
| $200,000+ | 0 | 0.0% |
Family Income by Famaliy Size in Sweet Home
| Income Bracket | # Families | Median Income |
| 2-Person Families | 19 (13.0%) | $0 |
| 3-Person Families | 85 (58.2%) | $0 |
| 4-Person Families | 12 (8.2%) | $0 |
| 5-Person Families | 0 (0.0%) | $0 |
| 6-Person Families | 16 (11.0%) | $0 |
| 7+ Person Families | 14 (9.6%) | $0 |
| Total | 146 (100.0%) | $0 |
Family Income by Number of Earners in Sweet Home
| Number of Earners | # Families | Median Income |
| No Earners | 10 (6.9%) | $0 |
| 1 Earner | 69 (47.3%) | $0 |
| 2 Earners | 12 (8.2%) | $0 |
| 3+ Earners | 55 (37.7%) | $0 |
| Total | 146 (100.0%) | $0 |
Household Income in Sweet Home
Household Income Brackets in Sweet Home
With 97 households falling in the category, the $15,000 to $24,999 income range is the most frequent in Sweet Home, accounting for 35.4% of all households.
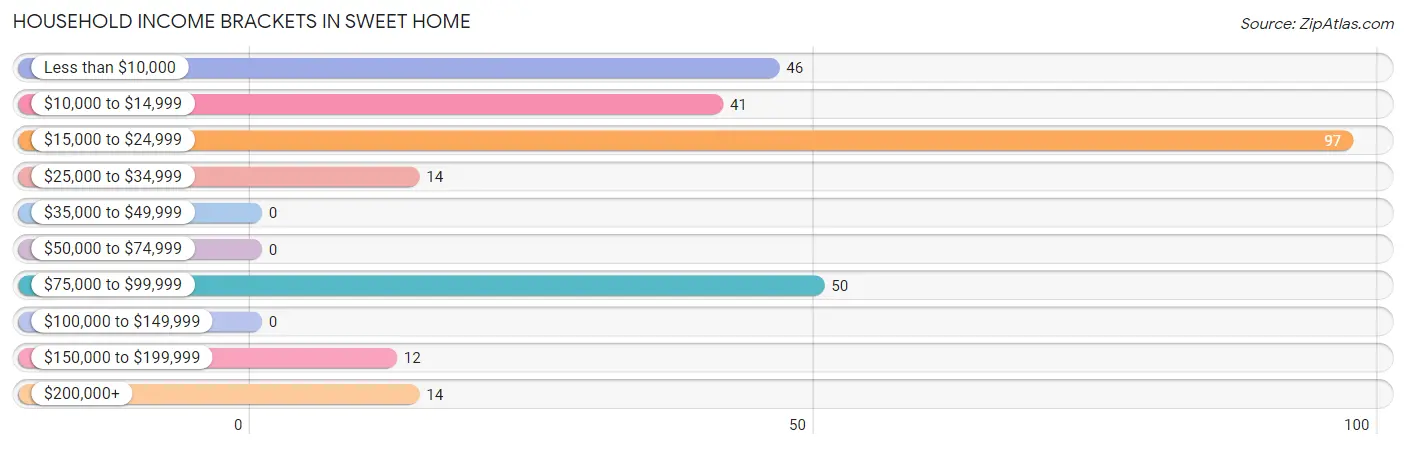
| Income Bracket | # Households | % Households |
| Less than $10,000 | 46 | 16.8% |
| $10,000 to $14,999 | 41 | 15.0% |
| $15,000 to $24,999 | 97 | 35.4% |
| $25,000 to $34,999 | 14 | 5.1% |
| $35,000 to $49,999 | 0 | 0.0% |
| $50,000 to $74,999 | 0 | 0.0% |
| $75,000 to $99,999 | 50 | 18.2% |
| $100,000 to $149,999 | 0 | 0.0% |
| $150,000 to $199,999 | 12 | 4.4% |
| $200,000+ | 14 | 5.1% |
Household Income by Householder Age in Sweet Home
The median household income in Sweet Home is $23,192, with the highest median household income of $23,136 found in the 45 to 64 years age bracket for the primary householder. A total of 110 households (40.2%) fall into this category.
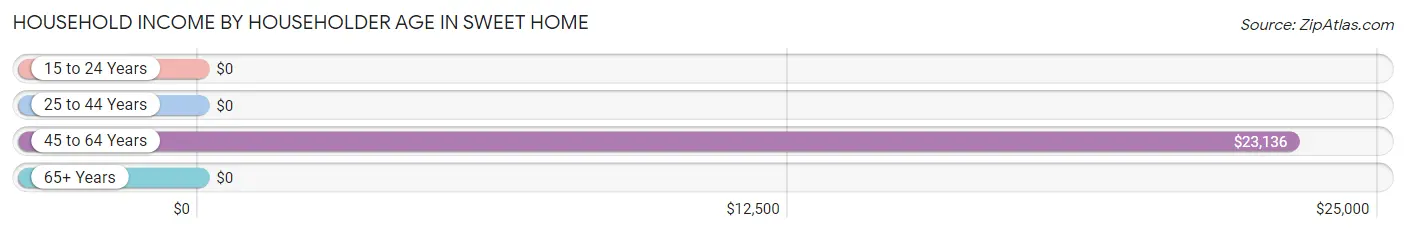
| Income Bracket | # Households | Median Income |
| 15 to 24 Years | 0 (0.0%) | $0 |
| 25 to 44 Years | 74 (27.0%) | $0 |
| 45 to 64 Years | 110 (40.2%) | $23,136 |
| 65+ Years | 90 (32.9%) | $0 |
| Total | 274 (100.0%) | $23,192 |
Poverty in Sweet Home
Income Below Poverty by Sex and Age in Sweet Home
With 35.4% poverty level for males and 56.9% for females among the residents of Sweet Home, 12 to 14 year old males and 5 year old females are the most vulnerable to poverty, with 59 males (100.0%) and 15 females (100.0%) in their respective age groups living below the poverty level.
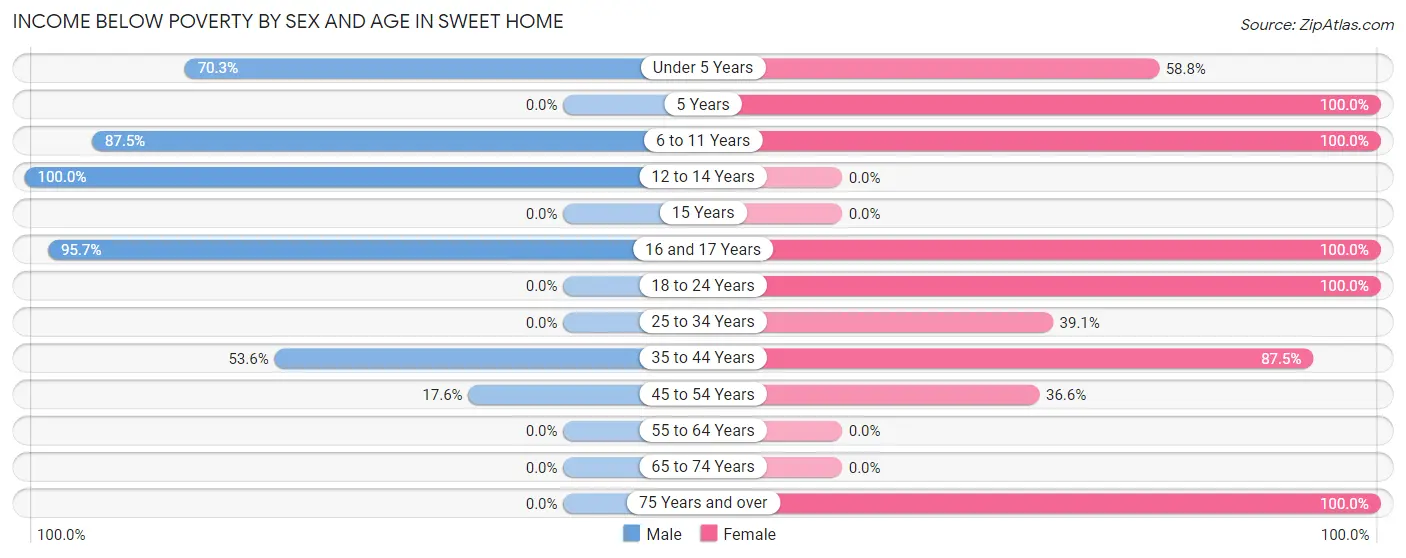
| Age Bracket | Male | Female |
| Under 5 Years | 26 (70.3%) | 20 (58.8%) |
| 5 Years | 0 (0.0%) | 15 (100.0%) |
| 6 to 11 Years | 14 (87.5%) | 27 (100.0%) |
| 12 to 14 Years | 59 (100.0%) | 0 (0.0%) |
| 15 Years | 0 (0.0%) | 0 (0.0%) |
| 16 and 17 Years | 44 (95.7%) | 19 (100.0%) |
| 18 to 24 Years | 0 (0.0%) | 48 (100.0%) |
| 25 to 34 Years | 0 (0.0%) | 9 (39.1%) |
| 35 to 44 Years | 37 (53.6%) | 14 (87.5%) |
| 45 to 54 Years | 34 (17.6%) | 41 (36.6%) |
| 55 to 64 Years | 0 (0.0%) | 0 (0.0%) |
| 65 to 74 Years | 0 (0.0%) | 0 (0.0%) |
| 75 Years and over | 0 (0.0%) | 17 (100.0%) |
| Total | 214 (35.4%) | 210 (56.9%) |
Income Above Poverty by Sex and Age in Sweet Home
According to the poverty statistics in Sweet Home, males aged 15 years and females aged 65 to 74 years are the age groups that are most secure financially, with 100.0% of males and 100.0% of females in these age groups living above the poverty line.
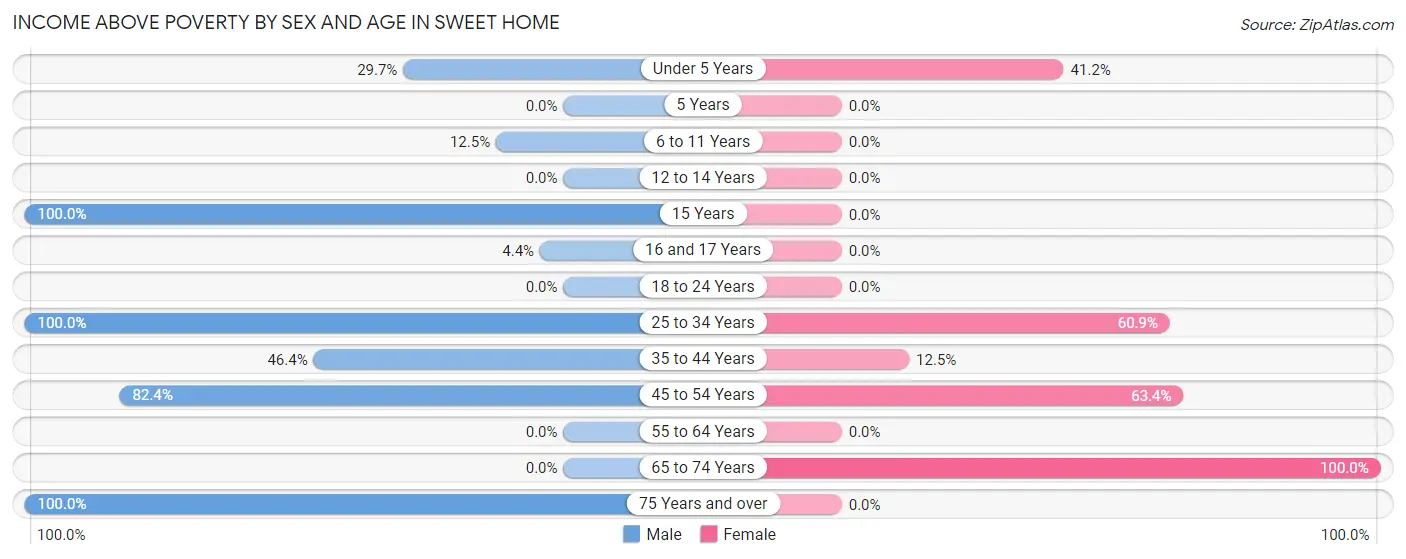
| Age Bracket | Male | Female |
| Under 5 Years | 11 (29.7%) | 14 (41.2%) |
| 5 Years | 0 (0.0%) | 0 (0.0%) |
| 6 to 11 Years | 2 (12.5%) | 0 (0.0%) |
| 12 to 14 Years | 0 (0.0%) | 0 (0.0%) |
| 15 Years | 2 (100.0%) | 0 (0.0%) |
| 16 and 17 Years | 2 (4.3%) | 0 (0.0%) |
| 18 to 24 Years | 0 (0.0%) | 0 (0.0%) |
| 25 to 34 Years | 142 (100.0%) | 14 (60.9%) |
| 35 to 44 Years | 32 (46.4%) | 2 (12.5%) |
| 45 to 54 Years | 159 (82.4%) | 71 (63.4%) |
| 55 to 64 Years | 0 (0.0%) | 0 (0.0%) |
| 65 to 74 Years | 0 (0.0%) | 58 (100.0%) |
| 75 Years and over | 40 (100.0%) | 0 (0.0%) |
| Total | 390 (64.6%) | 159 (43.1%) |
Income Below Poverty Among Married-Couple Families in Sweet Home
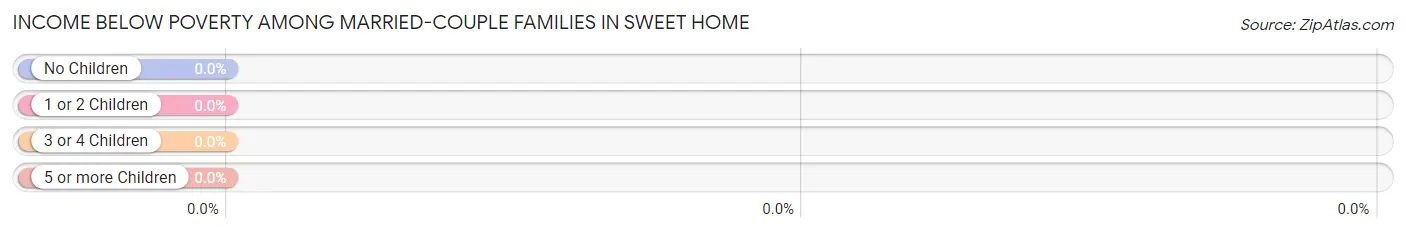
| Children | Above Poverty | Below Poverty |
| No Children | 23 (100.0%) | 0 (0.0%) |
| 1 or 2 Children | 12 (100.0%) | 0 (0.0%) |
| 3 or 4 Children | 2 (100.0%) | 0 (0.0%) |
| 5 or more Children | 0 (0.0%) | 0 (0.0%) |
| Total | 37 (100.0%) | 0 (0.0%) |
Income Below Poverty Among Single-Parent Households in Sweet Home
According to the poverty data in Sweet Home, 100.0% or 37 single-father households and 31.9% or 23 single-mother households are living below the poverty line. Among single-father households, those with 1 or 2 children have the highest poverty rate, with 37 households (100.0%) experiencing poverty. Likewise, among single-mother households, those with 1 or 2 children have the highest poverty rate, with 9 households (100.0%) falling below the poverty line.
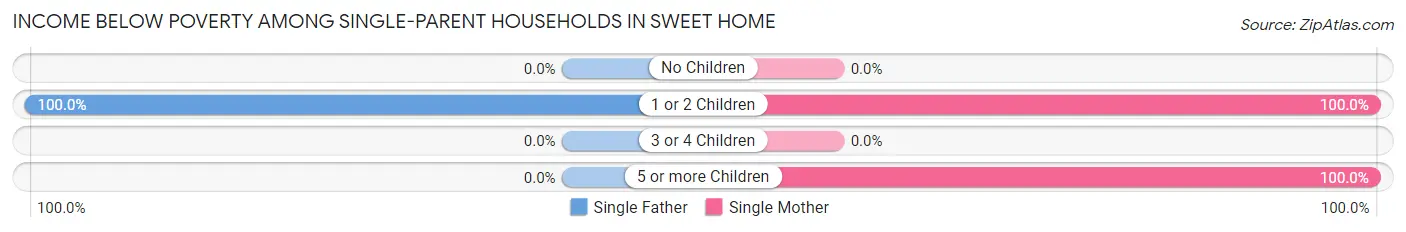
| Children | Single Father | Single Mother |
| No Children | 0 (0.0%) | 0 (0.0%) |
| 1 or 2 Children | 37 (100.0%) | 9 (100.0%) |
| 3 or 4 Children | 0 (0.0%) | 0 (0.0%) |
| 5 or more Children | 0 (0.0%) | 14 (100.0%) |
| Total | 37 (100.0%) | 23 (31.9%) |
Income Below Poverty Among Married-Couple vs Single-Parent Households in Sweet Home
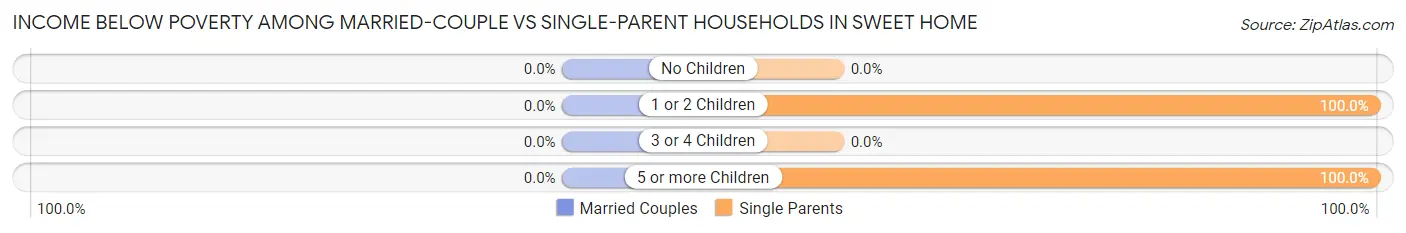
| Children | Married-Couple Families | Single-Parent Households |
| No Children | 0 (0.0%) | 0 (0.0%) |
| 1 or 2 Children | 0 (0.0%) | 46 (100.0%) |
| 3 or 4 Children | 0 (0.0%) | 0 (0.0%) |
| 5 or more Children | 0 (0.0%) | 14 (100.0%) |
| Total | 0 (0.0%) | 60 (55.0%) |
Race in Sweet Home
The most populous races in Sweet Home are Black / African American (842 | 86.5%), White / Caucasian (131 | 13.5%), and Hispanic or Latino (96 | 9.9%).
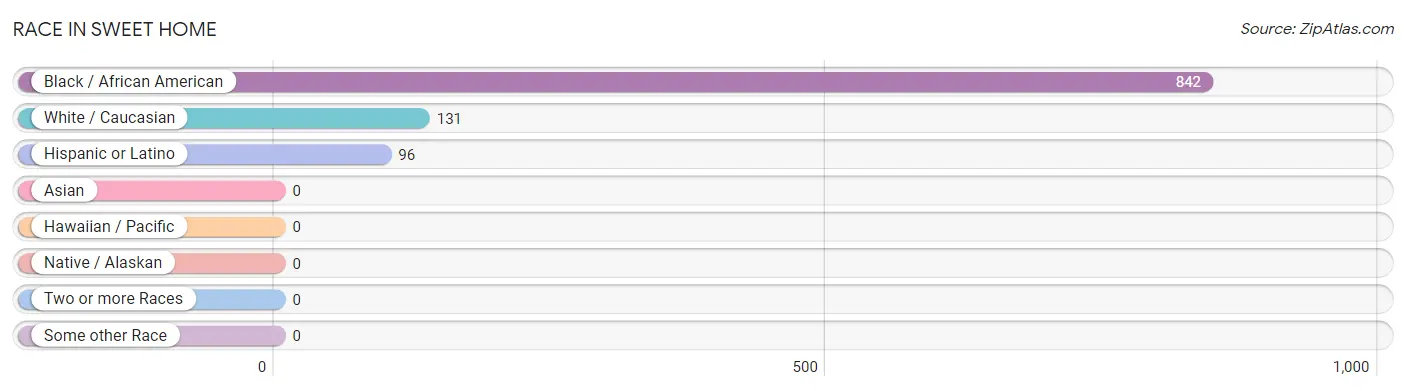
| Race | # Population | % Population |
| Asian | 0 | 0.0% |
| Black / African American | 842 | 86.5% |
| Hawaiian / Pacific | 0 | 0.0% |
| Hispanic or Latino | 96 | 9.9% |
| Native / Alaskan | 0 | 0.0% |
| White / Caucasian | 131 | 13.5% |
| Two or more Races | 0 | 0.0% |
| Some other Race | 0 | 0.0% |
| Total | 973 | 100.0% |
Ancestry in Sweet Home
The most populous ancestries reported in Sweet Home are African (126 | 13.0%), Subsaharan African (126 | 13.0%), Mexican (96 | 9.9%), American (9 | 0.9%), and Dutch (6 | 0.6%), together accounting for 37.3% of all Sweet Home residents.
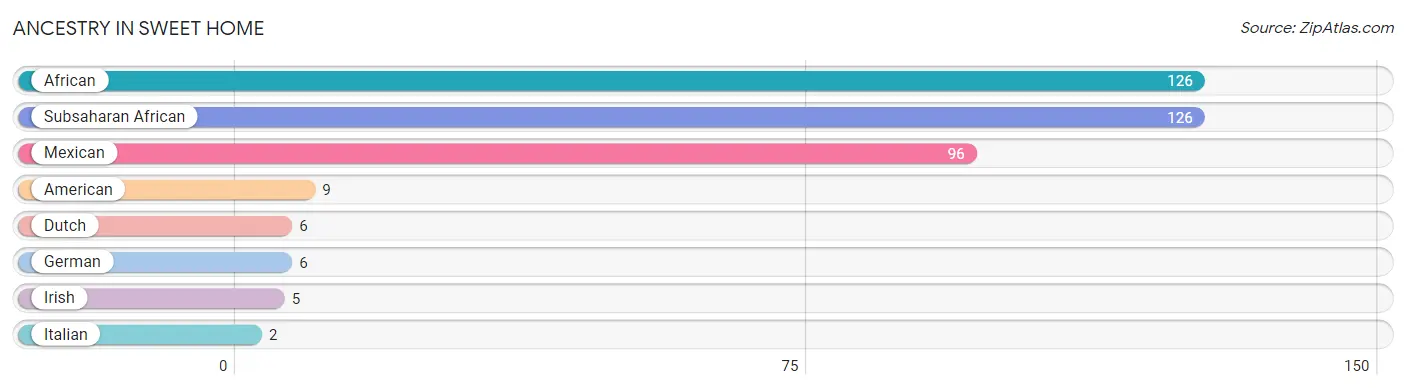
| Ancestry | # Population | % Population |
| African | 126 | 13.0% |
| American | 9 | 0.9% |
| Dutch | 6 | 0.6% |
| German | 6 | 0.6% |
| Irish | 5 | 0.5% |
| Italian | 2 | 0.2% |
| Mexican | 96 | 9.9% |
| Subsaharan African | 126 | 13.0% | View All 8 Rows |
Immigrants in Sweet Home
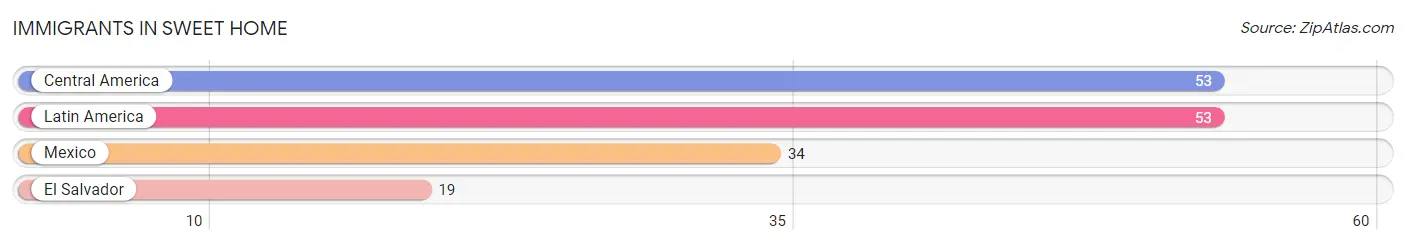
The most numerous immigrant groups reported in Sweet Home came from Central America (53 | 5.4%), Latin America (53 | 5.4%), Mexico (34 | 3.5%), and El Salvador (19 | 1.9%), together accounting for 16.3% of all Sweet Home residents.
| Immigration Origin | # Population | % Population |
| Central America | 53 | 5.4% |
| El Salvador | 19 | 1.9% |
| Latin America | 53 | 5.4% |
| Mexico | 34 | 3.5% | View All 4 Rows |
Sex and Age in Sweet Home
Sex and Age in Sweet Home
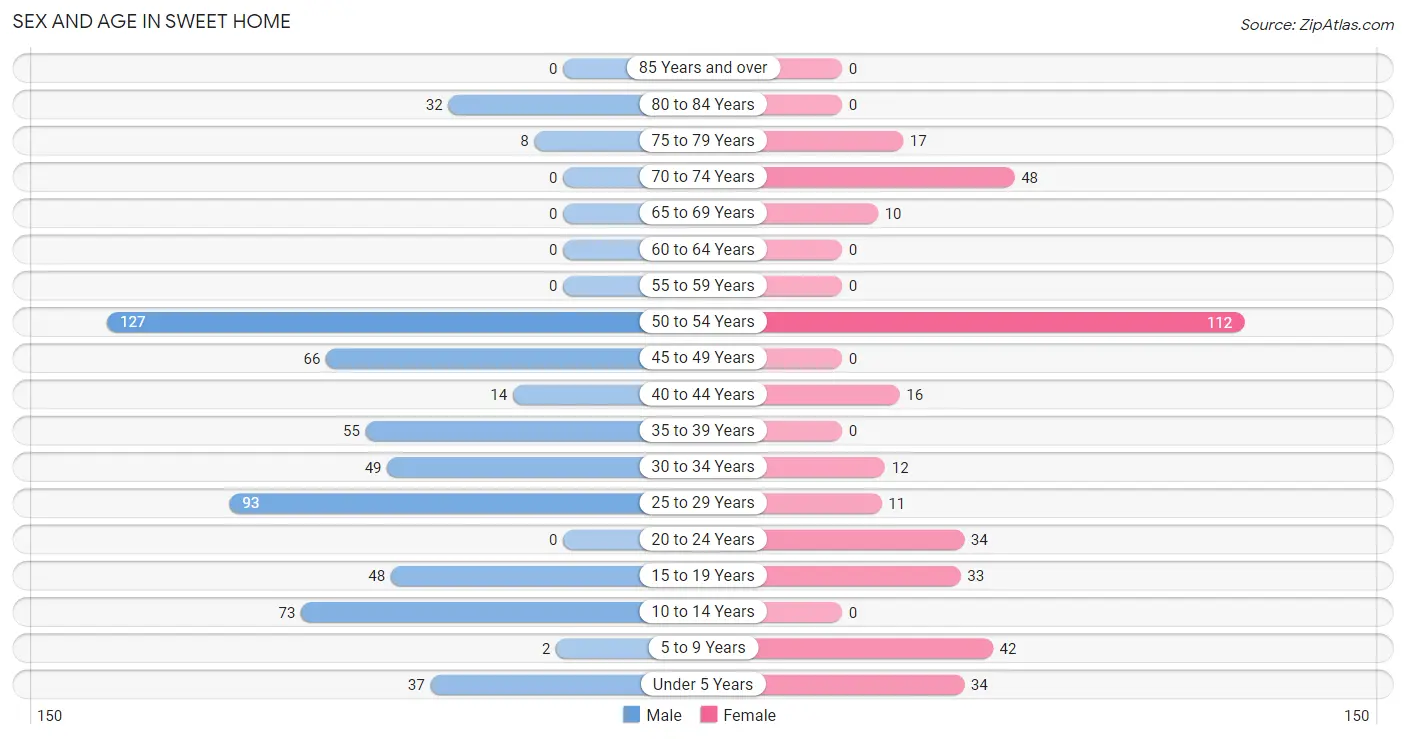
The most populous age groups in Sweet Home are 50 to 54 Years (127 | 21.0%) for men and 50 to 54 Years (112 | 30.3%) for women.
| Age Bracket | Male | Female |
| Under 5 Years | 37 (6.1%) | 34 (9.2%) |
| 5 to 9 Years | 2 (0.3%) | 42 (11.4%) |
| 10 to 14 Years | 73 (12.1%) | 0 (0.0%) |
| 15 to 19 Years | 48 (8.0%) | 33 (8.9%) |
| 20 to 24 Years | 0 (0.0%) | 34 (9.2%) |
| 25 to 29 Years | 93 (15.4%) | 11 (3.0%) |
| 30 to 34 Years | 49 (8.1%) | 12 (3.3%) |
| 35 to 39 Years | 55 (9.1%) | 0 (0.0%) |
| 40 to 44 Years | 14 (2.3%) | 16 (4.3%) |
| 45 to 49 Years | 66 (10.9%) | 0 (0.0%) |
| 50 to 54 Years | 127 (21.0%) | 112 (30.3%) |
| 55 to 59 Years | 0 (0.0%) | 0 (0.0%) |
| 60 to 64 Years | 0 (0.0%) | 0 (0.0%) |
| 65 to 69 Years | 0 (0.0%) | 10 (2.7%) |
| 70 to 74 Years | 0 (0.0%) | 48 (13.0%) |
| 75 to 79 Years | 8 (1.3%) | 17 (4.6%) |
| 80 to 84 Years | 32 (5.3%) | 0 (0.0%) |
| 85 Years and over | 0 (0.0%) | 0 (0.0%) |
| Total | 604 (100.0%) | 369 (100.0%) |
Families and Households in Sweet Home
Median Family Size in Sweet Home
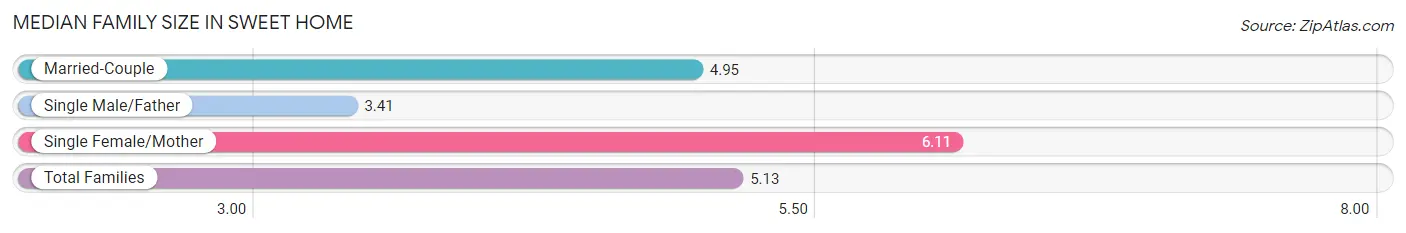
The median family size in Sweet Home is 5.13 persons per family, with single female/mother families (72 | 49.3%) accounting for the largest median family size of 6.11 persons per family. On the other hand, single male/father families (37 | 25.3%) represent the smallest median family size with 3.41 persons per family.
| Family Type | # Families | Family Size |
| Married-Couple | 37 (25.3%) | 4.95 |
| Single Male/Father | 37 (25.3%) | 3.41 |
| Single Female/Mother | 72 (49.3%) | 6.11 |
| Total Families | 146 (100.0%) | 5.13 |
Median Household Size in Sweet Home
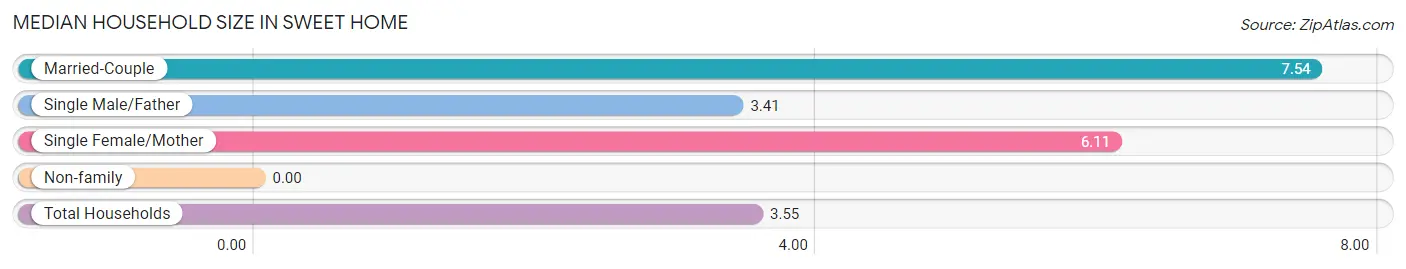
| Household Type | # Households | Household Size |
| Married-Couple | 37 (13.5%) | 7.54 |
| Single Male/Father | 37 (13.5%) | 3.41 |
| Single Female/Mother | 72 (26.3%) | 6.11 |
| Non-family | 128 (46.7%) | - |
| Total Households | 274 (100.0%) | 3.55 |
Household Size by Marriage Status in Sweet Home
Out of a total of 274 households in Sweet Home, 146 (53.3%) are family households, while 128 (46.7%) are nonfamily households. The most numerous type of family households are 3-person households, comprising 85, and the most common type of nonfamily households are 1-person households, comprising 128.
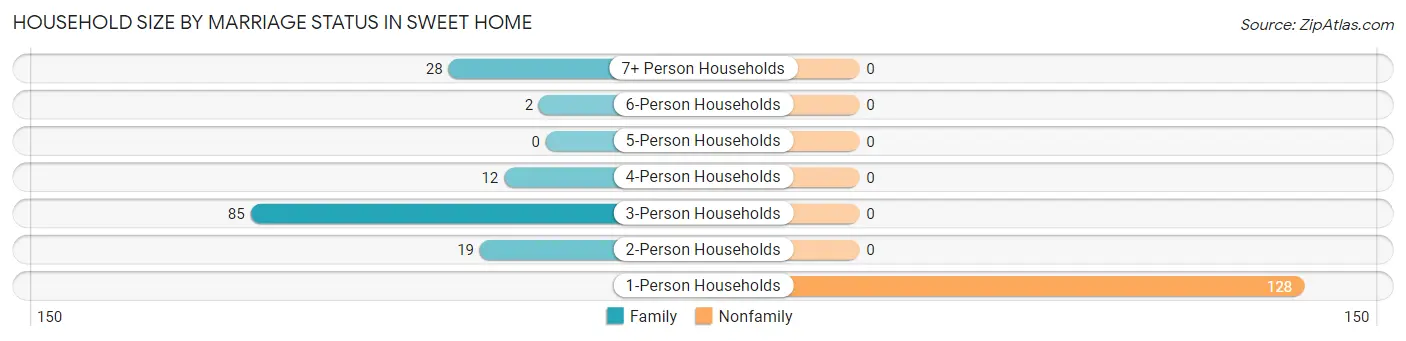
| Household Size | Family Households | Nonfamily Households |
| 1-Person Households | - | 128 (46.7%) |
| 2-Person Households | 19 (6.9%) | 0 (0.0%) |
| 3-Person Households | 85 (31.0%) | 0 (0.0%) |
| 4-Person Households | 12 (4.4%) | 0 (0.0%) |
| 5-Person Households | 0 (0.0%) | 0 (0.0%) |
| 6-Person Households | 2 (0.7%) | 0 (0.0%) |
| 7+ Person Households | 28 (10.2%) | 0 (0.0%) |
| Total | 146 (53.3%) | 128 (46.7%) |
Female Fertility in Sweet Home
Fertility by Age in Sweet Home
Average fertility rate in Sweet Home is 274.0 births per 1,000 women. Women in the age bracket of 20 to 34 years have the highest fertility rate with 509.0 births per 1,000 women. Women in the age bracket of 20 to 34 years acount for 100.0% of all women with births.
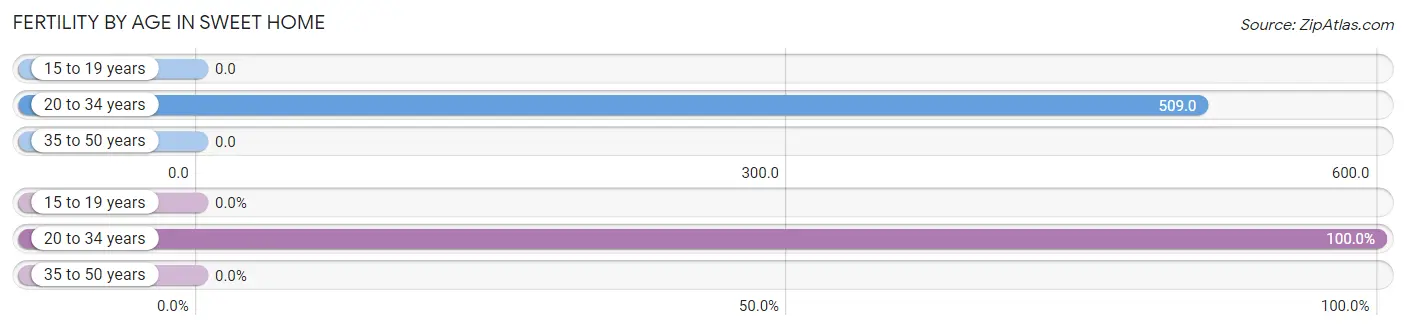
| Age Bracket | Women with Births | Births / 1,000 Women |
| 15 to 19 years | 0 (0.0%) | 0.0 |
| 20 to 34 years | 29 (100.0%) | 509.0 |
| 35 to 50 years | 0 (0.0%) | 0.0 |
| Total | 29 (100.0%) | 274.0 |
Fertility by Age by Marriage Status in Sweet Home
41.4% of women with births (29) in Sweet Home are married. The highest percentage of unmarried women with births falls into 20 to 34 years age bracket with 58.6% of them unmarried at the time of birth, while the lowest percentage of unmarried women with births belong to 20 to 34 years age bracket with 58.6% of them unmarried.
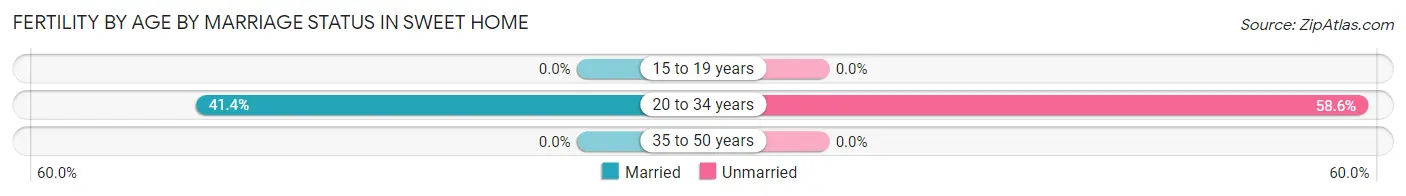
| Age Bracket | Married | Unmarried |
| 15 to 19 years | 0 (0.0%) | 0 (0.0%) |
| 20 to 34 years | 12 (41.4%) | 17 (58.6%) |
| 35 to 50 years | 0 (0.0%) | 0 (0.0%) |
| Total | 12 (41.4%) | 17 (58.6%) |
Fertility by Education in Sweet Home
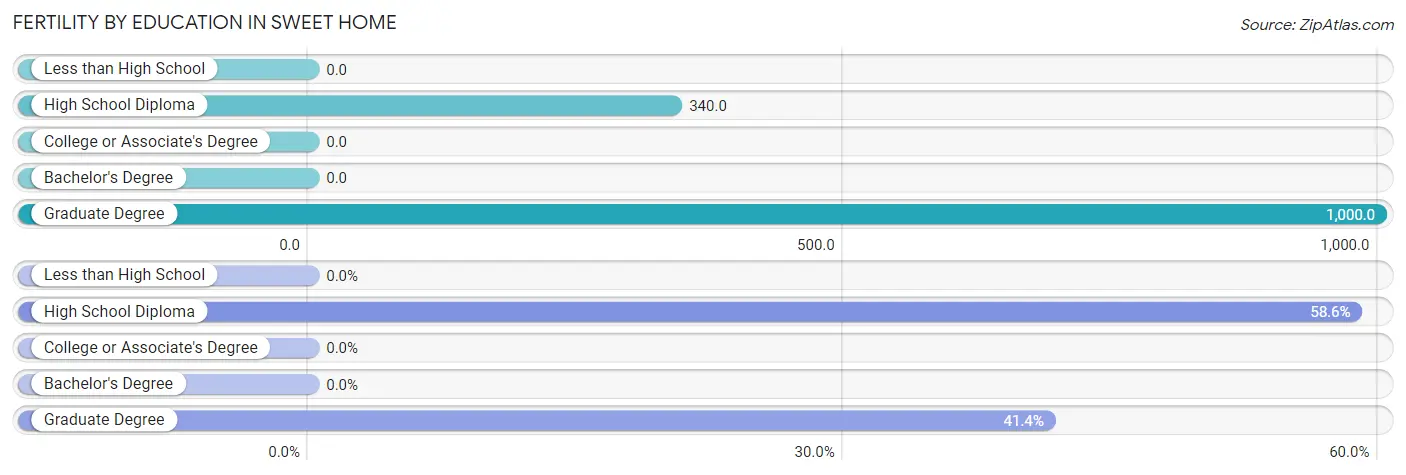
| Educational Attainment | Women with Births | Births / 1,000 Women |
| Less than High School | 0 (0.0%) | 0.0 |
| High School Diploma | 17 (58.6%) | 340.0 |
| College or Associate's Degree | 0 (0.0%) | 0.0 |
| Bachelor's Degree | 0 (0.0%) | 0.0 |
| Graduate Degree | 12 (41.4%) | 1,000.0 |
| Total | 29 (100.0%) | 274.0 |
Fertility by Education by Marriage Status in Sweet Home
58.6% of women with births in Sweet Home are unmarried. Women with the educational attainment of graduate degree are most likely to be married with 100.0% of them married at childbirth, while women with the educational attainment of high school diploma are least likely to be married with 100.0% of them unmarried at childbirth.
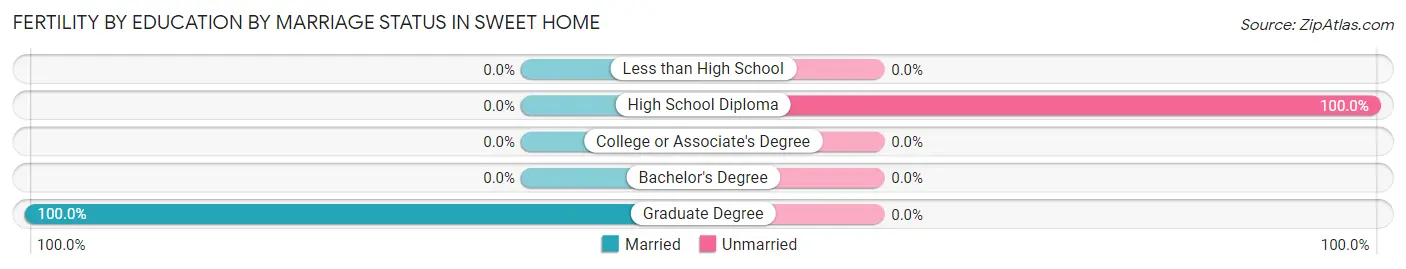
| Educational Attainment | Married | Unmarried |
| Less than High School | 0 (0.0%) | 0 (0.0%) |
| High School Diploma | 0 (0.0%) | 17 (100.0%) |
| College or Associate's Degree | 0 (0.0%) | 0 (0.0%) |
| Bachelor's Degree | 0 (0.0%) | 0 (0.0%) |
| Graduate Degree | 12 (100.0%) | 0 (0.0%) |
| Total | 12 (41.4%) | 17 (58.6%) |
Employment Characteristics in Sweet Home
Employment by Class of Employer in Sweet Home
Among the 377 employed individuals in Sweet Home, private company employees (139 | 36.9%), state government employees (132 | 35.0%), and self-employed (not incorporated) (52 | 13.8%) make up the most common classes of employment.
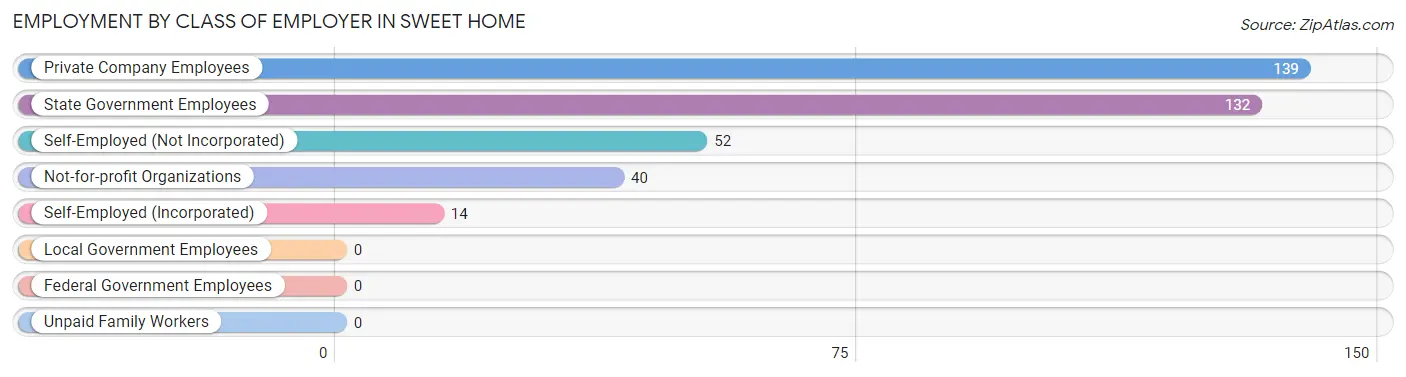
| Employer Class | # Employees | % Employees |
| Private Company Employees | 139 | 36.9% |
| Self-Employed (Incorporated) | 14 | 3.7% |
| Self-Employed (Not Incorporated) | 52 | 13.8% |
| Not-for-profit Organizations | 40 | 10.6% |
| Local Government Employees | 0 | 0.0% |
| State Government Employees | 132 | 35.0% |
| Federal Government Employees | 0 | 0.0% |
| Unpaid Family Workers | 0 | 0.0% |
| Total | 377 | 100.0% |
Employment Status by Age in Sweet Home
According to the labor force statistics for Sweet Home, out of the total population over 16 years of age (783), 56.2% or 440 individuals are in the labor force, with 11.6% or 51 of them unemployed. The age group with the highest labor force participation rate is 25 to 29 years, with 100.0% or 104 individuals in the labor force. Within the labor force, the 30 to 34 years age range has the highest percentage of unemployed individuals, with 55.7% or 34 of them being unemployed.
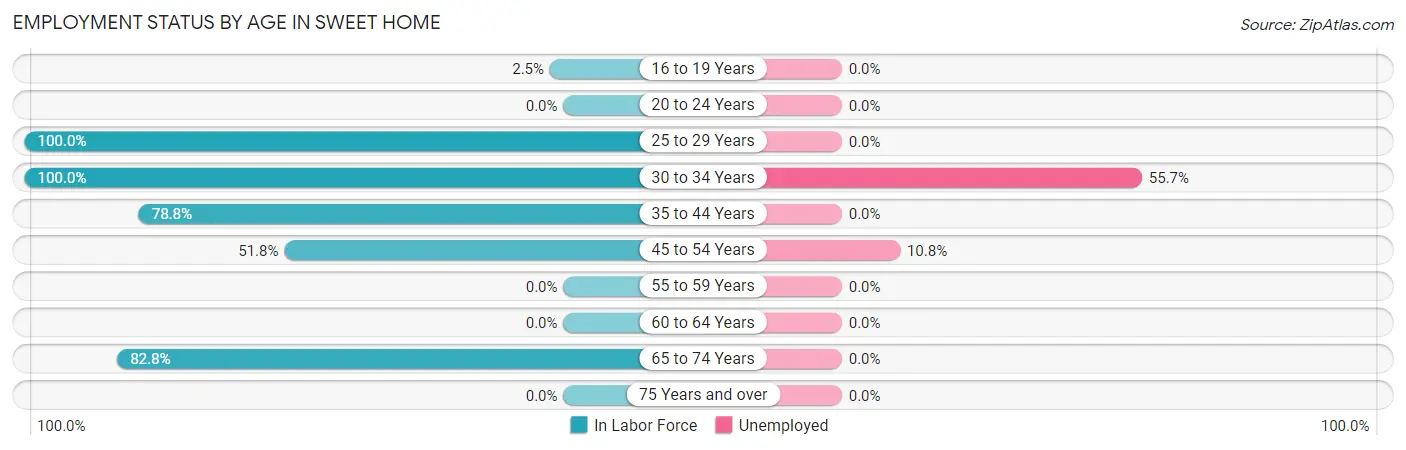
| Age Bracket | In Labor Force | Unemployed |
| 16 to 19 Years | 2 (2.5%) | 0 (0.0%) |
| 20 to 24 Years | 0 (0.0%) | 0 (0.0%) |
| 25 to 29 Years | 104 (100.0%) | 0 (0.0%) |
| 30 to 34 Years | 61 (100.0%) | 34 (55.7%) |
| 35 to 44 Years | 67 (78.8%) | 0 (0.0%) |
| 45 to 54 Years | 158 (51.8%) | 17 (10.8%) |
| 55 to 59 Years | 0 (0.0%) | 0 (0.0%) |
| 60 to 64 Years | 0 (0.0%) | 0 (0.0%) |
| 65 to 74 Years | 48 (82.8%) | 0 (0.0%) |
| 75 Years and over | 0 (0.0%) | 0 (0.0%) |
| Total | 440 (56.2%) | 51 (11.6%) |
Employment Status by Educational Attainment in Sweet Home
According to labor force statistics for Sweet Home, 70.3% of individuals (390) out of the total population between 25 and 64 years of age (555) are in the labor force, with 13.1% or 51 of them being unemployed. The group with the highest labor force participation rate are those with the educational attainment of less than high school, with 100.0% or 17 individuals in the labor force. Within the labor force, individuals with high school diploma education have the highest percentage of unemployment, with 23.1% or 34 of them being unemployed.
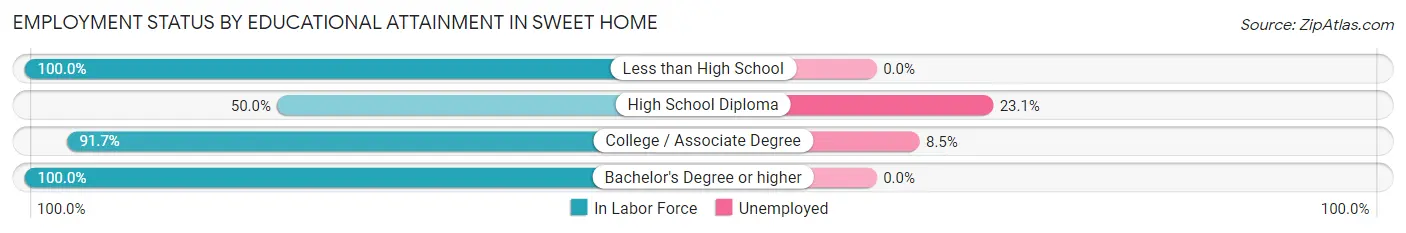
| Educational Attainment | In Labor Force | Unemployed |
| Less than High School | 17 (100.0%) | 0 (0.0%) |
| High School Diploma | 147 (50.0%) | 68 (23.1%) |
| College / Associate Degree | 199 (91.7%) | 18 (8.5%) |
| Bachelor's Degree or higher | 27 (100.0%) | 0 (0.0%) |
| Total | 390 (70.3%) | 73 (13.1%) |
Employment Occupations by Sex in Sweet Home
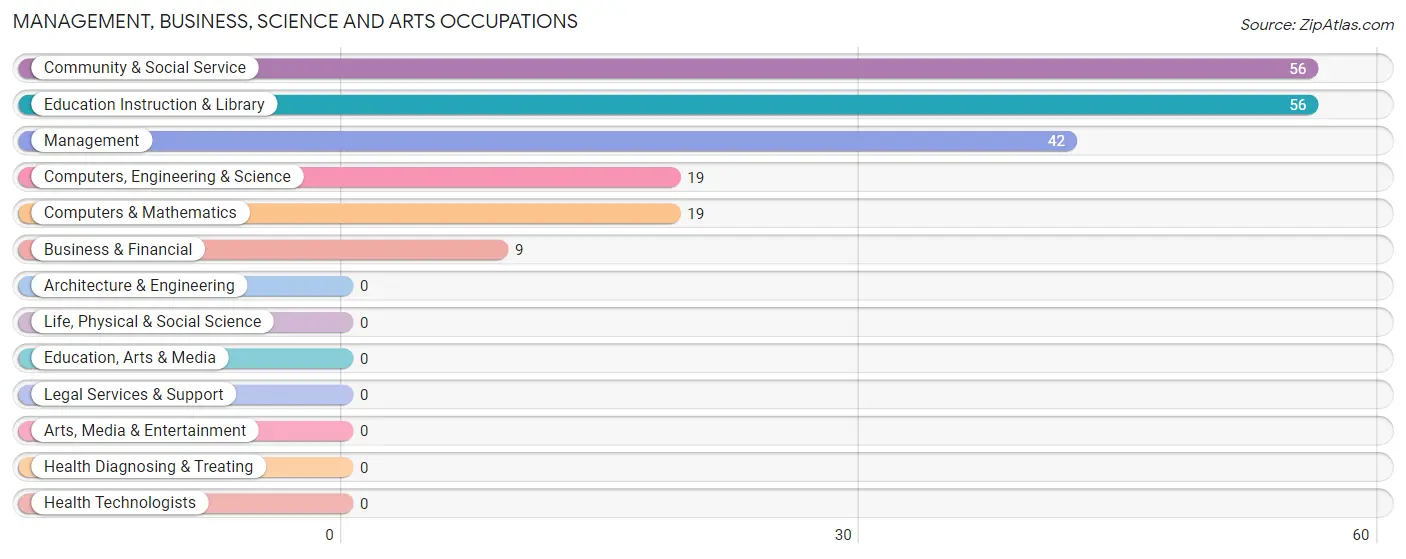
Management, Business, Science and Arts Occupations
The most common Management, Business, Science and Arts occupations in Sweet Home are Community & Social Service (56 | 14.4%), Education Instruction & Library (56 | 14.4%), Management (42 | 10.8%), Computers, Engineering & Science (19 | 4.9%), and Computers & Mathematics (19 | 4.9%).
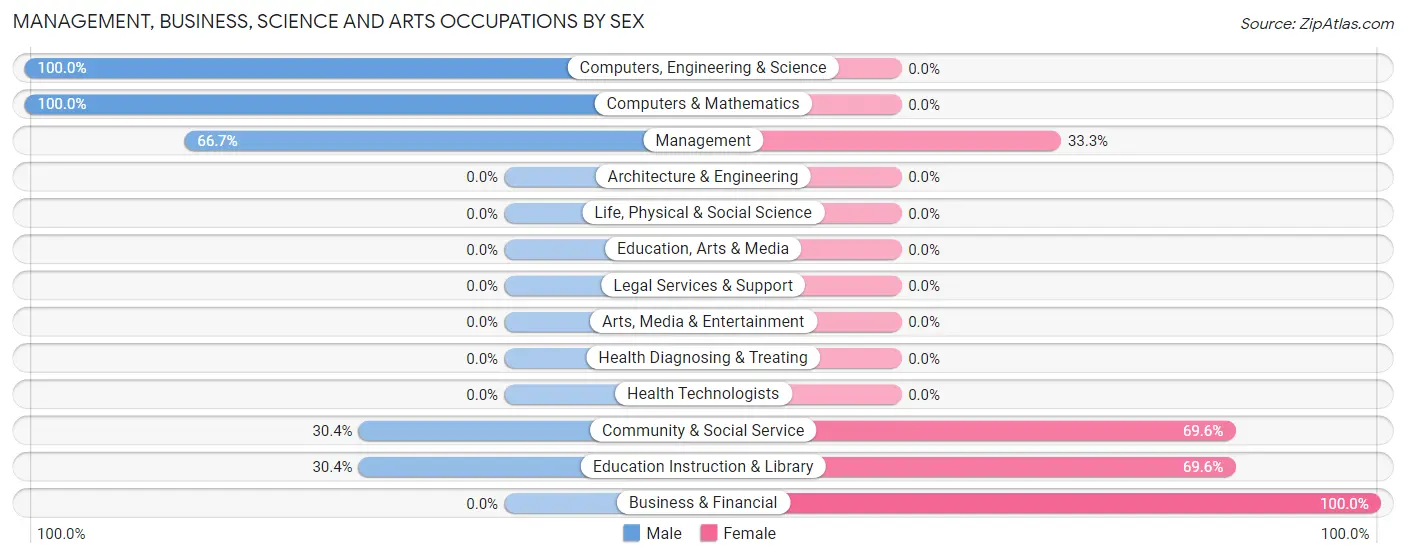
Management, Business, Science and Arts Occupations by Sex
Within the Management, Business, Science and Arts occupations in Sweet Home, the most male-oriented occupations are Computers, Engineering & Science (100.0%), Computers & Mathematics (100.0%), and Management (66.7%), while the most female-oriented occupations are Business & Financial (100.0%), Community & Social Service (69.6%), and Education Instruction & Library (69.6%).
| Occupation | Male | Female |
| Management | 28 (66.7%) | 14 (33.3%) |
| Business & Financial | 0 (0.0%) | 9 (100.0%) |
| Computers, Engineering & Science | 19 (100.0%) | 0 (0.0%) |
| Computers & Mathematics | 19 (100.0%) | 0 (0.0%) |
| Architecture & Engineering | 0 (0.0%) | 0 (0.0%) |
| Life, Physical & Social Science | 0 (0.0%) | 0 (0.0%) |
| Community & Social Service | 17 (30.4%) | 39 (69.6%) |
| Education, Arts & Media | 0 (0.0%) | 0 (0.0%) |
| Legal Services & Support | 0 (0.0%) | 0 (0.0%) |
| Education Instruction & Library | 17 (30.4%) | 39 (69.6%) |
| Arts, Media & Entertainment | 0 (0.0%) | 0 (0.0%) |
| Health Diagnosing & Treating | 0 (0.0%) | 0 (0.0%) |
| Health Technologists | 0 (0.0%) | 0 (0.0%) |
| Total (Category) | 64 (50.8%) | 62 (49.2%) |
| Total (Overall) | 231 (59.4%) | 158 (40.6%) |
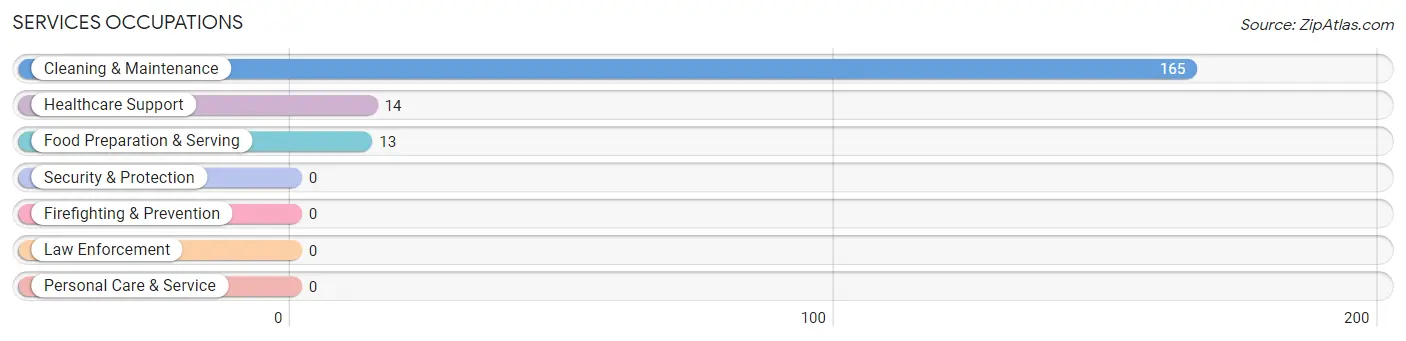
Services Occupations
The most common Services occupations in Sweet Home are Cleaning & Maintenance (165 | 42.4%), Healthcare Support (14 | 3.6%), and Food Preparation & Serving (13 | 3.3%).
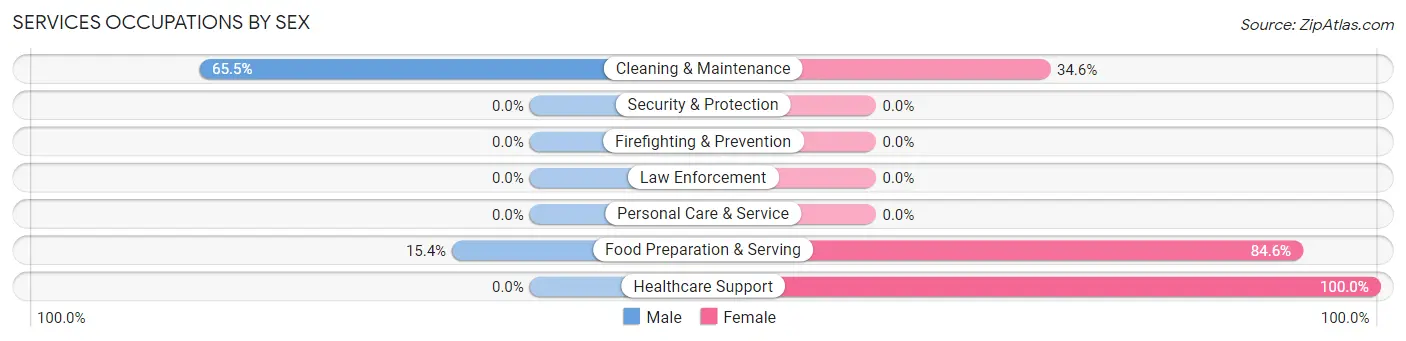
Services Occupations by Sex
Within the Services occupations in Sweet Home, the most male-oriented occupations are Cleaning & Maintenance (65.4%), and Food Preparation & Serving (15.4%), while the most female-oriented occupations are Healthcare Support (100.0%), Food Preparation & Serving (84.6%), and Cleaning & Maintenance (34.5%).
| Occupation | Male | Female |
| Healthcare Support | 0 (0.0%) | 14 (100.0%) |
| Security & Protection | 0 (0.0%) | 0 (0.0%) |
| Firefighting & Prevention | 0 (0.0%) | 0 (0.0%) |
| Law Enforcement | 0 (0.0%) | 0 (0.0%) |
| Food Preparation & Serving | 2 (15.4%) | 11 (84.6%) |
| Cleaning & Maintenance | 108 (65.4%) | 57 (34.5%) |
| Personal Care & Service | 0 (0.0%) | 0 (0.0%) |
| Total (Category) | 110 (57.3%) | 82 (42.7%) |
| Total (Overall) | 231 (59.4%) | 158 (40.6%) |
Sales and Office Occupations
The most common Sales and Office occupations in Sweet Home are Office & Administration (14 | 3.6%), and Sales & Related (3 | 0.8%).
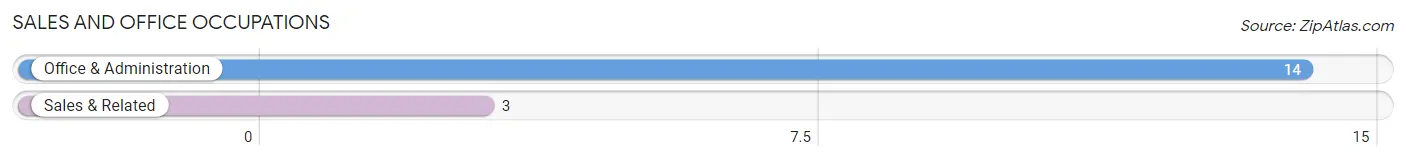
Sales and Office Occupations by Sex
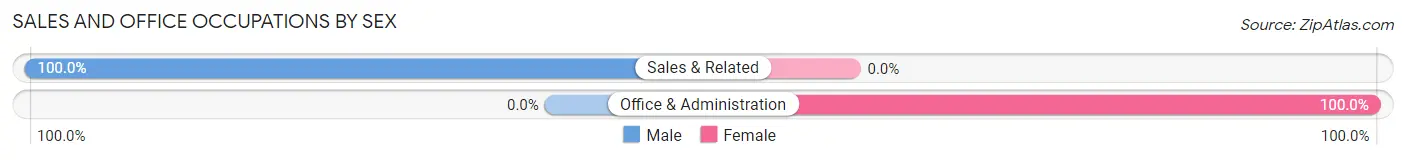
| Occupation | Male | Female |
| Sales & Related | 3 (100.0%) | 0 (0.0%) |
| Office & Administration | 0 (0.0%) | 14 (100.0%) |
| Total (Category) | 3 (17.6%) | 14 (82.4%) |
| Total (Overall) | 231 (59.4%) | 158 (40.6%) |
Natural Resources, Construction and Maintenance Occupations
The most common Natural Resources, Construction and Maintenance occupations in Sweet Home are , and Construction & Extraction (54 | 13.9%).
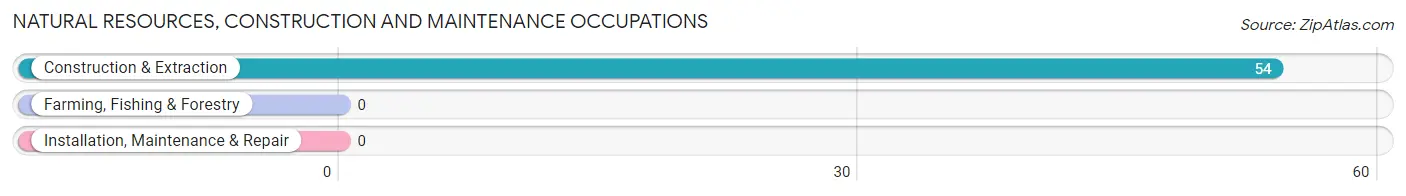
Natural Resources, Construction and Maintenance Occupations by Sex
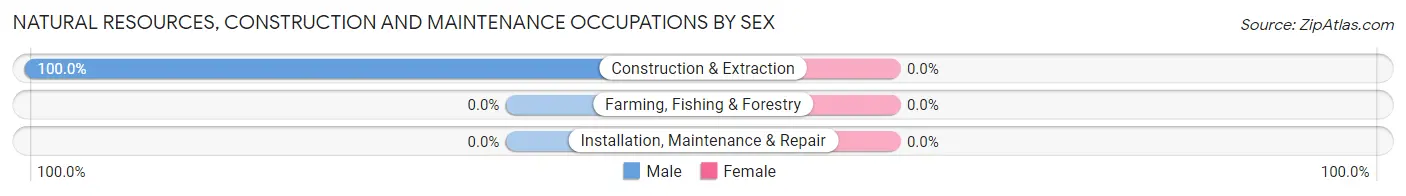
| Occupation | Male | Female |
| Farming, Fishing & Forestry | 0 (0.0%) | 0 (0.0%) |
| Construction & Extraction | 54 (100.0%) | 0 (0.0%) |
| Installation, Maintenance & Repair | 0 (0.0%) | 0 (0.0%) |
| Total (Category) | 54 (100.0%) | 0 (0.0%) |
| Total (Overall) | 231 (59.4%) | 158 (40.6%) |
Production, Transportation and Moving Occupations
Production, Transportation and Moving Occupations by Sex
| Occupation | Male | Female |
| Production | 0 (0.0%) | 0 (0.0%) |
| Transportation | 0 (0.0%) | 0 (0.0%) |
| Material Moving | 0 (0.0%) | 0 (0.0%) |
| Total (Category) | 0 (0.0%) | 0 (0.0%) |
| Total (Overall) | 231 (59.4%) | 158 (40.6%) |
Employment Industries by Sex in Sweet Home
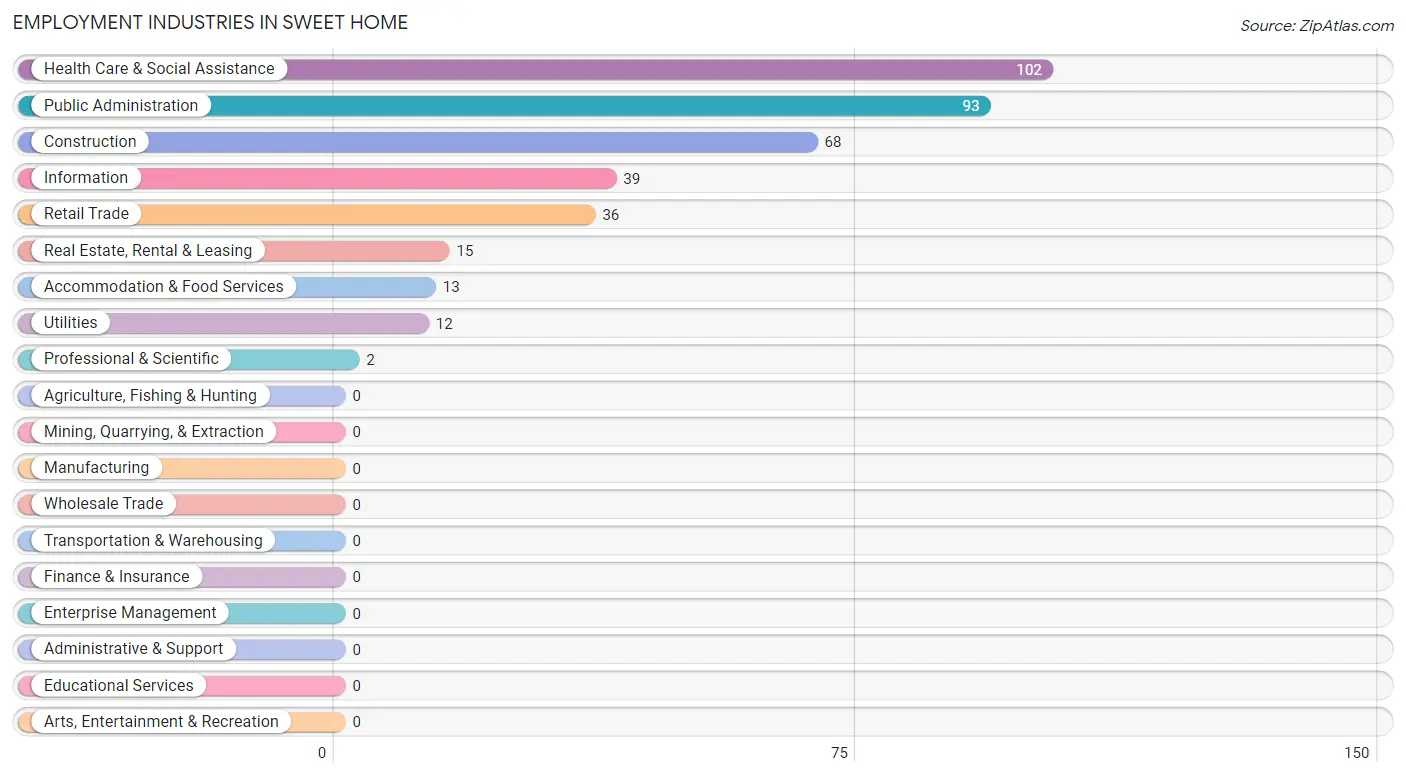
Employment Industries in Sweet Home
The major employment industries in Sweet Home include Health Care & Social Assistance (102 | 26.2%), Public Administration (93 | 23.9%), Construction (68 | 17.5%), Information (39 | 10.0%), and Retail Trade (36 | 9.2%).
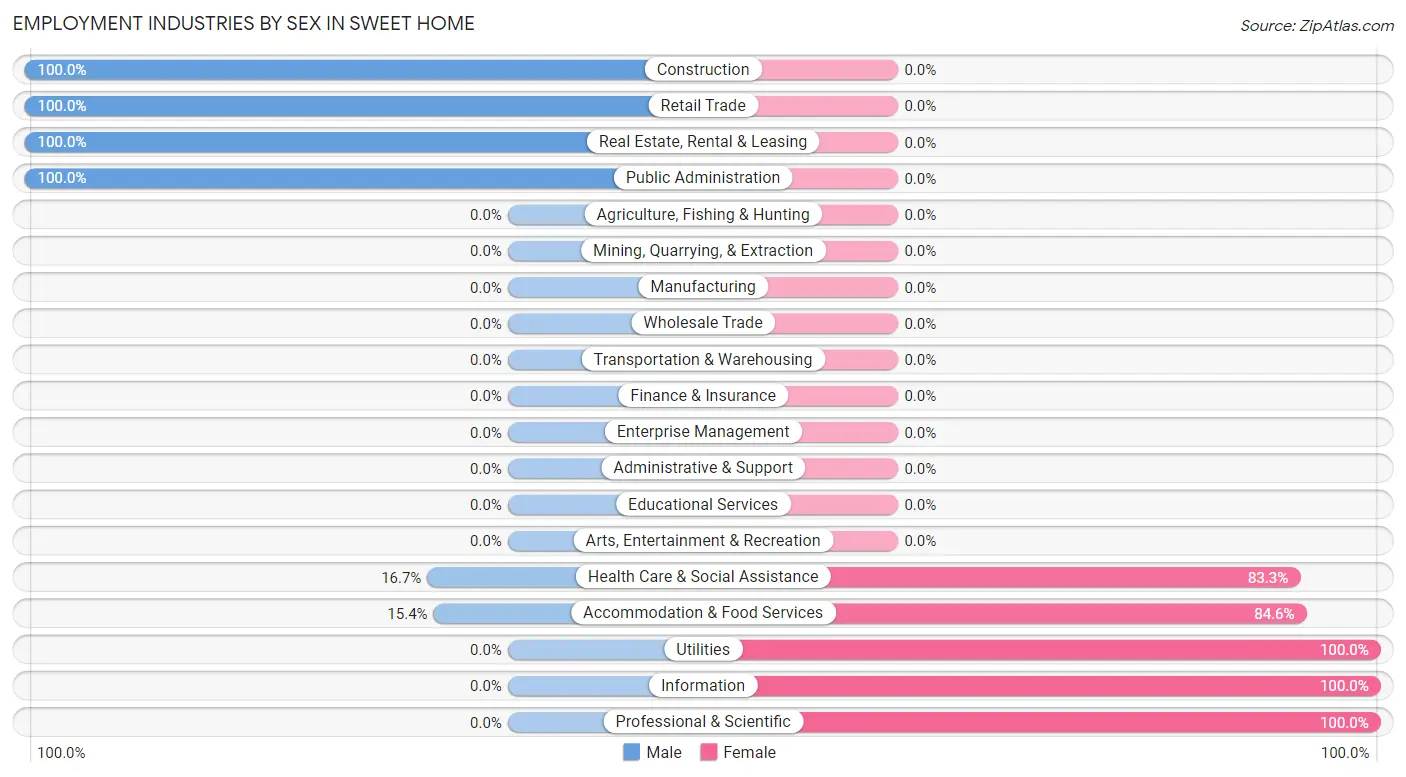
Employment Industries by Sex in Sweet Home
The Sweet Home industries that see more men than women are Construction (100.0%), Retail Trade (100.0%), and Real Estate, Rental & Leasing (100.0%), whereas the industries that tend to have a higher number of women are Utilities (100.0%), Information (100.0%), and Professional & Scientific (100.0%).
| Industry | Male | Female |
| Agriculture, Fishing & Hunting | 0 (0.0%) | 0 (0.0%) |
| Mining, Quarrying, & Extraction | 0 (0.0%) | 0 (0.0%) |
| Construction | 68 (100.0%) | 0 (0.0%) |
| Manufacturing | 0 (0.0%) | 0 (0.0%) |
| Wholesale Trade | 0 (0.0%) | 0 (0.0%) |
| Retail Trade | 36 (100.0%) | 0 (0.0%) |
| Transportation & Warehousing | 0 (0.0%) | 0 (0.0%) |
| Utilities | 0 (0.0%) | 12 (100.0%) |
| Information | 0 (0.0%) | 39 (100.0%) |
| Finance & Insurance | 0 (0.0%) | 0 (0.0%) |
| Real Estate, Rental & Leasing | 15 (100.0%) | 0 (0.0%) |
| Professional & Scientific | 0 (0.0%) | 2 (100.0%) |
| Enterprise Management | 0 (0.0%) | 0 (0.0%) |
| Administrative & Support | 0 (0.0%) | 0 (0.0%) |
| Educational Services | 0 (0.0%) | 0 (0.0%) |
| Health Care & Social Assistance | 17 (16.7%) | 85 (83.3%) |
| Arts, Entertainment & Recreation | 0 (0.0%) | 0 (0.0%) |
| Accommodation & Food Services | 2 (15.4%) | 11 (84.6%) |
| Public Administration | 93 (100.0%) | 0 (0.0%) |
| Total | 231 (59.4%) | 158 (40.6%) |
Education in Sweet Home
School Enrollment in Sweet Home
The most common levels of schooling among the 209 students in Sweet Home are high school (81 | 38.8%), middle school (59 | 28.2%), and elementary school (43 | 20.6%).
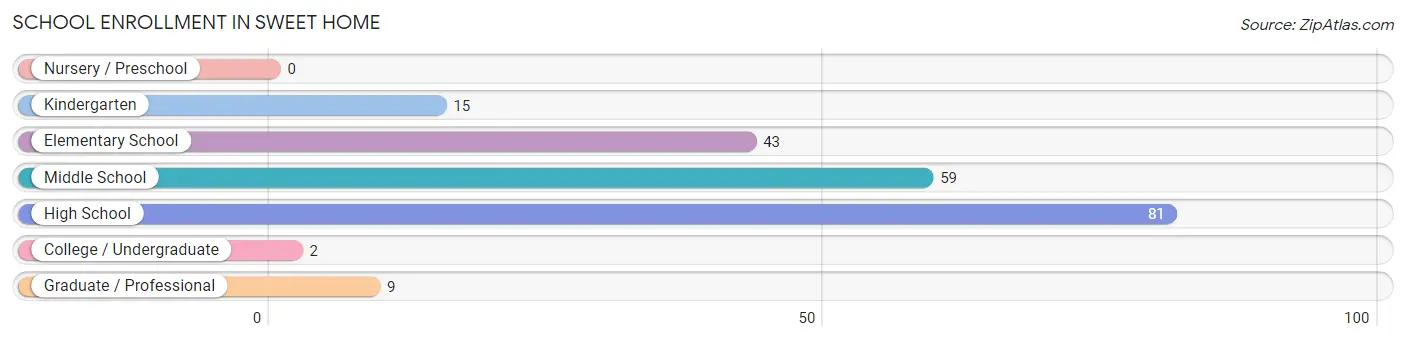
| School Level | # Students | % Students |
| Nursery / Preschool | 0 | 0.0% |
| Kindergarten | 15 | 7.2% |
| Elementary School | 43 | 20.6% |
| Middle School | 59 | 28.2% |
| High School | 81 | 38.8% |
| College / Undergraduate | 2 | 1.0% |
| Graduate / Professional | 9 | 4.3% |
| Total | 209 | 100.0% |
School Enrollment by Age by Funding Source in Sweet Home
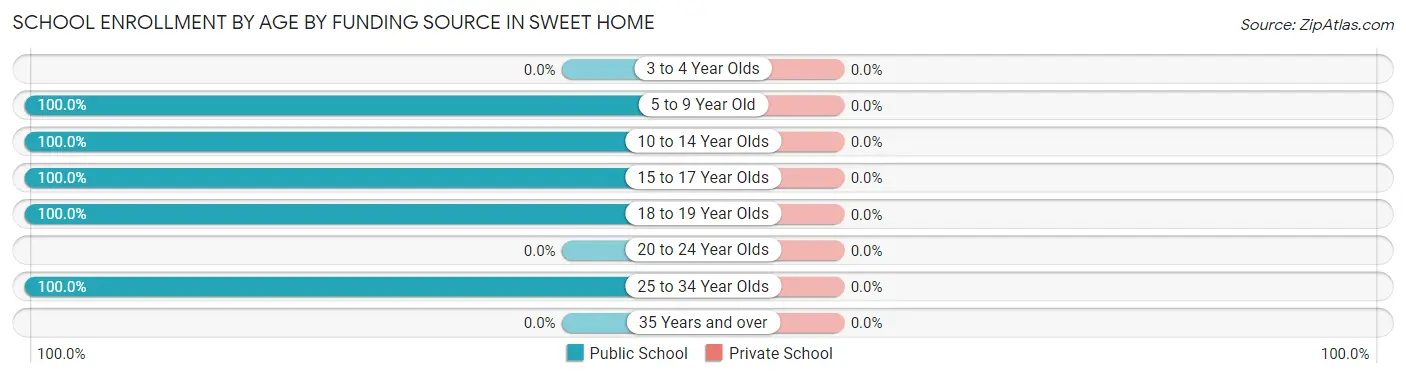
| Age Bracket | Public School | Private School |
| 3 to 4 Year Olds | 0 (0.0%) | 0 (0.0%) |
| 5 to 9 Year Old | 44 (100.0%) | 0 (0.0%) |
| 10 to 14 Year Olds | 73 (100.0%) | 0 (0.0%) |
| 15 to 17 Year Olds | 67 (100.0%) | 0 (0.0%) |
| 18 to 19 Year Olds | 14 (100.0%) | 0 (0.0%) |
| 20 to 24 Year Olds | 0 (0.0%) | 0 (0.0%) |
| 25 to 34 Year Olds | 11 (100.0%) | 0 (0.0%) |
| 35 Years and over | 0 (0.0%) | 0 (0.0%) |
| Total | 209 (100.0%) | 0 (0.0%) |
Educational Attainment by Field of Study in Sweet Home
Arts & humanities (15 | 41.7%), business (12 | 33.3%), and psychology (9 | 25.0%) are the most common fields of study among 36 individuals in Sweet Home who have obtained a bachelor's degree or higher.
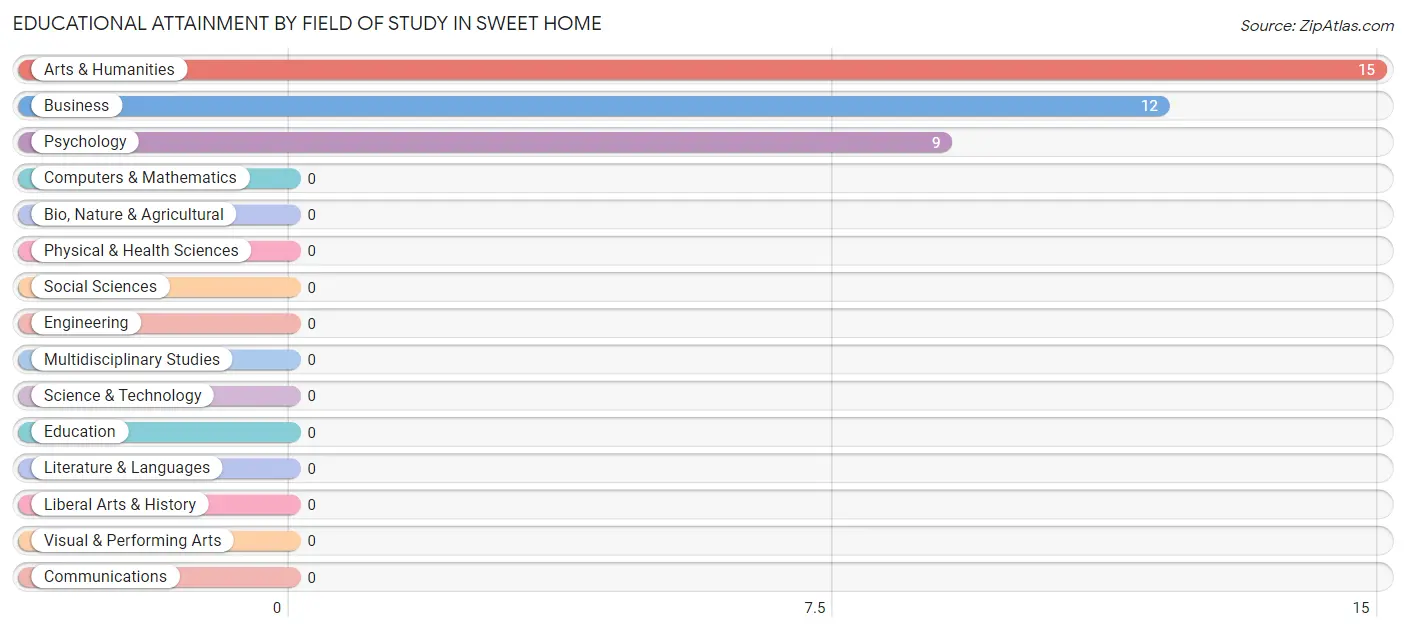
| Field of Study | # Graduates | % Graduates |
| Computers & Mathematics | 0 | 0.0% |
| Bio, Nature & Agricultural | 0 | 0.0% |
| Physical & Health Sciences | 0 | 0.0% |
| Psychology | 9 | 25.0% |
| Social Sciences | 0 | 0.0% |
| Engineering | 0 | 0.0% |
| Multidisciplinary Studies | 0 | 0.0% |
| Science & Technology | 0 | 0.0% |
| Business | 12 | 33.3% |
| Education | 0 | 0.0% |
| Literature & Languages | 0 | 0.0% |
| Liberal Arts & History | 0 | 0.0% |
| Visual & Performing Arts | 0 | 0.0% |
| Communications | 0 | 0.0% |
| Arts & Humanities | 15 | 41.7% |
| Total | 36 | 100.0% |
Transportation & Commute in Sweet Home
Vehicle Availability by Sex in Sweet Home
The most prevalent vehicle ownership categories in Sweet Home are males with 3 vehicles (108, accounting for 46.8%) and females with 3 vehicles (96, making up 74.0%).
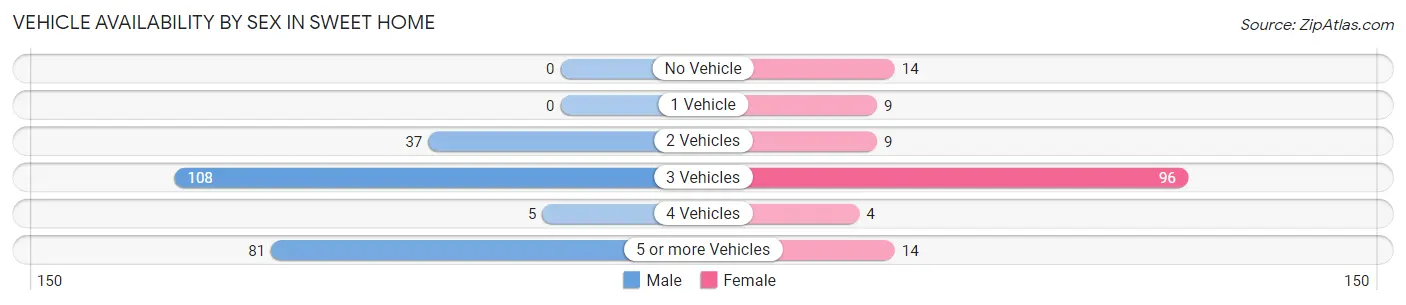
| Vehicles Available | Male | Female |
| No Vehicle | 0 (0.0%) | 14 (9.6%) |
| 1 Vehicle | 0 (0.0%) | 9 (6.2%) |
| 2 Vehicles | 37 (16.0%) | 9 (6.2%) |
| 3 Vehicles | 108 (46.8%) | 96 (65.7%) |
| 4 Vehicles | 5 (2.2%) | 4 (2.7%) |
| 5 or more Vehicles | 81 (35.1%) | 14 (9.6%) |
| Total | 231 (100.0%) | 146 (100.0%) |
Commute Time in Sweet Home
The most frequently occuring commute durations in Sweet Home are 30 to 34 minutes (114 commuters, 33.0%), 20 to 24 minutes (86 commuters, 24.9%), and 25 to 29 minutes (76 commuters, 22.0%).
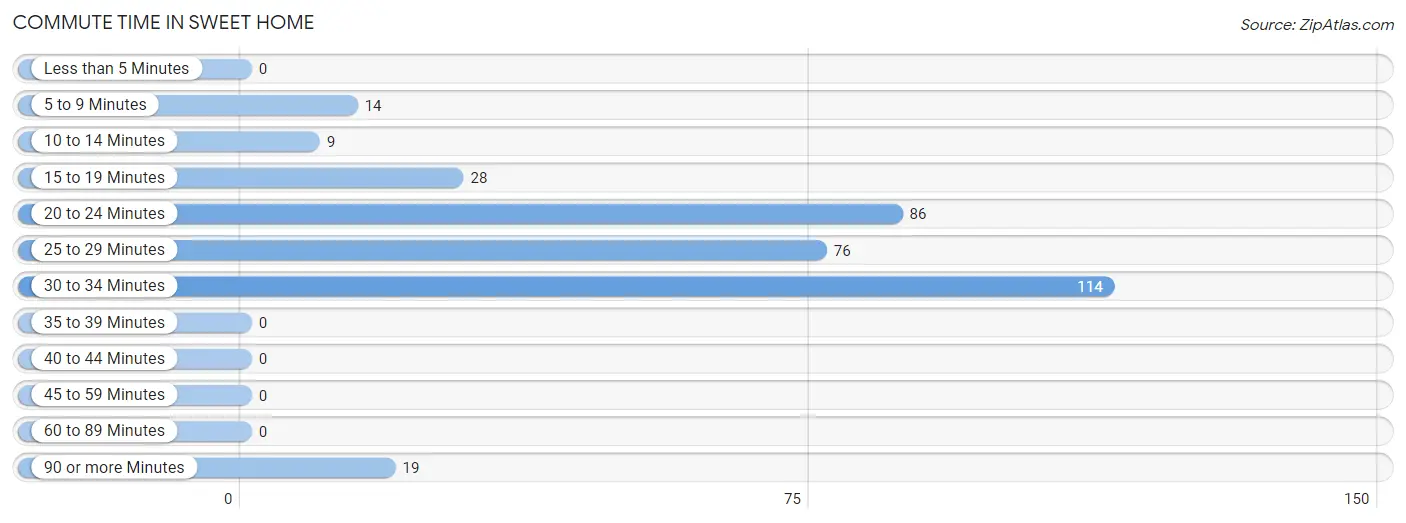
| Commute Time | # Commuters | % Commuters |
| Less than 5 Minutes | 0 | 0.0% |
| 5 to 9 Minutes | 14 | 4.1% |
| 10 to 14 Minutes | 9 | 2.6% |
| 15 to 19 Minutes | 28 | 8.1% |
| 20 to 24 Minutes | 86 | 24.9% |
| 25 to 29 Minutes | 76 | 22.0% |
| 30 to 34 Minutes | 114 | 33.0% |
| 35 to 39 Minutes | 0 | 0.0% |
| 40 to 44 Minutes | 0 | 0.0% |
| 45 to 59 Minutes | 0 | 0.0% |
| 60 to 89 Minutes | 0 | 0.0% |
| 90 or more Minutes | 19 | 5.5% |
Commute Time by Sex in Sweet Home
The most common commute times in Sweet Home are 30 to 34 minutes (96 commuters, 44.9%) for males and 20 to 24 minutes (57 commuters, 43.2%) for females.
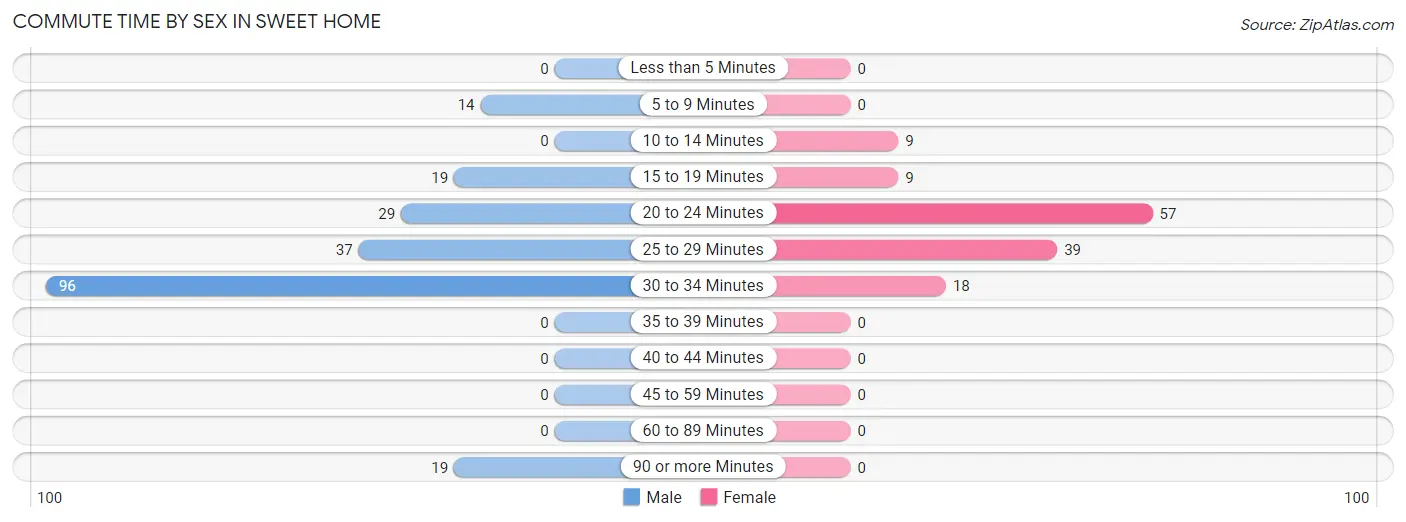
| Commute Time | Male | Female |
| Less than 5 Minutes | 0 (0.0%) | 0 (0.0%) |
| 5 to 9 Minutes | 14 (6.5%) | 0 (0.0%) |
| 10 to 14 Minutes | 0 (0.0%) | 9 (6.8%) |
| 15 to 19 Minutes | 19 (8.9%) | 9 (6.8%) |
| 20 to 24 Minutes | 29 (13.6%) | 57 (43.2%) |
| 25 to 29 Minutes | 37 (17.3%) | 39 (29.5%) |
| 30 to 34 Minutes | 96 (44.9%) | 18 (13.6%) |
| 35 to 39 Minutes | 0 (0.0%) | 0 (0.0%) |
| 40 to 44 Minutes | 0 (0.0%) | 0 (0.0%) |
| 45 to 59 Minutes | 0 (0.0%) | 0 (0.0%) |
| 60 to 89 Minutes | 0 (0.0%) | 0 (0.0%) |
| 90 or more Minutes | 19 (8.9%) | 0 (0.0%) |
Time of Departure to Work by Sex in Sweet Home
The most frequent times of departure to work in Sweet Home are 7:30 AM to 7:59 AM (147, 68.7%) for males and 12:00 PM to 3:59 PM (57, 43.2%) for females.
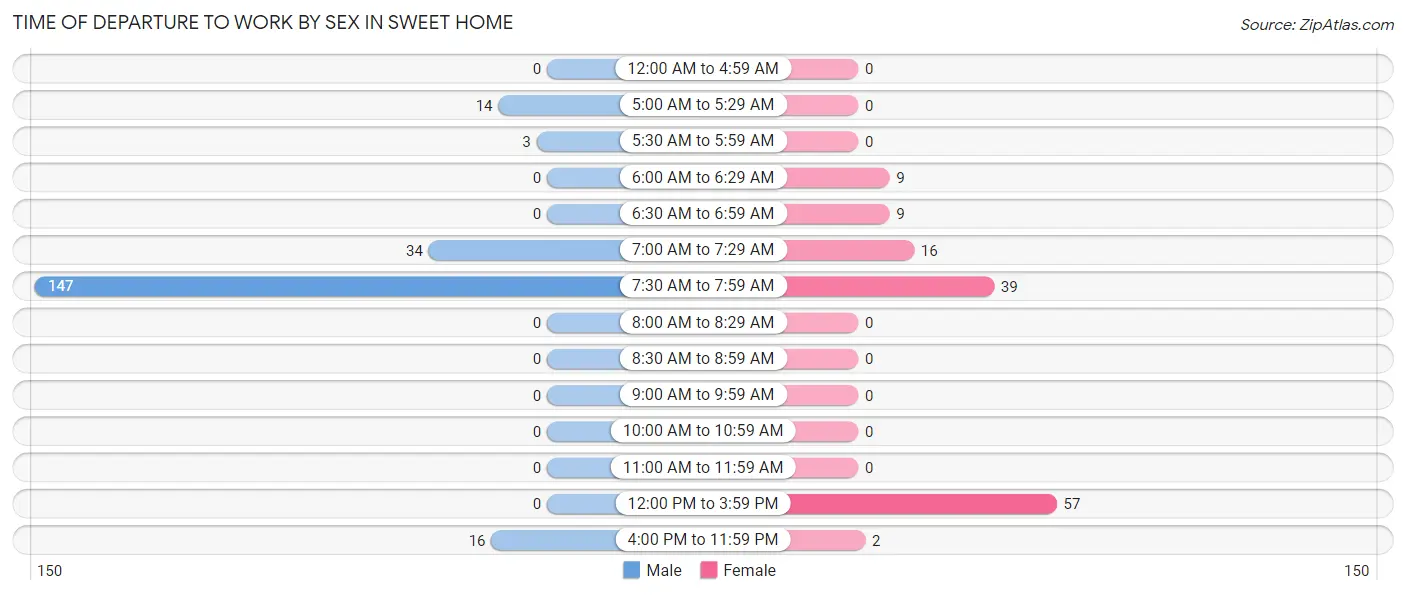
| Time of Departure | Male | Female |
| 12:00 AM to 4:59 AM | 0 (0.0%) | 0 (0.0%) |
| 5:00 AM to 5:29 AM | 14 (6.5%) | 0 (0.0%) |
| 5:30 AM to 5:59 AM | 3 (1.4%) | 0 (0.0%) |
| 6:00 AM to 6:29 AM | 0 (0.0%) | 9 (6.8%) |
| 6:30 AM to 6:59 AM | 0 (0.0%) | 9 (6.8%) |
| 7:00 AM to 7:29 AM | 34 (15.9%) | 16 (12.1%) |
| 7:30 AM to 7:59 AM | 147 (68.7%) | 39 (29.5%) |
| 8:00 AM to 8:29 AM | 0 (0.0%) | 0 (0.0%) |
| 8:30 AM to 8:59 AM | 0 (0.0%) | 0 (0.0%) |
| 9:00 AM to 9:59 AM | 0 (0.0%) | 0 (0.0%) |
| 10:00 AM to 10:59 AM | 0 (0.0%) | 0 (0.0%) |
| 11:00 AM to 11:59 AM | 0 (0.0%) | 0 (0.0%) |
| 12:00 PM to 3:59 PM | 0 (0.0%) | 57 (43.2%) |
| 4:00 PM to 11:59 PM | 16 (7.5%) | 2 (1.5%) |
| Total | 214 (100.0%) | 132 (100.0%) |
Housing Occupancy in Sweet Home
Occupancy by Ownership in Sweet Home
Of the total 274 dwellings in Sweet Home, owner-occupied units account for 182 (66.4%), while renter-occupied units make up 92 (33.6%).
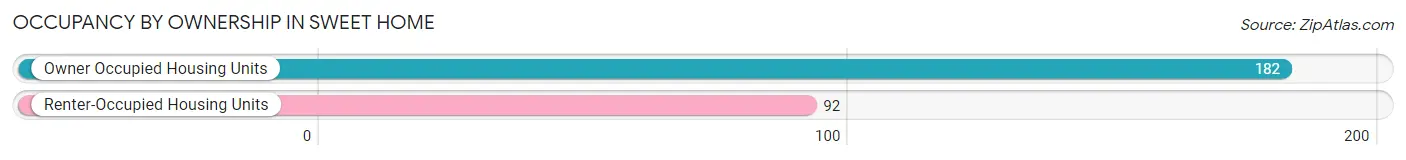
| Occupancy | # Housing Units | % Housing Units |
| Owner Occupied Housing Units | 182 | 66.4% |
| Renter-Occupied Housing Units | 92 | 33.6% |
| Total Occupied Housing Units | 274 | 100.0% |
Occupancy by Household Size in Sweet Home
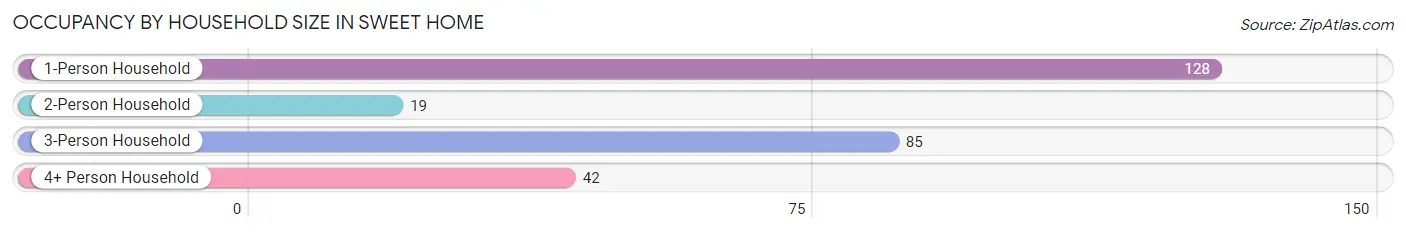
| Household Size | # Housing Units | % Housing Units |
| 1-Person Household | 128 | 46.7% |
| 2-Person Household | 19 | 6.9% |
| 3-Person Household | 85 | 31.0% |
| 4+ Person Household | 42 | 15.3% |
| Total Housing Units | 274 | 100.0% |
Occupancy by Ownership by Household Size in Sweet Home
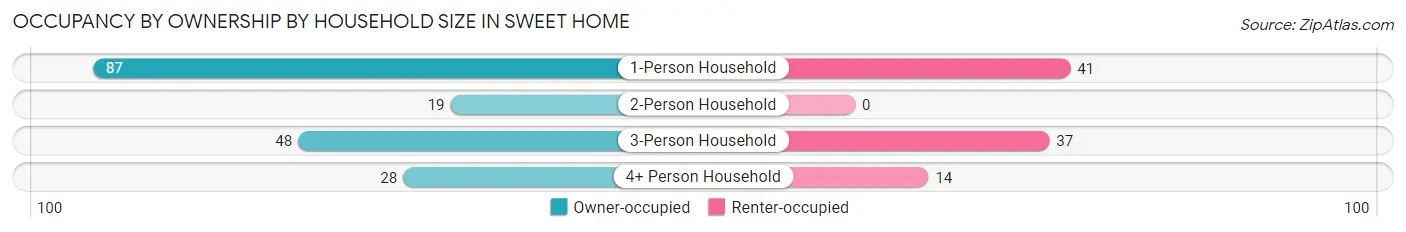
| Household Size | Owner-occupied | Renter-occupied |
| 1-Person Household | 87 (68.0%) | 41 (32.0%) |
| 2-Person Household | 19 (100.0%) | 0 (0.0%) |
| 3-Person Household | 48 (56.5%) | 37 (43.5%) |
| 4+ Person Household | 28 (66.7%) | 14 (33.3%) |
| Total Housing Units | 182 (66.4%) | 92 (33.6%) |
Occupancy by Educational Attainment in Sweet Home
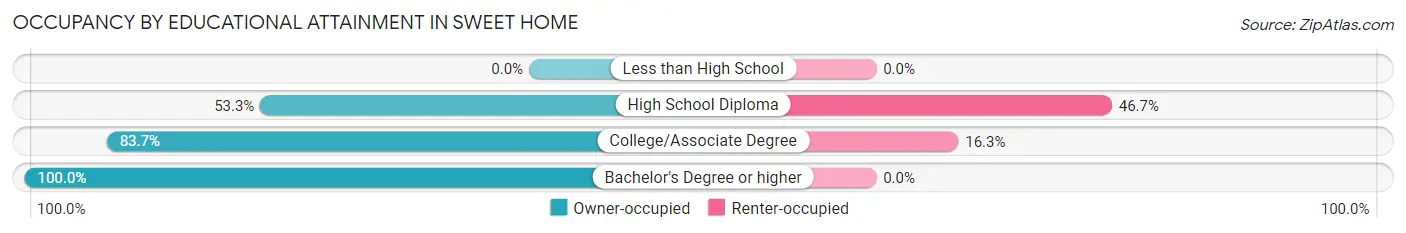
| Household Size | Owner-occupied | Renter-occupied |
| Less than High School | 0 (0.0%) | 0 (0.0%) |
| High School Diploma | 89 (53.3%) | 78 (46.7%) |
| College/Associate Degree | 72 (83.7%) | 14 (16.3%) |
| Bachelor's Degree or higher | 21 (100.0%) | 0 (0.0%) |
Occupancy by Age of Householder in Sweet Home
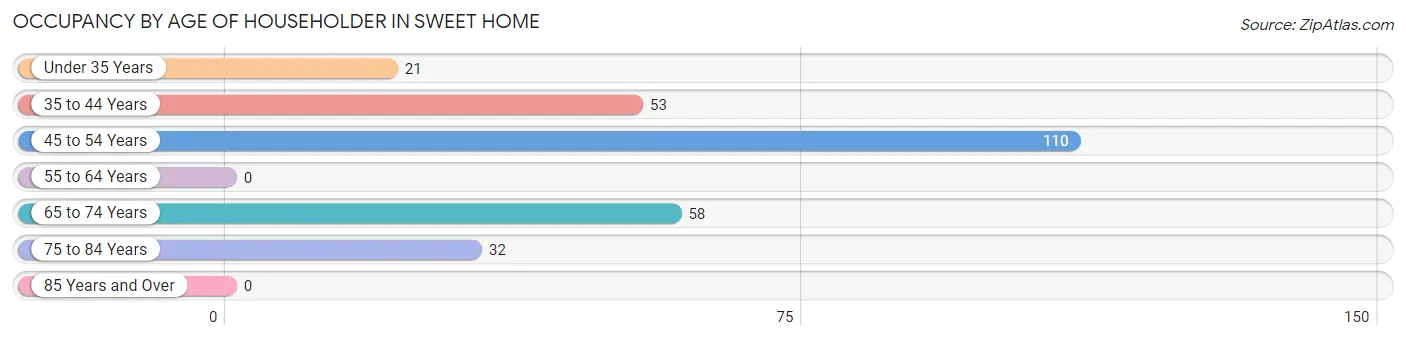
| Age Bracket | # Households | % Households |
| Under 35 Years | 21 | 7.7% |
| 35 to 44 Years | 53 | 19.3% |
| 45 to 54 Years | 110 | 40.2% |
| 55 to 64 Years | 0 | 0.0% |
| 65 to 74 Years | 58 | 21.2% |
| 75 to 84 Years | 32 | 11.7% |
| 85 Years and Over | 0 | 0.0% |
| Total | 274 | 100.0% |
Housing Finances in Sweet Home
Median Income by Occupancy in Sweet Home
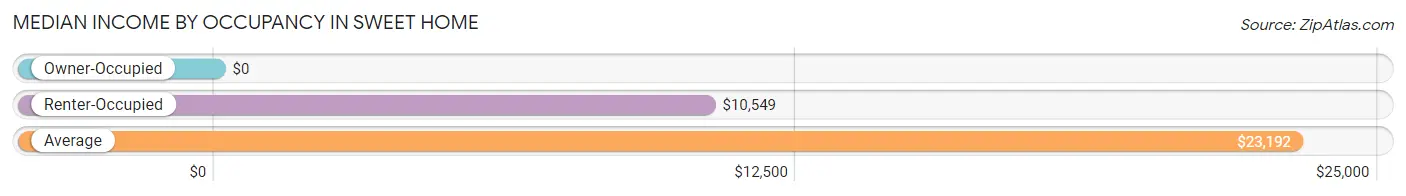
| Occupancy Type | # Households | Median Income |
| Owner-Occupied | 182 (66.4%) | $0 |
| Renter-Occupied | 92 (33.6%) | $10,549 |
| Average | 274 (100.0%) | $23,192 |
Occupancy by Householder Income Bracket in Sweet Home
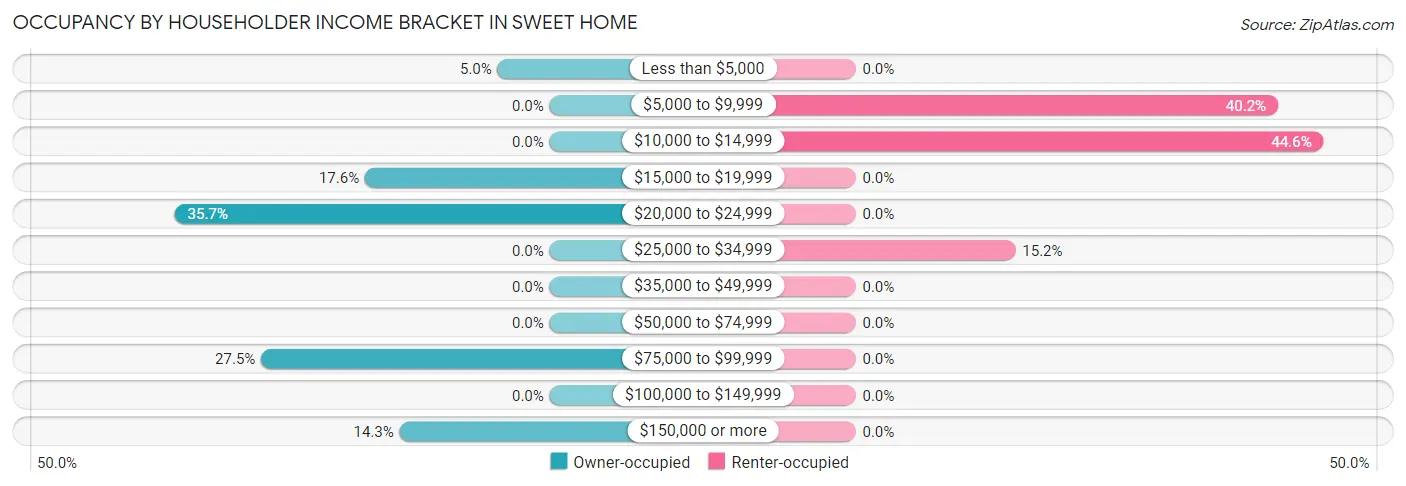
| Income Bracket | Owner-occupied | Renter-occupied |
| Less than $5,000 | 9 (5.0%) | 0 (0.0%) |
| $5,000 to $9,999 | 0 (0.0%) | 37 (40.2%) |
| $10,000 to $14,999 | 0 (0.0%) | 41 (44.6%) |
| $15,000 to $19,999 | 32 (17.6%) | 0 (0.0%) |
| $20,000 to $24,999 | 65 (35.7%) | 0 (0.0%) |
| $25,000 to $34,999 | 0 (0.0%) | 14 (15.2%) |
| $35,000 to $49,999 | 0 (0.0%) | 0 (0.0%) |
| $50,000 to $74,999 | 0 (0.0%) | 0 (0.0%) |
| $75,000 to $99,999 | 50 (27.5%) | 0 (0.0%) |
| $100,000 to $149,999 | 0 (0.0%) | 0 (0.0%) |
| $150,000 or more | 26 (14.3%) | 0 (0.0%) |
| Total | 182 (100.0%) | 92 (100.0%) |
Monthly Housing Cost Tiers in Sweet Home
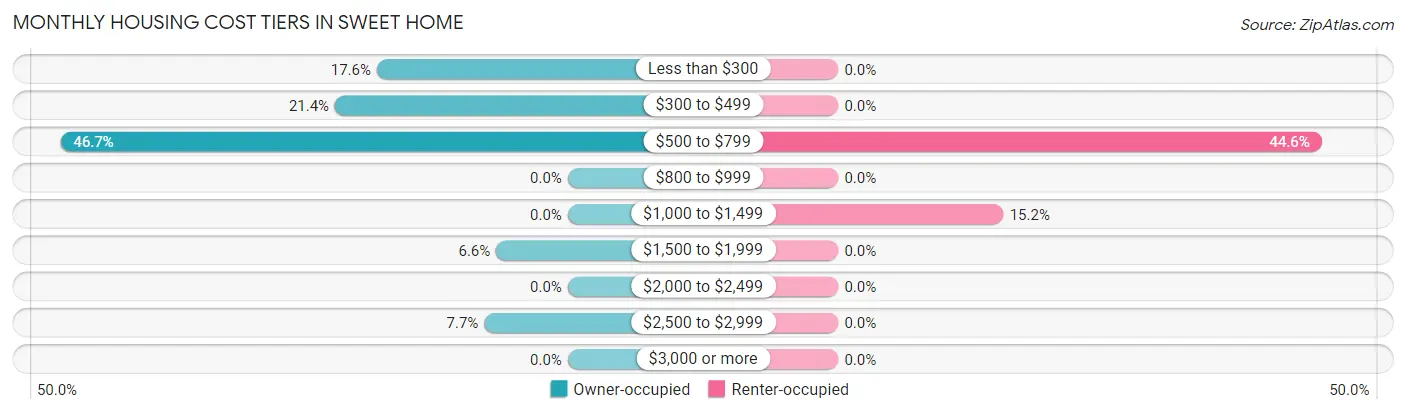
| Monthly Cost | Owner-occupied | Renter-occupied |
| Less than $300 | 32 (17.6%) | 0 (0.0%) |
| $300 to $499 | 39 (21.4%) | 0 (0.0%) |
| $500 to $799 | 85 (46.7%) | 41 (44.6%) |
| $800 to $999 | 0 (0.0%) | 0 (0.0%) |
| $1,000 to $1,499 | 0 (0.0%) | 14 (15.2%) |
| $1,500 to $1,999 | 12 (6.6%) | 0 (0.0%) |
| $2,000 to $2,499 | 0 (0.0%) | 0 (0.0%) |
| $2,500 to $2,999 | 14 (7.7%) | 0 (0.0%) |
| $3,000 or more | 0 (0.0%) | 0 (0.0%) |
| Total | 182 (100.0%) | 92 (100.0%) |
Physical Housing Characteristics in Sweet Home
Housing Structures in Sweet Home
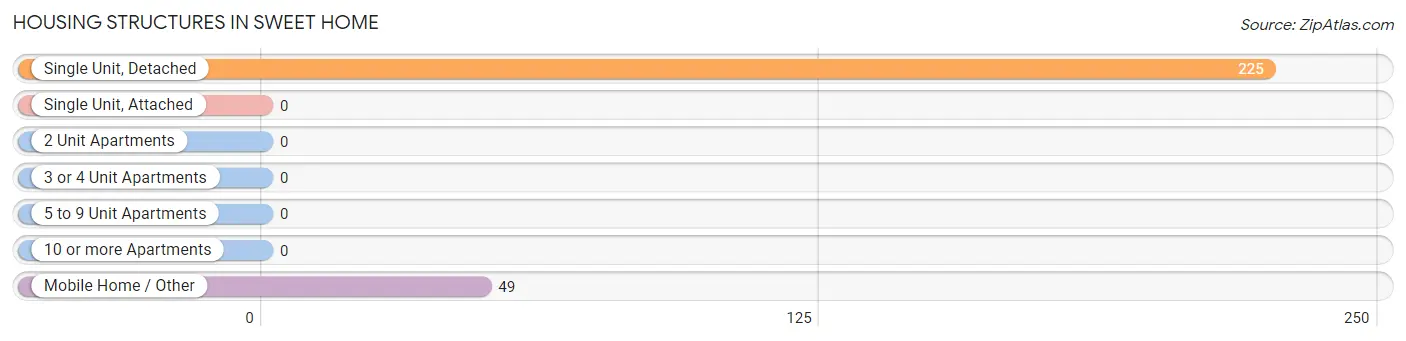
| Structure Type | # Housing Units | % Housing Units |
| Single Unit, Detached | 225 | 82.1% |
| Single Unit, Attached | 0 | 0.0% |
| 2 Unit Apartments | 0 | 0.0% |
| 3 or 4 Unit Apartments | 0 | 0.0% |
| 5 to 9 Unit Apartments | 0 | 0.0% |
| 10 or more Apartments | 0 | 0.0% |
| Mobile Home / Other | 49 | 17.9% |
| Total | 274 | 100.0% |
Housing Structures by Occupancy in Sweet Home
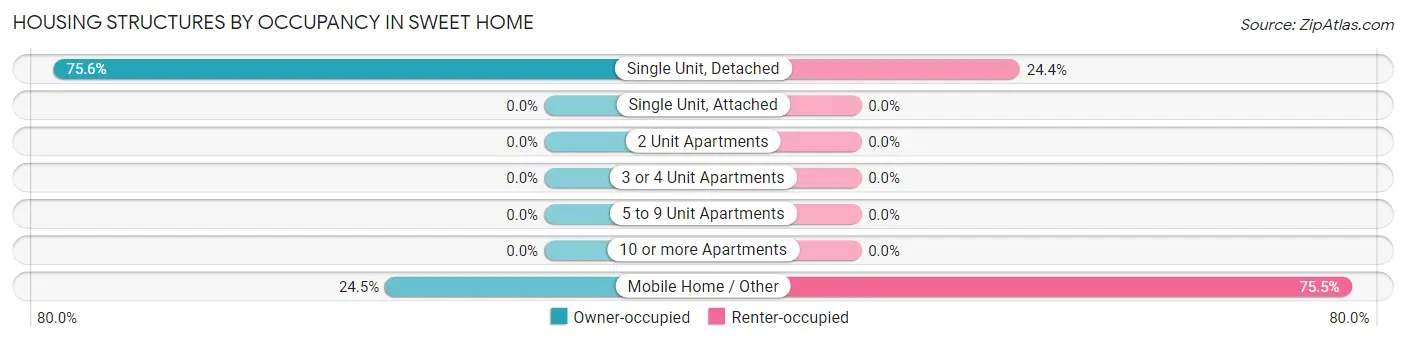
| Structure Type | Owner-occupied | Renter-occupied |
| Single Unit, Detached | 170 (75.6%) | 55 (24.4%) |
| Single Unit, Attached | 0 (0.0%) | 0 (0.0%) |
| 2 Unit Apartments | 0 (0.0%) | 0 (0.0%) |
| 3 or 4 Unit Apartments | 0 (0.0%) | 0 (0.0%) |
| 5 to 9 Unit Apartments | 0 (0.0%) | 0 (0.0%) |
| 10 or more Apartments | 0 (0.0%) | 0 (0.0%) |
| Mobile Home / Other | 12 (24.5%) | 37 (75.5%) |
| Total | 182 (66.4%) | 92 (33.6%) |
Housing Structures by Number of Rooms in Sweet Home
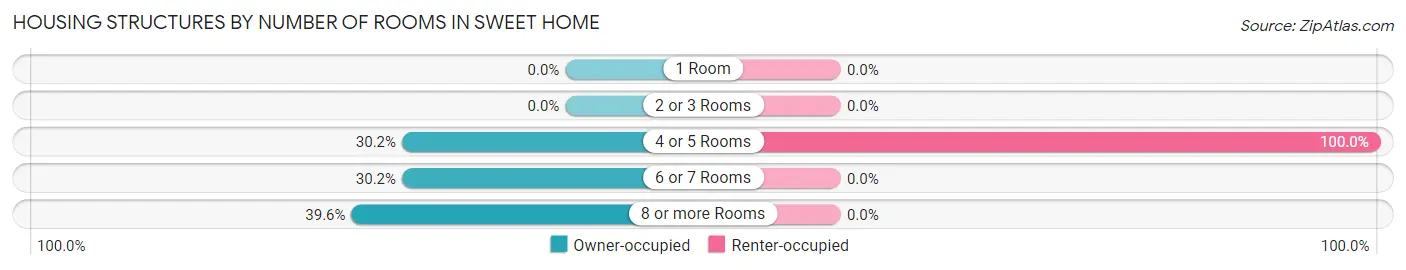
| Number of Rooms | Owner-occupied | Renter-occupied |
| 1 Room | 0 (0.0%) | 0 (0.0%) |
| 2 or 3 Rooms | 0 (0.0%) | 0 (0.0%) |
| 4 or 5 Rooms | 55 (30.2%) | 92 (100.0%) |
| 6 or 7 Rooms | 55 (30.2%) | 0 (0.0%) |
| 8 or more Rooms | 72 (39.6%) | 0 (0.0%) |
| Total | 182 (100.0%) | 92 (100.0%) |
Housing Structure by Heating Type in Sweet Home
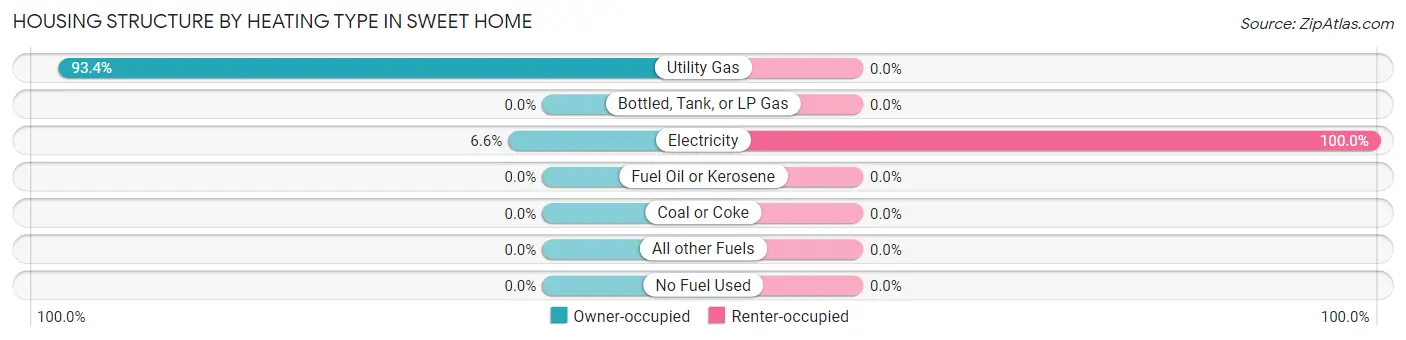
| Heating Type | Owner-occupied | Renter-occupied |
| Utility Gas | 170 (93.4%) | 0 (0.0%) |
| Bottled, Tank, or LP Gas | 0 (0.0%) | 0 (0.0%) |
| Electricity | 12 (6.6%) | 92 (100.0%) |
| Fuel Oil or Kerosene | 0 (0.0%) | 0 (0.0%) |
| Coal or Coke | 0 (0.0%) | 0 (0.0%) |
| All other Fuels | 0 (0.0%) | 0 (0.0%) |
| No Fuel Used | 0 (0.0%) | 0 (0.0%) |
| Total | 182 (100.0%) | 92 (100.0%) |
Household Vehicle Usage in Sweet Home
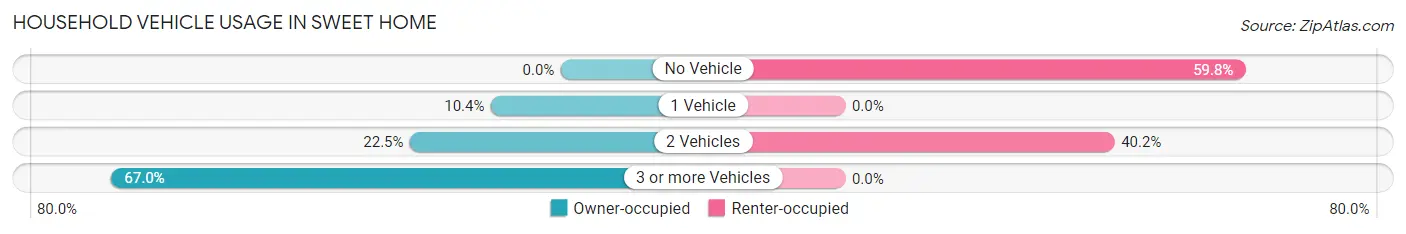
| Vehicles per Household | Owner-occupied | Renter-occupied |
| No Vehicle | 0 (0.0%) | 55 (59.8%) |
| 1 Vehicle | 19 (10.4%) | 0 (0.0%) |
| 2 Vehicles | 41 (22.5%) | 37 (40.2%) |
| 3 or more Vehicles | 122 (67.0%) | 0 (0.0%) |
| Total | 182 (100.0%) | 92 (100.0%) |
Real Estate & Mortgages in Sweet Home
Real Estate and Mortgage Overview in Sweet Home
| Characteristic | Without Mortgage | With Mortgage |
| Housing Units | 147 | 35 |
| Median Property Value | - | - |
| Median Household Income | - | - |
| Monthly Housing Costs | $513 | $0 |
| Real Estate Taxes | - | - |
Property Value by Mortgage Status in Sweet Home
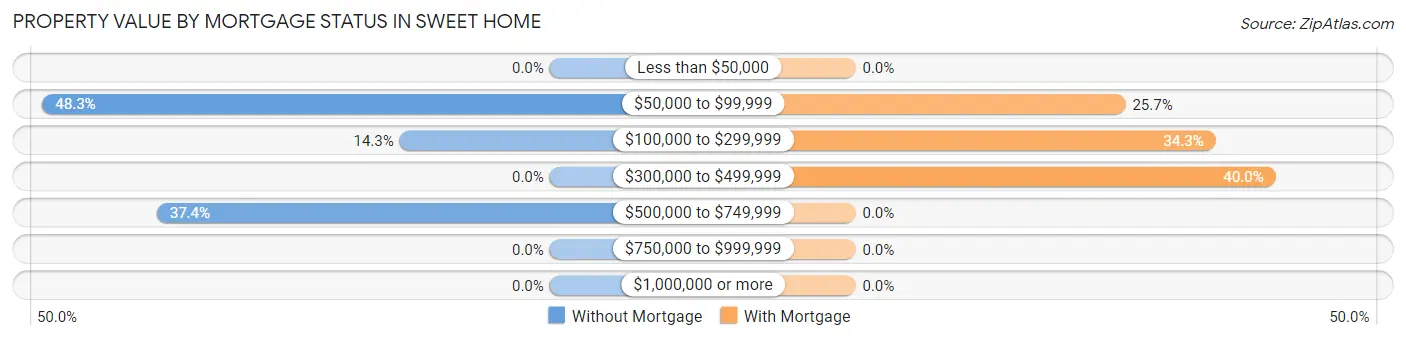
| Property Value | Without Mortgage | With Mortgage |
| Less than $50,000 | 0 (0.0%) | 0 (0.0%) |
| $50,000 to $99,999 | 71 (48.3%) | 9 (25.7%) |
| $100,000 to $299,999 | 21 (14.3%) | 12 (34.3%) |
| $300,000 to $499,999 | 0 (0.0%) | 14 (40.0%) |
| $500,000 to $749,999 | 55 (37.4%) | 0 (0.0%) |
| $750,000 to $999,999 | 0 (0.0%) | 0 (0.0%) |
| $1,000,000 or more | 0 (0.0%) | 0 (0.0%) |
| Total | 147 (100.0%) | 35 (100.0%) |
Household Income by Mortgage Status in Sweet Home
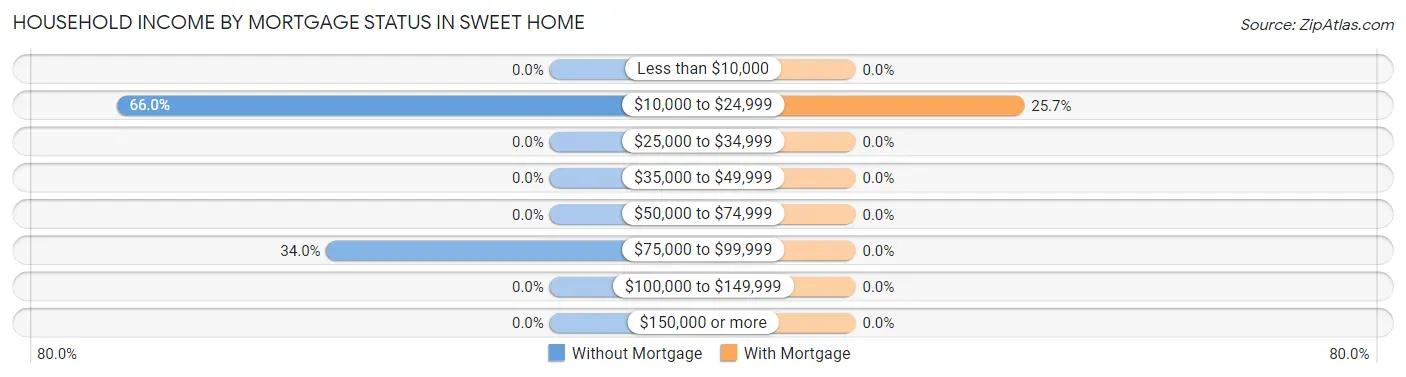
| Household Income | Without Mortgage | With Mortgage |
| Less than $10,000 | 0 (0.0%) | 0 (0.0%) |
| $10,000 to $24,999 | 97 (66.0%) | 9 (25.7%) |
| $25,000 to $34,999 | 0 (0.0%) | 0 (0.0%) |
| $35,000 to $49,999 | 0 (0.0%) | 0 (0.0%) |
| $50,000 to $74,999 | 0 (0.0%) | 0 (0.0%) |
| $75,000 to $99,999 | 50 (34.0%) | 0 (0.0%) |
| $100,000 to $149,999 | 0 (0.0%) | 0 (0.0%) |
| $150,000 or more | 0 (0.0%) | 0 (0.0%) |
| Total | 147 (100.0%) | 35 (100.0%) |
Property Value to Household Income Ratio in Sweet Home
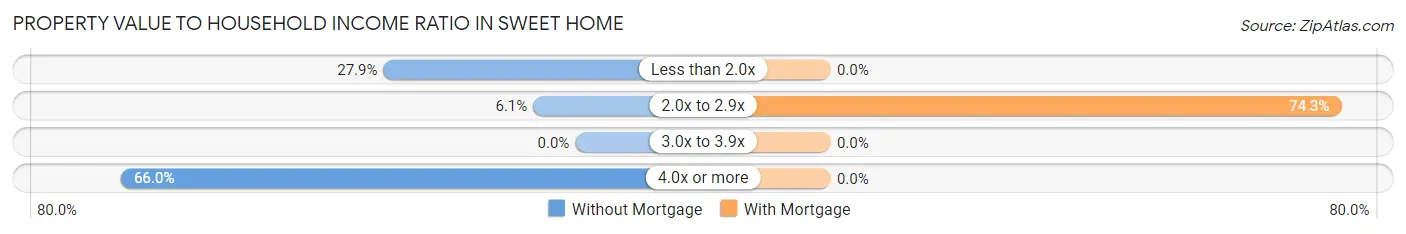
| Value-to-Income Ratio | Without Mortgage | With Mortgage |
| Less than 2.0x | 41 (27.9%) | 0 (0.0%) |
| 2.0x to 2.9x | 9 (6.1%) | 26 (74.3%) |
| 3.0x to 3.9x | 0 (0.0%) | 0 (0.0%) |
| 4.0x or more | 97 (66.0%) | 0 (0.0%) |
| Total | 147 (100.0%) | 35 (100.0%) |
Real Estate Taxes by Mortgage Status in Sweet Home
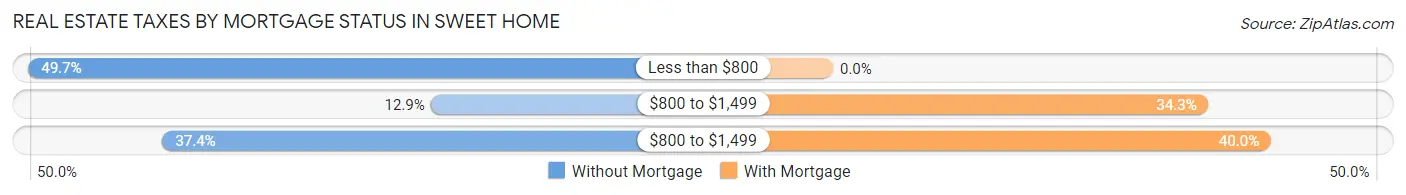
| Property Taxes | Without Mortgage | With Mortgage |
| Less than $800 | 73 (49.7%) | 0 (0.0%) |
| $800 to $1,499 | 19 (12.9%) | 12 (34.3%) |
| $800 to $1,499 | 55 (37.4%) | 14 (40.0%) |
| Total | 147 (100.0%) | 35 (100.0%) |
Health & Disability in Sweet Home
Health Insurance Coverage by Age in Sweet Home
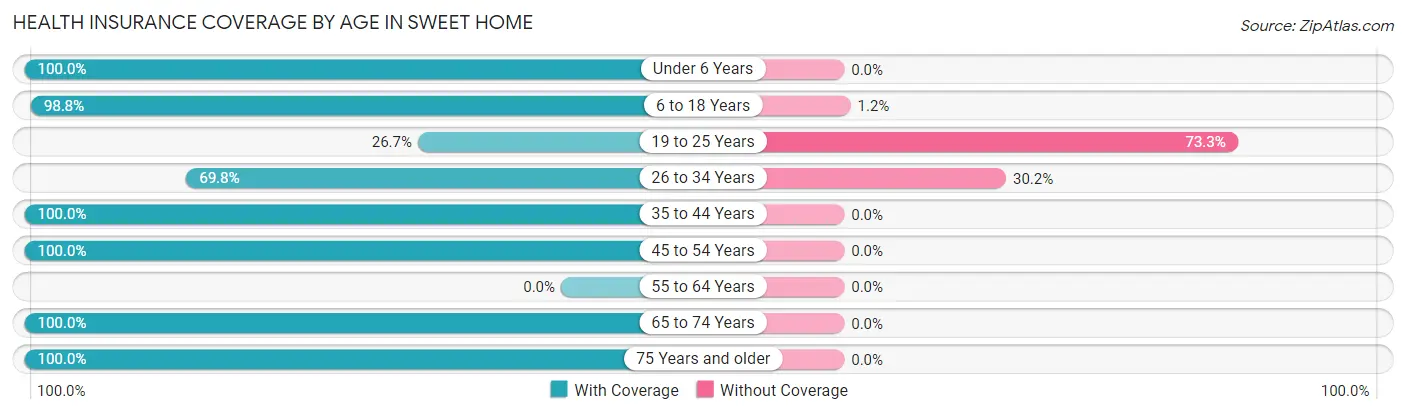
| Age Bracket | With Coverage | Without Coverage |
| Under 6 Years | 86 (100.0%) | 0 (0.0%) |
| 6 to 18 Years | 167 (98.8%) | 2 (1.2%) |
| 19 to 25 Years | 40 (26.7%) | 110 (73.3%) |
| 26 to 34 Years | 44 (69.8%) | 19 (30.2%) |
| 35 to 44 Years | 85 (100.0%) | 0 (0.0%) |
| 45 to 54 Years | 305 (100.0%) | 0 (0.0%) |
| 55 to 64 Years | 0 (0.0%) | 0 (0.0%) |
| 65 to 74 Years | 58 (100.0%) | 0 (0.0%) |
| 75 Years and older | 57 (100.0%) | 0 (0.0%) |
| Total | 842 (86.5%) | 131 (13.5%) |
Health Insurance Coverage by Citizenship Status in Sweet Home
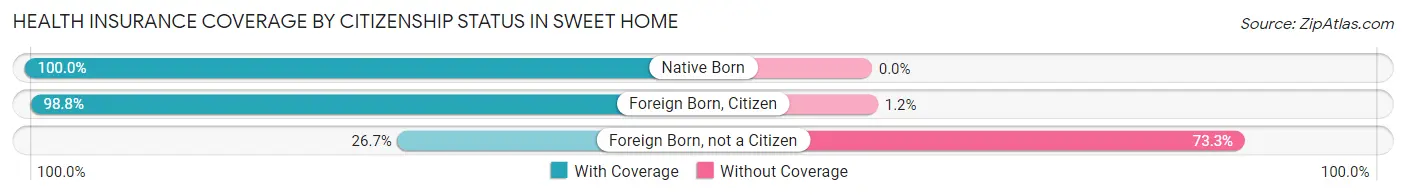
| Citizenship Status | With Coverage | Without Coverage |
| Native Born | 86 (100.0%) | 0 (0.0%) |
| Foreign Born, Citizen | 167 (98.8%) | 2 (1.2%) |
| Foreign Born, not a Citizen | 40 (26.7%) | 110 (73.3%) |
Health Insurance Coverage by Household Income in Sweet Home
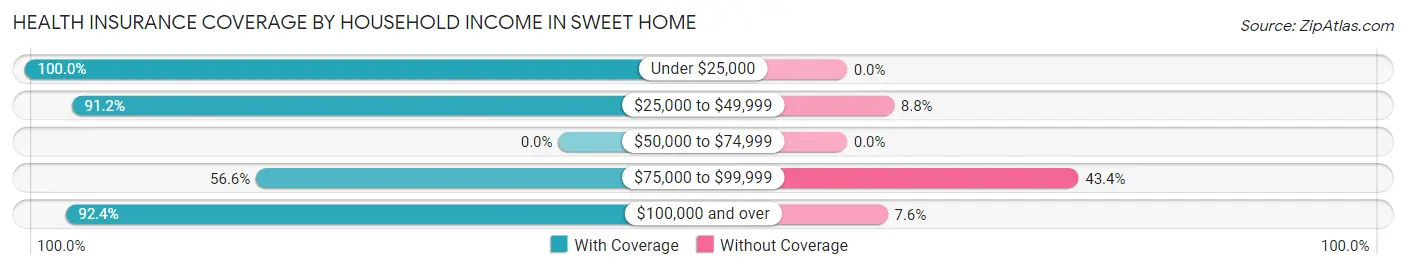
| Household Income | With Coverage | Without Coverage |
| Under $25,000 | 312 (100.0%) | 0 (0.0%) |
| $25,000 to $49,999 | 176 (91.2%) | 17 (8.8%) |
| $50,000 to $74,999 | 0 (0.0%) | 0 (0.0%) |
| $75,000 to $99,999 | 124 (56.6%) | 95 (43.4%) |
| $100,000 and over | 230 (92.4%) | 19 (7.6%) |
Public vs Private Health Insurance Coverage by Age in Sweet Home
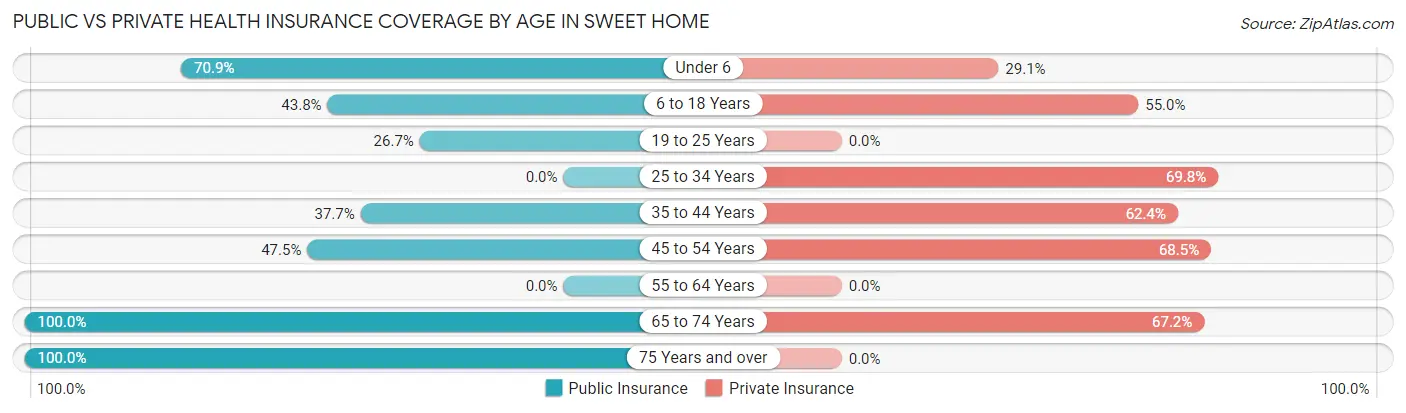
| Age Bracket | Public Insurance | Private Insurance |
| Under 6 | 61 (70.9%) | 25 (29.1%) |
| 6 to 18 Years | 74 (43.8%) | 93 (55.0%) |
| 19 to 25 Years | 40 (26.7%) | 0 (0.0%) |
| 25 to 34 Years | 0 (0.0%) | 44 (69.8%) |
| 35 to 44 Years | 32 (37.7%) | 53 (62.4%) |
| 45 to 54 Years | 145 (47.5%) | 209 (68.5%) |
| 55 to 64 Years | 0 (0.0%) | 0 (0.0%) |
| 65 to 74 Years | 58 (100.0%) | 39 (67.2%) |
| 75 Years and over | 57 (100.0%) | 0 (0.0%) |
| Total | 467 (48.0%) | 463 (47.6%) |
Disability Status by Sex by Age in Sweet Home
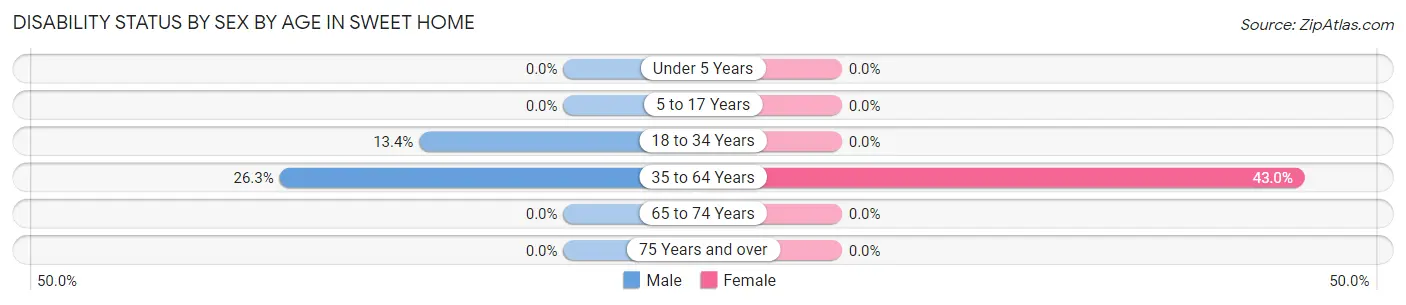
| Age Bracket | Male | Female |
| Under 5 Years | 0 (0.0%) | 0 (0.0%) |
| 5 to 17 Years | 0 (0.0%) | 0 (0.0%) |
| 18 to 34 Years | 19 (13.4%) | 0 (0.0%) |
| 35 to 64 Years | 69 (26.3%) | 55 (43.0%) |
| 65 to 74 Years | 0 (0.0%) | 0 (0.0%) |
| 75 Years and over | 0 (0.0%) | 0 (0.0%) |
Disability Class by Sex by Age in Sweet Home
Disability Class: Hearing Difficulty
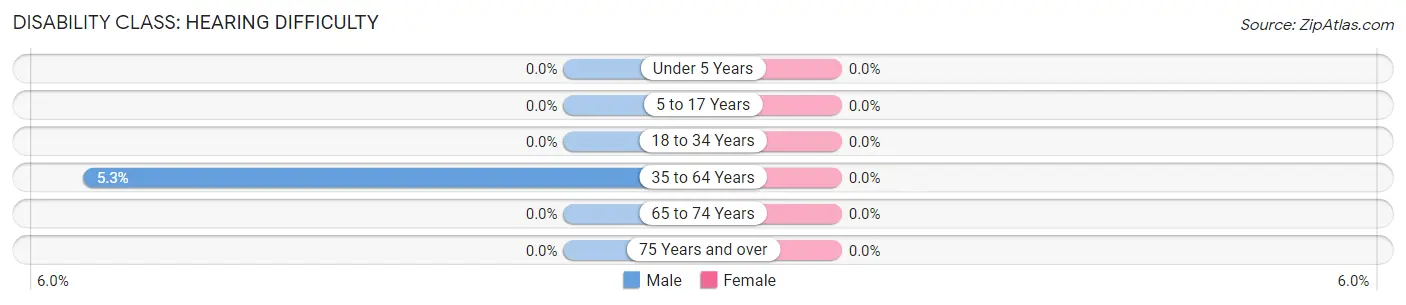
| Age Bracket | Male | Female |
| Under 5 Years | 0 (0.0%) | 0 (0.0%) |
| 5 to 17 Years | 0 (0.0%) | 0 (0.0%) |
| 18 to 34 Years | 0 (0.0%) | 0 (0.0%) |
| 35 to 64 Years | 14 (5.3%) | 0 (0.0%) |
| 65 to 74 Years | 0 (0.0%) | 0 (0.0%) |
| 75 Years and over | 0 (0.0%) | 0 (0.0%) |
Disability Class: Vision Difficulty
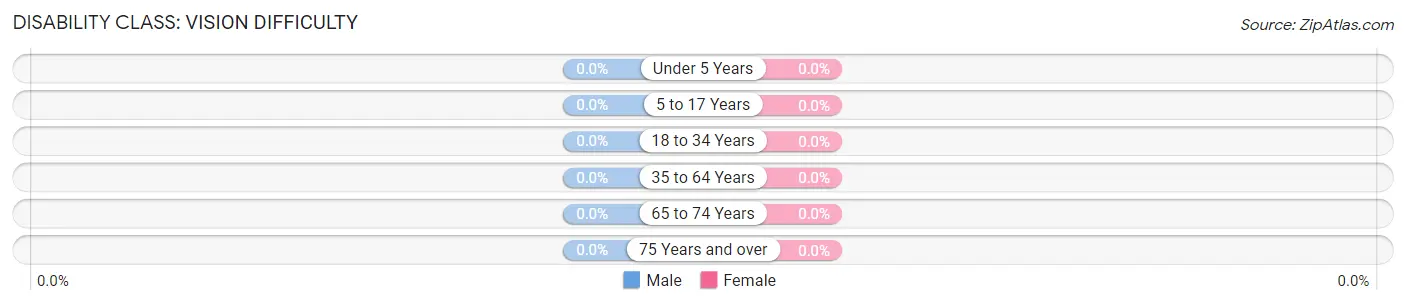
| Age Bracket | Male | Female |
| Under 5 Years | 0 (0.0%) | 0 (0.0%) |
| 5 to 17 Years | 0 (0.0%) | 0 (0.0%) |
| 18 to 34 Years | 0 (0.0%) | 0 (0.0%) |
| 35 to 64 Years | 0 (0.0%) | 0 (0.0%) |
| 65 to 74 Years | 0 (0.0%) | 0 (0.0%) |
| 75 Years and over | 0 (0.0%) | 0 (0.0%) |
Disability Class: Cognitive Difficulty
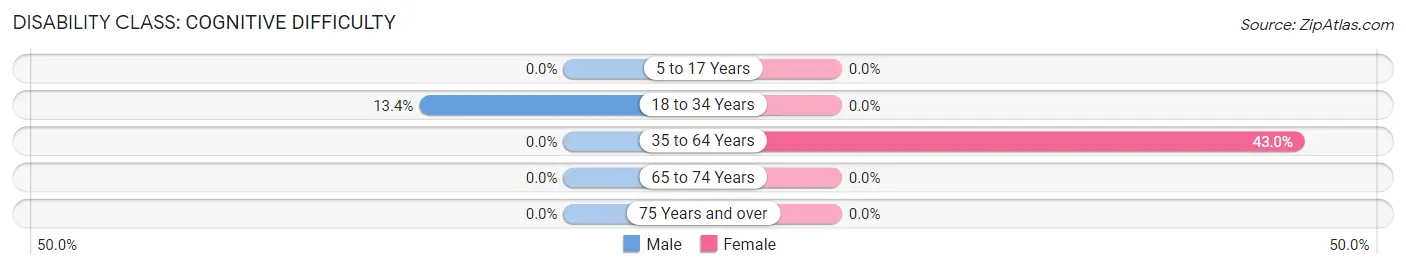
| Age Bracket | Male | Female |
| 5 to 17 Years | 0 (0.0%) | 0 (0.0%) |
| 18 to 34 Years | 19 (13.4%) | 0 (0.0%) |
| 35 to 64 Years | 0 (0.0%) | 55 (43.0%) |
| 65 to 74 Years | 0 (0.0%) | 0 (0.0%) |
| 75 Years and over | 0 (0.0%) | 0 (0.0%) |
Disability Class: Ambulatory Difficulty
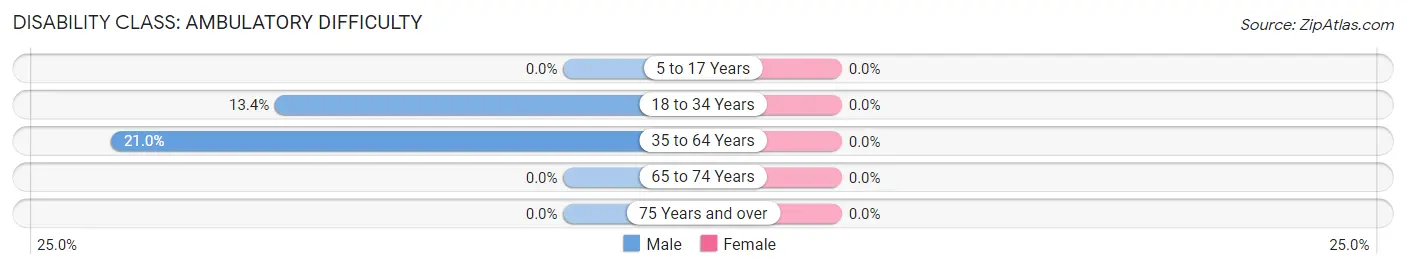
| Age Bracket | Male | Female |
| 5 to 17 Years | 0 (0.0%) | 0 (0.0%) |
| 18 to 34 Years | 19 (13.4%) | 0 (0.0%) |
| 35 to 64 Years | 55 (21.0%) | 0 (0.0%) |
| 65 to 74 Years | 0 (0.0%) | 0 (0.0%) |
| 75 Years and over | 0 (0.0%) | 0 (0.0%) |
Disability Class: Self-Care Difficulty
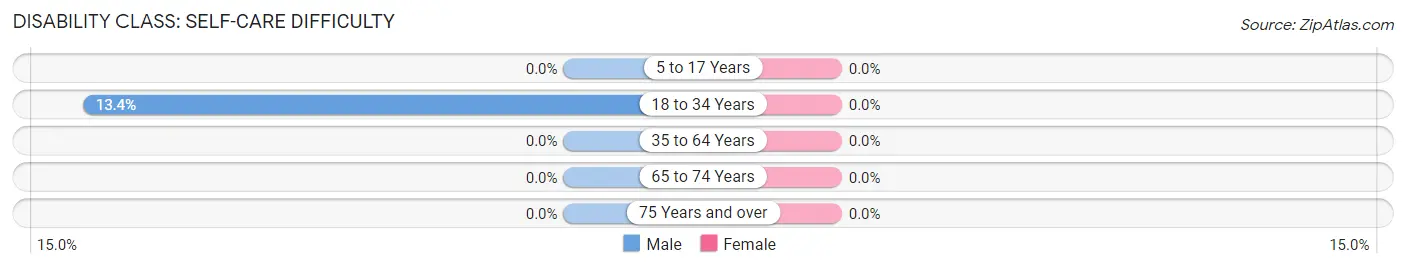
| Age Bracket | Male | Female |
| 5 to 17 Years | 0 (0.0%) | 0 (0.0%) |
| 18 to 34 Years | 19 (13.4%) | 0 (0.0%) |
| 35 to 64 Years | 0 (0.0%) | 0 (0.0%) |
| 65 to 74 Years | 0 (0.0%) | 0 (0.0%) |
| 75 Years and over | 0 (0.0%) | 0 (0.0%) |
Technology Access in Sweet Home
Computing Device Access in Sweet Home
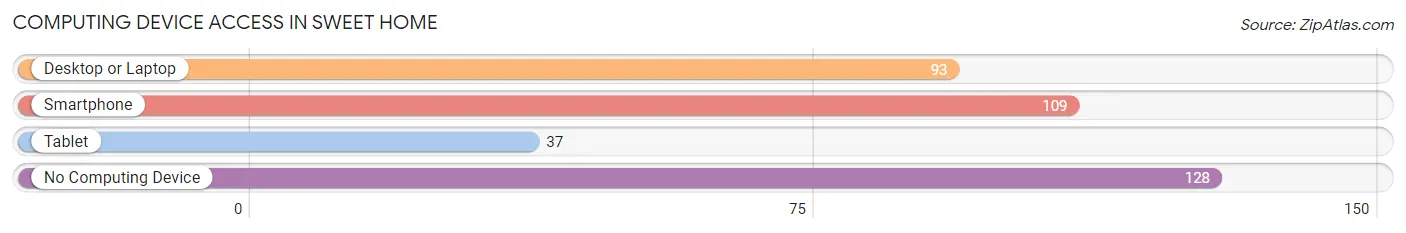
| Device Type | # Households | % Households |
| Desktop or Laptop | 93 | 33.9% |
| Smartphone | 109 | 39.8% |
| Tablet | 37 | 13.5% |
| No Computing Device | 128 | 46.7% |
| Total | 274 | 100.0% |
Internet Access in Sweet Home
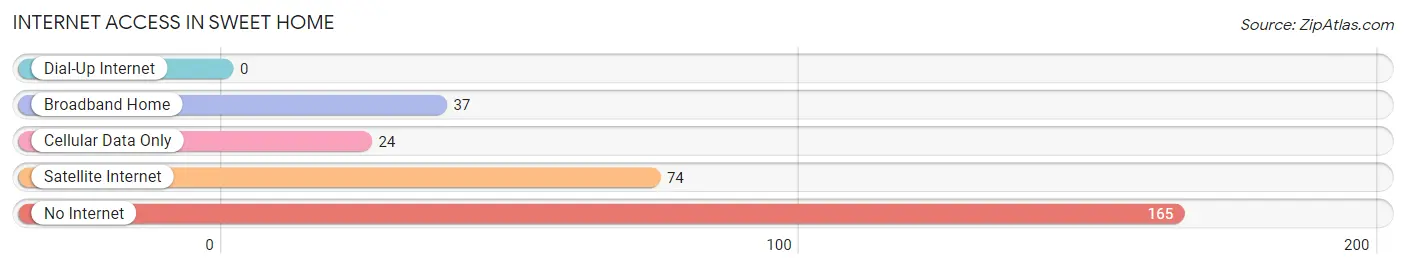
| Internet Type | # Households | % Households |
| Dial-Up Internet | 0 | 0.0% |
| Broadband Home | 37 | 13.5% |
| Cellular Data Only | 24 | 8.8% |
| Satellite Internet | 74 | 27.0% |
| No Internet | 165 | 60.2% |
| Total | 274 | 100.0% |
Sweet Home Summary
Home Sweet Home Arkansas
Home Sweet Home, Arkansas is a small town located in the Ozark Mountains of Northwest Arkansas. It is situated in the foothills of the Ozarks, and is surrounded by the White River and the Buffalo National River. The town is located in Madison County, and is part of the Fayetteville-Springdale-Rogers Metropolitan Statistical Area. Home Sweet Home has a population of approximately 1,000 people, and is a rural community with a strong sense of community and pride.
History
Home Sweet Home was founded in 1883 by a group of settlers from the nearby town of Huntsville. The settlers were looking for a place to call home, and they found it in the rolling hills of the Ozarks. The town was originally called “Home Sweet Home” because of the beauty of the area and the welcoming nature of the people. The town was officially incorporated in 1887, and the first post office was established in 1888.
The town grew slowly over the years, and by the early 1900s, it had become a thriving community. The town was home to several businesses, including a general store, a blacksmith shop, a sawmill, and a gristmill. The town also had a school, a church, and a post office.
In the early 1900s, the town was a popular destination for tourists, and it was known for its beautiful scenery and outdoor activities. The town was also home to several resorts, which attracted visitors from all over the country.
Geography
Home Sweet Home is located in the Ozark Mountains of Northwest Arkansas. The town is situated in the foothills of the Ozarks, and is surrounded by the White River and the Buffalo National River. The town is located in Madison County, and is part of the Fayetteville-Springdale-Rogers Metropolitan Statistical Area.
The town is located at an elevation of 1,000 feet, and the climate is mild and humid. The average temperature in the summer is around 80 degrees Fahrenheit, and the average temperature in the winter is around 40 degrees Fahrenheit.
Economy
Home Sweet Home is a rural community with a strong sense of community and pride. The town is home to several small businesses, including a general store, a blacksmith shop, a sawmill, and a gristmill. The town also has a school, a church, and a post office.
The town is also home to several tourist attractions, including the Ozark National Forest, the Buffalo National River, and the White River. The town is also home to several resorts, which attract visitors from all over the country.
Demographics
As of the 2010 census, Home Sweet Home had a population of 1,000 people. The racial makeup of the town was 97.2% White, 0.7% African American, 0.2% Native American, 0.2% Asian, 0.2% from other races, and 1.7% from two or more races. Hispanic or Latino of any race were 0.7% of the population.
The median income for a household in the town was $30,000, and the median income for a family was $35,000. The per capita income for the town was $15,000. About 15.2% of families and 17.2% of the population were below the poverty line, including 22.2% of those under age 18 and 8.2% of those age 65 or over.
Common Questions
What is Per Capita Income in Sweet Home?
Per Capita income in Sweet Home is $27,568.
What is the Median Household income in Sweet Home?
Median Household Income in Sweet Home is $23,192.
What is Inequality or Gini Index in Sweet Home?
Inequality or Gini Index in Sweet Home is 0.74.
What is the Total Population of Sweet Home?
Total Population of Sweet Home is 973.
What is the Total Male Population of Sweet Home?
Total Male Population of Sweet Home is 604.
What is the Total Female Population of Sweet Home?
Total Female Population of Sweet Home is 369.
What is the Ratio of Males per 100 Females in Sweet Home?
There are 163.69 Males per 100 Females in Sweet Home.
What is the Ratio of Females per 100 Males in Sweet Home?
There are 61.09 Females per 100 Males in Sweet Home.
What is the Median Population Age in Sweet Home?
Median Population Age in Sweet Home is 38.3 Years.
What is the Average Family Size in Sweet Home
Average Family Size in Sweet Home is 5.1 People.
What is the Average Household Size in Sweet Home
Average Household Size in Sweet Home is 3.5 People.
How Large is the Labor Force in Sweet Home?
There are 440 People in the Labor Forcein in Sweet Home.
What is the Percentage of People in the Labor Force in Sweet Home?
56.2% of People are in the Labor Force in Sweet Home.
What is the Unemployment Rate in Sweet Home?
Unemployment Rate in Sweet Home is 11.6%.