Harrison, AR Map & Demographics
Harrison Map
Harrison Overview
$27,095
PER CAPITA INCOME
$62,500
AVG FAMILY INCOME
$39,677
AVG HOUSEHOLD INCOME
12.9%
WAGE / INCOME GAP [ % ]
87.1¢/ $1
WAGE / INCOME GAP [ $ ]
$9,466
FAMILY INCOME DEFICIT
0.47
INEQUALITY / GINI INDEX
13,154
TOTAL POPULATION
6,374
MALE POPULATION
6,780
FEMALE POPULATION
94.01
MALES / 100 FEMALES
106.37
FEMALES / 100 MALES
41.8
MEDIAN AGE
3.1
AVG FAMILY SIZE
2.2
AVG HOUSEHOLD SIZE
5,790
LABOR FORCE [ PEOPLE ]
54.9%
PERCENT IN LABOR FORCE
6.4%
UNEMPLOYMENT RATE
Harrison Zip Codes
Harrison Area Codes
Income in Harrison
Income Overview in Harrison
Per Capita Income in Harrison is $27,095, while median incomes of families and households are $62,500 and $39,677 respectively.
| Characteristic | Number | Measure |
| Per Capita Income | 13,154 | $27,095 |
| Median Family Income | 3,054 | $62,500 |
| Mean Family Income | 3,054 | $83,081 |
| Median Household Income | 5,793 | $39,677 |
| Mean Household Income | 5,793 | $59,609 |
| Income Deficit | 3,054 | $9,466 |
| Wage / Income Gap (%) | 13,154 | 12.92% |
| Wage / Income Gap ($) | 13,154 | 87.08¢ per $1 |
| Gini / Inequality Index | 13,154 | 0.47 |
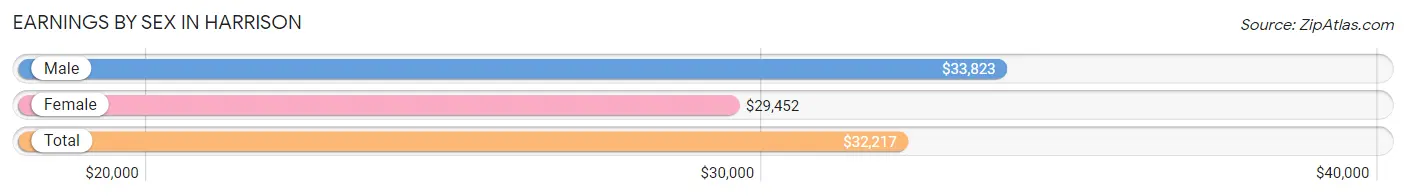
Earnings by Sex in Harrison
Average Earnings in Harrison are $32,217, $33,823 for men and $29,452 for women, a difference of 12.9%.
| Sex | Number | Average Earnings |
| Male | 3,251 (55.7%) | $33,823 |
| Female | 2,590 (44.3%) | $29,452 |
| Total | 5,841 (100.0%) | $32,217 |
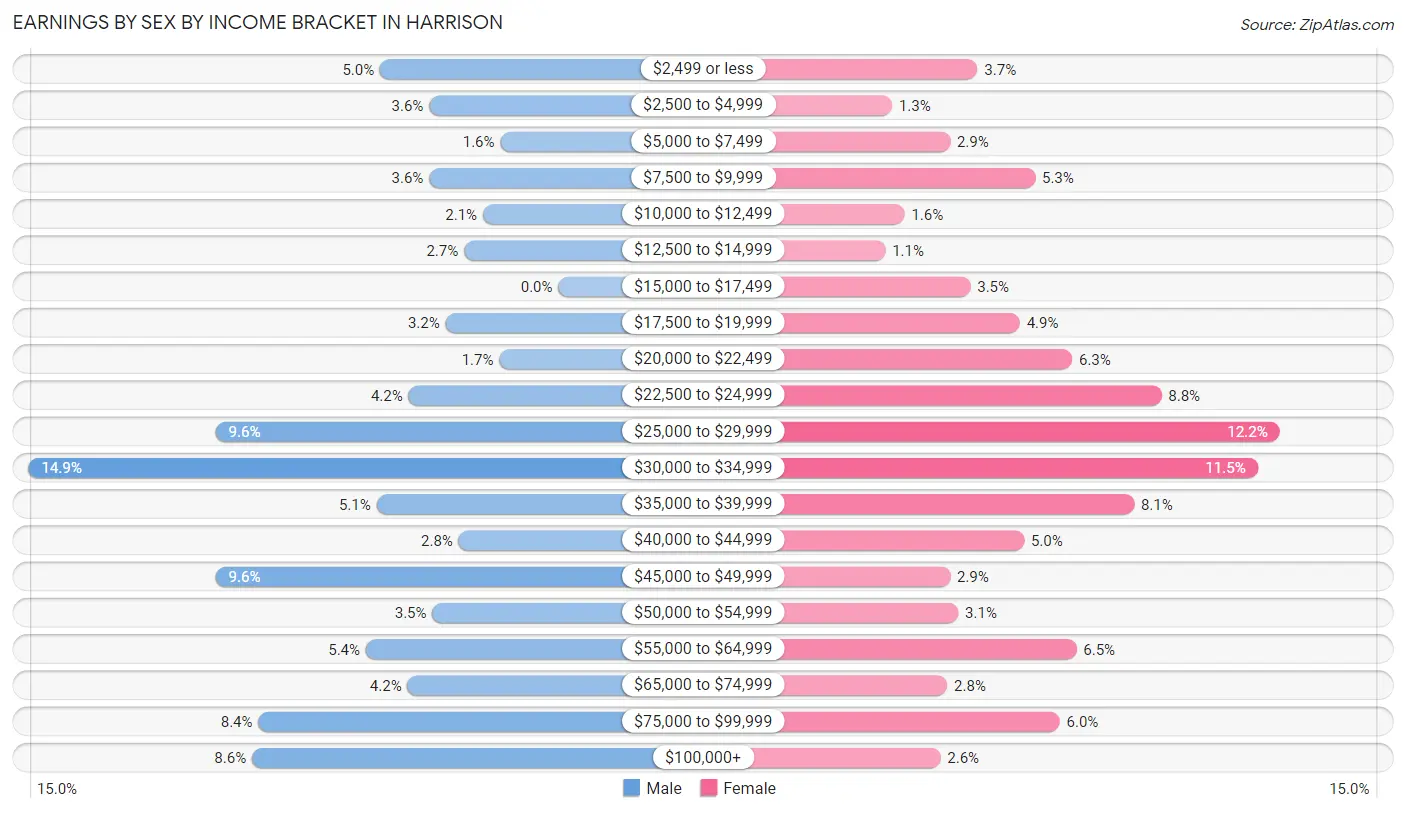
Earnings by Sex by Income Bracket in Harrison
The most common earnings brackets in Harrison are $30,000 to $34,999 for men (484 | 14.9%) and $25,000 to $29,999 for women (315 | 12.2%).
| Income | Male | Female |
| $2,499 or less | 163 (5.0%) | 95 (3.7%) |
| $2,500 to $4,999 | 118 (3.6%) | 33 (1.3%) |
| $5,000 to $7,499 | 53 (1.6%) | 75 (2.9%) |
| $7,500 to $9,999 | 118 (3.6%) | 137 (5.3%) |
| $10,000 to $12,499 | 69 (2.1%) | 42 (1.6%) |
| $12,500 to $14,999 | 86 (2.6%) | 28 (1.1%) |
| $15,000 to $17,499 | 0 (0.0%) | 90 (3.5%) |
| $17,500 to $19,999 | 103 (3.2%) | 126 (4.9%) |
| $20,000 to $22,499 | 54 (1.7%) | 164 (6.3%) |
| $22,500 to $24,999 | 137 (4.2%) | 229 (8.8%) |
| $25,000 to $29,999 | 313 (9.6%) | 315 (12.2%) |
| $30,000 to $34,999 | 484 (14.9%) | 299 (11.5%) |
| $35,000 to $39,999 | 166 (5.1%) | 209 (8.1%) |
| $40,000 to $44,999 | 91 (2.8%) | 129 (5.0%) |
| $45,000 to $49,999 | 313 (9.6%) | 75 (2.9%) |
| $50,000 to $54,999 | 115 (3.5%) | 81 (3.1%) |
| $55,000 to $64,999 | 176 (5.4%) | 167 (6.5%) |
| $65,000 to $74,999 | 138 (4.2%) | 73 (2.8%) |
| $75,000 to $99,999 | 274 (8.4%) | 155 (6.0%) |
| $100,000+ | 280 (8.6%) | 68 (2.6%) |
| Total | 3,251 (100.0%) | 2,590 (100.0%) |
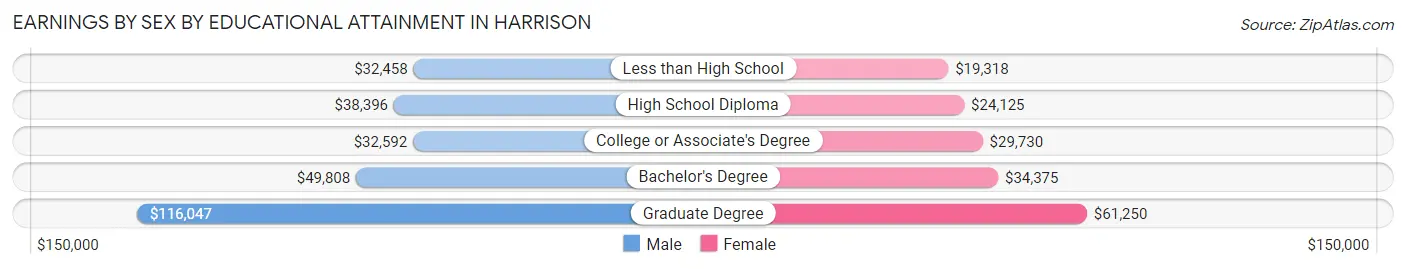
Earnings by Sex by Educational Attainment in Harrison
Average earnings in Harrison are $37,727 for men and $30,819 for women, a difference of 18.3%. Men with an educational attainment of graduate degree enjoy the highest average annual earnings of $116,047, while those with less than high school education earn the least with $32,458. Women with an educational attainment of graduate degree earn the most with the average annual earnings of $61,250, while those with less than high school education have the smallest earnings of $19,318.
| Educational Attainment | Male Income | Female Income |
| Less than High School | $32,458 | $19,318 |
| High School Diploma | $38,396 | $24,125 |
| College or Associate's Degree | $32,592 | $29,730 |
| Bachelor's Degree | $49,808 | $34,375 |
| Graduate Degree | $116,047 | $61,250 |
| Total | $37,727 | $30,819 |
Family Income in Harrison
Family Income Brackets in Harrison
According to the Harrison family income data, there are 562 families falling into the $75,000 to $99,999 income range, which is the most common income bracket and makes up 18.4% of all families. Conversely, the less than $10,000 income bracket is the least frequent group with only 89 families (2.9%) belonging to this category.
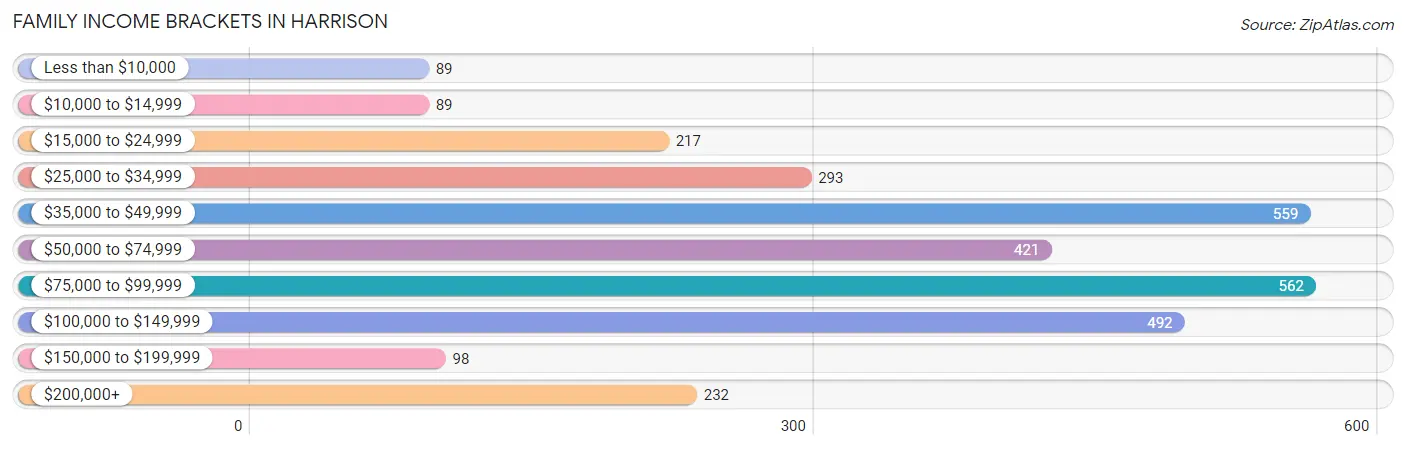
| Income Bracket | # Families | % Families |
| Less than $10,000 | 89 | 2.9% |
| $10,000 to $14,999 | 89 | 2.9% |
| $15,000 to $24,999 | 217 | 7.1% |
| $25,000 to $34,999 | 293 | 9.6% |
| $35,000 to $49,999 | 559 | 18.3% |
| $50,000 to $74,999 | 421 | 13.8% |
| $75,000 to $99,999 | 562 | 18.4% |
| $100,000 to $149,999 | 492 | 16.1% |
| $150,000 to $199,999 | 98 | 3.2% |
| $200,000+ | 232 | 7.6% |
Family Income by Famaliy Size in Harrison
5-person families (287 | 9.4%) account for the highest median family income in Harrison with $115,438 per family, while 3-person families (683 | 22.4%) have the highest median income of $25,252 per family member.
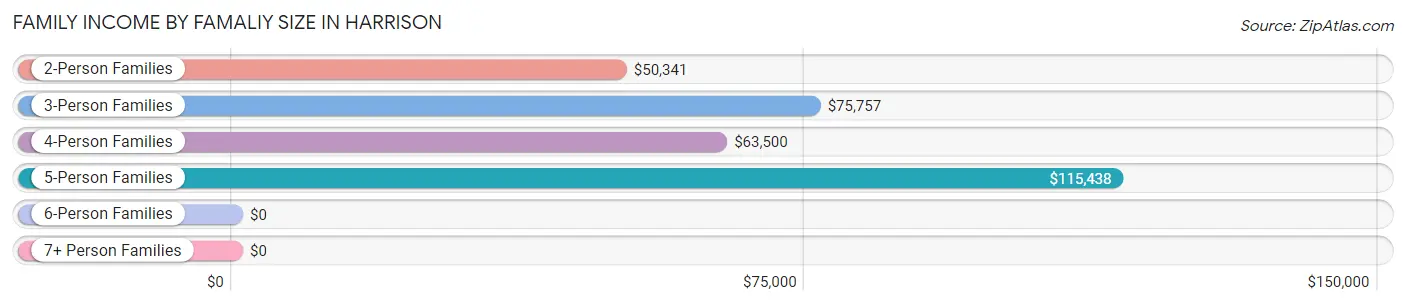
| Income Bracket | # Families | Median Income |
| 2-Person Families | 1,458 (47.7%) | $50,341 |
| 3-Person Families | 683 (22.4%) | $75,757 |
| 4-Person Families | 486 (15.9%) | $63,500 |
| 5-Person Families | 287 (9.4%) | $115,438 |
| 6-Person Families | 66 (2.2%) | $0 |
| 7+ Person Families | 74 (2.4%) | $0 |
| Total | 3,054 (100.0%) | $62,500 |
Family Income by Number of Earners in Harrison
The median family income in Harrison is $62,500, with families comprising 2 earners (1,012) having the highest median family income of $98,583, while families with 1 earner (965) have the lowest median family income of $40,592, accounting for 33.1% and 31.6% of families, respectively.
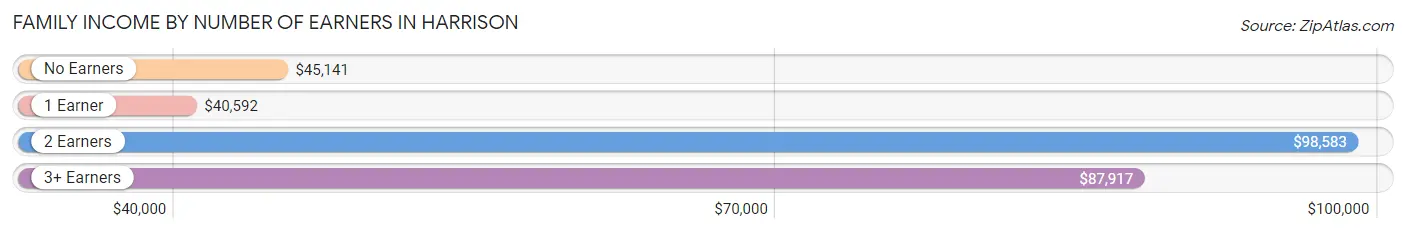
| Number of Earners | # Families | Median Income |
| No Earners | 817 (26.8%) | $45,141 |
| 1 Earner | 965 (31.6%) | $40,592 |
| 2 Earners | 1,012 (33.1%) | $98,583 |
| 3+ Earners | 260 (8.5%) | $87,917 |
| Total | 3,054 (100.0%) | $62,500 |
Household Income in Harrison
Household Income Brackets in Harrison
With 1,002 households falling in the category, the $25,000 to $34,999 income range is the most frequent in Harrison, accounting for 17.3% of all households. In contrast, only 127 households (2.2%) fall into the $150,000 to $199,999 income bracket, making it the least populous group.
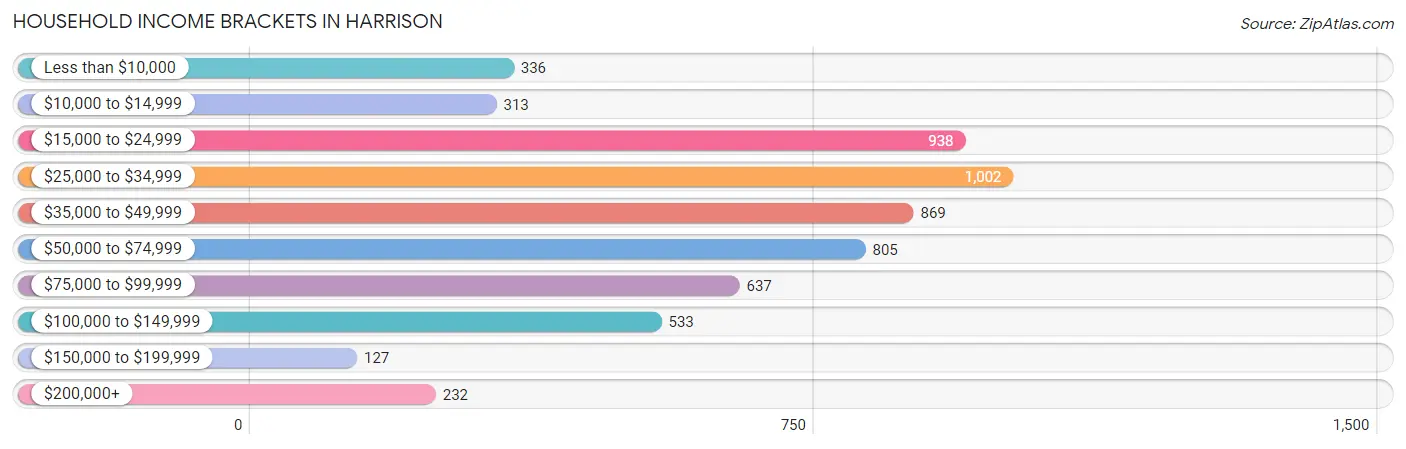
| Income Bracket | # Households | % Households |
| Less than $10,000 | 336 | 5.8% |
| $10,000 to $14,999 | 313 | 5.4% |
| $15,000 to $24,999 | 938 | 16.2% |
| $25,000 to $34,999 | 1,002 | 17.3% |
| $35,000 to $49,999 | 869 | 15.0% |
| $50,000 to $74,999 | 805 | 13.9% |
| $75,000 to $99,999 | 637 | 11.0% |
| $100,000 to $149,999 | 533 | 9.2% |
| $150,000 to $199,999 | 127 | 2.2% |
| $200,000+ | 232 | 4.0% |
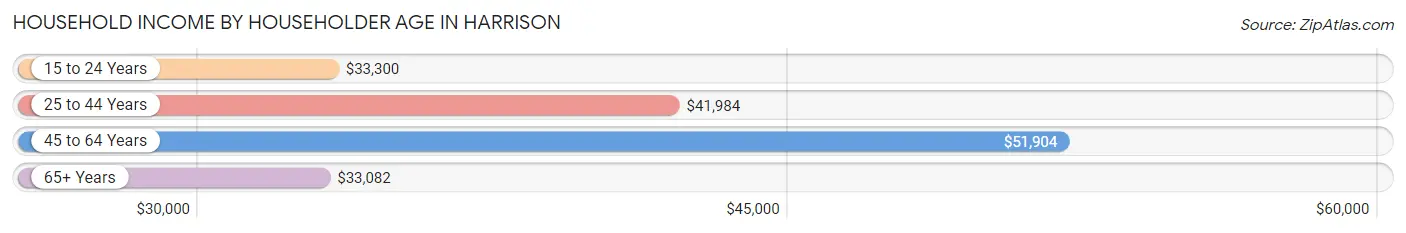
Household Income by Householder Age in Harrison
The median household income in Harrison is $39,677, with the highest median household income of $51,904 found in the 45 to 64 years age bracket for the primary householder. A total of 1,943 households (33.5%) fall into this category. Meanwhile, the 65+ years age bracket for the primary householder has the lowest median household income of $33,082, with 1,831 households (31.6%) in this group.
| Income Bracket | # Households | Median Income |
| 15 to 24 Years | 278 (4.8%) | $33,300 |
| 25 to 44 Years | 1,741 (30.0%) | $41,984 |
| 45 to 64 Years | 1,943 (33.5%) | $51,904 |
| 65+ Years | 1,831 (31.6%) | $33,082 |
| Total | 5,793 (100.0%) | $39,677 |
Poverty in Harrison
Income Below Poverty by Sex and Age in Harrison
With 13.1% poverty level for males and 18.8% for females among the residents of Harrison, 12 to 14 year old males and 5 year old females are the most vulnerable to poverty, with 85 males (34.4%) and 49 females (62.8%) in their respective age groups living below the poverty level.
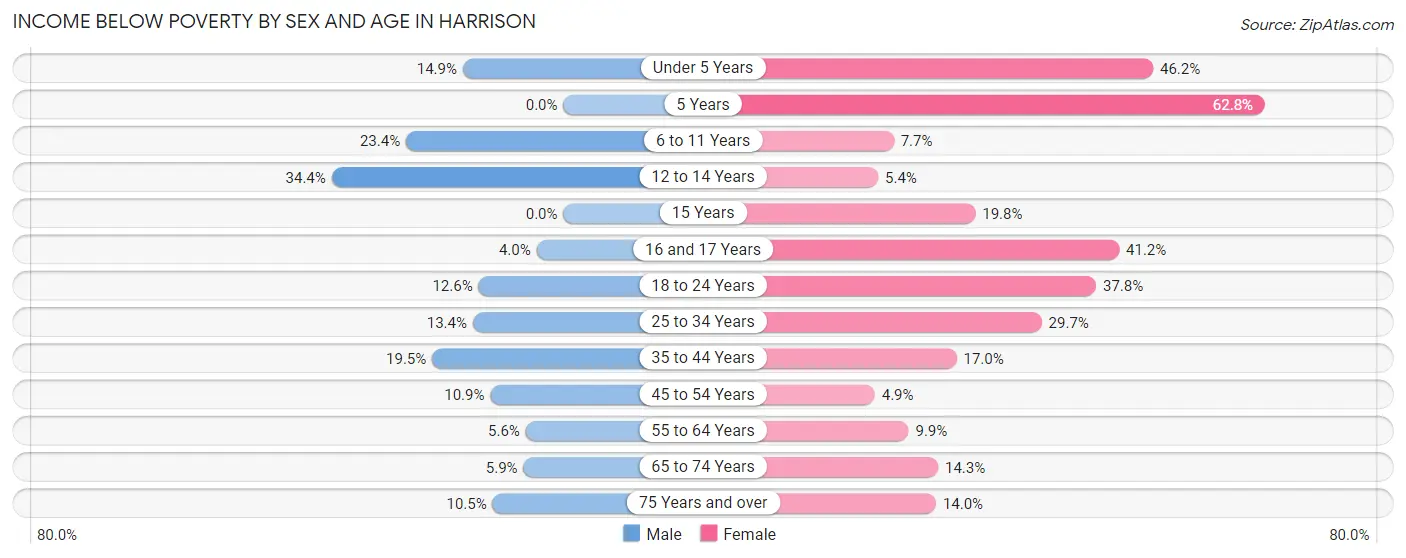
| Age Bracket | Male | Female |
| Under 5 Years | 40 (14.9%) | 171 (46.2%) |
| 5 Years | 0 (0.0%) | 49 (62.8%) |
| 6 to 11 Years | 147 (23.4%) | 31 (7.7%) |
| 12 to 14 Years | 85 (34.4%) | 11 (5.4%) |
| 15 Years | 0 (0.0%) | 43 (19.8%) |
| 16 and 17 Years | 8 (4.0%) | 28 (41.2%) |
| 18 to 24 Years | 64 (12.6%) | 111 (37.8%) |
| 25 to 34 Years | 104 (13.4%) | 314 (29.7%) |
| 35 to 44 Years | 144 (19.5%) | 130 (17.0%) |
| 45 to 54 Years | 84 (10.8%) | 26 (4.9%) |
| 55 to 64 Years | 53 (5.6%) | 99 (9.9%) |
| 65 to 74 Years | 31 (5.9%) | 105 (14.3%) |
| 75 Years and over | 52 (10.5%) | 125 (14.0%) |
| Total | 812 (13.1%) | 1,243 (18.8%) |
Income Above Poverty by Sex and Age in Harrison
According to the poverty statistics in Harrison, males aged 5 years and females aged 45 to 54 years are the age groups that are most secure financially, with 100.0% of males and 95.1% of females in these age groups living above the poverty line.
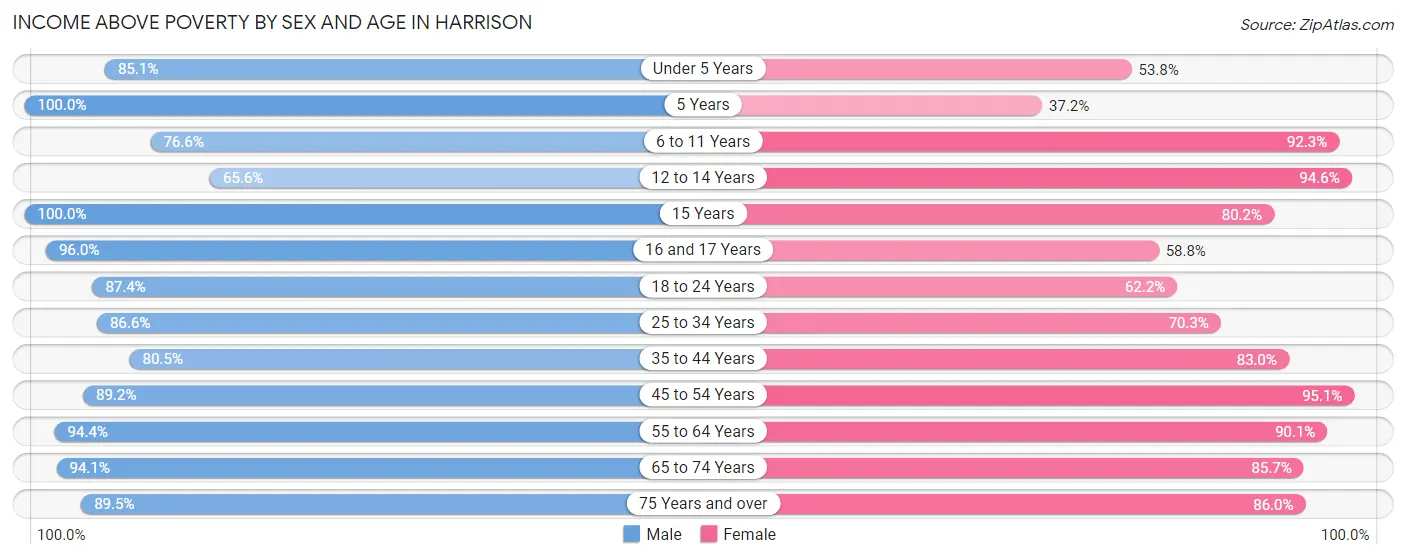
| Age Bracket | Male | Female |
| Under 5 Years | 228 (85.1%) | 199 (53.8%) |
| 5 Years | 41 (100.0%) | 29 (37.2%) |
| 6 to 11 Years | 482 (76.6%) | 371 (92.3%) |
| 12 to 14 Years | 162 (65.6%) | 193 (94.6%) |
| 15 Years | 59 (100.0%) | 174 (80.2%) |
| 16 and 17 Years | 193 (96.0%) | 40 (58.8%) |
| 18 to 24 Years | 444 (87.4%) | 183 (62.2%) |
| 25 to 34 Years | 670 (86.6%) | 744 (70.3%) |
| 35 to 44 Years | 595 (80.5%) | 633 (83.0%) |
| 45 to 54 Years | 690 (89.1%) | 505 (95.1%) |
| 55 to 64 Years | 895 (94.4%) | 900 (90.1%) |
| 65 to 74 Years | 492 (94.1%) | 630 (85.7%) |
| 75 Years and over | 443 (89.5%) | 769 (86.0%) |
| Total | 5,394 (86.9%) | 5,370 (81.2%) |
Income Below Poverty Among Married-Couple Families in Harrison
The poverty statistics for married-couple families in Harrison show that 4.5% or 98 of the total 2,183 families live below the poverty line. Families with 3 or 4 children have the highest poverty rate of 9.8%, comprising of 25 families. On the other hand, families with 5 or more children have the lowest poverty rate of 0.0%, which includes 0 families.
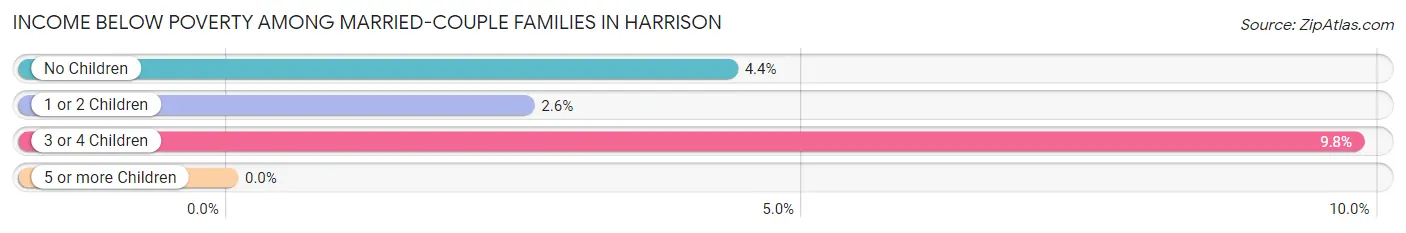
| Children | Above Poverty | Below Poverty |
| No Children | 1,274 (95.7%) | 58 (4.3%) |
| 1 or 2 Children | 567 (97.4%) | 15 (2.6%) |
| 3 or 4 Children | 230 (90.2%) | 25 (9.8%) |
| 5 or more Children | 14 (100.0%) | 0 (0.0%) |
| Total | 2,085 (95.5%) | 98 (4.5%) |
Income Below Poverty Among Single-Parent Households in Harrison
According to the poverty data in Harrison, 31.0% or 70 single-father households and 28.8% or 186 single-mother households are living below the poverty line. Among single-father households, those with 1 or 2 children have the highest poverty rate, with 37 households (48.0%) experiencing poverty. Likewise, among single-mother households, those with 3 or 4 children have the highest poverty rate, with 79 households (58.5%) falling below the poverty line.
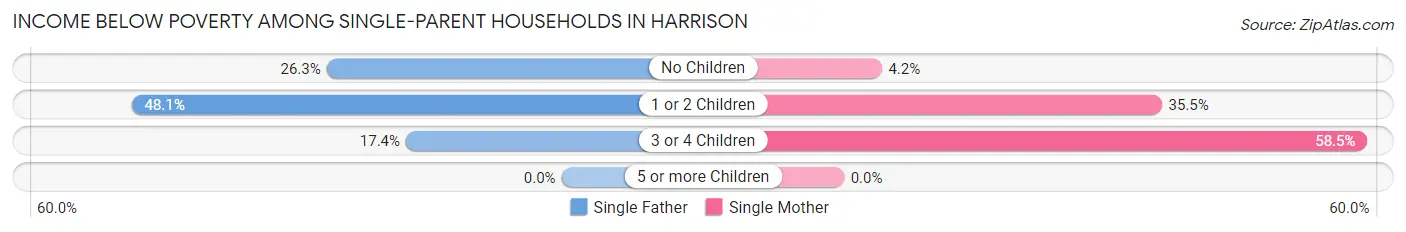
| Children | Single Father | Single Mother |
| No Children | 21 (26.3%) | 10 (4.2%) |
| 1 or 2 Children | 37 (48.0%) | 97 (35.5%) |
| 3 or 4 Children | 12 (17.4%) | 79 (58.5%) |
| 5 or more Children | 0 (0.0%) | 0 (0.0%) |
| Total | 70 (31.0%) | 186 (28.8%) |
Income Below Poverty Among Married-Couple vs Single-Parent Households in Harrison
The poverty data for Harrison shows that 98 of the married-couple family households (4.5%) and 256 of the single-parent households (29.4%) are living below the poverty level. Within the married-couple family households, those with 3 or 4 children have the highest poverty rate, with 25 households (9.8%) falling below the poverty line. Among the single-parent households, those with 3 or 4 children have the highest poverty rate, with 91 household (44.6%) living below poverty.
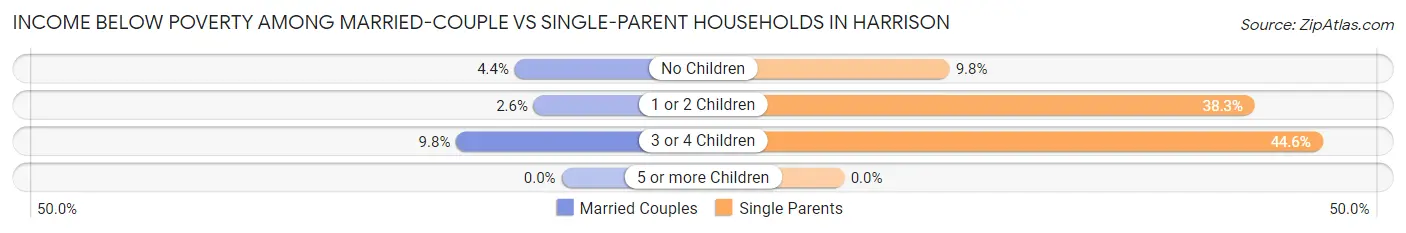
| Children | Married-Couple Families | Single-Parent Households |
| No Children | 58 (4.3%) | 31 (9.8%) |
| 1 or 2 Children | 15 (2.6%) | 134 (38.3%) |
| 3 or 4 Children | 25 (9.8%) | 91 (44.6%) |
| 5 or more Children | 0 (0.0%) | 0 (0.0%) |
| Total | 98 (4.5%) | 256 (29.4%) |
Race in Harrison
The most populous races in Harrison are White / Caucasian (12,452 | 94.7%), Hispanic or Latino (520 | 4.0%), and Two or more Races (520 | 4.0%).
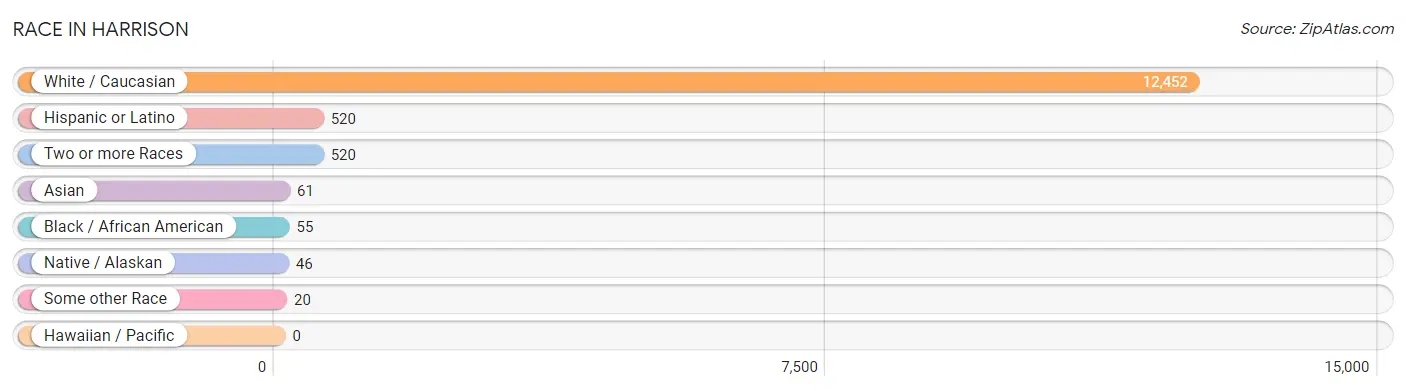
| Race | # Population | % Population |
| Asian | 61 | 0.5% |
| Black / African American | 55 | 0.4% |
| Hawaiian / Pacific | 0 | 0.0% |
| Hispanic or Latino | 520 | 4.0% |
| Native / Alaskan | 46 | 0.4% |
| White / Caucasian | 12,452 | 94.7% |
| Two or more Races | 520 | 4.0% |
| Some other Race | 20 | 0.2% |
| Total | 13,154 | 100.0% |
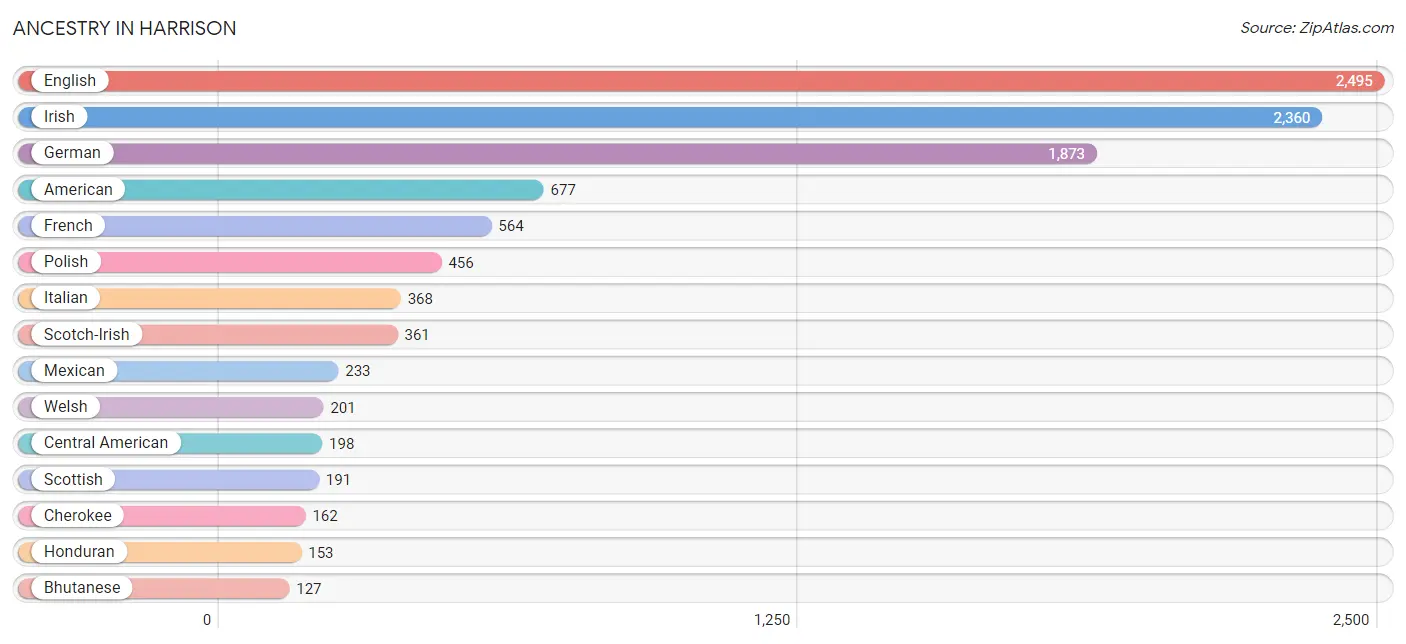
Ancestry in Harrison
The most populous ancestries reported in Harrison are English (2,495 | 19.0%), Irish (2,360 | 17.9%), German (1,873 | 14.2%), American (677 | 5.1%), and French (564 | 4.3%), together accounting for 60.6% of all Harrison residents.
| Ancestry | # Population | % Population |
| American | 677 | 5.1% |
| Arab | 11 | 0.1% |
| Belgian | 27 | 0.2% |
| Bhutanese | 127 | 1.0% |
| Blackfeet | 33 | 0.3% |
| British | 13 | 0.1% |
| Bulgarian | 22 | 0.2% |
| Central American | 198 | 1.5% |
| Cherokee | 162 | 1.2% |
| Chippewa | 77 | 0.6% |
| Cuban | 21 | 0.2% |
| Czech | 11 | 0.1% |
| Czechoslovakian | 6 | 0.1% |
| Dutch | 99 | 0.7% |
| English | 2,495 | 19.0% |
| European | 96 | 0.7% |
| French | 564 | 4.3% |
| French Canadian | 23 | 0.2% |
| German | 1,873 | 14.2% |
| Greek | 34 | 0.3% |
| Honduran | 153 | 1.2% |
| Indian (Asian) | 20 | 0.2% |
| Irish | 2,360 | 17.9% |
| Italian | 368 | 2.8% |
| Korean | 41 | 0.3% |
| Lithuanian | 79 | 0.6% |
| Mexican | 233 | 1.8% |
| Navajo | 13 | 0.1% |
| Norwegian | 110 | 0.8% |
| Panamanian | 13 | 0.1% |
| Polish | 456 | 3.5% |
| Potawatomi | 11 | 0.1% |
| Puerto Rican | 39 | 0.3% |
| Romanian | 9 | 0.1% |
| Salvadoran | 32 | 0.2% |
| Scandinavian | 19 | 0.1% |
| Scotch-Irish | 361 | 2.7% |
| Scottish | 191 | 1.5% |
| Sioux | 17 | 0.1% |
| Spaniard | 10 | 0.1% |
| Spanish | 6 | 0.1% |
| Swedish | 20 | 0.2% |
| Swiss | 89 | 0.7% |
| Syrian | 11 | 0.1% |
| Ukrainian | 13 | 0.1% |
| Welsh | 201 | 1.5% | View All 46 Rows |
Immigrants in Harrison
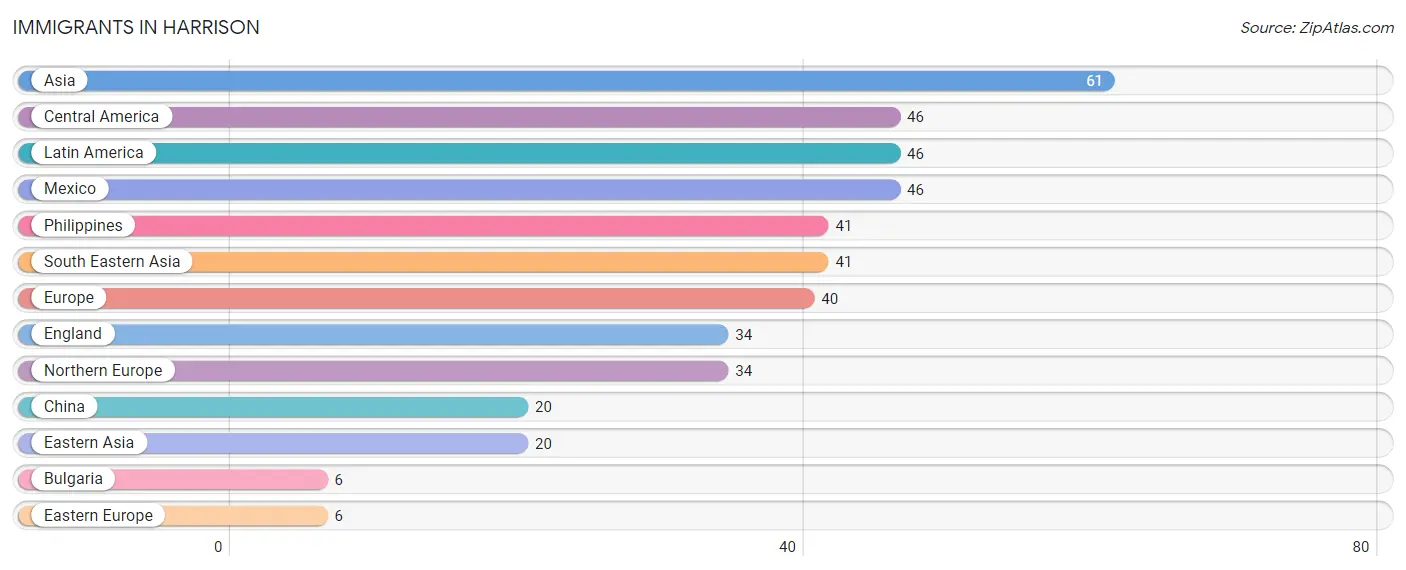
The most numerous immigrant groups reported in Harrison came from Asia (61 | 0.5%), Central America (46 | 0.4%), Latin America (46 | 0.4%), Mexico (46 | 0.4%), and Philippines (41 | 0.3%), together accounting for 1.8% of all Harrison residents.
| Immigration Origin | # Population | % Population |
| Asia | 61 | 0.5% |
| Bulgaria | 6 | 0.1% |
| Central America | 46 | 0.4% |
| China | 20 | 0.2% |
| Eastern Asia | 20 | 0.2% |
| Eastern Europe | 6 | 0.1% |
| England | 34 | 0.3% |
| Europe | 40 | 0.3% |
| Latin America | 46 | 0.4% |
| Mexico | 46 | 0.4% |
| Northern Europe | 34 | 0.3% |
| Philippines | 41 | 0.3% |
| South Eastern Asia | 41 | 0.3% | View All 13 Rows |
Sex and Age in Harrison
Sex and Age in Harrison
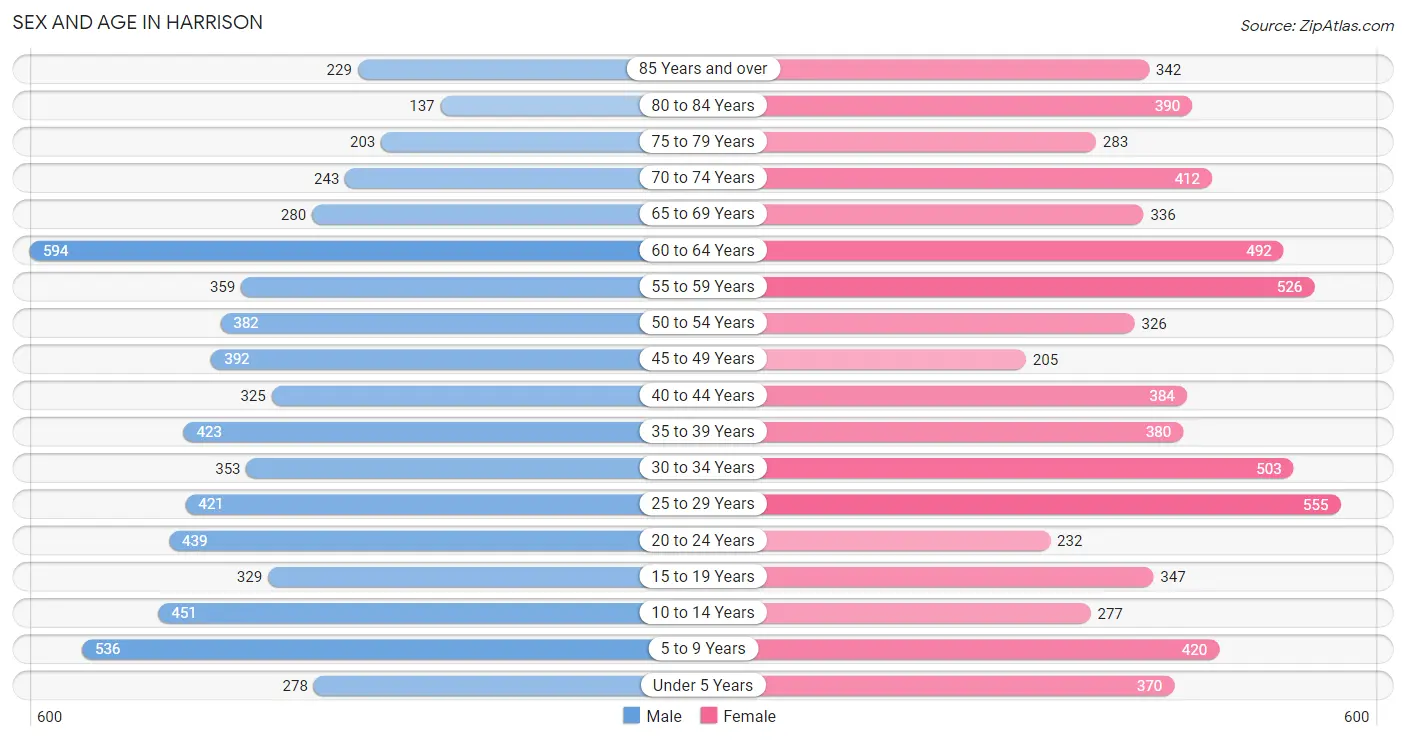
The most populous age groups in Harrison are 60 to 64 Years (594 | 9.3%) for men and 25 to 29 Years (555 | 8.2%) for women.
| Age Bracket | Male | Female |
| Under 5 Years | 278 (4.4%) | 370 (5.5%) |
| 5 to 9 Years | 536 (8.4%) | 420 (6.2%) |
| 10 to 14 Years | 451 (7.1%) | 277 (4.1%) |
| 15 to 19 Years | 329 (5.2%) | 347 (5.1%) |
| 20 to 24 Years | 439 (6.9%) | 232 (3.4%) |
| 25 to 29 Years | 421 (6.6%) | 555 (8.2%) |
| 30 to 34 Years | 353 (5.5%) | 503 (7.4%) |
| 35 to 39 Years | 423 (6.6%) | 380 (5.6%) |
| 40 to 44 Years | 325 (5.1%) | 384 (5.7%) |
| 45 to 49 Years | 392 (6.1%) | 205 (3.0%) |
| 50 to 54 Years | 382 (6.0%) | 326 (4.8%) |
| 55 to 59 Years | 359 (5.6%) | 526 (7.8%) |
| 60 to 64 Years | 594 (9.3%) | 492 (7.3%) |
| 65 to 69 Years | 280 (4.4%) | 336 (5.0%) |
| 70 to 74 Years | 243 (3.8%) | 412 (6.1%) |
| 75 to 79 Years | 203 (3.2%) | 283 (4.2%) |
| 80 to 84 Years | 137 (2.1%) | 390 (5.8%) |
| 85 Years and over | 229 (3.6%) | 342 (5.0%) |
| Total | 6,374 (100.0%) | 6,780 (100.0%) |
Families and Households in Harrison
Median Family Size in Harrison
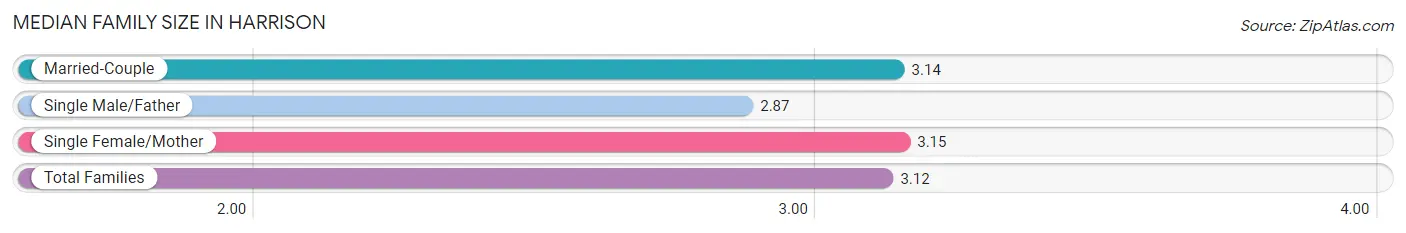
The median family size in Harrison is 3.12 persons per family, with single female/mother families (645 | 21.1%) accounting for the largest median family size of 3.15 persons per family. On the other hand, single male/father families (226 | 7.4%) represent the smallest median family size with 2.87 persons per family.
| Family Type | # Families | Family Size |
| Married-Couple | 2,183 (71.5%) | 3.14 |
| Single Male/Father | 226 (7.4%) | 2.87 |
| Single Female/Mother | 645 (21.1%) | 3.15 |
| Total Families | 3,054 (100.0%) | 3.12 |
Median Household Size in Harrison
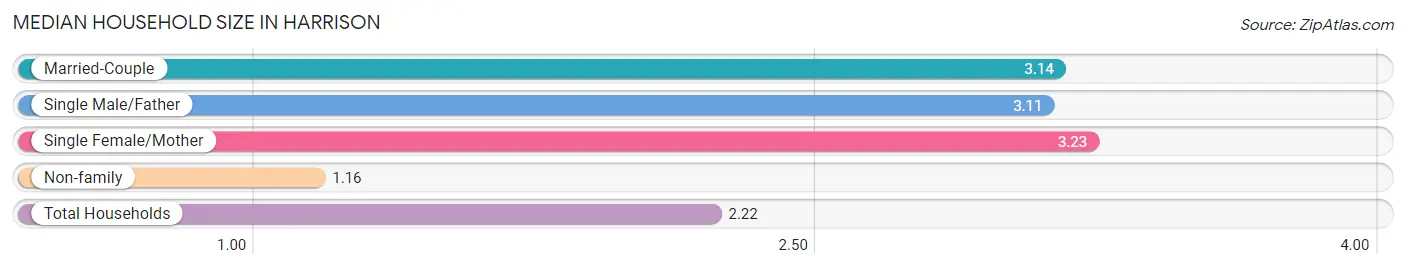
The median household size in Harrison is 2.22 persons per household, with single female/mother households (645 | 11.1%) accounting for the largest median household size of 3.23 persons per household. non-family households (2,739 | 47.3%) represent the smallest median household size with 1.16 persons per household.
| Household Type | # Households | Household Size |
| Married-Couple | 2,183 (37.7%) | 3.14 |
| Single Male/Father | 226 (3.9%) | 3.11 |
| Single Female/Mother | 645 (11.1%) | 3.23 |
| Non-family | 2,739 (47.3%) | 1.16 |
| Total Households | 5,793 (100.0%) | 2.22 |
Household Size by Marriage Status in Harrison
Out of a total of 5,793 households in Harrison, 3,054 (52.7%) are family households, while 2,739 (47.3%) are nonfamily households. The most numerous type of family households are 2-person households, comprising 1,449, and the most common type of nonfamily households are 1-person households, comprising 2,434.
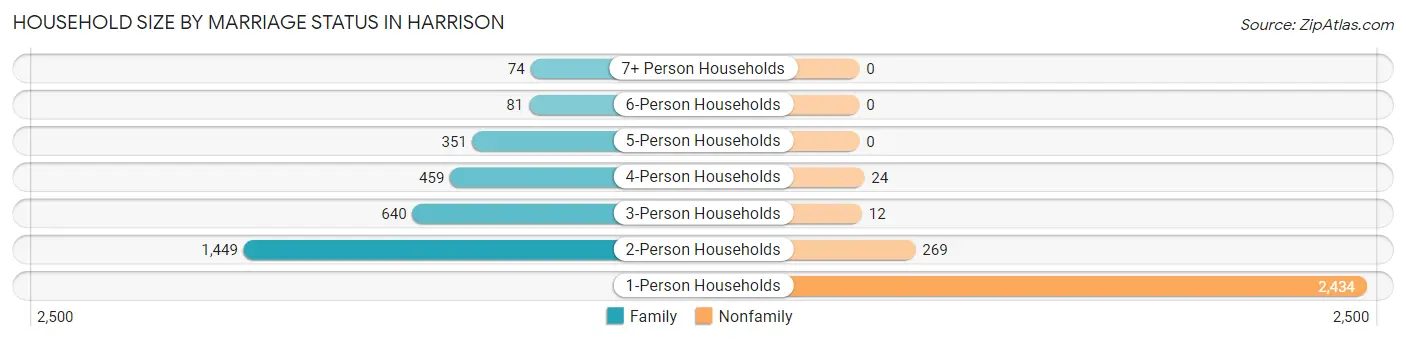
| Household Size | Family Households | Nonfamily Households |
| 1-Person Households | - | 2,434 (42.0%) |
| 2-Person Households | 1,449 (25.0%) | 269 (4.6%) |
| 3-Person Households | 640 (11.1%) | 12 (0.2%) |
| 4-Person Households | 459 (7.9%) | 24 (0.4%) |
| 5-Person Households | 351 (6.1%) | 0 (0.0%) |
| 6-Person Households | 81 (1.4%) | 0 (0.0%) |
| 7+ Person Households | 74 (1.3%) | 0 (0.0%) |
| Total | 3,054 (52.7%) | 2,739 (47.3%) |
Female Fertility in Harrison
Fertility by Age in Harrison
Average fertility rate in Harrison is 66.0 births per 1,000 women. Women in the age bracket of 20 to 34 years have the highest fertility rate with 133.0 births per 1,000 women. Women in the age bracket of 20 to 34 years acount for 98.3% of all women with births.
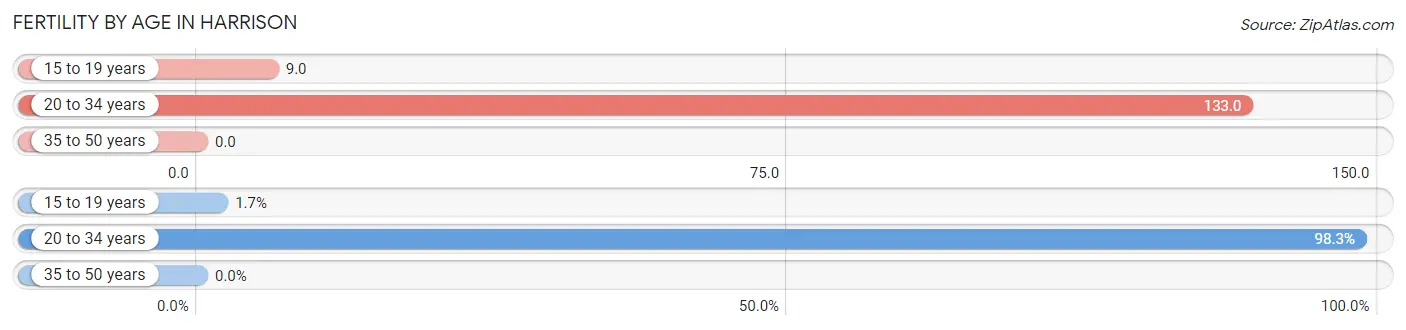
| Age Bracket | Women with Births | Births / 1,000 Women |
| 15 to 19 years | 3 (1.7%) | 9.0 |
| 20 to 34 years | 172 (98.3%) | 133.0 |
| 35 to 50 years | 0 (0.0%) | 0.0 |
| Total | 175 (100.0%) | 66.0 |
Fertility by Age by Marriage Status in Harrison
65.1% of women with births (175) in Harrison are married. The highest percentage of unmarried women with births falls into 15 to 19 years age bracket with 100.0% of them unmarried at the time of birth, while the lowest percentage of unmarried women with births belong to 20 to 34 years age bracket with 33.7% of them unmarried.
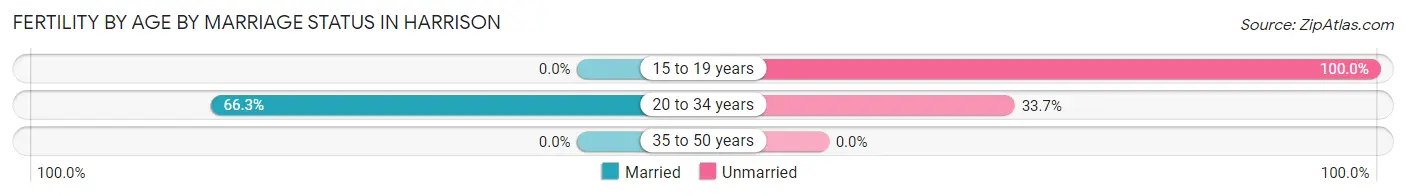
| Age Bracket | Married | Unmarried |
| 15 to 19 years | 0 (0.0%) | 3 (100.0%) |
| 20 to 34 years | 114 (66.3%) | 58 (33.7%) |
| 35 to 50 years | 0 (0.0%) | 0 (0.0%) |
| Total | 114 (65.1%) | 61 (34.9%) |
Fertility by Education in Harrison
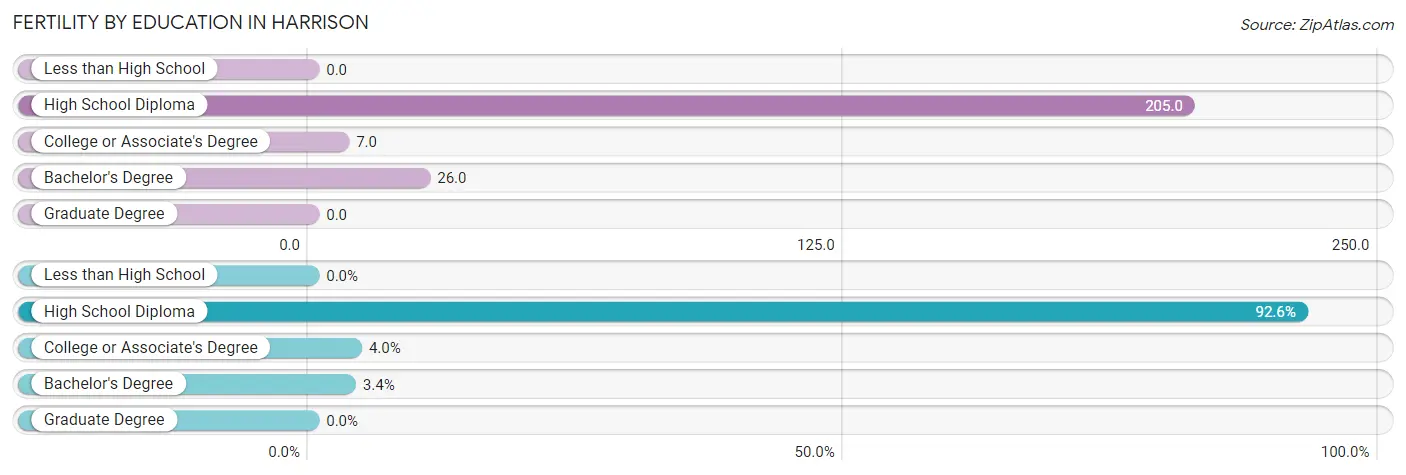
| Educational Attainment | Women with Births | Births / 1,000 Women |
| Less than High School | 0 (0.0%) | 0.0 |
| High School Diploma | 162 (92.6%) | 205.0 |
| College or Associate's Degree | 7 (4.0%) | 7.0 |
| Bachelor's Degree | 6 (3.4%) | 26.0 |
| Graduate Degree | 0 (0.0%) | 0.0 |
| Total | 175 (100.0%) | 66.0 |
Fertility by Education by Marriage Status in Harrison
34.9% of women with births in Harrison are unmarried. Women with the educational attainment of college or associate's degree are most likely to be married with 100.0% of them married at childbirth, while women with the educational attainment of high school diploma are least likely to be married with 37.7% of them unmarried at childbirth.
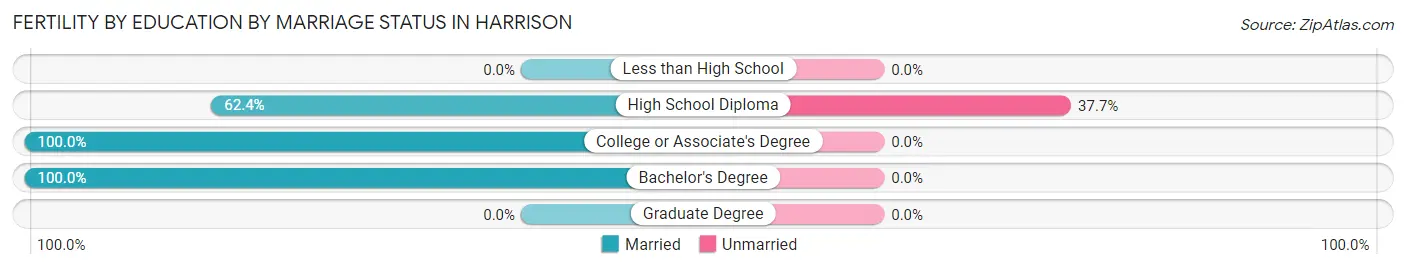
| Educational Attainment | Married | Unmarried |
| Less than High School | 0 (0.0%) | 0 (0.0%) |
| High School Diploma | 101 (62.4%) | 61 (37.7%) |
| College or Associate's Degree | 7 (100.0%) | 0 (0.0%) |
| Bachelor's Degree | 6 (100.0%) | 0 (0.0%) |
| Graduate Degree | 0 (0.0%) | 0 (0.0%) |
| Total | 114 (65.1%) | 61 (34.9%) |
Employment Characteristics in Harrison
Employment by Class of Employer in Harrison
Among the 5,313 employed individuals in Harrison, private company employees (3,676 | 69.2%), not-for-profit organizations (542 | 10.2%), and local government employees (374 | 7.0%) make up the most common classes of employment.
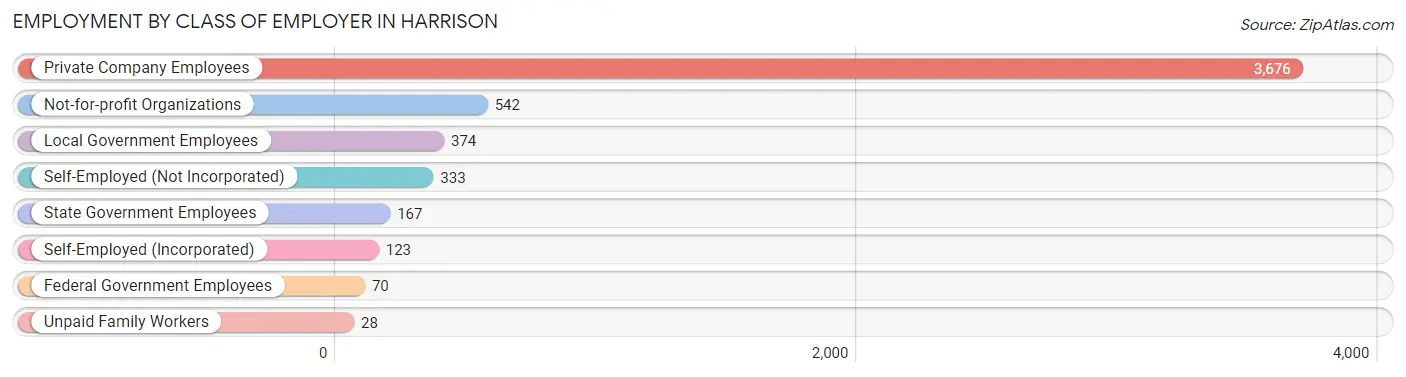
| Employer Class | # Employees | % Employees |
| Private Company Employees | 3,676 | 69.2% |
| Self-Employed (Incorporated) | 123 | 2.3% |
| Self-Employed (Not Incorporated) | 333 | 6.3% |
| Not-for-profit Organizations | 542 | 10.2% |
| Local Government Employees | 374 | 7.0% |
| State Government Employees | 167 | 3.1% |
| Federal Government Employees | 70 | 1.3% |
| Unpaid Family Workers | 28 | 0.5% |
| Total | 5,313 | 100.0% |
Employment Status by Age in Harrison
According to the labor force statistics for Harrison, out of the total population over 16 years of age (10,546), 54.9% or 5,790 individuals are in the labor force, with 6.4% or 371 of them unemployed. The age group with the highest labor force participation rate is 55 to 59 years, with 82.8% or 733 individuals in the labor force. Within the labor force, the 20 to 24 years age range has the highest percentage of unemployed individuals, with 23.5% or 119 of them being unemployed.
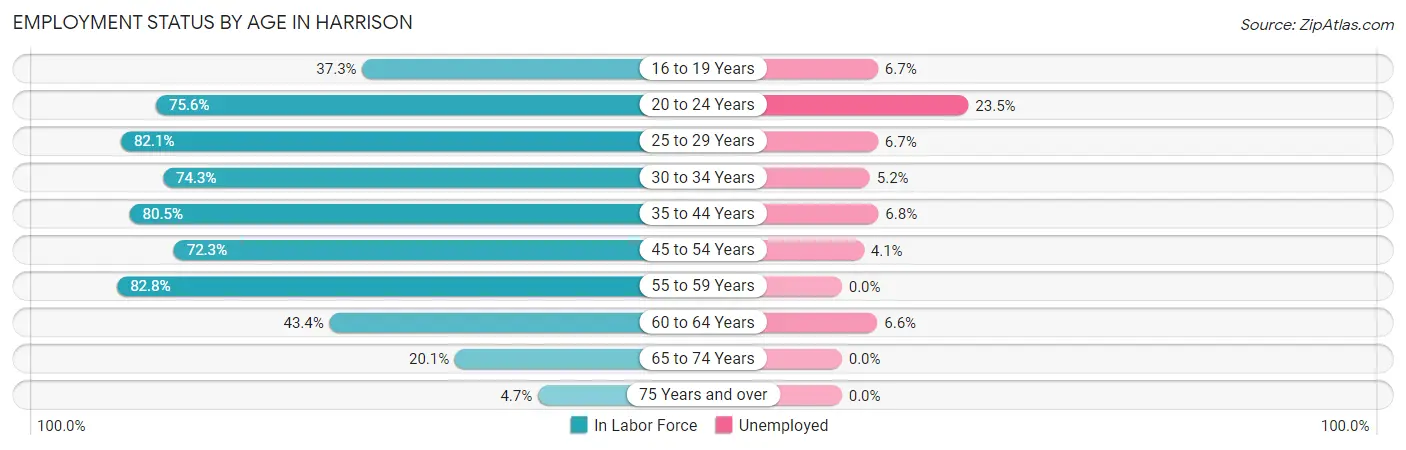
| Age Bracket | In Labor Force | Unemployed |
| 16 to 19 Years | 149 (37.3%) | 10 (6.7%) |
| 20 to 24 Years | 507 (75.6%) | 119 (23.5%) |
| 25 to 29 Years | 801 (82.1%) | 54 (6.7%) |
| 30 to 34 Years | 636 (74.3%) | 33 (5.2%) |
| 35 to 44 Years | 1,217 (80.5%) | 83 (6.8%) |
| 45 to 54 Years | 944 (72.3%) | 39 (4.1%) |
| 55 to 59 Years | 733 (82.8%) | 0 (0.0%) |
| 60 to 64 Years | 471 (43.4%) | 31 (6.6%) |
| 65 to 74 Years | 255 (20.1%) | 0 (0.0%) |
| 75 Years and over | 74 (4.7%) | 0 (0.0%) |
| Total | 5,790 (54.9%) | 371 (6.4%) |
Employment Status by Educational Attainment in Harrison
According to labor force statistics for Harrison, 72.5% of individuals (4,800) out of the total population between 25 and 64 years of age (6,620) are in the labor force, with 5.0% or 240 of them being unemployed. The group with the highest labor force participation rate are those with the educational attainment of college / associate degree, with 77.2% or 2,067 individuals in the labor force. Within the labor force, individuals with less than high school education have the highest percentage of unemployment, with 23.0% or 92 of them being unemployed.
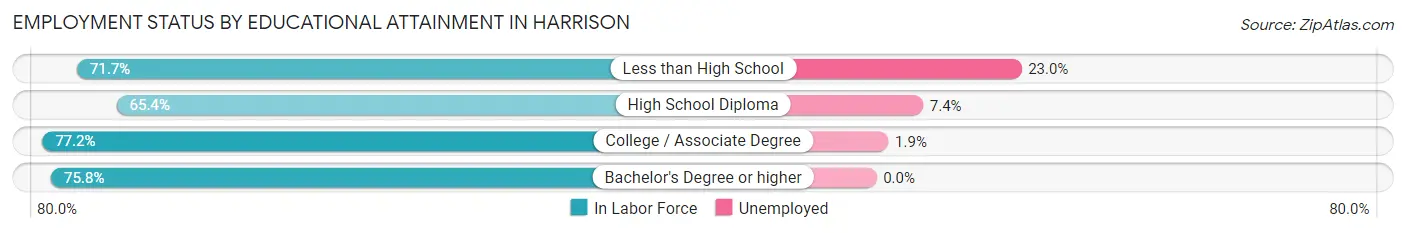
| Educational Attainment | In Labor Force | Unemployed |
| Less than High School | 400 (71.7%) | 128 (23.0%) |
| High School Diploma | 1,467 (65.4%) | 166 (7.4%) |
| College / Associate Degree | 2,067 (77.2%) | 51 (1.9%) |
| Bachelor's Degree or higher | 866 (75.8%) | 0 (0.0%) |
| Total | 4,800 (72.5%) | 331 (5.0%) |
Employment Occupations by Sex in Harrison
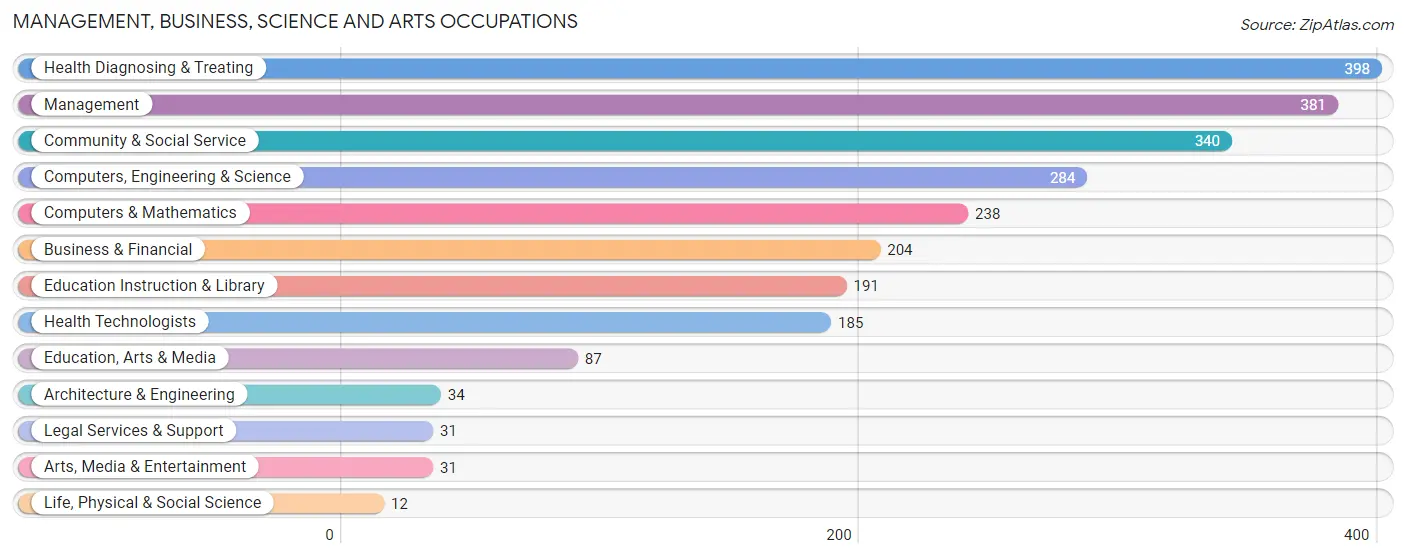
Management, Business, Science and Arts Occupations
The most common Management, Business, Science and Arts occupations in Harrison are Health Diagnosing & Treating (398 | 7.3%), Management (381 | 7.0%), Community & Social Service (340 | 6.3%), Computers, Engineering & Science (284 | 5.2%), and Computers & Mathematics (238 | 4.4%).
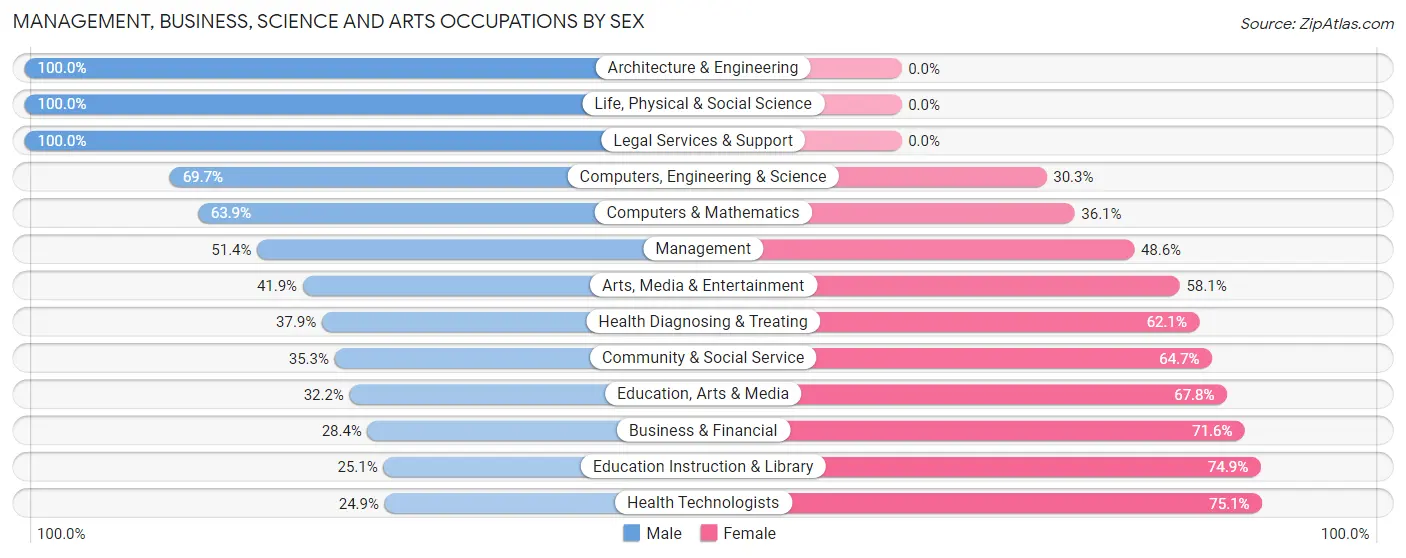
Management, Business, Science and Arts Occupations by Sex
Within the Management, Business, Science and Arts occupations in Harrison, the most male-oriented occupations are Architecture & Engineering (100.0%), Life, Physical & Social Science (100.0%), and Legal Services & Support (100.0%), while the most female-oriented occupations are Health Technologists (75.1%), Education Instruction & Library (74.9%), and Business & Financial (71.6%).
| Occupation | Male | Female |
| Management | 196 (51.4%) | 185 (48.6%) |
| Business & Financial | 58 (28.4%) | 146 (71.6%) |
| Computers, Engineering & Science | 198 (69.7%) | 86 (30.3%) |
| Computers & Mathematics | 152 (63.9%) | 86 (36.1%) |
| Architecture & Engineering | 34 (100.0%) | 0 (0.0%) |
| Life, Physical & Social Science | 12 (100.0%) | 0 (0.0%) |
| Community & Social Service | 120 (35.3%) | 220 (64.7%) |
| Education, Arts & Media | 28 (32.2%) | 59 (67.8%) |
| Legal Services & Support | 31 (100.0%) | 0 (0.0%) |
| Education Instruction & Library | 48 (25.1%) | 143 (74.9%) |
| Arts, Media & Entertainment | 13 (41.9%) | 18 (58.1%) |
| Health Diagnosing & Treating | 151 (37.9%) | 247 (62.1%) |
| Health Technologists | 46 (24.9%) | 139 (75.1%) |
| Total (Category) | 723 (45.0%) | 884 (55.0%) |
| Total (Overall) | 3,037 (56.1%) | 2,380 (43.9%) |
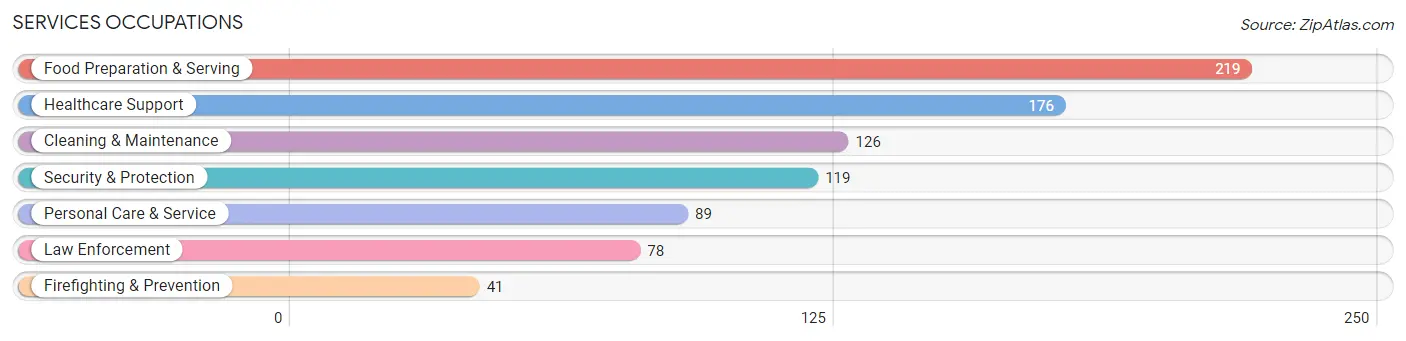
Services Occupations
The most common Services occupations in Harrison are Food Preparation & Serving (219 | 4.0%), Healthcare Support (176 | 3.3%), Cleaning & Maintenance (126 | 2.3%), Security & Protection (119 | 2.2%), and Personal Care & Service (89 | 1.6%).
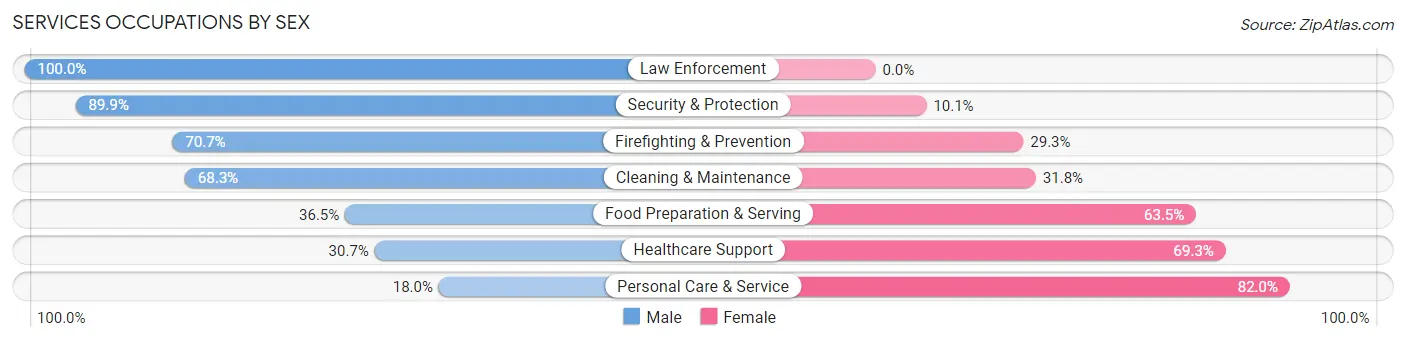
Services Occupations by Sex
Within the Services occupations in Harrison, the most male-oriented occupations are Law Enforcement (100.0%), Security & Protection (89.9%), and Firefighting & Prevention (70.7%), while the most female-oriented occupations are Personal Care & Service (82.0%), Healthcare Support (69.3%), and Food Preparation & Serving (63.5%).
| Occupation | Male | Female |
| Healthcare Support | 54 (30.7%) | 122 (69.3%) |
| Security & Protection | 107 (89.9%) | 12 (10.1%) |
| Firefighting & Prevention | 29 (70.7%) | 12 (29.3%) |
| Law Enforcement | 78 (100.0%) | 0 (0.0%) |
| Food Preparation & Serving | 80 (36.5%) | 139 (63.5%) |
| Cleaning & Maintenance | 86 (68.2%) | 40 (31.8%) |
| Personal Care & Service | 16 (18.0%) | 73 (82.0%) |
| Total (Category) | 343 (47.0%) | 386 (52.9%) |
| Total (Overall) | 3,037 (56.1%) | 2,380 (43.9%) |
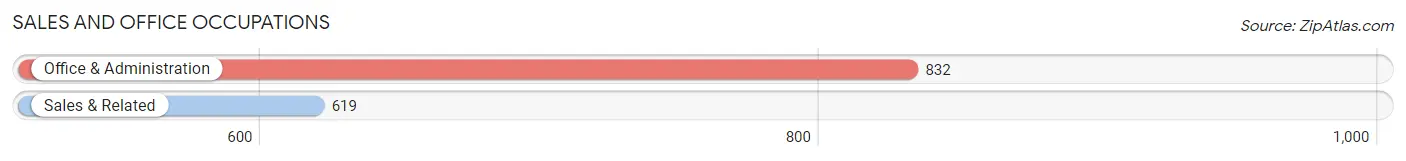
Sales and Office Occupations
The most common Sales and Office occupations in Harrison are Office & Administration (832 | 15.4%), and Sales & Related (619 | 11.4%).
Sales and Office Occupations by Sex
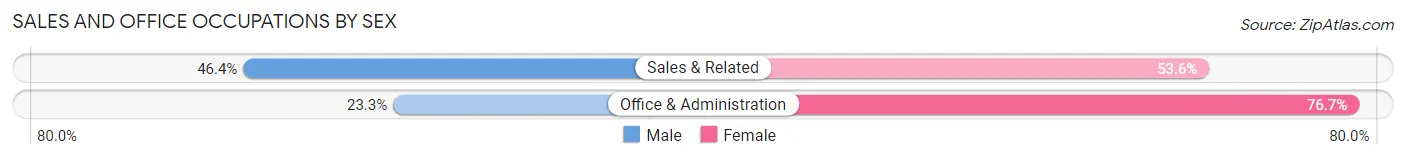
| Occupation | Male | Female |
| Sales & Related | 287 (46.4%) | 332 (53.6%) |
| Office & Administration | 194 (23.3%) | 638 (76.7%) |
| Total (Category) | 481 (33.2%) | 970 (66.8%) |
| Total (Overall) | 3,037 (56.1%) | 2,380 (43.9%) |
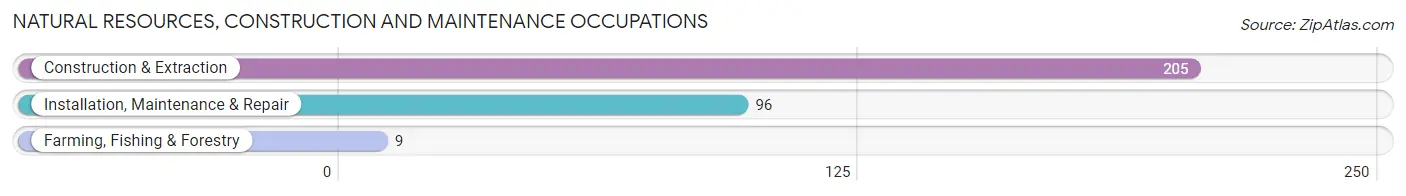
Natural Resources, Construction and Maintenance Occupations
The most common Natural Resources, Construction and Maintenance occupations in Harrison are Construction & Extraction (205 | 3.8%), Installation, Maintenance & Repair (96 | 1.8%), and Farming, Fishing & Forestry (9 | 0.2%).
Natural Resources, Construction and Maintenance Occupations by Sex
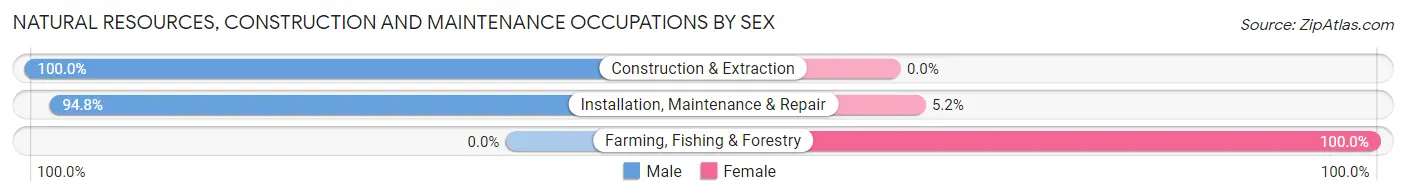
| Occupation | Male | Female |
| Farming, Fishing & Forestry | 0 (0.0%) | 9 (100.0%) |
| Construction & Extraction | 205 (100.0%) | 0 (0.0%) |
| Installation, Maintenance & Repair | 91 (94.8%) | 5 (5.2%) |
| Total (Category) | 296 (95.5%) | 14 (4.5%) |
| Total (Overall) | 3,037 (56.1%) | 2,380 (43.9%) |
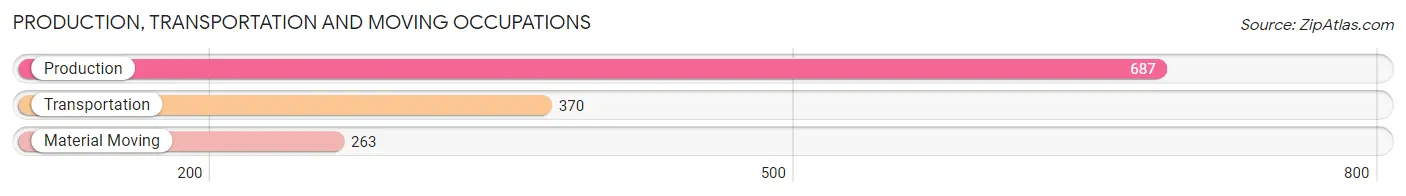
Production, Transportation and Moving Occupations
The most common Production, Transportation and Moving occupations in Harrison are Production (687 | 12.7%), Transportation (370 | 6.8%), and Material Moving (263 | 4.9%).
Production, Transportation and Moving Occupations by Sex

| Occupation | Male | Female |
| Production | 594 (86.5%) | 93 (13.5%) |
| Transportation | 358 (96.8%) | 12 (3.2%) |
| Material Moving | 242 (92.0%) | 21 (8.0%) |
| Total (Category) | 1,194 (90.4%) | 126 (9.6%) |
| Total (Overall) | 3,037 (56.1%) | 2,380 (43.9%) |
Employment Industries by Sex in Harrison
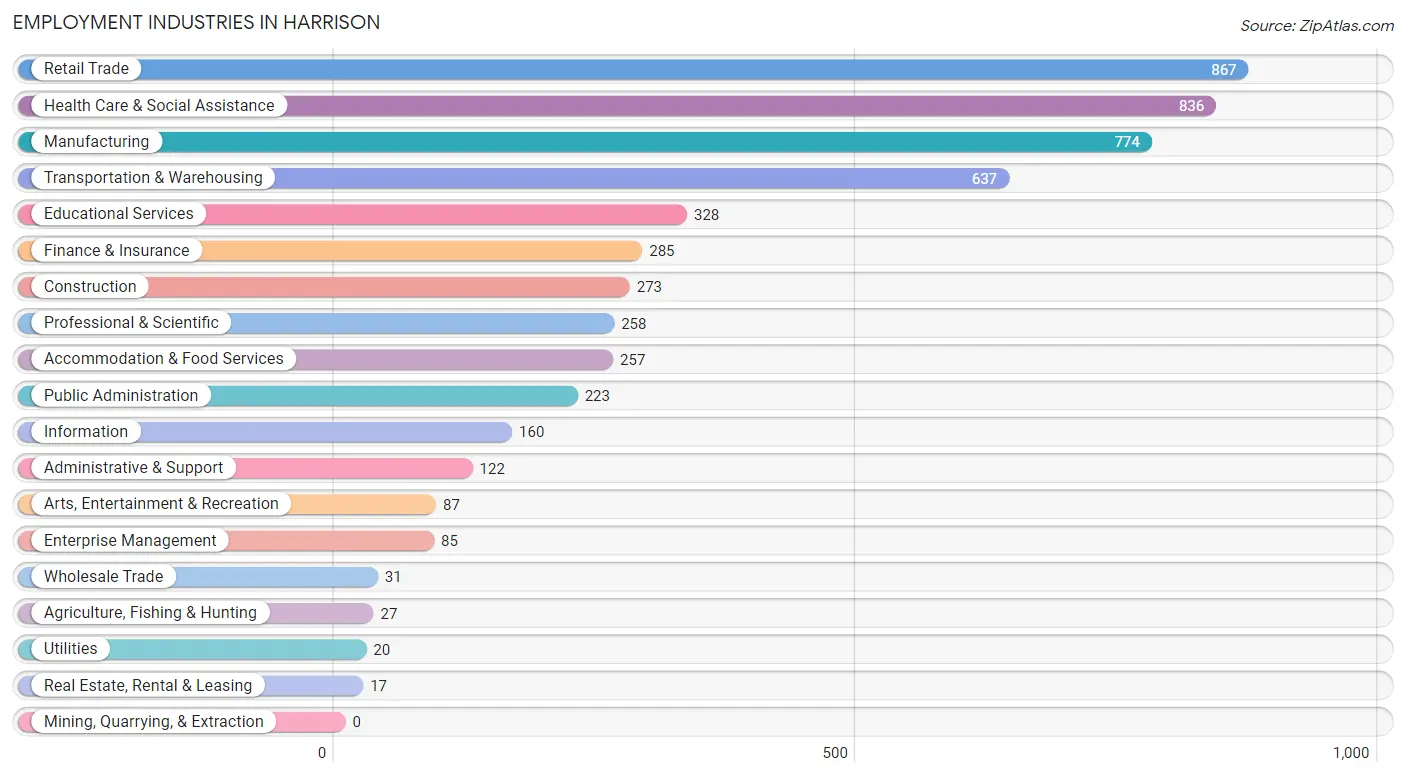
Employment Industries in Harrison
The major employment industries in Harrison include Retail Trade (867 | 16.0%), Health Care & Social Assistance (836 | 15.4%), Manufacturing (774 | 14.3%), Transportation & Warehousing (637 | 11.8%), and Educational Services (328 | 6.1%).
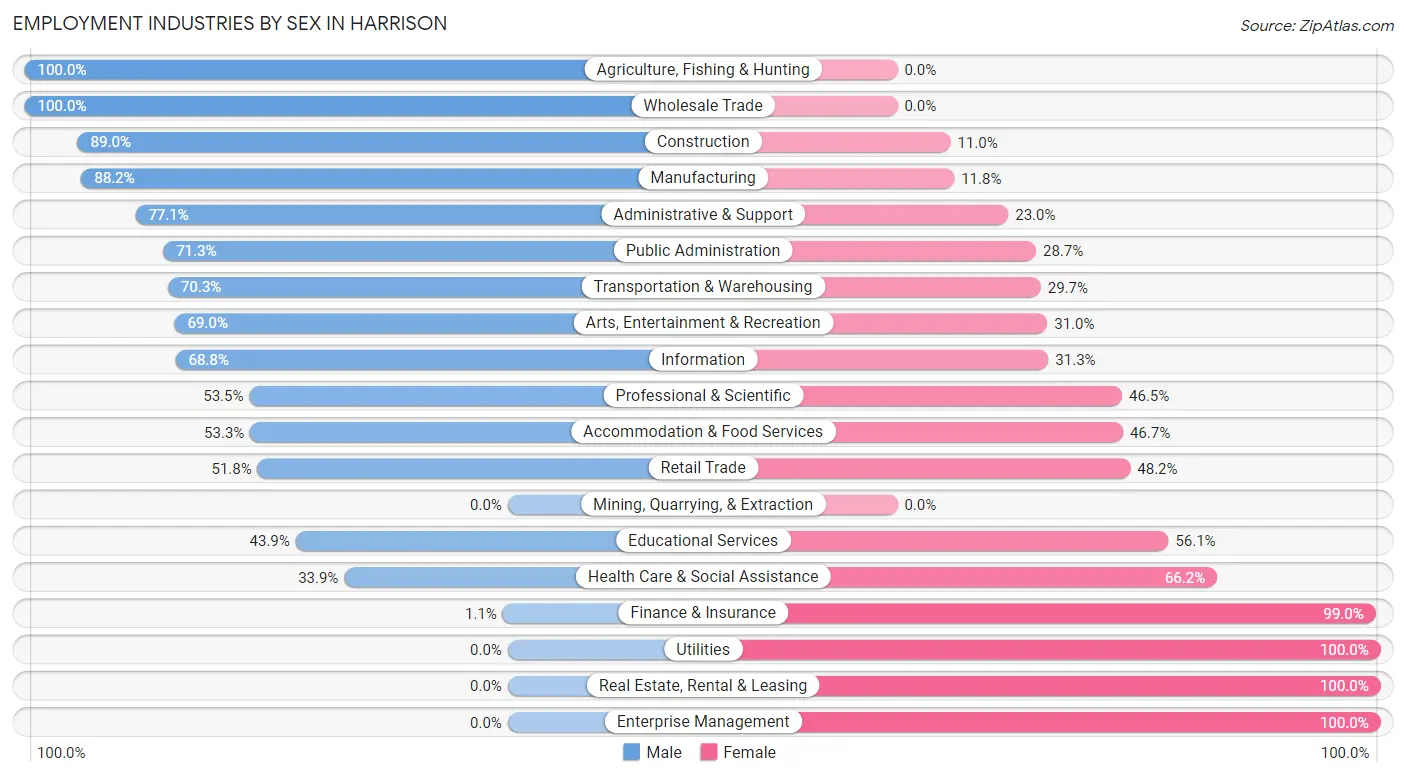
Employment Industries by Sex in Harrison
The Harrison industries that see more men than women are Agriculture, Fishing & Hunting (100.0%), Wholesale Trade (100.0%), and Construction (89.0%), whereas the industries that tend to have a higher number of women are Utilities (100.0%), Real Estate, Rental & Leasing (100.0%), and Enterprise Management (100.0%).
| Industry | Male | Female |
| Agriculture, Fishing & Hunting | 27 (100.0%) | 0 (0.0%) |
| Mining, Quarrying, & Extraction | 0 (0.0%) | 0 (0.0%) |
| Construction | 243 (89.0%) | 30 (11.0%) |
| Manufacturing | 683 (88.2%) | 91 (11.8%) |
| Wholesale Trade | 31 (100.0%) | 0 (0.0%) |
| Retail Trade | 449 (51.8%) | 418 (48.2%) |
| Transportation & Warehousing | 448 (70.3%) | 189 (29.7%) |
| Utilities | 0 (0.0%) | 20 (100.0%) |
| Information | 110 (68.8%) | 50 (31.2%) |
| Finance & Insurance | 3 (1.1%) | 282 (99.0%) |
| Real Estate, Rental & Leasing | 0 (0.0%) | 17 (100.0%) |
| Professional & Scientific | 138 (53.5%) | 120 (46.5%) |
| Enterprise Management | 0 (0.0%) | 85 (100.0%) |
| Administrative & Support | 94 (77.0%) | 28 (23.0%) |
| Educational Services | 144 (43.9%) | 184 (56.1%) |
| Health Care & Social Assistance | 283 (33.9%) | 553 (66.1%) |
| Arts, Entertainment & Recreation | 60 (69.0%) | 27 (31.0%) |
| Accommodation & Food Services | 137 (53.3%) | 120 (46.7%) |
| Public Administration | 159 (71.3%) | 64 (28.7%) |
| Total | 3,037 (56.1%) | 2,380 (43.9%) |
Education in Harrison
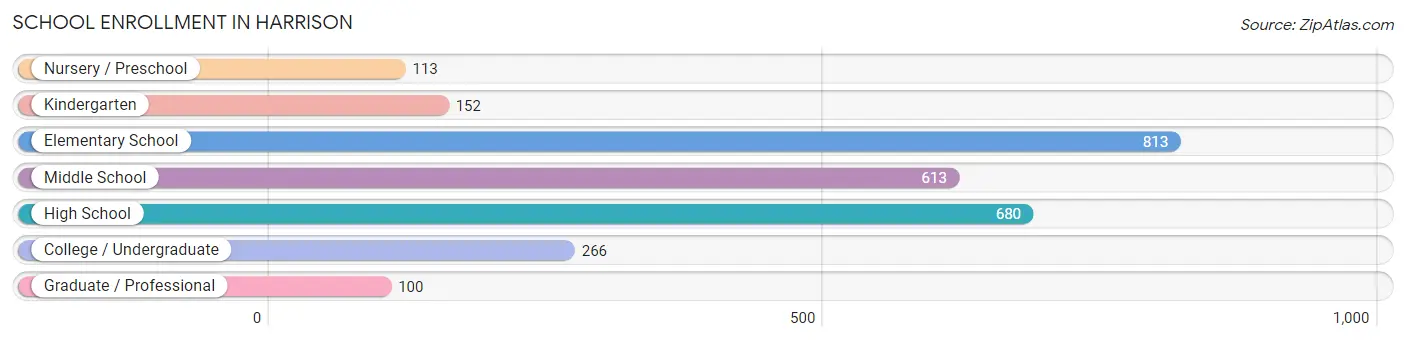
School Enrollment in Harrison
The most common levels of schooling among the 2,737 students in Harrison are elementary school (813 | 29.7%), high school (680 | 24.8%), and middle school (613 | 22.4%).
| School Level | # Students | % Students |
| Nursery / Preschool | 113 | 4.1% |
| Kindergarten | 152 | 5.6% |
| Elementary School | 813 | 29.7% |
| Middle School | 613 | 22.4% |
| High School | 680 | 24.8% |
| College / Undergraduate | 266 | 9.7% |
| Graduate / Professional | 100 | 3.6% |
| Total | 2,737 | 100.0% |
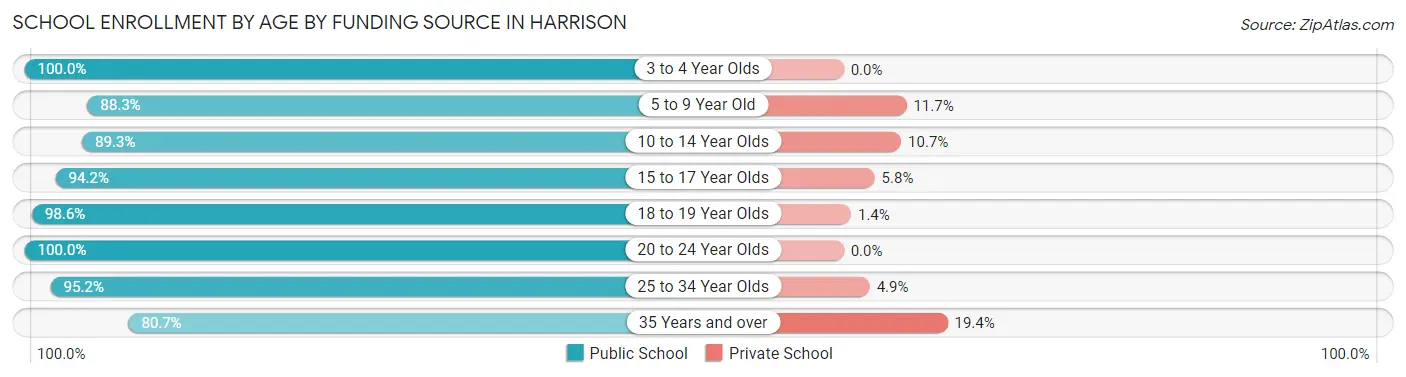
School Enrollment by Age by Funding Source in Harrison
Out of a total of 2,737 students who are enrolled in schools in Harrison, 255 (9.3%) attend a private institution, while the remaining 2,482 (90.7%) are enrolled in public schools. The age group of 35 years and over has the highest likelihood of being enrolled in private schools, with 24 (19.4% in the age bracket) enrolled. Conversely, the age group of 3 to 4 year olds has the lowest likelihood of being enrolled in a private school, with 69 (100.0% in the age bracket) attending a public institution.
| Age Bracket | Public School | Private School |
| 3 to 4 Year Olds | 69 (100.0%) | 0 (0.0%) |
| 5 to 9 Year Old | 823 (88.3%) | 109 (11.7%) |
| 10 to 14 Year Olds | 650 (89.3%) | 78 (10.7%) |
| 15 to 17 Year Olds | 506 (94.2%) | 31 (5.8%) |
| 18 to 19 Year Olds | 72 (98.6%) | 1 (1.4%) |
| 20 to 24 Year Olds | 47 (100.0%) | 0 (0.0%) |
| 25 to 34 Year Olds | 216 (95.2%) | 11 (4.9%) |
| 35 Years and over | 100 (80.6%) | 24 (19.4%) |
| Total | 2,482 (90.7%) | 255 (9.3%) |
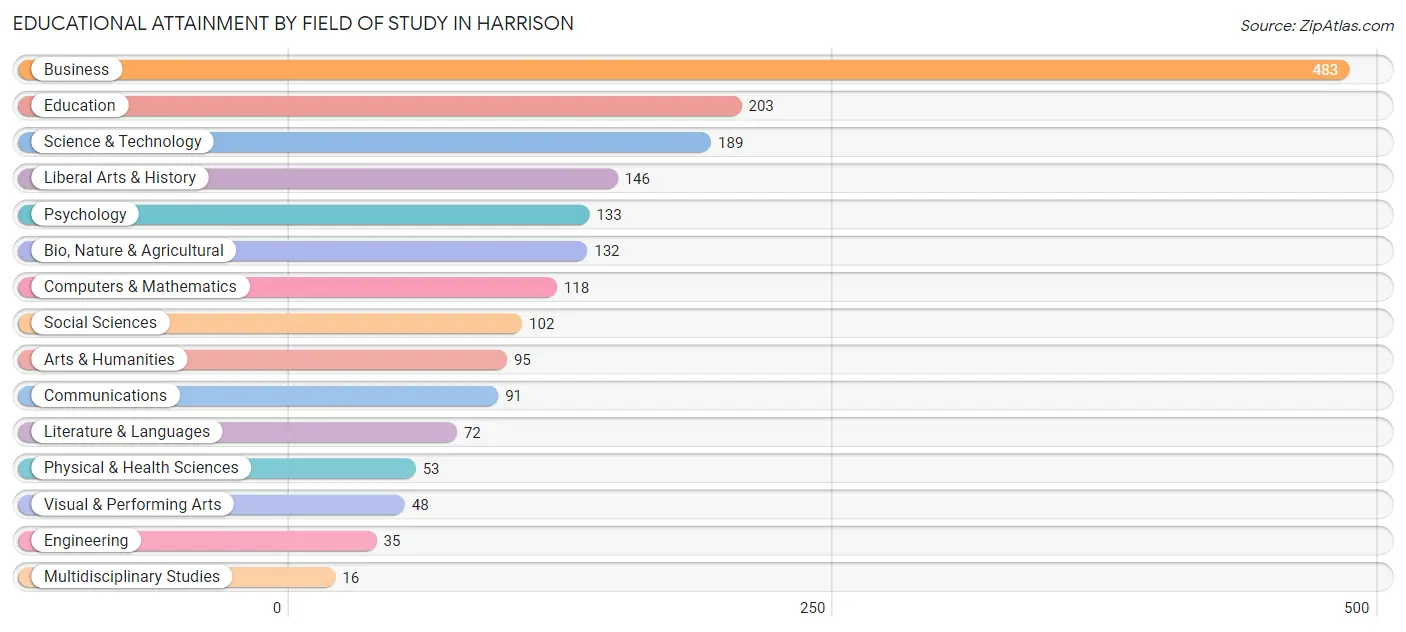
Educational Attainment by Field of Study in Harrison
Business (483 | 25.2%), education (203 | 10.6%), science & technology (189 | 9.9%), liberal arts & history (146 | 7.6%), and psychology (133 | 6.9%) are the most common fields of study among 1,916 individuals in Harrison who have obtained a bachelor's degree or higher.
| Field of Study | # Graduates | % Graduates |
| Computers & Mathematics | 118 | 6.2% |
| Bio, Nature & Agricultural | 132 | 6.9% |
| Physical & Health Sciences | 53 | 2.8% |
| Psychology | 133 | 6.9% |
| Social Sciences | 102 | 5.3% |
| Engineering | 35 | 1.8% |
| Multidisciplinary Studies | 16 | 0.8% |
| Science & Technology | 189 | 9.9% |
| Business | 483 | 25.2% |
| Education | 203 | 10.6% |
| Literature & Languages | 72 | 3.8% |
| Liberal Arts & History | 146 | 7.6% |
| Visual & Performing Arts | 48 | 2.5% |
| Communications | 91 | 4.8% |
| Arts & Humanities | 95 | 5.0% |
| Total | 1,916 | 100.0% |
Transportation & Commute in Harrison
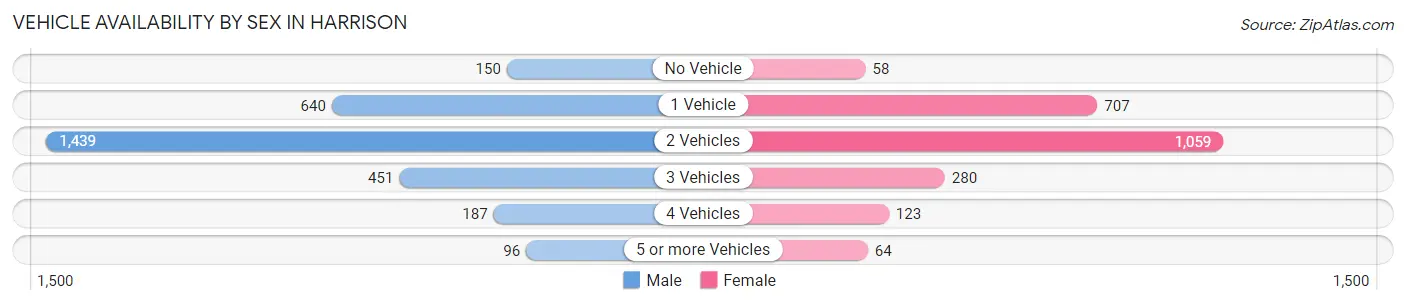
Vehicle Availability by Sex in Harrison
The most prevalent vehicle ownership categories in Harrison are males with 2 vehicles (1,439, accounting for 48.6%) and females with 2 vehicles (1,059, making up 62.8%).
| Vehicles Available | Male | Female |
| No Vehicle | 150 (5.1%) | 58 (2.5%) |
| 1 Vehicle | 640 (21.6%) | 707 (30.9%) |
| 2 Vehicles | 1,439 (48.6%) | 1,059 (46.2%) |
| 3 Vehicles | 451 (15.2%) | 280 (12.2%) |
| 4 Vehicles | 187 (6.3%) | 123 (5.4%) |
| 5 or more Vehicles | 96 (3.2%) | 64 (2.8%) |
| Total | 2,963 (100.0%) | 2,291 (100.0%) |
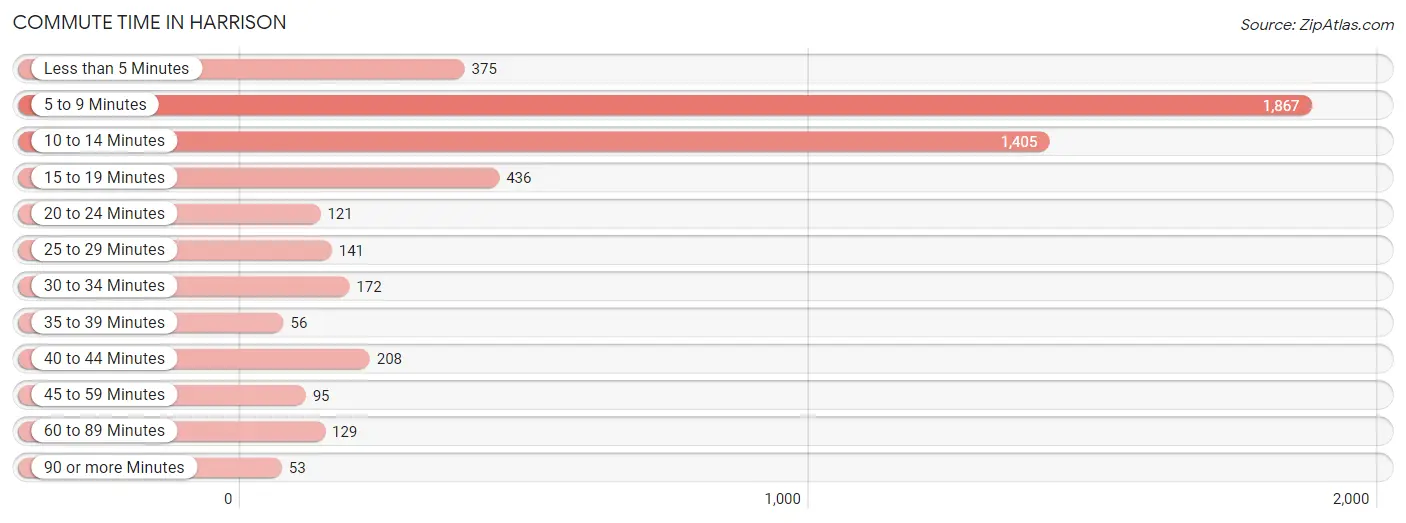
Commute Time in Harrison
The most frequently occuring commute durations in Harrison are 5 to 9 minutes (1,867 commuters, 36.9%), 10 to 14 minutes (1,405 commuters, 27.8%), and 15 to 19 minutes (436 commuters, 8.6%).
| Commute Time | # Commuters | % Commuters |
| Less than 5 Minutes | 375 | 7.4% |
| 5 to 9 Minutes | 1,867 | 36.9% |
| 10 to 14 Minutes | 1,405 | 27.8% |
| 15 to 19 Minutes | 436 | 8.6% |
| 20 to 24 Minutes | 121 | 2.4% |
| 25 to 29 Minutes | 141 | 2.8% |
| 30 to 34 Minutes | 172 | 3.4% |
| 35 to 39 Minutes | 56 | 1.1% |
| 40 to 44 Minutes | 208 | 4.1% |
| 45 to 59 Minutes | 95 | 1.9% |
| 60 to 89 Minutes | 129 | 2.5% |
| 90 or more Minutes | 53 | 1.1% |
Commute Time by Sex in Harrison
The most common commute times in Harrison are 5 to 9 minutes (1,192 commuters, 42.2%) for males and 10 to 14 minutes (948 commuters, 42.4%) for females.
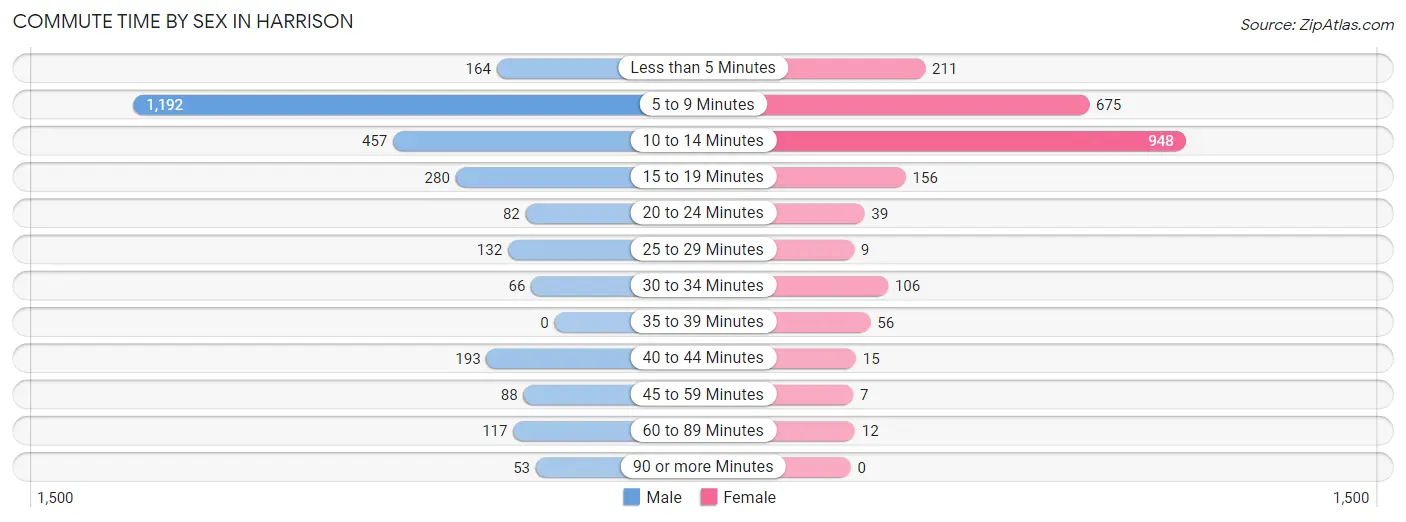
| Commute Time | Male | Female |
| Less than 5 Minutes | 164 (5.8%) | 211 (9.4%) |
| 5 to 9 Minutes | 1,192 (42.2%) | 675 (30.2%) |
| 10 to 14 Minutes | 457 (16.2%) | 948 (42.4%) |
| 15 to 19 Minutes | 280 (9.9%) | 156 (7.0%) |
| 20 to 24 Minutes | 82 (2.9%) | 39 (1.8%) |
| 25 to 29 Minutes | 132 (4.7%) | 9 (0.4%) |
| 30 to 34 Minutes | 66 (2.3%) | 106 (4.7%) |
| 35 to 39 Minutes | 0 (0.0%) | 56 (2.5%) |
| 40 to 44 Minutes | 193 (6.8%) | 15 (0.7%) |
| 45 to 59 Minutes | 88 (3.1%) | 7 (0.3%) |
| 60 to 89 Minutes | 117 (4.1%) | 12 (0.5%) |
| 90 or more Minutes | 53 (1.9%) | 0 (0.0%) |
Time of Departure to Work by Sex in Harrison
The most frequent times of departure to work in Harrison are 6:00 AM to 6:29 AM (400, 14.2%) for males and 7:30 AM to 7:59 AM (653, 29.2%) for females.
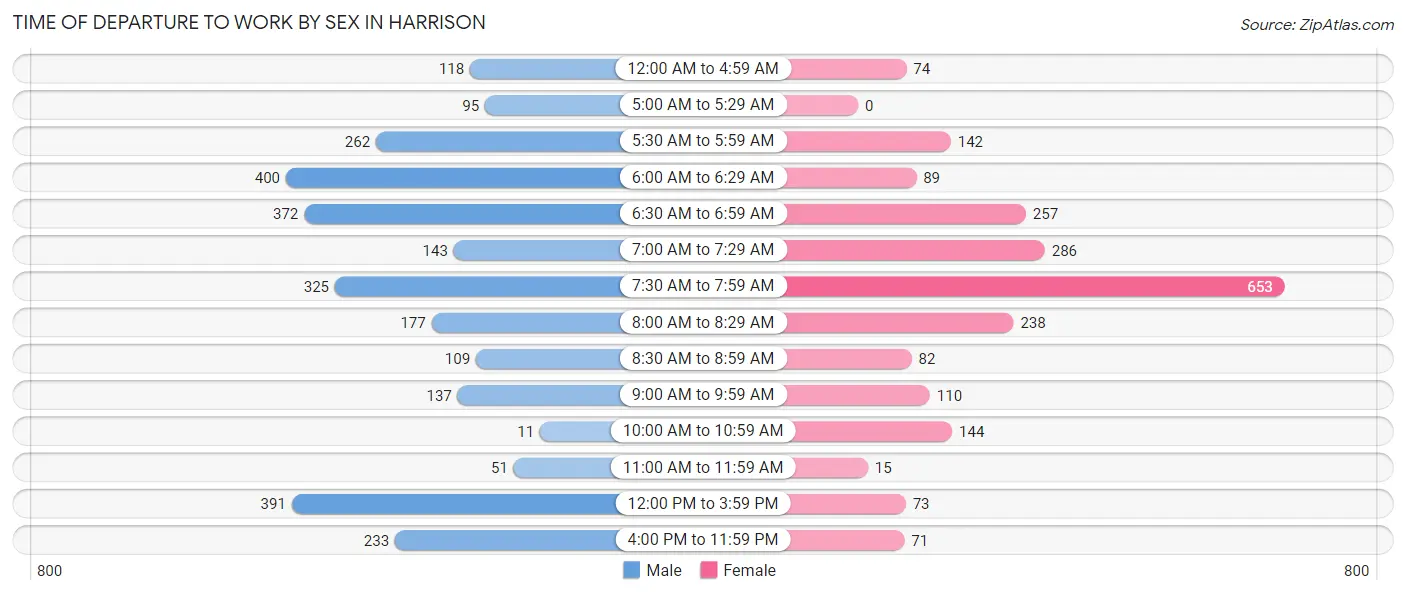
| Time of Departure | Male | Female |
| 12:00 AM to 4:59 AM | 118 (4.2%) | 74 (3.3%) |
| 5:00 AM to 5:29 AM | 95 (3.4%) | 0 (0.0%) |
| 5:30 AM to 5:59 AM | 262 (9.3%) | 142 (6.4%) |
| 6:00 AM to 6:29 AM | 400 (14.2%) | 89 (4.0%) |
| 6:30 AM to 6:59 AM | 372 (13.2%) | 257 (11.5%) |
| 7:00 AM to 7:29 AM | 143 (5.1%) | 286 (12.8%) |
| 7:30 AM to 7:59 AM | 325 (11.5%) | 653 (29.2%) |
| 8:00 AM to 8:29 AM | 177 (6.3%) | 238 (10.6%) |
| 8:30 AM to 8:59 AM | 109 (3.9%) | 82 (3.7%) |
| 9:00 AM to 9:59 AM | 137 (4.9%) | 110 (4.9%) |
| 10:00 AM to 10:59 AM | 11 (0.4%) | 144 (6.5%) |
| 11:00 AM to 11:59 AM | 51 (1.8%) | 15 (0.7%) |
| 12:00 PM to 3:59 PM | 391 (13.9%) | 73 (3.3%) |
| 4:00 PM to 11:59 PM | 233 (8.3%) | 71 (3.2%) |
| Total | 2,824 (100.0%) | 2,234 (100.0%) |
Housing Occupancy in Harrison
Occupancy by Ownership in Harrison
Of the total 5,793 dwellings in Harrison, owner-occupied units account for 3,152 (54.4%), while renter-occupied units make up 2,641 (45.6%).
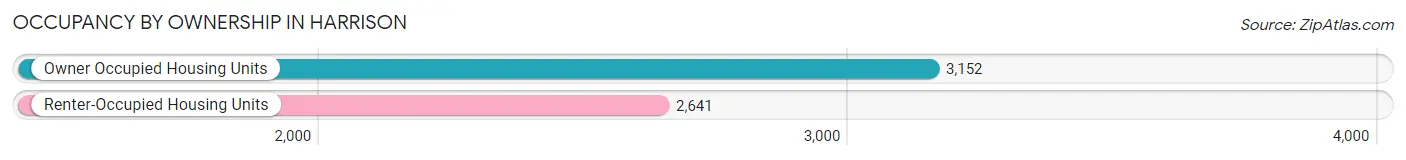
| Occupancy | # Housing Units | % Housing Units |
| Owner Occupied Housing Units | 3,152 | 54.4% |
| Renter-Occupied Housing Units | 2,641 | 45.6% |
| Total Occupied Housing Units | 5,793 | 100.0% |
Occupancy by Household Size in Harrison
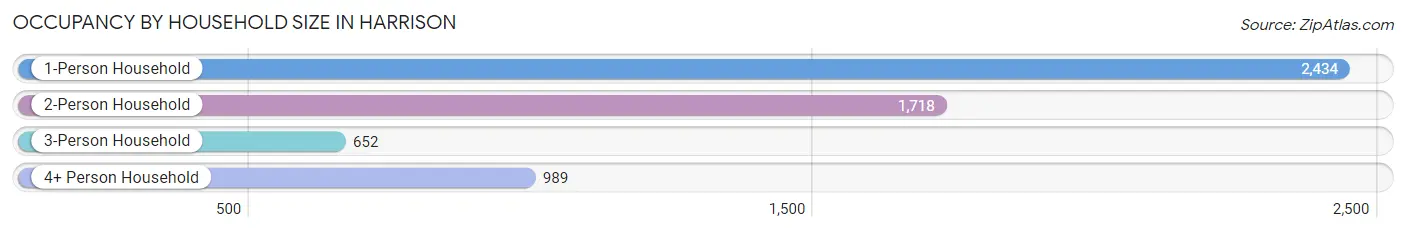
| Household Size | # Housing Units | % Housing Units |
| 1-Person Household | 2,434 | 42.0% |
| 2-Person Household | 1,718 | 29.7% |
| 3-Person Household | 652 | 11.3% |
| 4+ Person Household | 989 | 17.1% |
| Total Housing Units | 5,793 | 100.0% |
Occupancy by Ownership by Household Size in Harrison
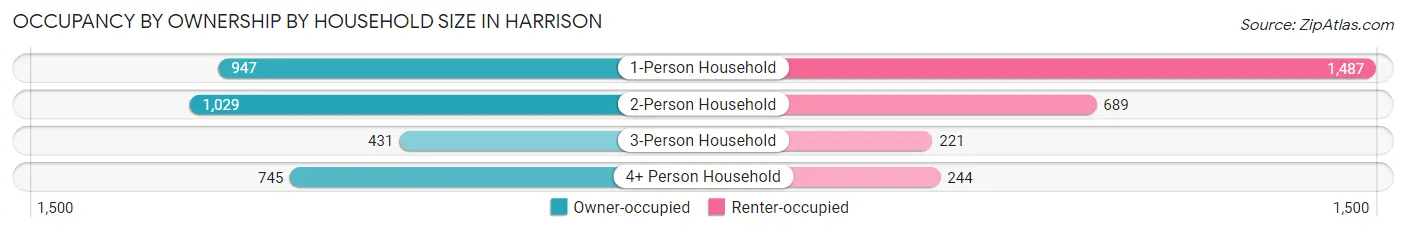
| Household Size | Owner-occupied | Renter-occupied |
| 1-Person Household | 947 (38.9%) | 1,487 (61.1%) |
| 2-Person Household | 1,029 (59.9%) | 689 (40.1%) |
| 3-Person Household | 431 (66.1%) | 221 (33.9%) |
| 4+ Person Household | 745 (75.3%) | 244 (24.7%) |
| Total Housing Units | 3,152 (54.4%) | 2,641 (45.6%) |
Occupancy by Educational Attainment in Harrison
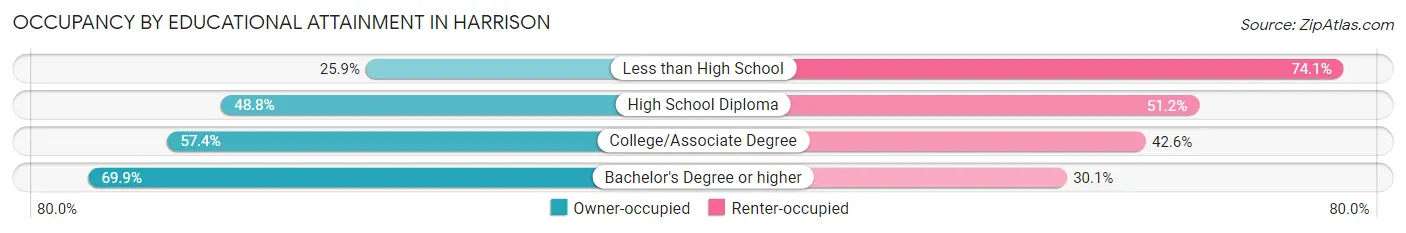
| Household Size | Owner-occupied | Renter-occupied |
| Less than High School | 125 (25.9%) | 358 (74.1%) |
| High School Diploma | 852 (48.8%) | 894 (51.2%) |
| College/Associate Degree | 1,445 (57.4%) | 1,074 (42.6%) |
| Bachelor's Degree or higher | 730 (69.9%) | 315 (30.1%) |
Occupancy by Age of Householder in Harrison
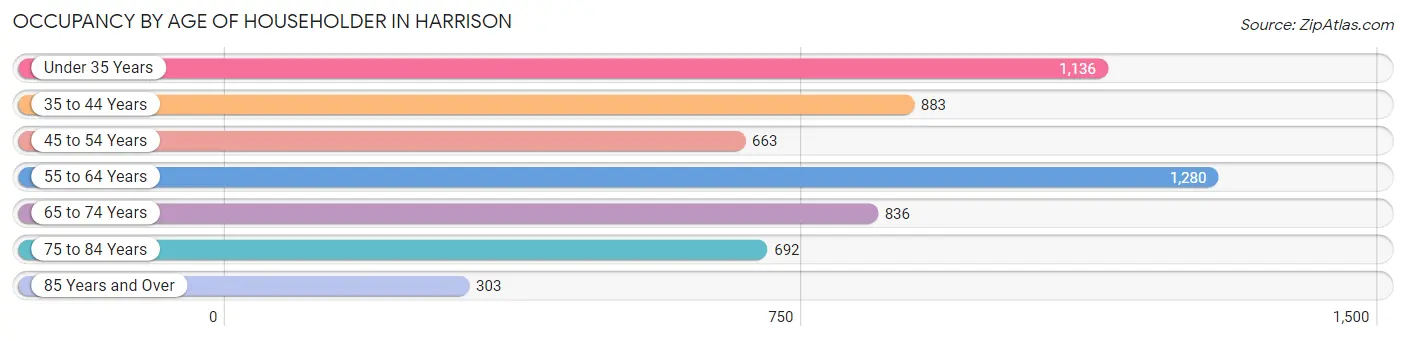
| Age Bracket | # Households | % Households |
| Under 35 Years | 1,136 | 19.6% |
| 35 to 44 Years | 883 | 15.2% |
| 45 to 54 Years | 663 | 11.4% |
| 55 to 64 Years | 1,280 | 22.1% |
| 65 to 74 Years | 836 | 14.4% |
| 75 to 84 Years | 692 | 11.9% |
| 85 Years and Over | 303 | 5.2% |
| Total | 5,793 | 100.0% |
Housing Finances in Harrison
Median Income by Occupancy in Harrison
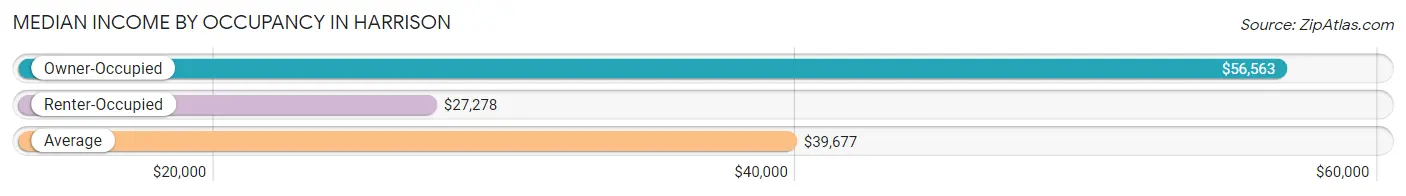
| Occupancy Type | # Households | Median Income |
| Owner-Occupied | 3,152 (54.4%) | $56,563 |
| Renter-Occupied | 2,641 (45.6%) | $27,278 |
| Average | 5,793 (100.0%) | $39,677 |
Occupancy by Householder Income Bracket in Harrison
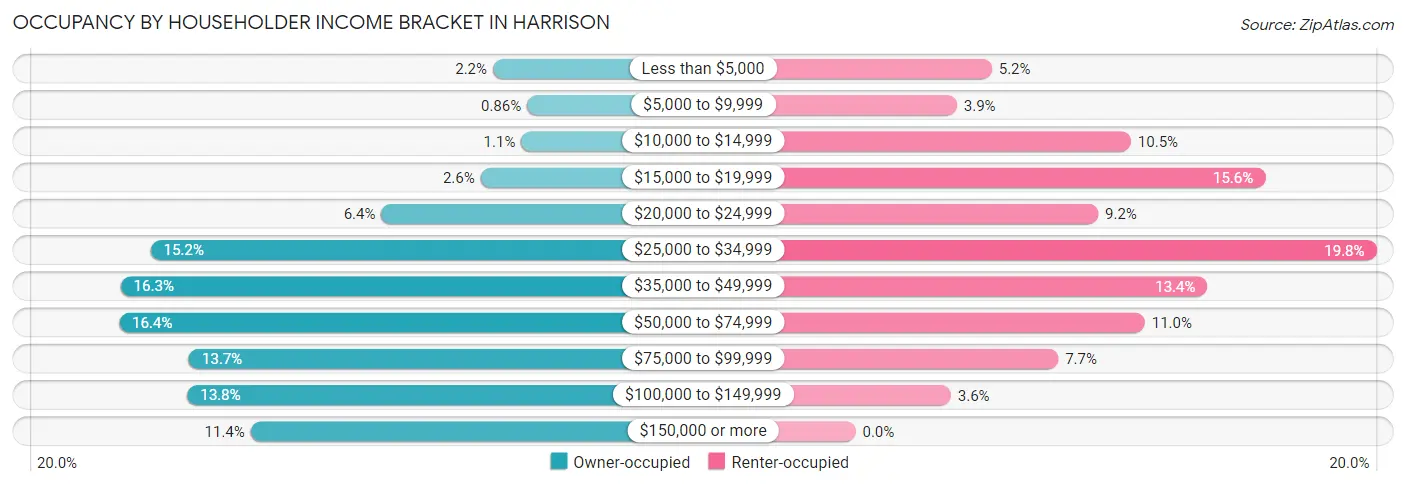
| Income Bracket | Owner-occupied | Renter-occupied |
| Less than $5,000 | 68 (2.2%) | 137 (5.2%) |
| $5,000 to $9,999 | 27 (0.9%) | 102 (3.9%) |
| $10,000 to $14,999 | 34 (1.1%) | 277 (10.5%) |
| $15,000 to $19,999 | 83 (2.6%) | 412 (15.6%) |
| $20,000 to $24,999 | 202 (6.4%) | 244 (9.2%) |
| $25,000 to $34,999 | 479 (15.2%) | 524 (19.8%) |
| $35,000 to $49,999 | 515 (16.3%) | 354 (13.4%) |
| $50,000 to $74,999 | 517 (16.4%) | 291 (11.0%) |
| $75,000 to $99,999 | 433 (13.7%) | 204 (7.7%) |
| $100,000 to $149,999 | 435 (13.8%) | 96 (3.6%) |
| $150,000 or more | 359 (11.4%) | 0 (0.0%) |
| Total | 3,152 (100.0%) | 2,641 (100.0%) |
Monthly Housing Cost Tiers in Harrison
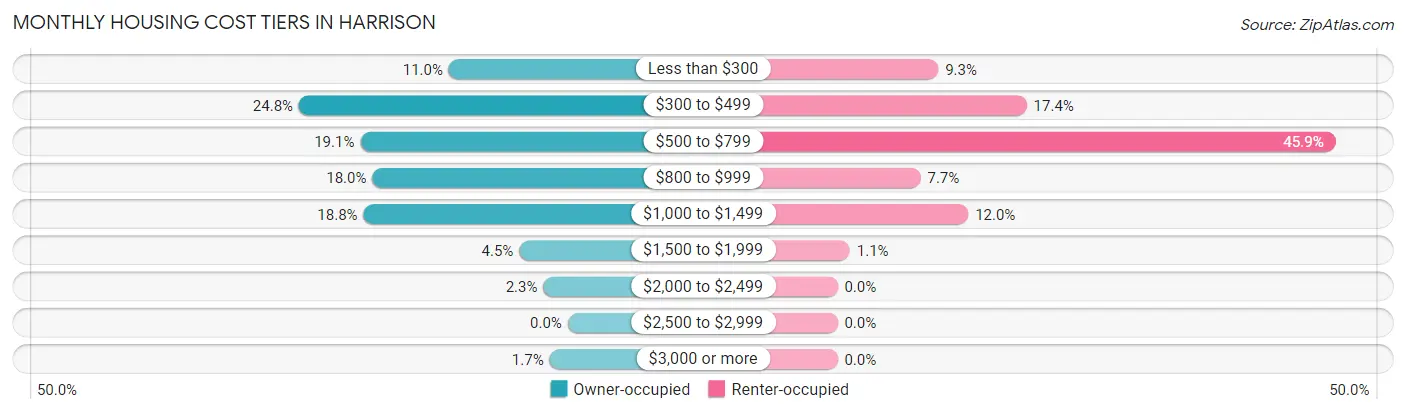
| Monthly Cost | Owner-occupied | Renter-occupied |
| Less than $300 | 345 (11.0%) | 245 (9.3%) |
| $300 to $499 | 780 (24.7%) | 460 (17.4%) |
| $500 to $799 | 602 (19.1%) | 1,211 (45.9%) |
| $800 to $999 | 567 (18.0%) | 202 (7.6%) |
| $1,000 to $1,499 | 593 (18.8%) | 318 (12.0%) |
| $1,500 to $1,999 | 141 (4.5%) | 30 (1.1%) |
| $2,000 to $2,499 | 71 (2.2%) | 0 (0.0%) |
| $2,500 to $2,999 | 0 (0.0%) | 0 (0.0%) |
| $3,000 or more | 53 (1.7%) | 0 (0.0%) |
| Total | 3,152 (100.0%) | 2,641 (100.0%) |
Physical Housing Characteristics in Harrison
Housing Structures in Harrison
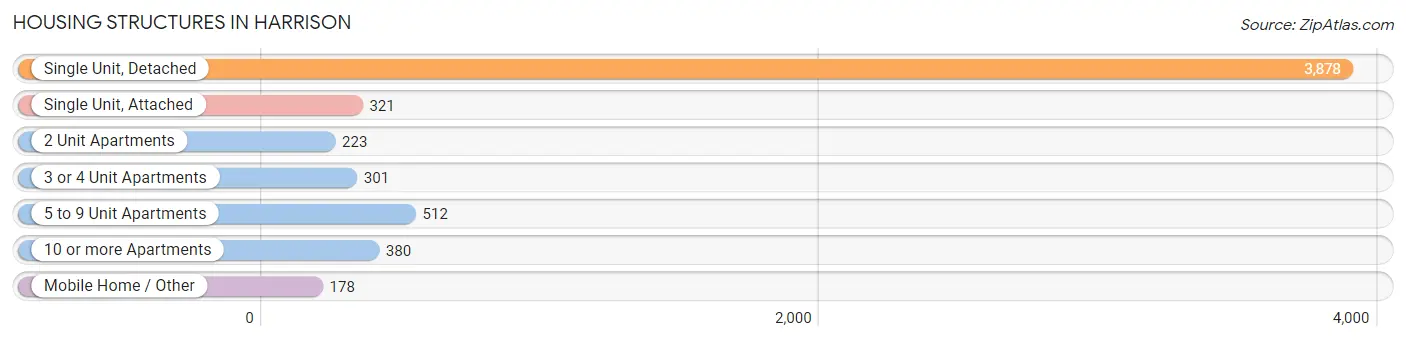
| Structure Type | # Housing Units | % Housing Units |
| Single Unit, Detached | 3,878 | 66.9% |
| Single Unit, Attached | 321 | 5.5% |
| 2 Unit Apartments | 223 | 3.8% |
| 3 or 4 Unit Apartments | 301 | 5.2% |
| 5 to 9 Unit Apartments | 512 | 8.8% |
| 10 or more Apartments | 380 | 6.6% |
| Mobile Home / Other | 178 | 3.1% |
| Total | 5,793 | 100.0% |
Housing Structures by Occupancy in Harrison
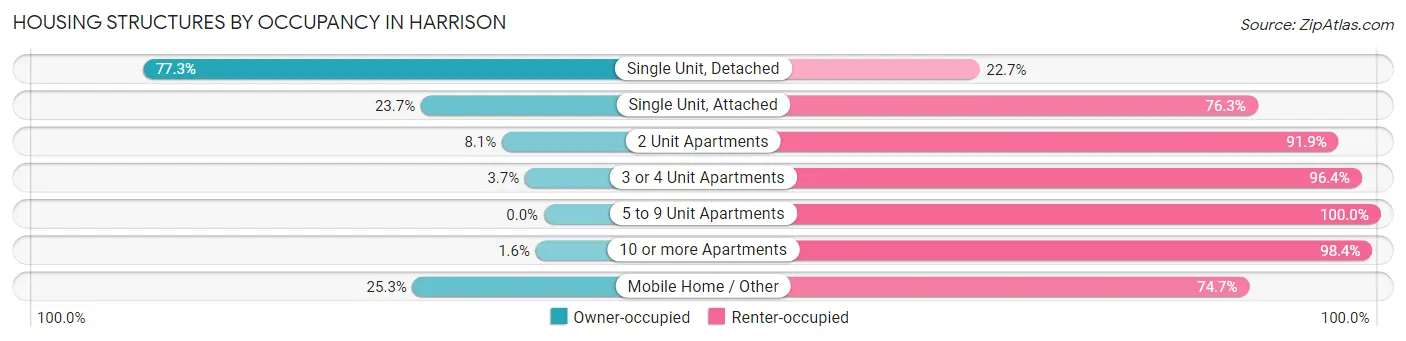
| Structure Type | Owner-occupied | Renter-occupied |
| Single Unit, Detached | 2,996 (77.3%) | 882 (22.7%) |
| Single Unit, Attached | 76 (23.7%) | 245 (76.3%) |
| 2 Unit Apartments | 18 (8.1%) | 205 (91.9%) |
| 3 or 4 Unit Apartments | 11 (3.6%) | 290 (96.4%) |
| 5 to 9 Unit Apartments | 0 (0.0%) | 512 (100.0%) |
| 10 or more Apartments | 6 (1.6%) | 374 (98.4%) |
| Mobile Home / Other | 45 (25.3%) | 133 (74.7%) |
| Total | 3,152 (54.4%) | 2,641 (45.6%) |
Housing Structures by Number of Rooms in Harrison
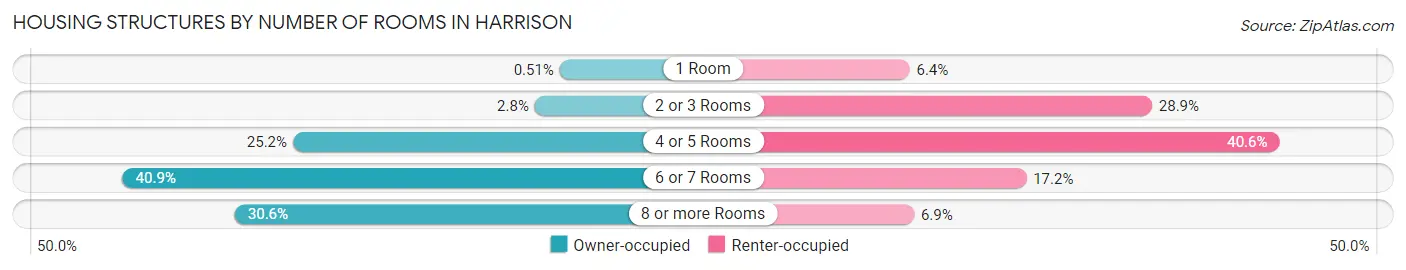
| Number of Rooms | Owner-occupied | Renter-occupied |
| 1 Room | 16 (0.5%) | 170 (6.4%) |
| 2 or 3 Rooms | 89 (2.8%) | 762 (28.8%) |
| 4 or 5 Rooms | 794 (25.2%) | 1,073 (40.6%) |
| 6 or 7 Rooms | 1,290 (40.9%) | 455 (17.2%) |
| 8 or more Rooms | 963 (30.5%) | 181 (6.9%) |
| Total | 3,152 (100.0%) | 2,641 (100.0%) |
Housing Structure by Heating Type in Harrison
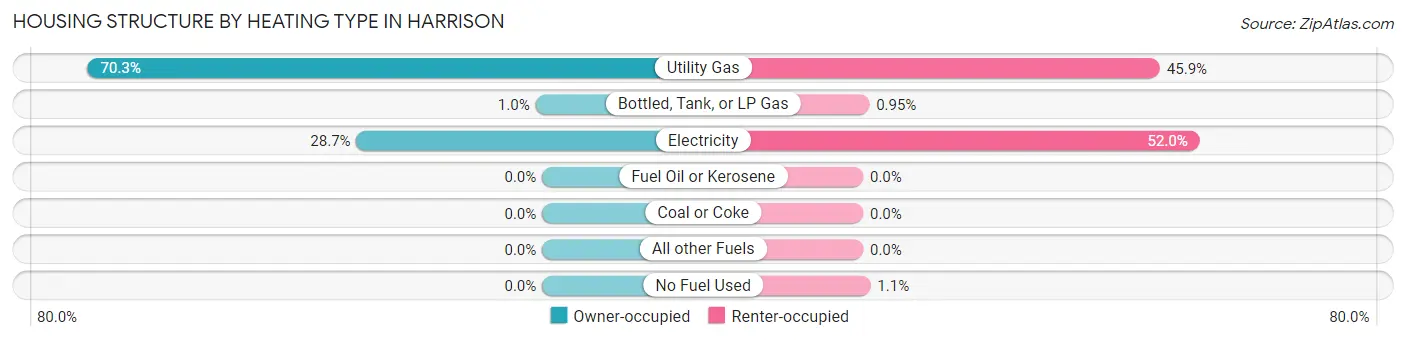
| Heating Type | Owner-occupied | Renter-occupied |
| Utility Gas | 2,215 (70.3%) | 1,212 (45.9%) |
| Bottled, Tank, or LP Gas | 32 (1.0%) | 25 (0.9%) |
| Electricity | 905 (28.7%) | 1,374 (52.0%) |
| Fuel Oil or Kerosene | 0 (0.0%) | 0 (0.0%) |
| Coal or Coke | 0 (0.0%) | 0 (0.0%) |
| All other Fuels | 0 (0.0%) | 0 (0.0%) |
| No Fuel Used | 0 (0.0%) | 30 (1.1%) |
| Total | 3,152 (100.0%) | 2,641 (100.0%) |
Household Vehicle Usage in Harrison
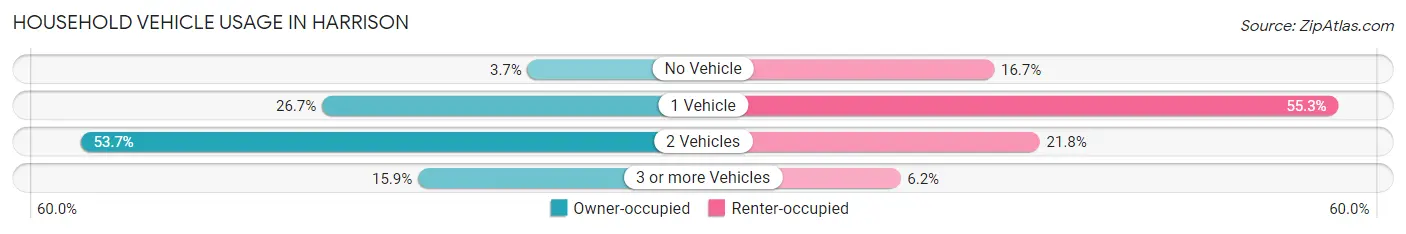
| Vehicles per Household | Owner-occupied | Renter-occupied |
| No Vehicle | 115 (3.6%) | 441 (16.7%) |
| 1 Vehicle | 841 (26.7%) | 1,460 (55.3%) |
| 2 Vehicles | 1,694 (53.7%) | 576 (21.8%) |
| 3 or more Vehicles | 502 (15.9%) | 164 (6.2%) |
| Total | 3,152 (100.0%) | 2,641 (100.0%) |
Real Estate & Mortgages in Harrison
Real Estate and Mortgage Overview in Harrison
| Characteristic | Without Mortgage | With Mortgage |
| Housing Units | 1,532 | 1,620 |
| Median Property Value | $154,500 | $139,500 |
| Median Household Income | $44,706 | $177 |
| Monthly Housing Costs | $429 | $44 |
| Real Estate Taxes | $911 | $0 |
Property Value by Mortgage Status in Harrison
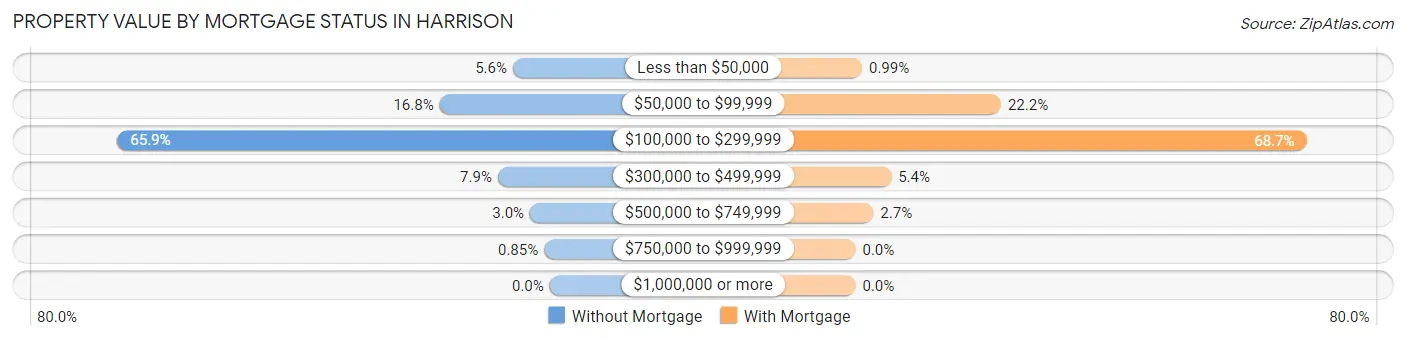
| Property Value | Without Mortgage | With Mortgage |
| Less than $50,000 | 86 (5.6%) | 16 (1.0%) |
| $50,000 to $99,999 | 257 (16.8%) | 359 (22.2%) |
| $100,000 to $299,999 | 1,009 (65.9%) | 1,113 (68.7%) |
| $300,000 to $499,999 | 121 (7.9%) | 88 (5.4%) |
| $500,000 to $749,999 | 46 (3.0%) | 44 (2.7%) |
| $750,000 to $999,999 | 13 (0.9%) | 0 (0.0%) |
| $1,000,000 or more | 0 (0.0%) | 0 (0.0%) |
| Total | 1,532 (100.0%) | 1,620 (100.0%) |
Household Income by Mortgage Status in Harrison
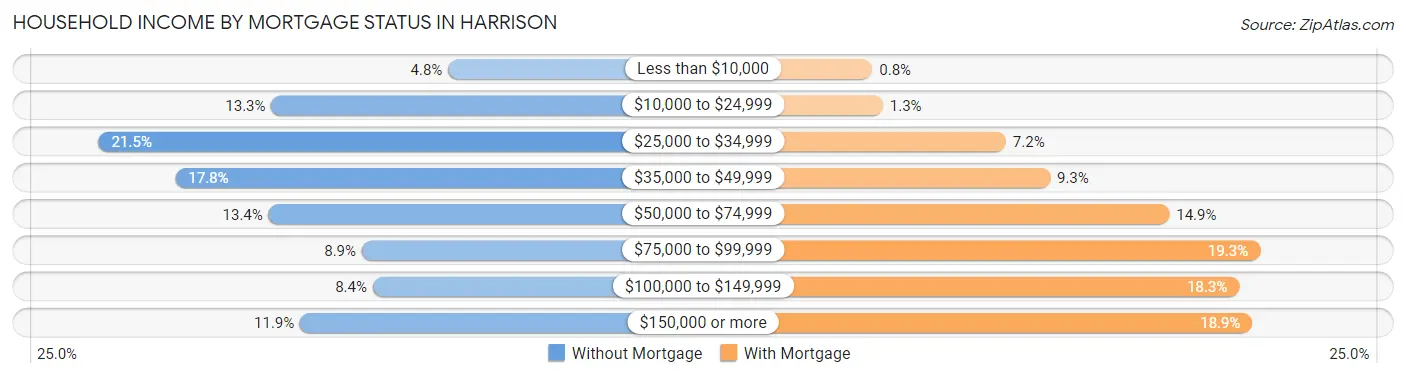
| Household Income | Without Mortgage | With Mortgage |
| Less than $10,000 | 74 (4.8%) | 13 (0.8%) |
| $10,000 to $24,999 | 203 (13.3%) | 21 (1.3%) |
| $25,000 to $34,999 | 329 (21.5%) | 116 (7.2%) |
| $35,000 to $49,999 | 273 (17.8%) | 150 (9.3%) |
| $50,000 to $74,999 | 205 (13.4%) | 242 (14.9%) |
| $75,000 to $99,999 | 137 (8.9%) | 312 (19.3%) |
| $100,000 to $149,999 | 129 (8.4%) | 296 (18.3%) |
| $150,000 or more | 182 (11.9%) | 306 (18.9%) |
| Total | 1,532 (100.0%) | 1,620 (100.0%) |
Property Value to Household Income Ratio in Harrison
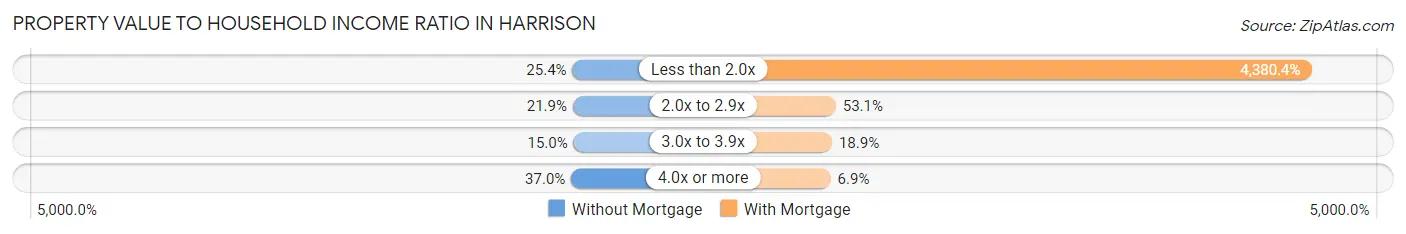
| Value-to-Income Ratio | Without Mortgage | With Mortgage |
| Less than 2.0x | 389 (25.4%) | 70,962 (4,380.4%) |
| 2.0x to 2.9x | 336 (21.9%) | 860 (53.1%) |
| 3.0x to 3.9x | 229 (14.9%) | 306 (18.9%) |
| 4.0x or more | 567 (37.0%) | 112 (6.9%) |
| Total | 1,532 (100.0%) | 1,620 (100.0%) |
Real Estate Taxes by Mortgage Status in Harrison
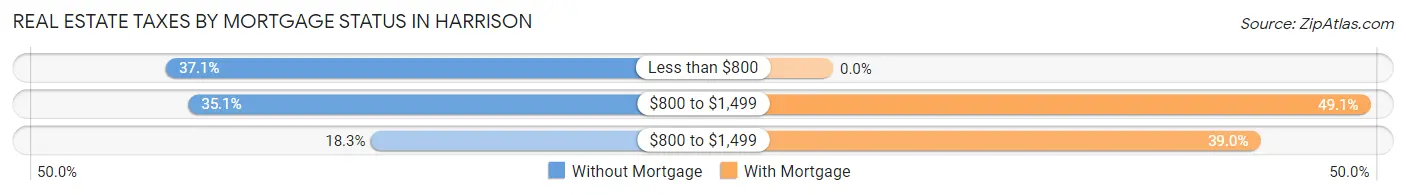
| Property Taxes | Without Mortgage | With Mortgage |
| Less than $800 | 568 (37.1%) | 0 (0.0%) |
| $800 to $1,499 | 537 (35.0%) | 795 (49.1%) |
| $800 to $1,499 | 281 (18.3%) | 632 (39.0%) |
| Total | 1,532 (100.0%) | 1,620 (100.0%) |
Health & Disability in Harrison
Health Insurance Coverage by Age in Harrison
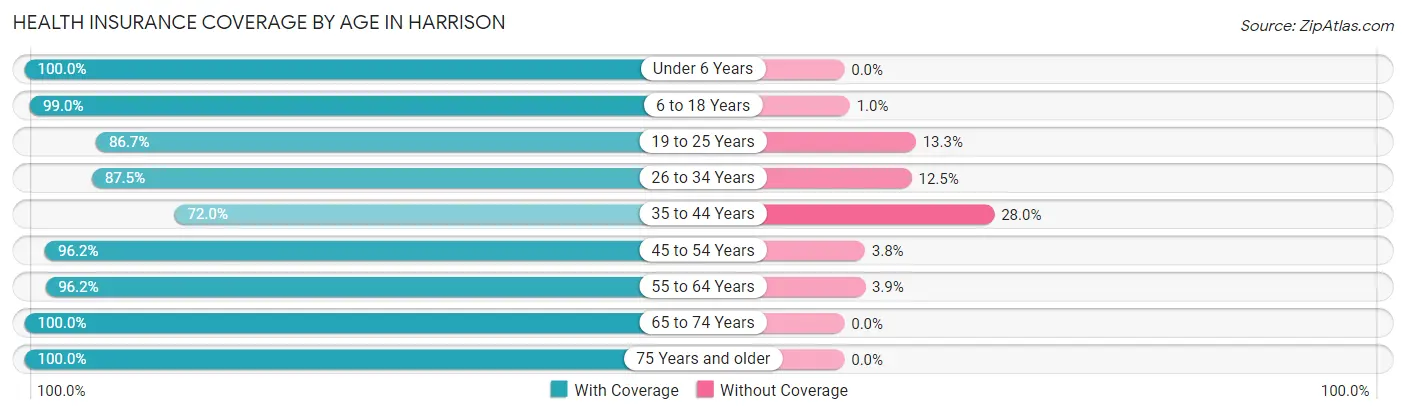
| Age Bracket | With Coverage | Without Coverage |
| Under 6 Years | 780 (100.0%) | 0 (0.0%) |
| 6 to 18 Years | 2,155 (99.0%) | 22 (1.0%) |
| 19 to 25 Years | 742 (86.7%) | 114 (13.3%) |
| 26 to 34 Years | 1,485 (87.5%) | 213 (12.5%) |
| 35 to 44 Years | 1,082 (72.0%) | 420 (28.0%) |
| 45 to 54 Years | 1,255 (96.2%) | 50 (3.8%) |
| 55 to 64 Years | 1,872 (96.2%) | 75 (3.8%) |
| 65 to 74 Years | 1,258 (100.0%) | 0 (0.0%) |
| 75 Years and older | 1,389 (100.0%) | 0 (0.0%) |
| Total | 12,018 (93.1%) | 894 (6.9%) |
Health Insurance Coverage by Citizenship Status in Harrison
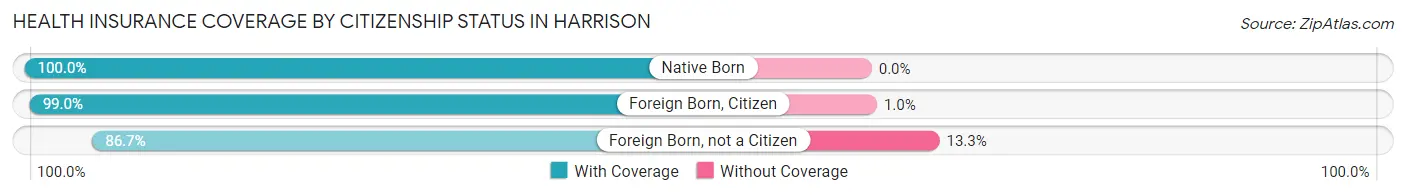
| Citizenship Status | With Coverage | Without Coverage |
| Native Born | 780 (100.0%) | 0 (0.0%) |
| Foreign Born, Citizen | 2,155 (99.0%) | 22 (1.0%) |
| Foreign Born, not a Citizen | 742 (86.7%) | 114 (13.3%) |
Health Insurance Coverage by Household Income in Harrison
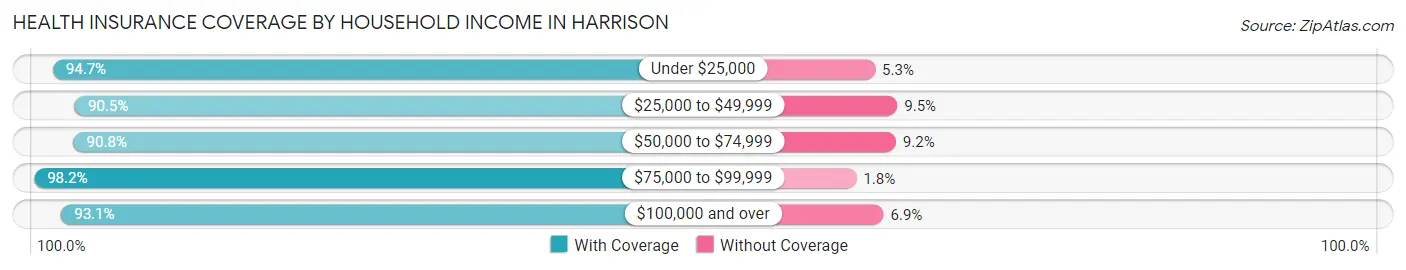
| Household Income | With Coverage | Without Coverage |
| Under $25,000 | 2,142 (94.7%) | 120 (5.3%) |
| $25,000 to $49,999 | 3,469 (90.5%) | 363 (9.5%) |
| $50,000 to $74,999 | 1,598 (90.8%) | 162 (9.2%) |
| $75,000 to $99,999 | 1,845 (98.2%) | 34 (1.8%) |
| $100,000 and over | 2,894 (93.1%) | 214 (6.9%) |
Public vs Private Health Insurance Coverage by Age in Harrison
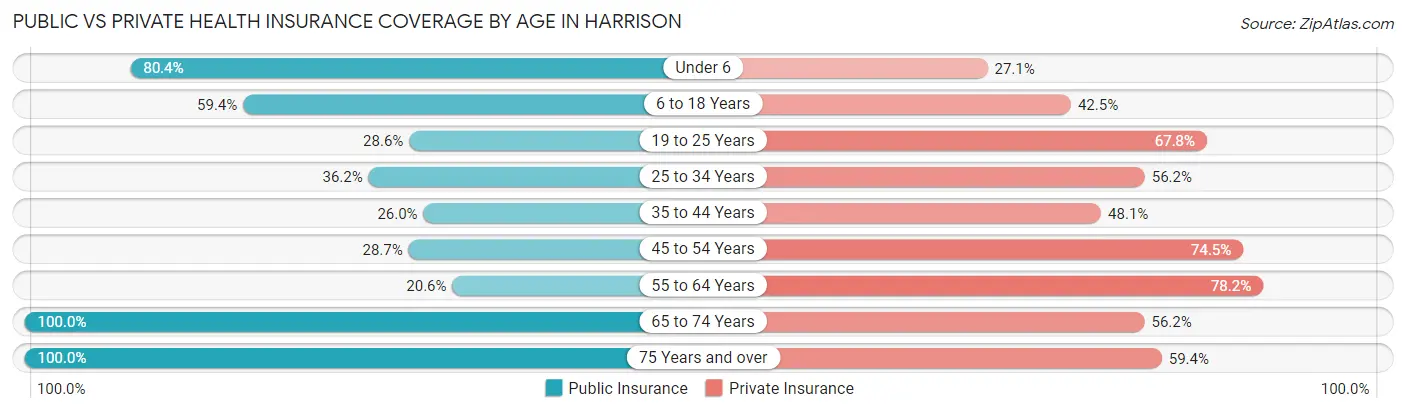
| Age Bracket | Public Insurance | Private Insurance |
| Under 6 | 627 (80.4%) | 211 (27.1%) |
| 6 to 18 Years | 1,294 (59.4%) | 926 (42.5%) |
| 19 to 25 Years | 245 (28.6%) | 580 (67.8%) |
| 25 to 34 Years | 614 (36.2%) | 955 (56.2%) |
| 35 to 44 Years | 390 (26.0%) | 723 (48.1%) |
| 45 to 54 Years | 375 (28.7%) | 972 (74.5%) |
| 55 to 64 Years | 401 (20.6%) | 1,522 (78.2%) |
| 65 to 74 Years | 1,258 (100.0%) | 707 (56.2%) |
| 75 Years and over | 1,389 (100.0%) | 825 (59.4%) |
| Total | 6,593 (51.1%) | 7,421 (57.5%) |
Disability Status by Sex by Age in Harrison
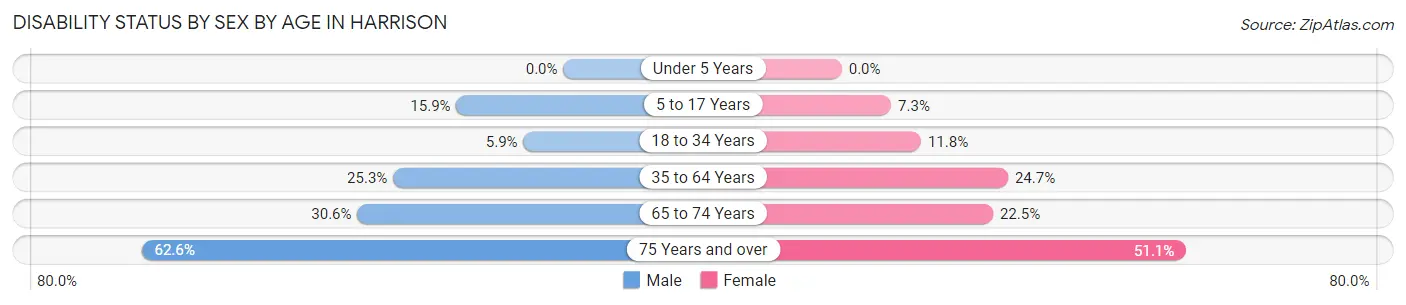
| Age Bracket | Male | Female |
| Under 5 Years | 0 (0.0%) | 0 (0.0%) |
| 5 to 17 Years | 198 (15.9%) | 72 (7.3%) |
| 18 to 34 Years | 76 (5.9%) | 159 (11.8%) |
| 35 to 64 Years | 622 (25.3%) | 566 (24.7%) |
| 65 to 74 Years | 160 (30.6%) | 165 (22.5%) |
| 75 Years and over | 310 (62.6%) | 457 (51.1%) |
Disability Class by Sex by Age in Harrison
Disability Class: Hearing Difficulty
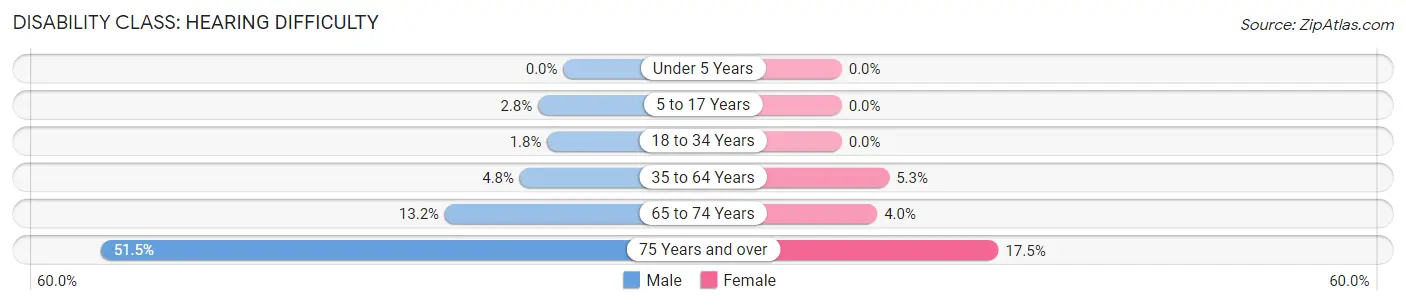
| Age Bracket | Male | Female |
| Under 5 Years | 0 (0.0%) | 0 (0.0%) |
| 5 to 17 Years | 35 (2.8%) | 0 (0.0%) |
| 18 to 34 Years | 23 (1.8%) | 0 (0.0%) |
| 35 to 64 Years | 119 (4.8%) | 121 (5.3%) |
| 65 to 74 Years | 69 (13.2%) | 29 (4.0%) |
| 75 Years and over | 255 (51.5%) | 156 (17.4%) |
Disability Class: Vision Difficulty
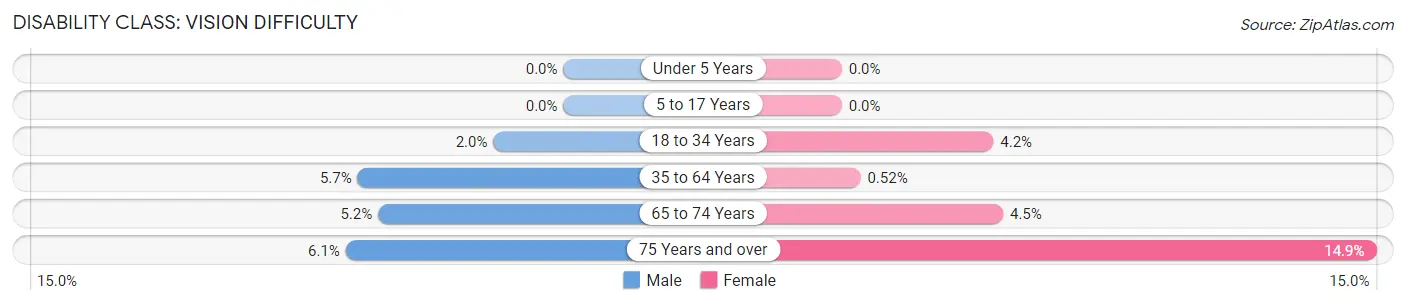
| Age Bracket | Male | Female |
| Under 5 Years | 0 (0.0%) | 0 (0.0%) |
| 5 to 17 Years | 0 (0.0%) | 0 (0.0%) |
| 18 to 34 Years | 25 (1.9%) | 57 (4.2%) |
| 35 to 64 Years | 141 (5.7%) | 12 (0.5%) |
| 65 to 74 Years | 27 (5.2%) | 33 (4.5%) |
| 75 Years and over | 30 (6.1%) | 133 (14.9%) |
Disability Class: Cognitive Difficulty
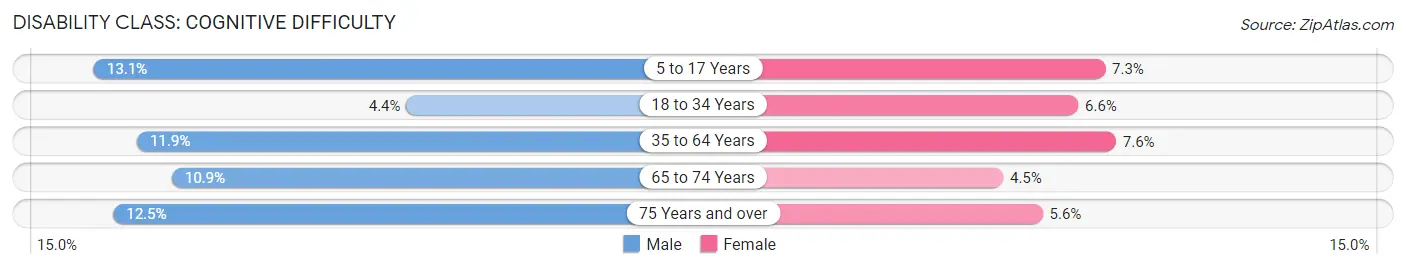
| Age Bracket | Male | Female |
| 5 to 17 Years | 163 (13.1%) | 72 (7.3%) |
| 18 to 34 Years | 56 (4.4%) | 89 (6.6%) |
| 35 to 64 Years | 292 (11.9%) | 175 (7.6%) |
| 65 to 74 Years | 57 (10.9%) | 33 (4.5%) |
| 75 Years and over | 62 (12.5%) | 50 (5.6%) |
Disability Class: Ambulatory Difficulty
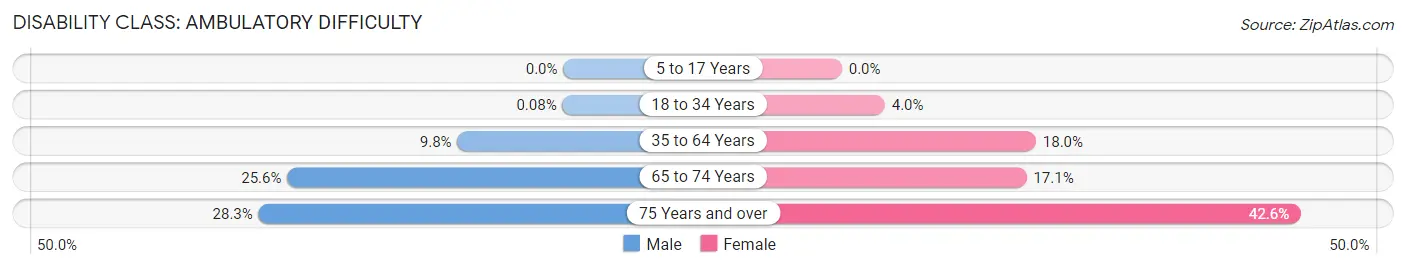
| Age Bracket | Male | Female |
| 5 to 17 Years | 0 (0.0%) | 0 (0.0%) |
| 18 to 34 Years | 1 (0.1%) | 54 (4.0%) |
| 35 to 64 Years | 242 (9.8%) | 413 (18.0%) |
| 65 to 74 Years | 134 (25.6%) | 126 (17.1%) |
| 75 Years and over | 140 (28.3%) | 381 (42.6%) |
Disability Class: Self-Care Difficulty
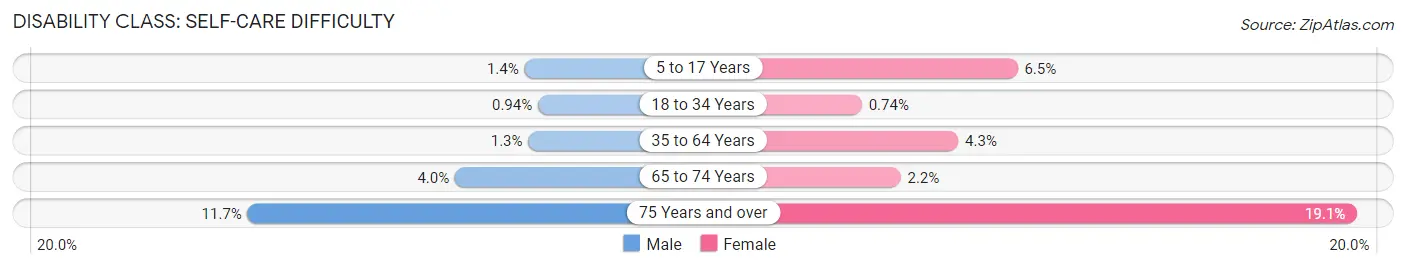
| Age Bracket | Male | Female |
| 5 to 17 Years | 18 (1.4%) | 64 (6.5%) |
| 18 to 34 Years | 12 (0.9%) | 10 (0.7%) |
| 35 to 64 Years | 32 (1.3%) | 99 (4.3%) |
| 65 to 74 Years | 21 (4.0%) | 16 (2.2%) |
| 75 Years and over | 58 (11.7%) | 171 (19.1%) |
Technology Access in Harrison
Computing Device Access in Harrison
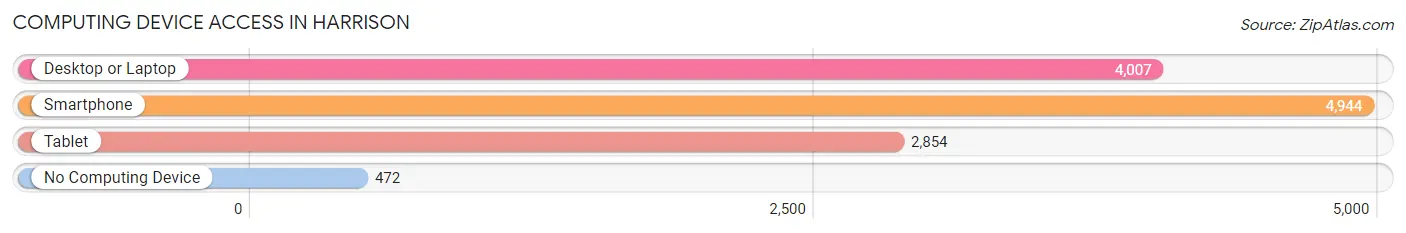
| Device Type | # Households | % Households |
| Desktop or Laptop | 4,007 | 69.2% |
| Smartphone | 4,944 | 85.3% |
| Tablet | 2,854 | 49.3% |
| No Computing Device | 472 | 8.2% |
| Total | 5,793 | 100.0% |
Internet Access in Harrison
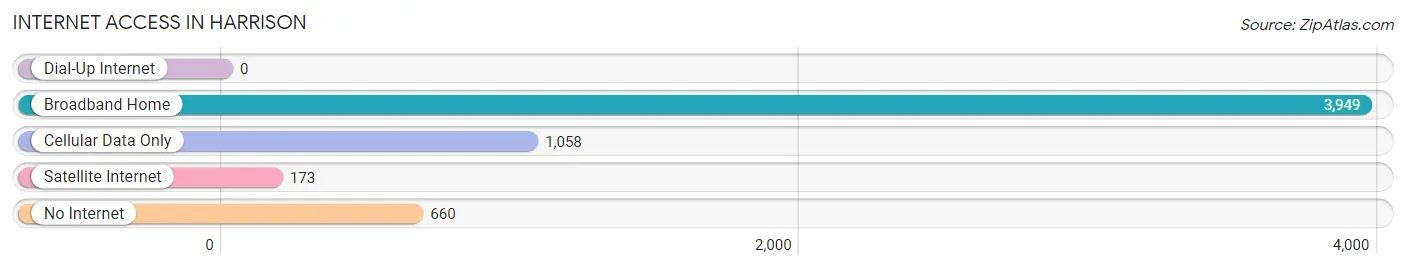
| Internet Type | # Households | % Households |
| Dial-Up Internet | 0 | 0.0% |
| Broadband Home | 3,949 | 68.2% |
| Cellular Data Only | 1,058 | 18.3% |
| Satellite Internet | 173 | 3.0% |
| No Internet | 660 | 11.4% |
| Total | 5,793 | 100.0% |
Harrison Summary
Harrison is a city located in Boone County, Arkansas, United States. It is the county seat of Boone County and the largest city in the county. The population was 13,644 at the 2010 census, making it the fifth-largest city in Arkansas. Harrison is a regional center of trade for the Ozark Mountains region and is located approximately 100 miles north of Little Rock, Arkansas.
History
Harrison was founded in 1877 by General Marcus LaRue Harrison, a former Confederate officer. The city was named after him and was incorporated in 1881. The city was originally a small farming community, but it quickly grew into a bustling commercial center. The city was the site of the first courthouse in Boone County, and it was also the first county seat.
In the early 1900s, Harrison became a popular tourist destination due to its proximity to the Ozark Mountains. The city was also home to several resorts, including the Harrison Hot Springs Resort, which opened in 1907. The resort was a popular destination for visitors from all over the country.
In the 1920s, Harrison experienced a period of growth and prosperity. The city was home to several manufacturing plants, including a cotton mill, a furniture factory, and a canning factory. The city also had a thriving business district, which included several banks, stores, and restaurants.
Geography
Harrison is located in the Ozark Mountains region of Arkansas. The city is situated in the foothills of the Ozarks, and it is surrounded by rolling hills and forests. The city is located at the intersection of U.S. Route 65 and Arkansas Highway 43.
The city has a total area of 10.3 square miles, of which 10.2 square miles is land and 0.1 square miles is water. The city is located at an elevation of 1,072 feet above sea level.
Economy
Harrison is a regional center of trade for the Ozark Mountains region. The city is home to several manufacturing plants, including a cotton mill, a furniture factory, and a canning factory. The city also has a thriving business district, which includes several banks, stores, and restaurants.
The city is also home to several tourist attractions, including the Harrison Hot Springs Resort, the Boone County Historical Museum, and the Ozark Folk Center. The city is also home to several festivals, including the Harrison Music Festival and the Ozark Folk Festival.
Demographics
As of the 2010 census, there were 13,644 people, 5,717 households, and 3,541 families residing in the city. The population density was 1,334.2 people per square mile. The racial makeup of the city was 92.3% White, 0.7% African American, 0.7% Native American, 0.7% Asian, 0.1% Pacific Islander, 3.2% from other races, and 2.1% from two or more races. Hispanic or Latino of any race were 6.2% of the population.
The median income for a household in the city was $30,945, and the median income for a family was $37,945. The per capita income for the city was $17,845. About 16.2% of families and 19.7% of the population were below the poverty line, including 28.2% of those under age 18 and 11.2% of those age 65 or over.
Common Questions
What is Per Capita Income in Harrison?
Per Capita income in Harrison is $27,095.
What is the Median Family Income in Harrison?
Median Family Income in Harrison is $62,500.
What is the Median Household income in Harrison?
Median Household Income in Harrison is $39,677.
What is Income or Wage Gap in Harrison?
Income or Wage Gap in Harrison is 12.9%.
Women in Harrison earn 87.1 cents for every dollar earned by a man.
What is Family Income Deficit in Harrison?
Family Income Deficit in Harrison is $9,466.
Families that are below poverty line in Harrison earn $9,466 less on average than the poverty threshold level.
What is Inequality or Gini Index in Harrison?
Inequality or Gini Index in Harrison is 0.47.
What is the Total Population of Harrison?
Total Population of Harrison is 13,154.
What is the Total Male Population of Harrison?
Total Male Population of Harrison is 6,374.
What is the Total Female Population of Harrison?
Total Female Population of Harrison is 6,780.
What is the Ratio of Males per 100 Females in Harrison?
There are 94.01 Males per 100 Females in Harrison.
What is the Ratio of Females per 100 Males in Harrison?
There are 106.37 Females per 100 Males in Harrison.
What is the Median Population Age in Harrison?
Median Population Age in Harrison is 41.8 Years.
What is the Average Family Size in Harrison
Average Family Size in Harrison is 3.1 People.
What is the Average Household Size in Harrison
Average Household Size in Harrison is 2.2 People.
How Large is the Labor Force in Harrison?
There are 5,790 People in the Labor Forcein in Harrison.
What is the Percentage of People in the Labor Force in Harrison?
54.9% of People are in the Labor Force in Harrison.
What is the Unemployment Rate in Harrison?
Unemployment Rate in Harrison is 6.4%.