Pottsville, AR Map & Demographics
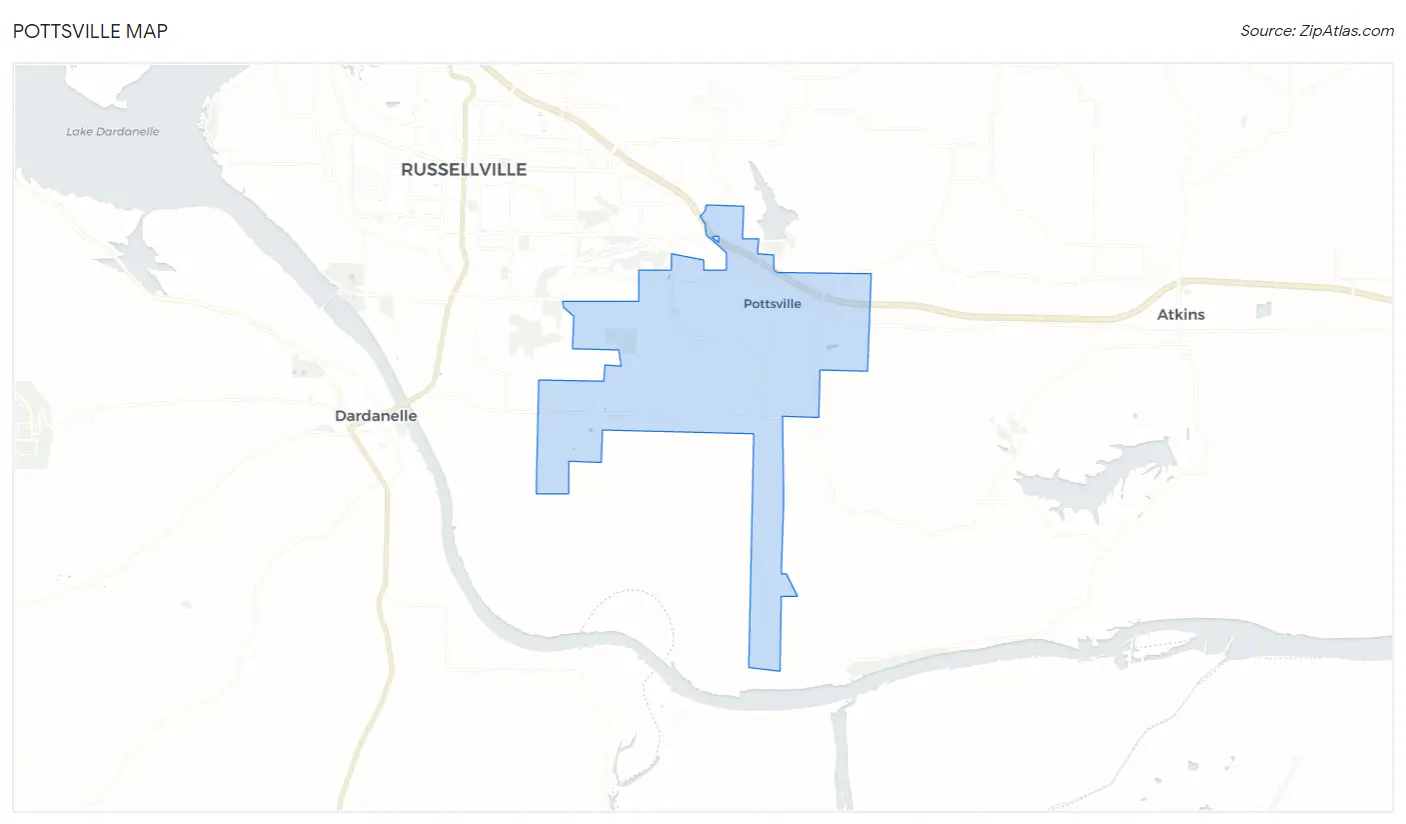
Pottsville Map
Pottsville Overview
$35,994
PER CAPITA INCOME
$70,774
AVG FAMILY INCOME
$66,250
AVG HOUSEHOLD INCOME
49.5%
WAGE / INCOME GAP [ % ]
50.5¢/ $1
WAGE / INCOME GAP [ $ ]
0.62
INEQUALITY / GINI INDEX
3,141
TOTAL POPULATION
1,445
MALE POPULATION
1,696
FEMALE POPULATION
85.20
MALES / 100 FEMALES
117.37
FEMALES / 100 MALES
33.8
MEDIAN AGE
3.0
AVG FAMILY SIZE
2.8
AVG HOUSEHOLD SIZE
1,554
LABOR FORCE [ PEOPLE ]
66.6%
PERCENT IN LABOR FORCE
1.4%
UNEMPLOYMENT RATE
Pottsville Zip Codes
Pottsville Area Codes
Income in Pottsville
Income Overview in Pottsville
Per Capita Income in Pottsville is $35,994, while median incomes of families and households are $70,774 and $66,250 respectively.
| Characteristic | Number | Measure |
| Per Capita Income | 3,141 | $35,994 |
| Median Family Income | 977 | $70,774 |
| Mean Family Income | 977 | $145,591 |
| Median Household Income | 1,108 | $66,250 |
| Mean Household Income | 1,108 | $133,929 |
| Income Deficit | 977 | $0 |
| Wage / Income Gap (%) | 3,141 | 49.47% |
| Wage / Income Gap ($) | 3,141 | 50.53¢ per $1 |
| Gini / Inequality Index | 3,141 | 0.62 |
Earnings by Sex in Pottsville
Average Earnings in Pottsville are $34,214, $41,968 for men and $21,207 for women, a difference of 49.5%.
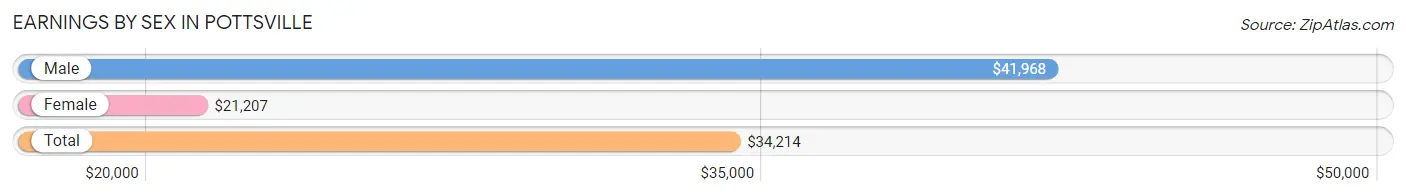
| Sex | Number | Average Earnings |
| Male | 901 (54.6%) | $41,968 |
| Female | 748 (45.4%) | $21,207 |
| Total | 1,649 (100.0%) | $34,214 |
Earnings by Sex by Income Bracket in Pottsville
The most common earnings brackets in Pottsville are $40,000 to $44,999 for men (105 | 11.7%) and $55,000 to $64,999 for women (77 | 10.3%).
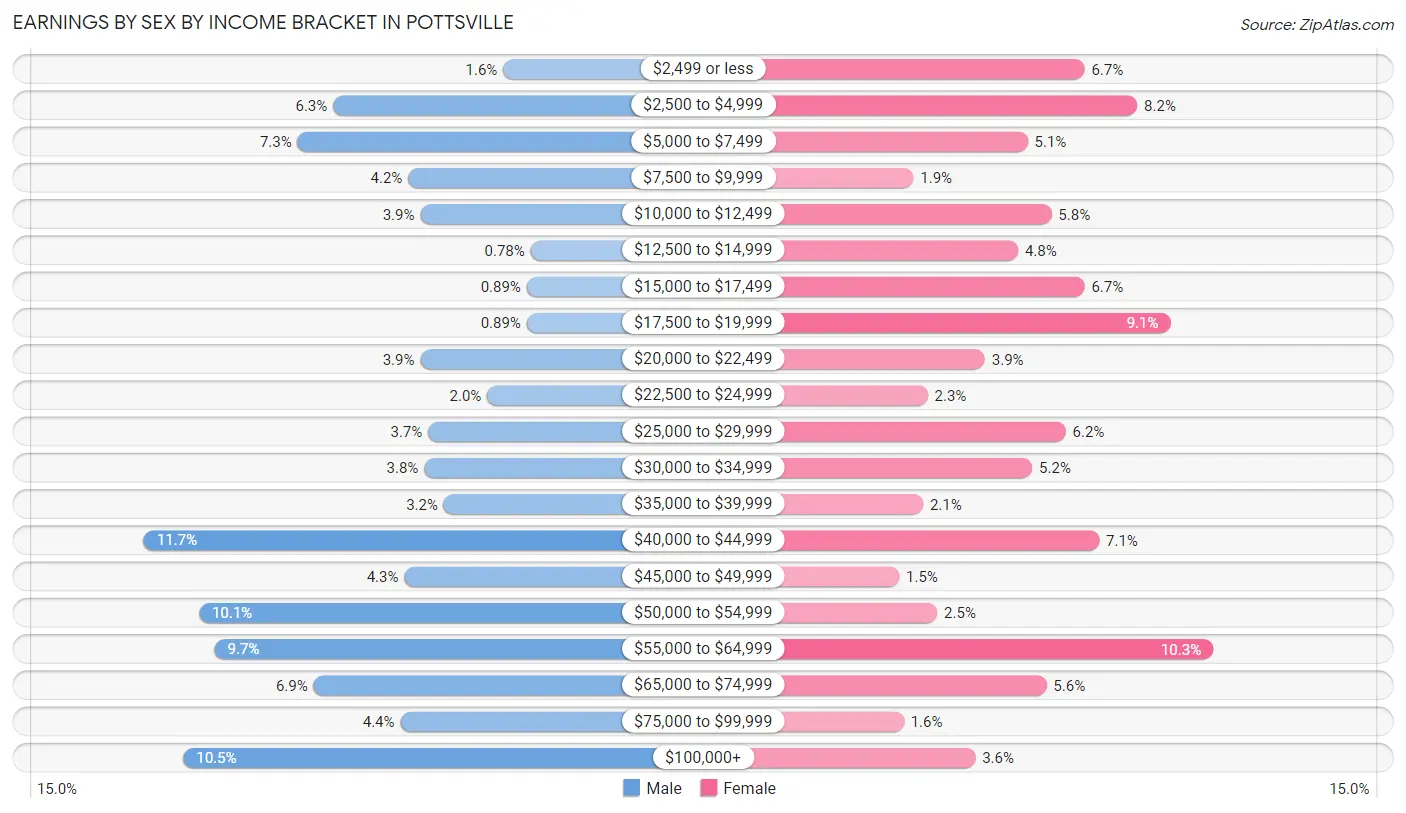
| Income | Male | Female |
| $2,499 or less | 14 (1.5%) | 50 (6.7%) |
| $2,500 to $4,999 | 57 (6.3%) | 61 (8.2%) |
| $5,000 to $7,499 | 66 (7.3%) | 38 (5.1%) |
| $7,500 to $9,999 | 38 (4.2%) | 14 (1.9%) |
| $10,000 to $12,499 | 35 (3.9%) | 43 (5.8%) |
| $12,500 to $14,999 | 7 (0.8%) | 36 (4.8%) |
| $15,000 to $17,499 | 8 (0.9%) | 50 (6.7%) |
| $17,500 to $19,999 | 8 (0.9%) | 68 (9.1%) |
| $20,000 to $22,499 | 35 (3.9%) | 29 (3.9%) |
| $22,500 to $24,999 | 18 (2.0%) | 17 (2.3%) |
| $25,000 to $29,999 | 33 (3.7%) | 46 (6.1%) |
| $30,000 to $34,999 | 34 (3.8%) | 39 (5.2%) |
| $35,000 to $39,999 | 29 (3.2%) | 16 (2.1%) |
| $40,000 to $44,999 | 105 (11.7%) | 53 (7.1%) |
| $45,000 to $49,999 | 39 (4.3%) | 11 (1.5%) |
| $50,000 to $54,999 | 91 (10.1%) | 19 (2.5%) |
| $55,000 to $64,999 | 87 (9.7%) | 77 (10.3%) |
| $65,000 to $74,999 | 62 (6.9%) | 42 (5.6%) |
| $75,000 to $99,999 | 40 (4.4%) | 12 (1.6%) |
| $100,000+ | 95 (10.5%) | 27 (3.6%) |
| Total | 901 (100.0%) | 748 (100.0%) |
Earnings by Sex by Educational Attainment in Pottsville
Average earnings in Pottsville are $52,845 for men and $25,921 for women, a difference of 50.9%. Men with an educational attainment of college or associate's degree enjoy the highest average annual earnings of $53,920, while those with bachelor's degree education earn the least with $28,833. Women with an educational attainment of bachelor's degree earn the most with the average annual earnings of $44,597, while those with less than high school education have the smallest earnings of $16,125.
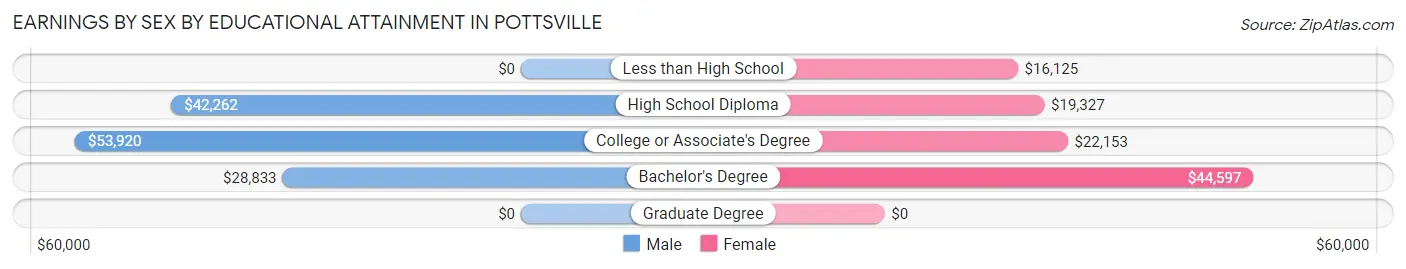
| Educational Attainment | Male Income | Female Income |
| Less than High School | - | - |
| High School Diploma | $42,262 | $19,327 |
| College or Associate's Degree | $53,920 | $22,153 |
| Bachelor's Degree | $28,833 | $44,597 |
| Graduate Degree | - | - |
| Total | $52,845 | $25,921 |
Family Income in Pottsville
Family Income Brackets in Pottsville
According to the Pottsville family income data, there are 162 families falling into the $50,000 to $74,999 income range, which is the most common income bracket and makes up 16.6% of all families. Conversely, the less than $10,000 income bracket is the least frequent group with only 13 families (1.3%) belonging to this category.
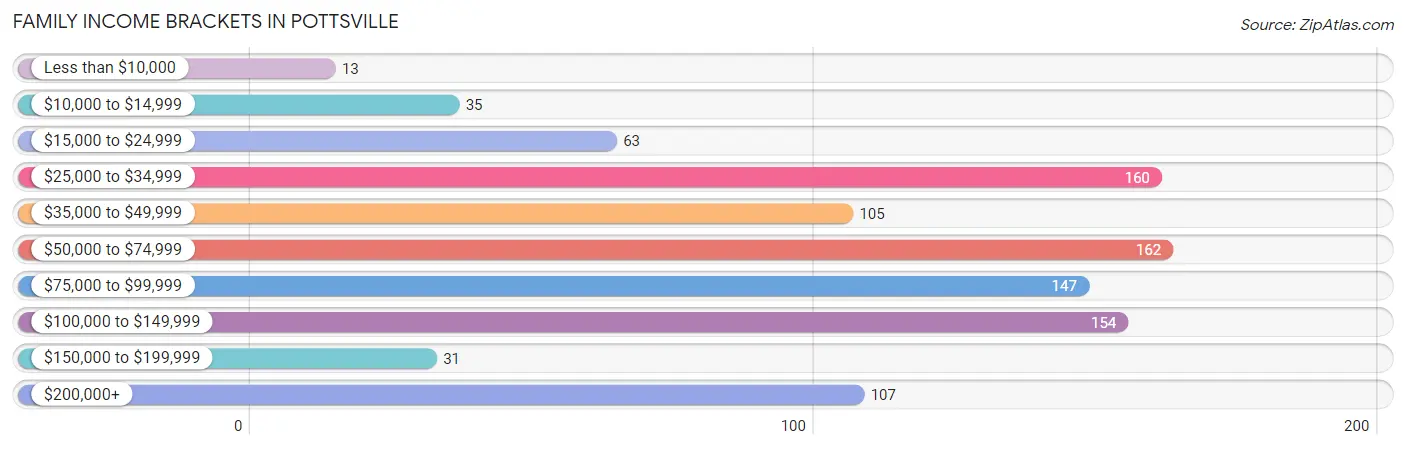
| Income Bracket | # Families | % Families |
| Less than $10,000 | 13 | 1.3% |
| $10,000 to $14,999 | 35 | 3.6% |
| $15,000 to $24,999 | 63 | 6.4% |
| $25,000 to $34,999 | 160 | 16.4% |
| $35,000 to $49,999 | 105 | 10.7% |
| $50,000 to $74,999 | 162 | 16.6% |
| $75,000 to $99,999 | 147 | 15.0% |
| $100,000 to $149,999 | 154 | 15.8% |
| $150,000 to $199,999 | 31 | 3.2% |
| $200,000+ | 107 | 11.0% |
Family Income by Famaliy Size in Pottsville
4-person families (270 | 27.6%) account for the highest median family income in Pottsville with $135,202 per family, while 4-person families (270 | 27.6%) have the highest median income of $33,800 per family member.
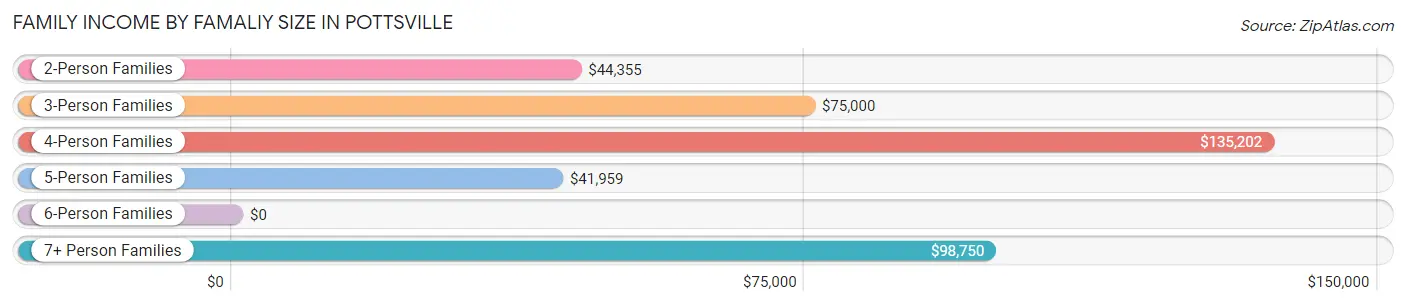
| Income Bracket | # Families | Median Income |
| 2-Person Families | 402 (41.1%) | $44,355 |
| 3-Person Families | 200 (20.5%) | $75,000 |
| 4-Person Families | 270 (27.6%) | $135,202 |
| 5-Person Families | 86 (8.8%) | $41,959 |
| 6-Person Families | 0 (0.0%) | $0 |
| 7+ Person Families | 19 (1.9%) | $98,750 |
| Total | 977 (100.0%) | $70,774 |
Family Income by Number of Earners in Pottsville
The median family income in Pottsville is $70,774, with families comprising 3+ earners (100) having the highest median family income of $136,667, while families with no earners (104) have the lowest median family income of $37,917, accounting for 10.2% and 10.6% of families, respectively.
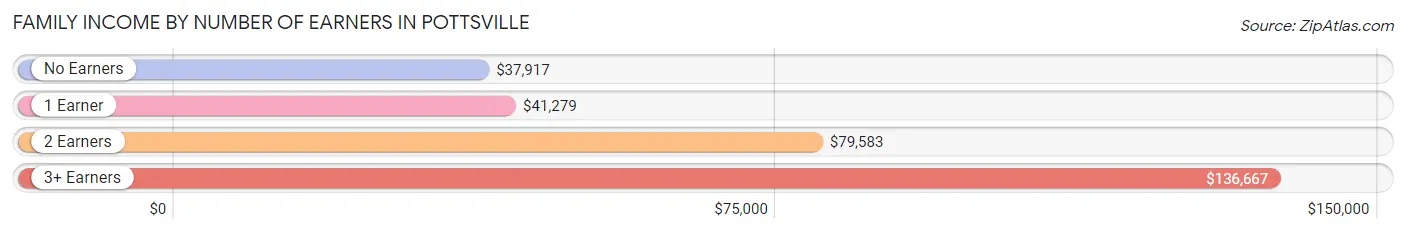
| Number of Earners | # Families | Median Income |
| No Earners | 104 (10.6%) | $37,917 |
| 1 Earner | 366 (37.5%) | $41,279 |
| 2 Earners | 407 (41.7%) | $79,583 |
| 3+ Earners | 100 (10.2%) | $136,667 |
| Total | 977 (100.0%) | $70,774 |
Household Income in Pottsville
Household Income Brackets in Pottsville
With 189 households falling in the category, the $50,000 to $74,999 income range is the most frequent in Pottsville, accounting for 17.1% of all households. In contrast, only 19 households (1.7%) fall into the less than $10,000 income bracket, making it the least populous group.
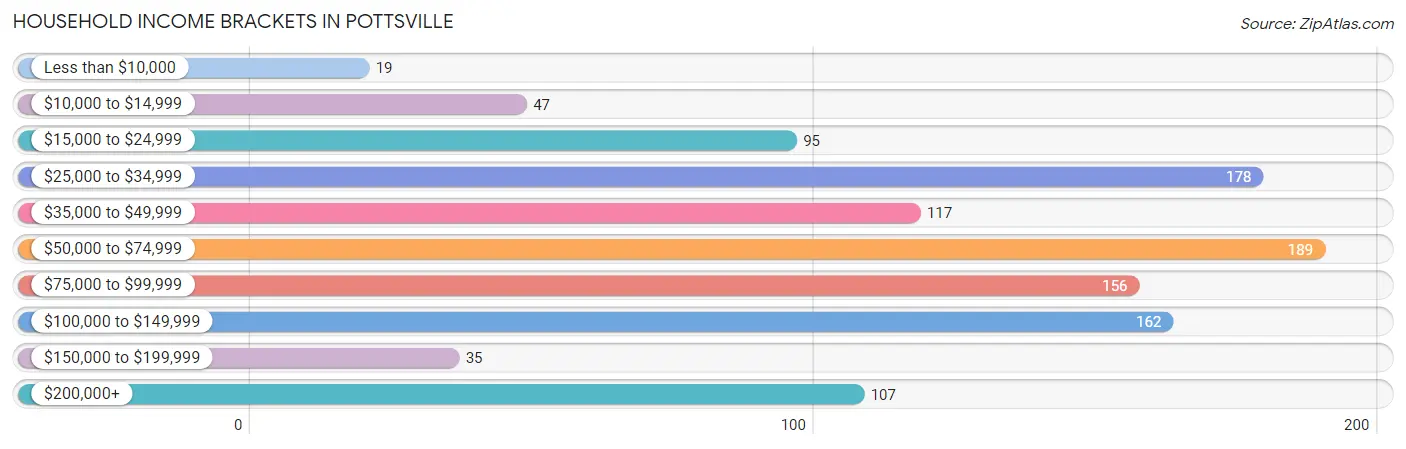
| Income Bracket | # Households | % Households |
| Less than $10,000 | 19 | 1.7% |
| $10,000 to $14,999 | 47 | 4.2% |
| $15,000 to $24,999 | 95 | 8.6% |
| $25,000 to $34,999 | 178 | 16.1% |
| $35,000 to $49,999 | 117 | 10.6% |
| $50,000 to $74,999 | 189 | 17.1% |
| $75,000 to $99,999 | 156 | 14.1% |
| $100,000 to $149,999 | 162 | 14.6% |
| $150,000 to $199,999 | 35 | 3.2% |
| $200,000+ | 107 | 9.7% |
Household Income by Householder Age in Pottsville
The median household income in Pottsville is $66,250, with the highest median household income of $71,845 found in the 45 to 64 years age bracket for the primary householder. A total of 345 households (31.1%) fall into this category. Meanwhile, the 65+ years age bracket for the primary householder has the lowest median household income of $54,375, with 196 households (17.7%) in this group.
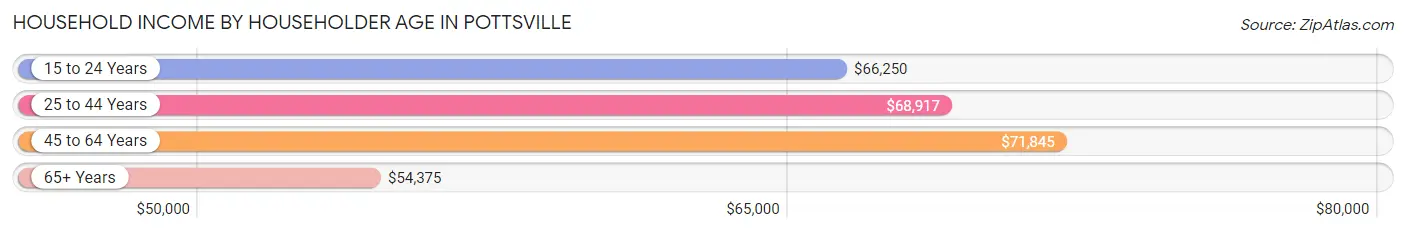
| Income Bracket | # Households | Median Income |
| 15 to 24 Years | 16 (1.4%) | $66,250 |
| 25 to 44 Years | 551 (49.7%) | $68,917 |
| 45 to 64 Years | 345 (31.1%) | $71,845 |
| 65+ Years | 196 (17.7%) | $54,375 |
| Total | 1,108 (100.0%) | $66,250 |
Poverty in Pottsville
Income Below Poverty by Sex and Age in Pottsville
With 12.5% poverty level for males and 13.0% for females among the residents of Pottsville, under 5 year old males and 18 to 24 year old females are the most vulnerable to poverty, with 45 males (50.0%) and 55 females (56.1%) in their respective age groups living below the poverty level.
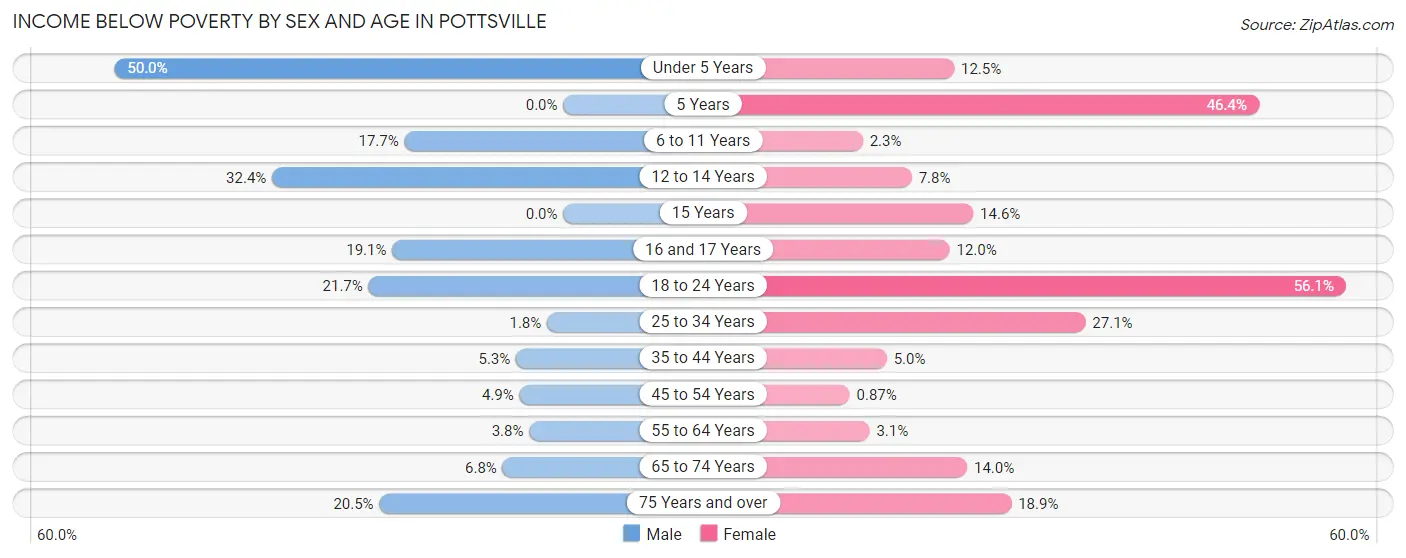
| Age Bracket | Male | Female |
| Under 5 Years | 45 (50.0%) | 13 (12.5%) |
| 5 Years | 0 (0.0%) | 13 (46.4%) |
| 6 to 11 Years | 23 (17.7%) | 6 (2.3%) |
| 12 to 14 Years | 12 (32.4%) | 6 (7.8%) |
| 15 Years | 0 (0.0%) | 6 (14.6%) |
| 16 and 17 Years | 12 (19.1%) | 6 (12.0%) |
| 18 to 24 Years | 36 (21.7%) | 55 (56.1%) |
| 25 to 34 Years | 5 (1.8%) | 70 (27.1%) |
| 35 to 44 Years | 12 (5.3%) | 12 (5.0%) |
| 45 to 54 Years | 6 (4.9%) | 2 (0.9%) |
| 55 to 64 Years | 5 (3.8%) | 4 (3.1%) |
| 65 to 74 Years | 5 (6.8%) | 18 (14.0%) |
| 75 Years and over | 17 (20.5%) | 10 (18.9%) |
| Total | 178 (12.5%) | 221 (13.0%) |
Income Above Poverty by Sex and Age in Pottsville
According to the poverty statistics in Pottsville, males aged 5 years and females aged 45 to 54 years are the age groups that are most secure financially, with 100.0% of males and 99.1% of females in these age groups living above the poverty line.
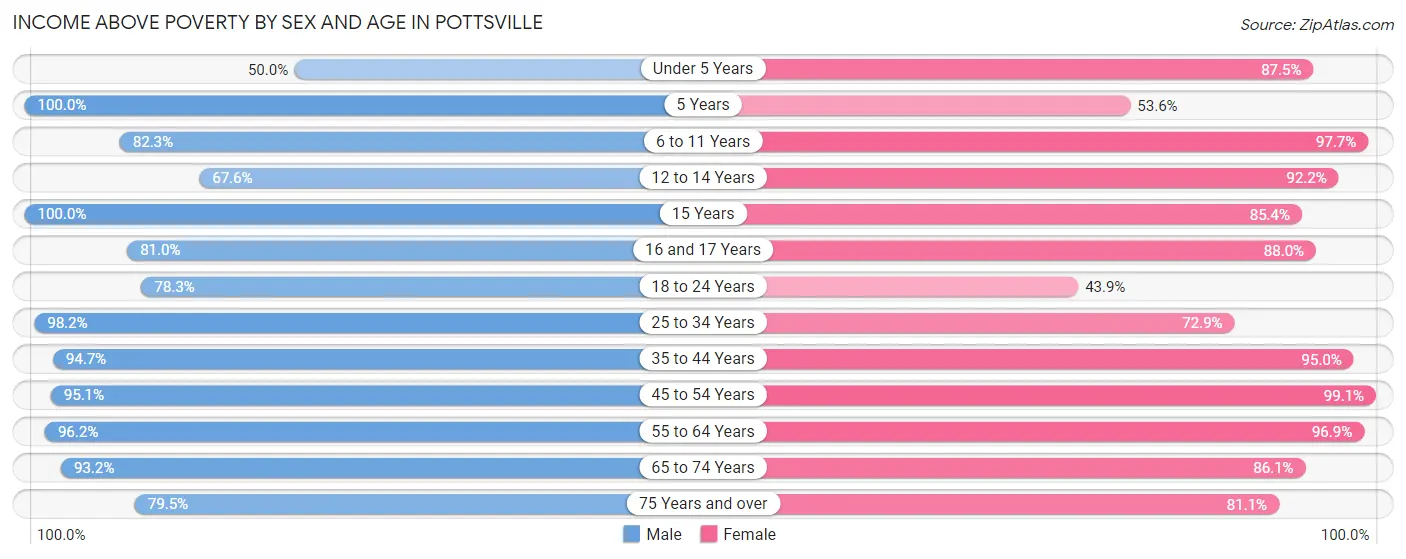
| Age Bracket | Male | Female |
| Under 5 Years | 45 (50.0%) | 91 (87.5%) |
| 5 Years | 7 (100.0%) | 15 (53.6%) |
| 6 to 11 Years | 107 (82.3%) | 251 (97.7%) |
| 12 to 14 Years | 25 (67.6%) | 71 (92.2%) |
| 15 Years | 19 (100.0%) | 35 (85.4%) |
| 16 and 17 Years | 51 (80.9%) | 44 (88.0%) |
| 18 to 24 Years | 130 (78.3%) | 43 (43.9%) |
| 25 to 34 Years | 271 (98.2%) | 188 (72.9%) |
| 35 to 44 Years | 216 (94.7%) | 228 (95.0%) |
| 45 to 54 Years | 117 (95.1%) | 229 (99.1%) |
| 55 to 64 Years | 127 (96.2%) | 126 (96.9%) |
| 65 to 74 Years | 69 (93.2%) | 111 (86.1%) |
| 75 Years and over | 66 (79.5%) | 43 (81.1%) |
| Total | 1,250 (87.5%) | 1,475 (87.0%) |
Income Below Poverty Among Married-Couple Families in Pottsville
The poverty statistics for married-couple families in Pottsville show that 5.8% or 37 of the total 644 families live below the poverty line. Families with 5 or more children have the highest poverty rate of 46.2%, comprising of 6 families. On the other hand, families with 3 or 4 children have the lowest poverty rate of 2.9%, which includes 2 families.
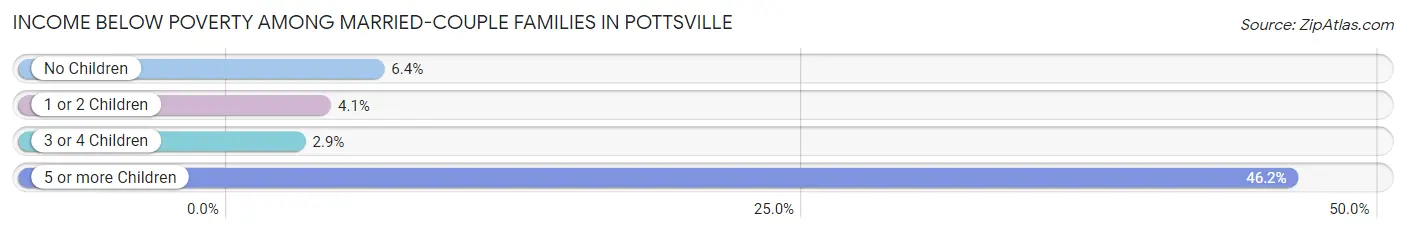
| Children | Above Poverty | Below Poverty |
| No Children | 250 (93.6%) | 17 (6.4%) |
| 1 or 2 Children | 284 (96.0%) | 12 (4.1%) |
| 3 or 4 Children | 66 (97.1%) | 2 (2.9%) |
| 5 or more Children | 7 (53.8%) | 6 (46.2%) |
| Total | 607 (94.3%) | 37 (5.8%) |
Income Below Poverty Among Single-Parent Households in Pottsville
According to the poverty data in Pottsville, 9.6% or 5 single-father households and 14.9% or 42 single-mother households are living below the poverty line. Among single-father households, those with 1 or 2 children have the highest poverty rate, with 5 households (21.7%) experiencing poverty. Likewise, among single-mother households, those with 3 or 4 children have the highest poverty rate, with 26 households (89.7%) falling below the poverty line.
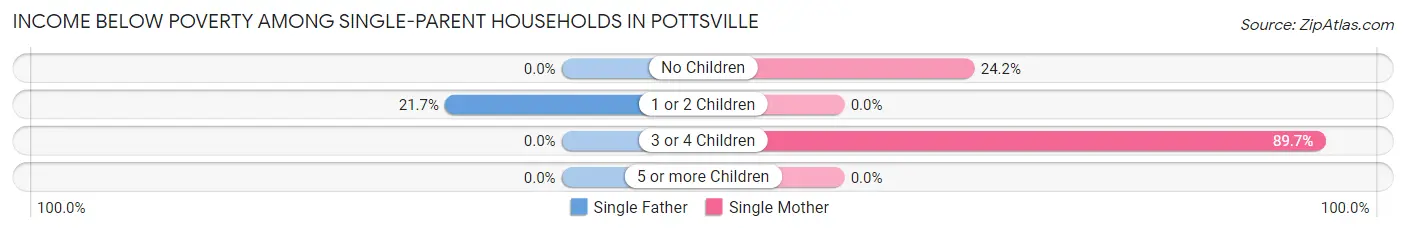
| Children | Single Father | Single Mother |
| No Children | 0 (0.0%) | 16 (24.2%) |
| 1 or 2 Children | 5 (21.7%) | 0 (0.0%) |
| 3 or 4 Children | 0 (0.0%) | 26 (89.7%) |
| 5 or more Children | 0 (0.0%) | 0 (0.0%) |
| Total | 5 (9.6%) | 42 (14.9%) |
Income Below Poverty Among Married-Couple vs Single-Parent Households in Pottsville
The poverty data for Pottsville shows that 37 of the married-couple family households (5.8%) and 47 of the single-parent households (14.1%) are living below the poverty level. Within the married-couple family households, those with 5 or more children have the highest poverty rate, with 6 households (46.2%) falling below the poverty line. Among the single-parent households, those with 3 or 4 children have the highest poverty rate, with 26 household (89.7%) living below poverty.
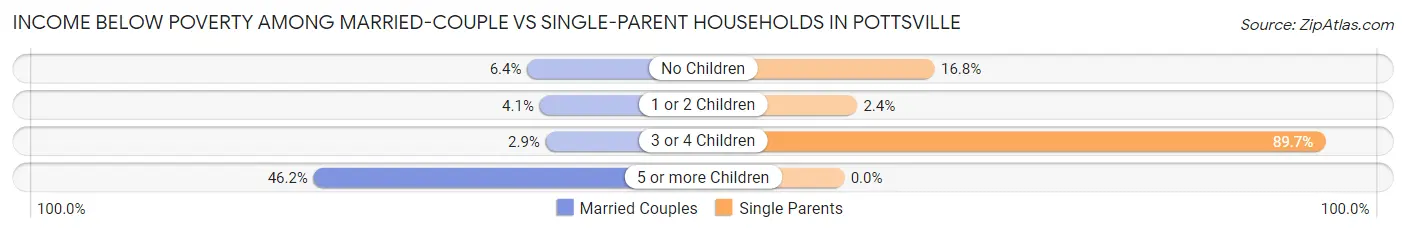
| Children | Married-Couple Families | Single-Parent Households |
| No Children | 17 (6.4%) | 16 (16.8%) |
| 1 or 2 Children | 12 (4.1%) | 5 (2.4%) |
| 3 or 4 Children | 2 (2.9%) | 26 (89.7%) |
| 5 or more Children | 6 (46.2%) | 0 (0.0%) |
| Total | 37 (5.8%) | 47 (14.1%) |
Race in Pottsville
The most populous races in Pottsville are White / Caucasian (2,788 | 88.8%), Hispanic or Latino (291 | 9.3%), and Two or more Races (139 | 4.4%).
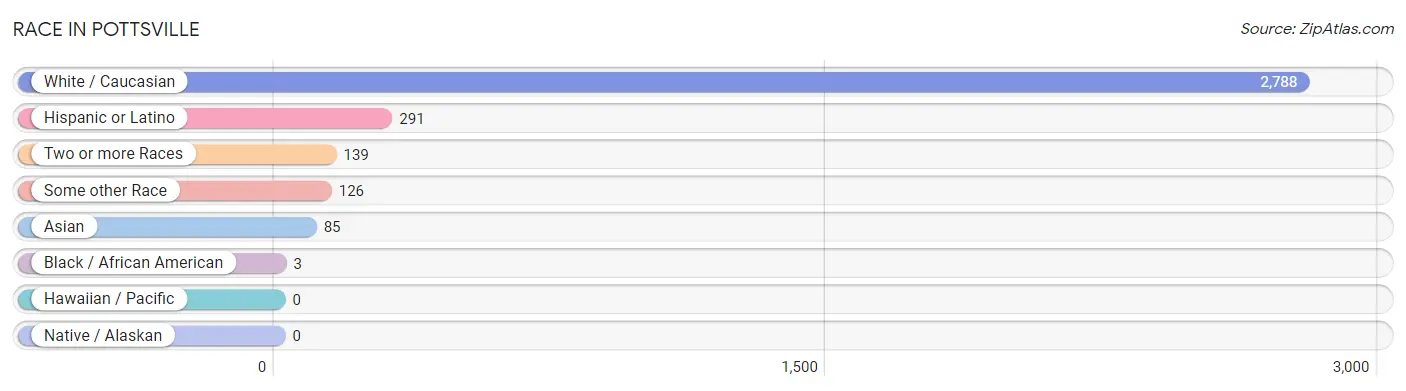
| Race | # Population | % Population |
| Asian | 85 | 2.7% |
| Black / African American | 3 | 0.1% |
| Hawaiian / Pacific | 0 | 0.0% |
| Hispanic or Latino | 291 | 9.3% |
| Native / Alaskan | 0 | 0.0% |
| White / Caucasian | 2,788 | 88.8% |
| Two or more Races | 139 | 4.4% |
| Some other Race | 126 | 4.0% |
| Total | 3,141 | 100.0% |
Ancestry in Pottsville
The most populous ancestries reported in Pottsville are American (876 | 27.9%), Irish (324 | 10.3%), English (253 | 8.1%), Mexican (248 | 7.9%), and German (202 | 6.4%), together accounting for 60.6% of all Pottsville residents.
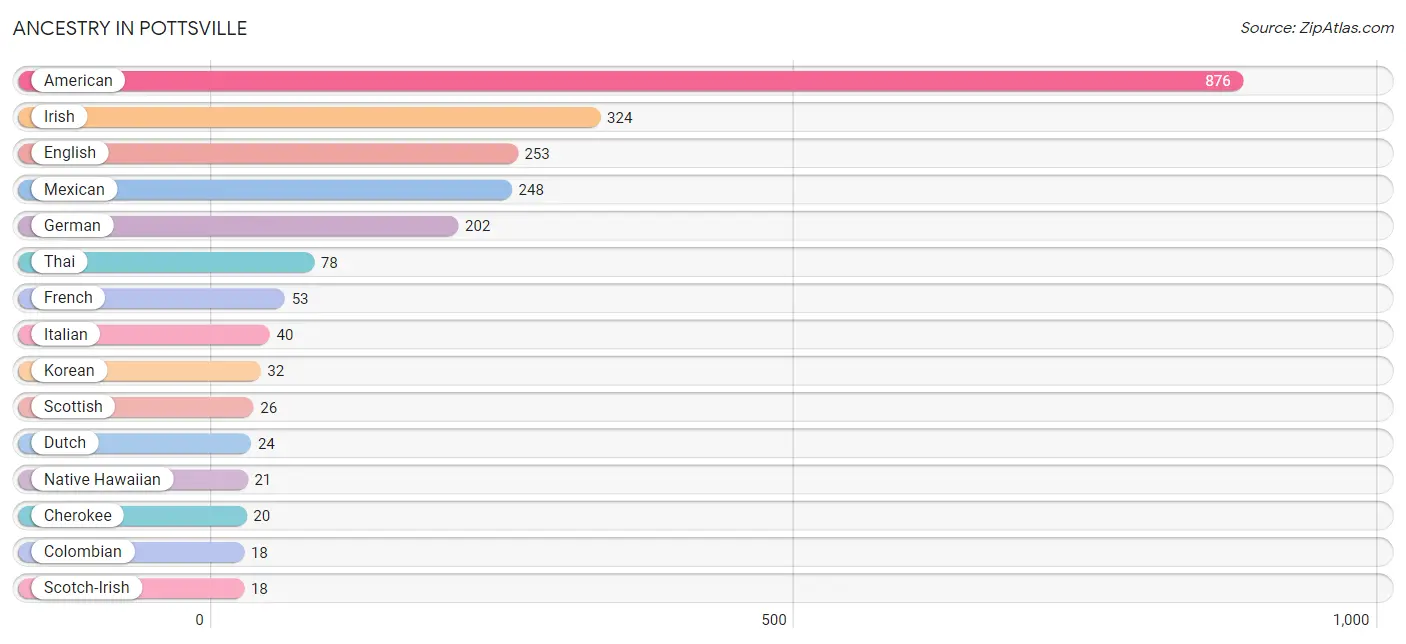
| Ancestry | # Population | % Population |
| American | 876 | 27.9% |
| Belgian | 11 | 0.4% |
| Blackfeet | 8 | 0.3% |
| British | 5 | 0.2% |
| Central American | 15 | 0.5% |
| Cherokee | 20 | 0.6% |
| Colombian | 18 | 0.6% |
| Cuban | 7 | 0.2% |
| Czech | 4 | 0.1% |
| Dutch | 24 | 0.8% |
| English | 253 | 8.1% |
| Filipino | 5 | 0.2% |
| Finnish | 5 | 0.2% |
| French | 53 | 1.7% |
| German | 202 | 6.4% |
| Guatemalan | 6 | 0.2% |
| Irish | 324 | 10.3% |
| Italian | 40 | 1.3% |
| Korean | 32 | 1.0% |
| Malaysian | 2 | 0.1% |
| Mexican | 248 | 7.9% |
| Native Hawaiian | 21 | 0.7% |
| Northern European | 8 | 0.3% |
| Polish | 4 | 0.1% |
| Puerto Rican | 3 | 0.1% |
| Salvadoran | 9 | 0.3% |
| Scotch-Irish | 18 | 0.6% |
| Scottish | 26 | 0.8% |
| South American | 18 | 0.6% |
| Thai | 78 | 2.5% | View All 30 Rows |
Immigrants in Pottsville
The most numerous immigrant groups reported in Pottsville came from Latin America (127 | 4.0%), Central America (109 | 3.5%), Mexico (109 | 3.5%), Asia (40 | 1.3%), and India (33 | 1.1%), together accounting for 13.3% of all Pottsville residents.
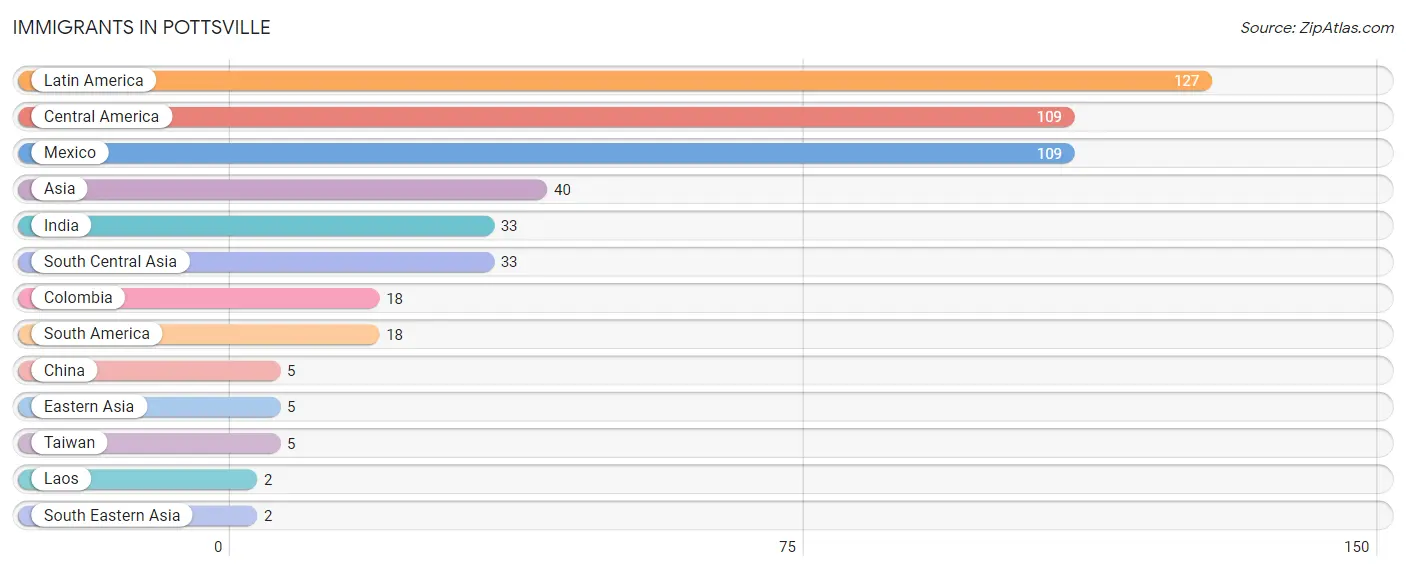
| Immigration Origin | # Population | % Population |
| Asia | 40 | 1.3% |
| Central America | 109 | 3.5% |
| China | 5 | 0.2% |
| Colombia | 18 | 0.6% |
| Eastern Asia | 5 | 0.2% |
| India | 33 | 1.1% |
| Laos | 2 | 0.1% |
| Latin America | 127 | 4.0% |
| Mexico | 109 | 3.5% |
| South America | 18 | 0.6% |
| South Central Asia | 33 | 1.1% |
| South Eastern Asia | 2 | 0.1% |
| Taiwan | 5 | 0.2% | View All 13 Rows |
Sex and Age in Pottsville
Sex and Age in Pottsville
The most populous age groups in Pottsville are 30 to 34 Years (178 | 12.3%) for men and 10 to 14 Years (185 | 10.9%) for women.
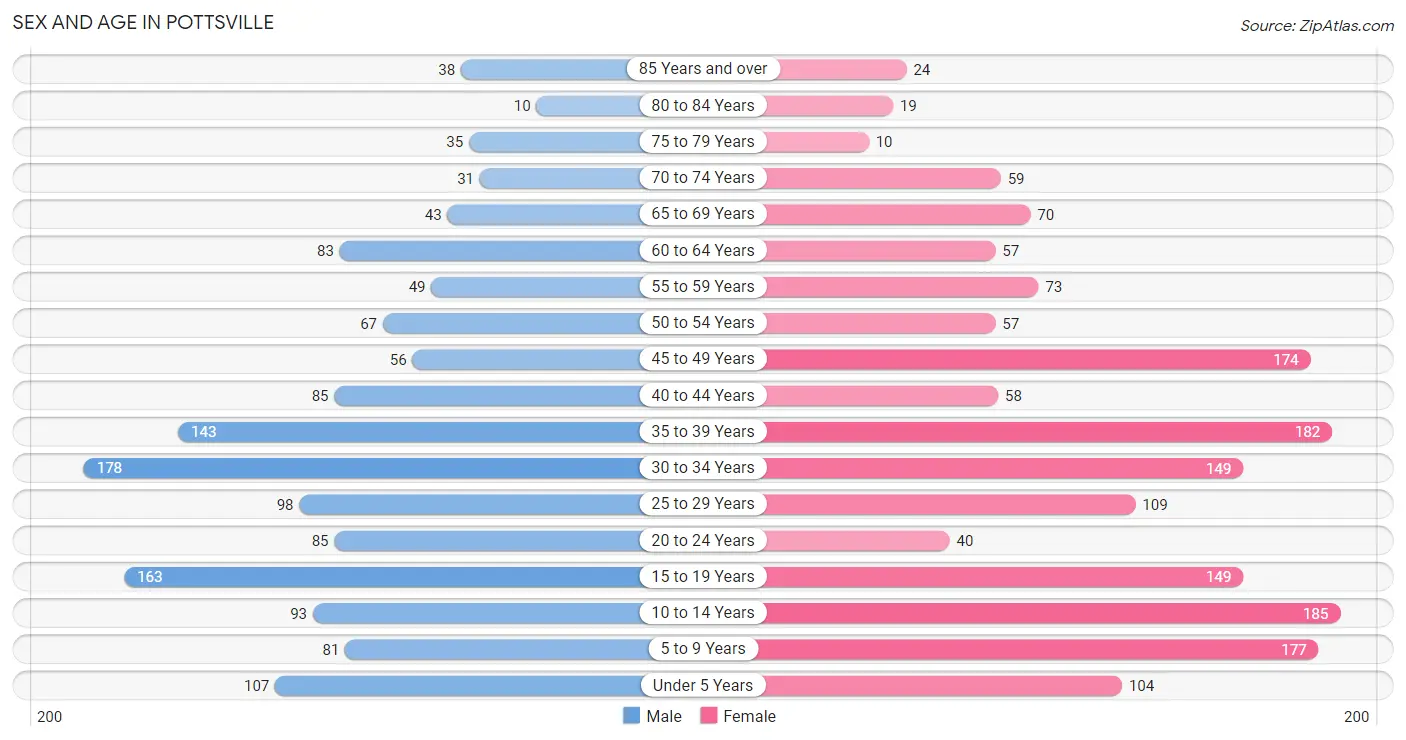
| Age Bracket | Male | Female |
| Under 5 Years | 107 (7.4%) | 104 (6.1%) |
| 5 to 9 Years | 81 (5.6%) | 177 (10.4%) |
| 10 to 14 Years | 93 (6.4%) | 185 (10.9%) |
| 15 to 19 Years | 163 (11.3%) | 149 (8.8%) |
| 20 to 24 Years | 85 (5.9%) | 40 (2.4%) |
| 25 to 29 Years | 98 (6.8%) | 109 (6.4%) |
| 30 to 34 Years | 178 (12.3%) | 149 (8.8%) |
| 35 to 39 Years | 143 (9.9%) | 182 (10.7%) |
| 40 to 44 Years | 85 (5.9%) | 58 (3.4%) |
| 45 to 49 Years | 56 (3.9%) | 174 (10.3%) |
| 50 to 54 Years | 67 (4.6%) | 57 (3.4%) |
| 55 to 59 Years | 49 (3.4%) | 73 (4.3%) |
| 60 to 64 Years | 83 (5.7%) | 57 (3.4%) |
| 65 to 69 Years | 43 (3.0%) | 70 (4.1%) |
| 70 to 74 Years | 31 (2.1%) | 59 (3.5%) |
| 75 to 79 Years | 35 (2.4%) | 10 (0.6%) |
| 80 to 84 Years | 10 (0.7%) | 19 (1.1%) |
| 85 Years and over | 38 (2.6%) | 24 (1.4%) |
| Total | 1,445 (100.0%) | 1,696 (100.0%) |
Families and Households in Pottsville
Median Family Size in Pottsville
The median family size in Pottsville is 2.97 persons per family, with single male/father families (52 | 5.3%) accounting for the largest median family size of 3.08 persons per family. On the other hand, single female/mother families (281 | 28.8%) represent the smallest median family size with 2.87 persons per family.
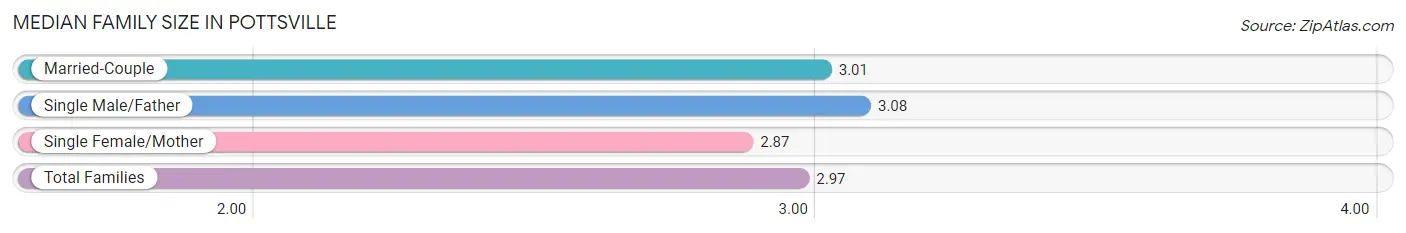
| Family Type | # Families | Family Size |
| Married-Couple | 644 (65.9%) | 3.01 |
| Single Male/Father | 52 (5.3%) | 3.08 |
| Single Female/Mother | 281 (28.8%) | 2.87 |
| Total Families | 977 (100.0%) | 2.97 |
Median Household Size in Pottsville
The median household size in Pottsville is 2.83 persons per household, with single male/father households (52 | 4.7%) accounting for the largest median household size of 3.15 persons per household. non-family households (131 | 11.8%) represent the smallest median household size with 1.21 persons per household.
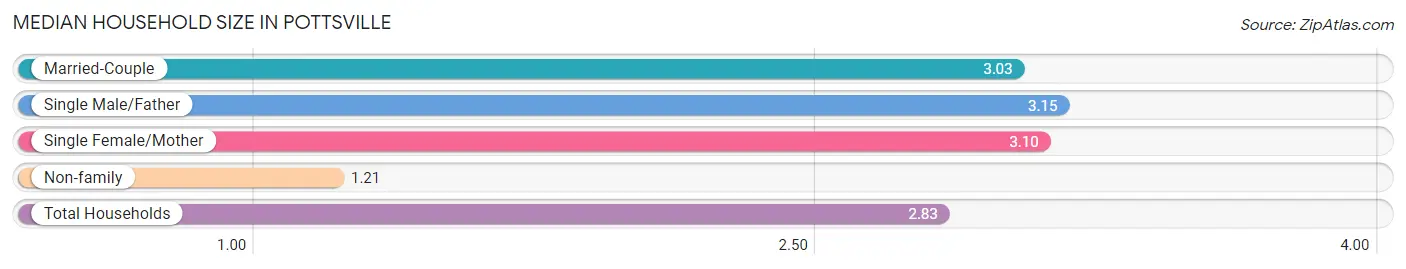
| Household Type | # Households | Household Size |
| Married-Couple | 644 (58.1%) | 3.03 |
| Single Male/Father | 52 (4.7%) | 3.15 |
| Single Female/Mother | 281 (25.4%) | 3.10 |
| Non-family | 131 (11.8%) | 1.21 |
| Total Households | 1,108 (100.0%) | 2.83 |
Household Size by Marriage Status in Pottsville
Out of a total of 1,108 households in Pottsville, 977 (88.2%) are family households, while 131 (11.8%) are nonfamily households. The most numerous type of family households are 2-person households, comprising 392, and the most common type of nonfamily households are 1-person households, comprising 113.
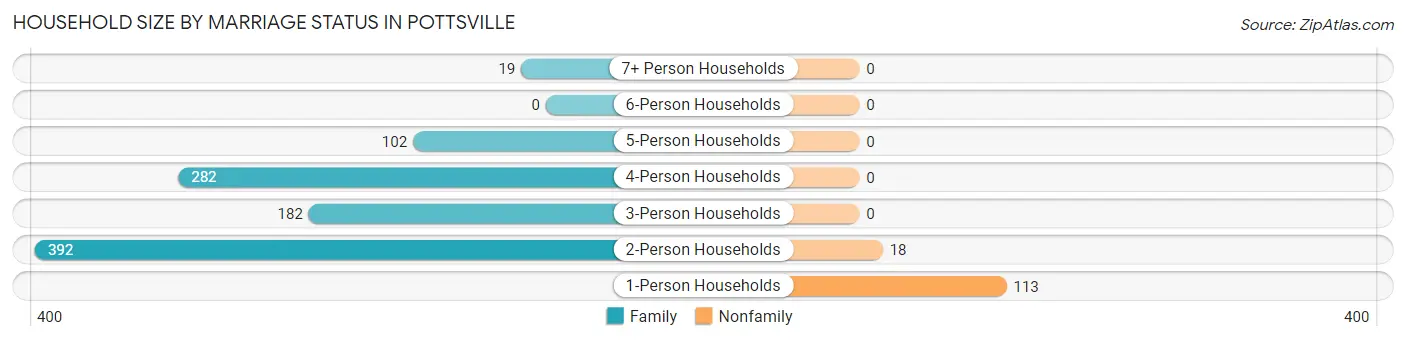
| Household Size | Family Households | Nonfamily Households |
| 1-Person Households | - | 113 (10.2%) |
| 2-Person Households | 392 (35.4%) | 18 (1.6%) |
| 3-Person Households | 182 (16.4%) | 0 (0.0%) |
| 4-Person Households | 282 (25.5%) | 0 (0.0%) |
| 5-Person Households | 102 (9.2%) | 0 (0.0%) |
| 6-Person Households | 0 (0.0%) | 0 (0.0%) |
| 7+ Person Households | 19 (1.7%) | 0 (0.0%) |
| Total | 977 (88.2%) | 131 (11.8%) |
Female Fertility in Pottsville
Fertility by Age in Pottsville
Average fertility rate in Pottsville is 34.0 births per 1,000 women. Women in the age bracket of 20 to 34 years have the highest fertility rate with 91.0 births per 1,000 women. Women in the age bracket of 20 to 34 years acount for 90.0% of all women with births.
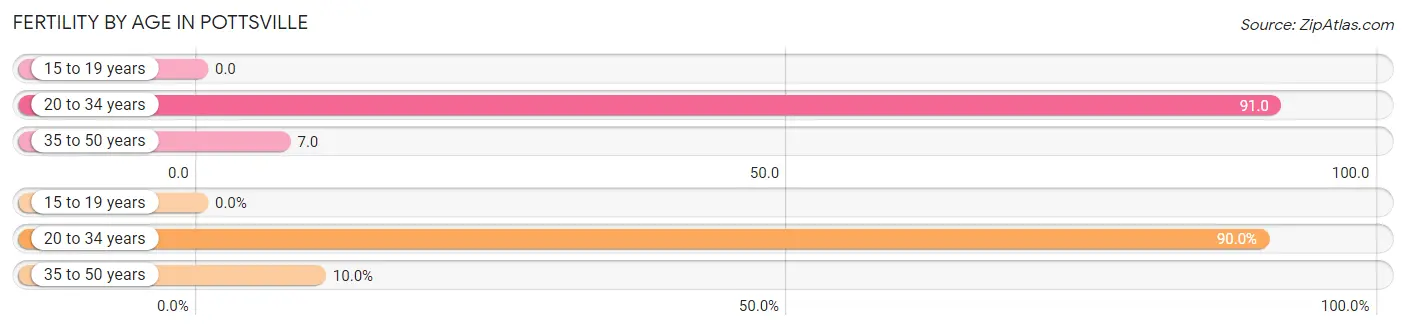
| Age Bracket | Women with Births | Births / 1,000 Women |
| 15 to 19 years | 0 (0.0%) | 0.0 |
| 20 to 34 years | 27 (90.0%) | 91.0 |
| 35 to 50 years | 3 (10.0%) | 7.0 |
| Total | 30 (100.0%) | 34.0 |
Fertility by Age by Marriage Status in Pottsville
10.0% of women with births (30) in Pottsville are married. The highest percentage of unmarried women with births falls into 20 to 34 years age bracket with 100.0% of them unmarried at the time of birth, while the lowest percentage of unmarried women with births belong to 35 to 50 years age bracket with 0.0% of them unmarried.
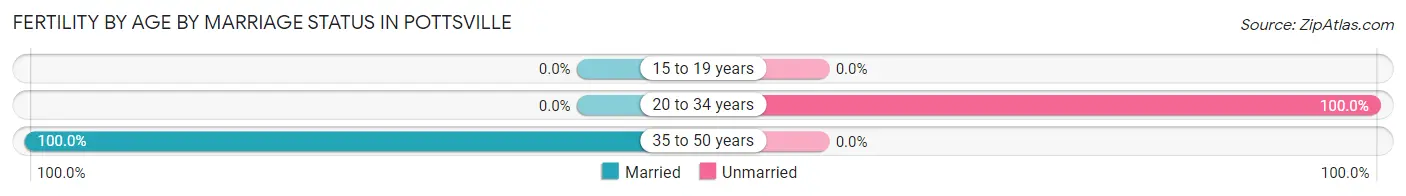
| Age Bracket | Married | Unmarried |
| 15 to 19 years | 0 (0.0%) | 0 (0.0%) |
| 20 to 34 years | 0 (0.0%) | 27 (100.0%) |
| 35 to 50 years | 3 (100.0%) | 0 (0.0%) |
| Total | 3 (10.0%) | 27 (90.0%) |
Fertility by Education in Pottsville
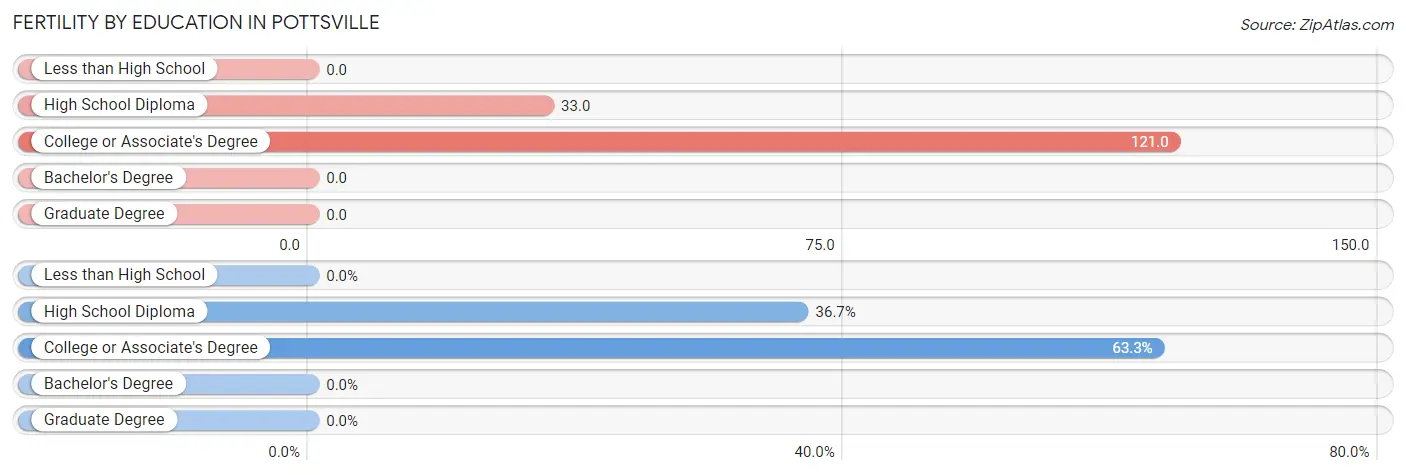
| Educational Attainment | Women with Births | Births / 1,000 Women |
| Less than High School | 0 (0.0%) | 0.0 |
| High School Diploma | 11 (36.7%) | 33.0 |
| College or Associate's Degree | 19 (63.3%) | 121.0 |
| Bachelor's Degree | 0 (0.0%) | 0.0 |
| Graduate Degree | 0 (0.0%) | 0.0 |
| Total | 30 (100.0%) | 34.0 |
Fertility by Education by Marriage Status in Pottsville
90.0% of women with births in Pottsville are unmarried. Women with the educational attainment of high school diploma are most likely to be married with 27.3% of them married at childbirth, while women with the educational attainment of college or associate's degree are least likely to be married with 100.0% of them unmarried at childbirth.
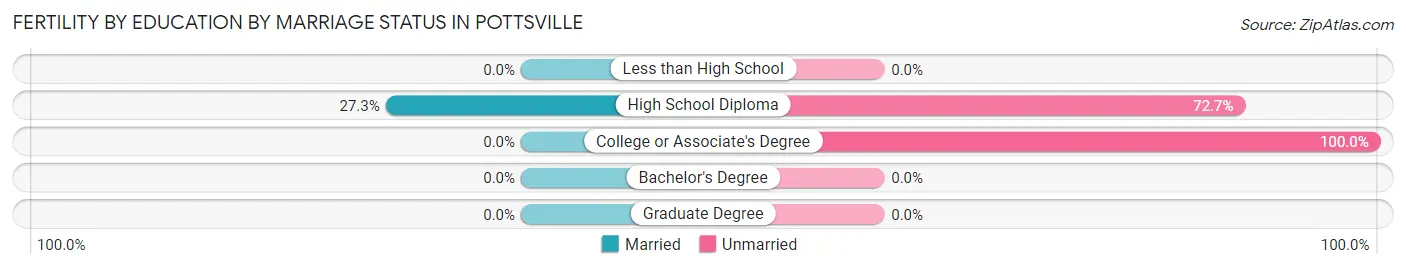
| Educational Attainment | Married | Unmarried |
| Less than High School | 0 (0.0%) | 0 (0.0%) |
| High School Diploma | 3 (27.3%) | 8 (72.7%) |
| College or Associate's Degree | 0 (0.0%) | 19 (100.0%) |
| Bachelor's Degree | 0 (0.0%) | 0 (0.0%) |
| Graduate Degree | 0 (0.0%) | 0 (0.0%) |
| Total | 3 (10.0%) | 27 (90.0%) |
Employment Characteristics in Pottsville
Employment by Class of Employer in Pottsville
Among the 1,499 employed individuals in Pottsville, private company employees (1,121 | 74.8%), local government employees (125 | 8.3%), and state government employees (95 | 6.3%) make up the most common classes of employment.
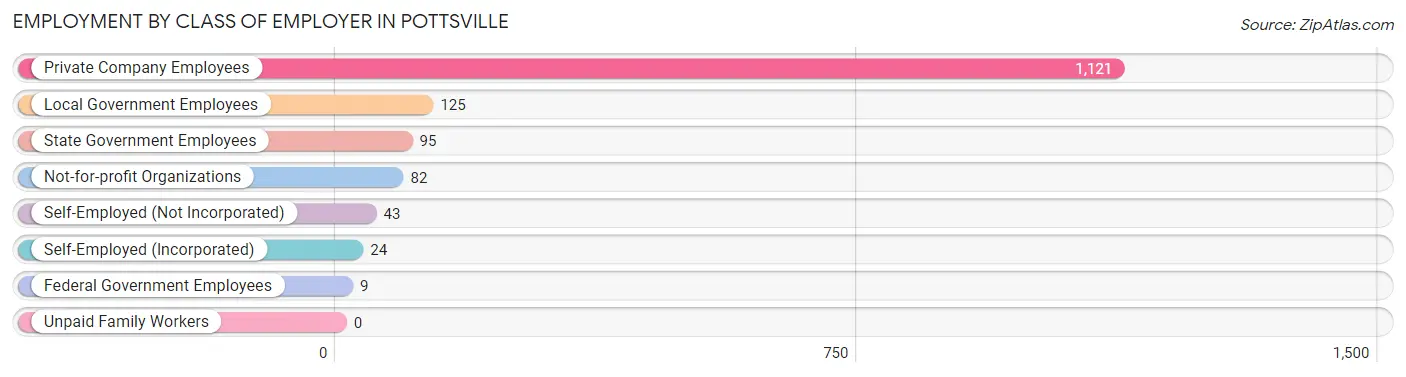
| Employer Class | # Employees | % Employees |
| Private Company Employees | 1,121 | 74.8% |
| Self-Employed (Incorporated) | 24 | 1.6% |
| Self-Employed (Not Incorporated) | 43 | 2.9% |
| Not-for-profit Organizations | 82 | 5.5% |
| Local Government Employees | 125 | 8.3% |
| State Government Employees | 95 | 6.3% |
| Federal Government Employees | 9 | 0.6% |
| Unpaid Family Workers | 0 | 0.0% |
| Total | 1,499 | 100.0% |
Employment Status by Age in Pottsville
According to the labor force statistics for Pottsville, out of the total population over 16 years of age (2,334), 66.6% or 1,554 individuals are in the labor force, with 1.4% or 22 of them unemployed. The age group with the highest labor force participation rate is 35 to 44 years, with 87.4% or 409 individuals in the labor force. Within the labor force, the 65 to 74 years age range has the highest percentage of unemployed individuals, with 18.2% or 4 of them being unemployed.
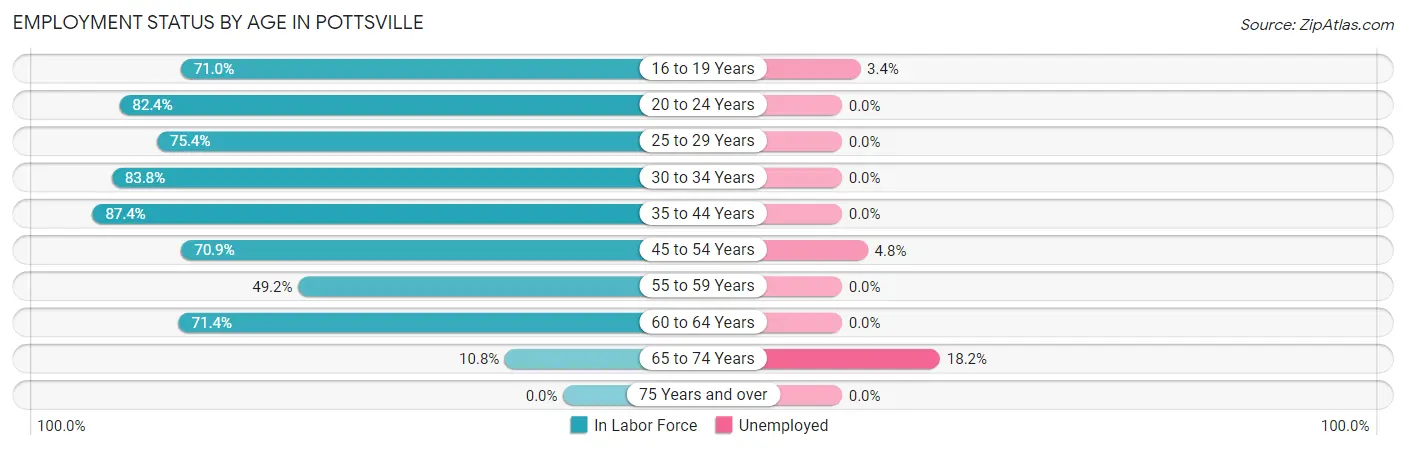
| Age Bracket | In Labor Force | Unemployed |
| 16 to 19 Years | 179 (71.0%) | 6 (3.4%) |
| 20 to 24 Years | 103 (82.4%) | 0 (0.0%) |
| 25 to 29 Years | 156 (75.4%) | 0 (0.0%) |
| 30 to 34 Years | 274 (83.8%) | 0 (0.0%) |
| 35 to 44 Years | 409 (87.4%) | 0 (0.0%) |
| 45 to 54 Years | 251 (70.9%) | 12 (4.8%) |
| 55 to 59 Years | 60 (49.2%) | 0 (0.0%) |
| 60 to 64 Years | 100 (71.4%) | 0 (0.0%) |
| 65 to 74 Years | 22 (10.8%) | 4 (18.2%) |
| 75 Years and over | 0 (0.0%) | 0 (0.0%) |
| Total | 1,554 (66.6%) | 22 (1.4%) |
Employment Status by Educational Attainment in Pottsville
According to labor force statistics for Pottsville, 77.3% of individuals (1,251) out of the total population between 25 and 64 years of age (1,618) are in the labor force, with 1.0% or 13 of them being unemployed. The group with the highest labor force participation rate are those with the educational attainment of bachelor's degree or higher, with 92.7% or 344 individuals in the labor force. Within the labor force, individuals with college / associate degree education have the highest percentage of unemployment, with 2.8% or 12 of them being unemployed.
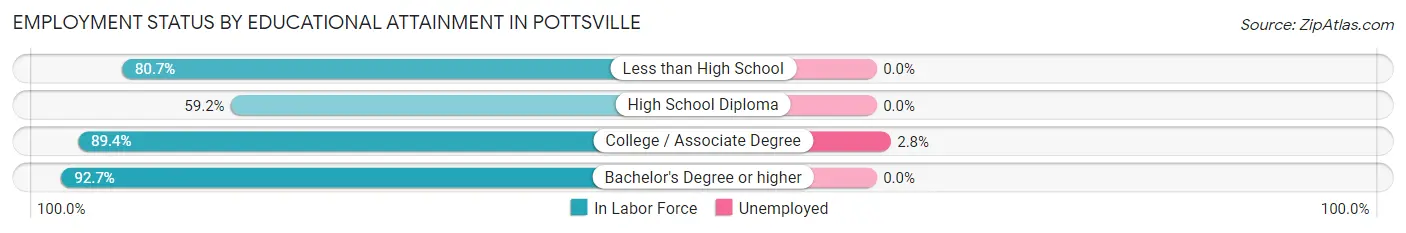
| Educational Attainment | In Labor Force | Unemployed |
| Less than High School | 88 (80.7%) | 0 (0.0%) |
| High School Diploma | 390 (59.2%) | 0 (0.0%) |
| College / Associate Degree | 428 (89.4%) | 13 (2.8%) |
| Bachelor's Degree or higher | 344 (92.7%) | 0 (0.0%) |
| Total | 1,251 (77.3%) | 16 (1.0%) |
Employment Occupations by Sex in Pottsville
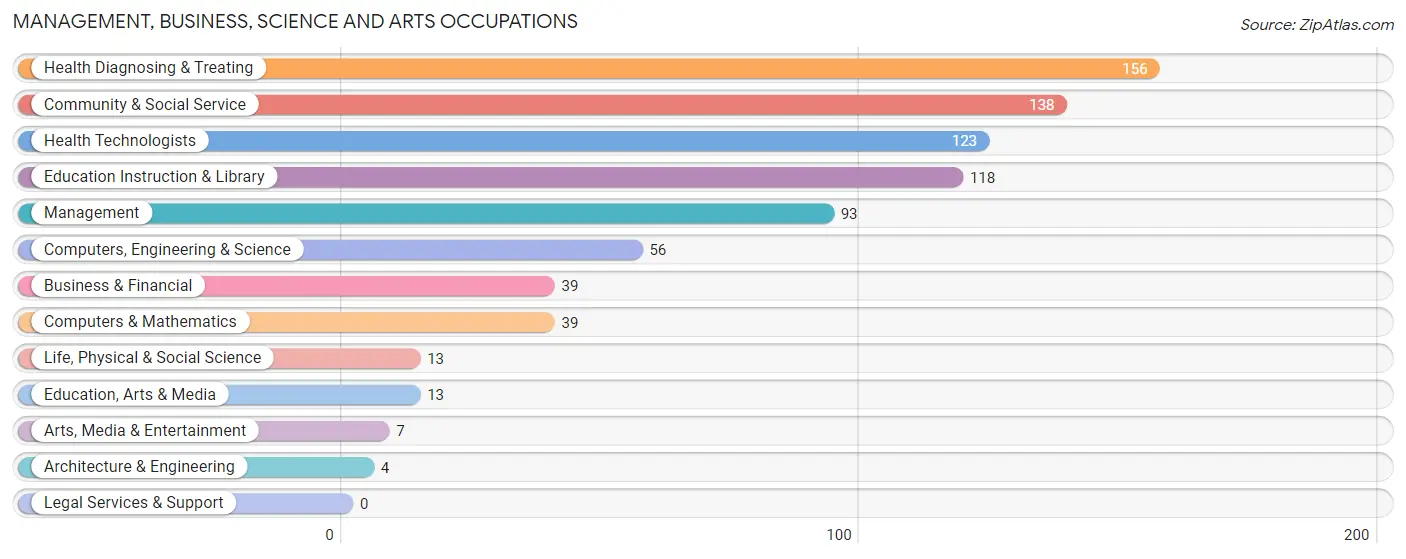
Management, Business, Science and Arts Occupations
The most common Management, Business, Science and Arts occupations in Pottsville are Health Diagnosing & Treating (156 | 10.2%), Community & Social Service (138 | 9.0%), Health Technologists (123 | 8.0%), Education Instruction & Library (118 | 7.7%), and Management (93 | 6.1%).
Management, Business, Science and Arts Occupations by Sex
Within the Management, Business, Science and Arts occupations in Pottsville, the most male-oriented occupations are Architecture & Engineering (100.0%), Life, Physical & Social Science (100.0%), and Computers, Engineering & Science (92.9%), while the most female-oriented occupations are Health Technologists (100.0%), Education Instruction & Library (87.3%), and Health Diagnosing & Treating (86.5%).
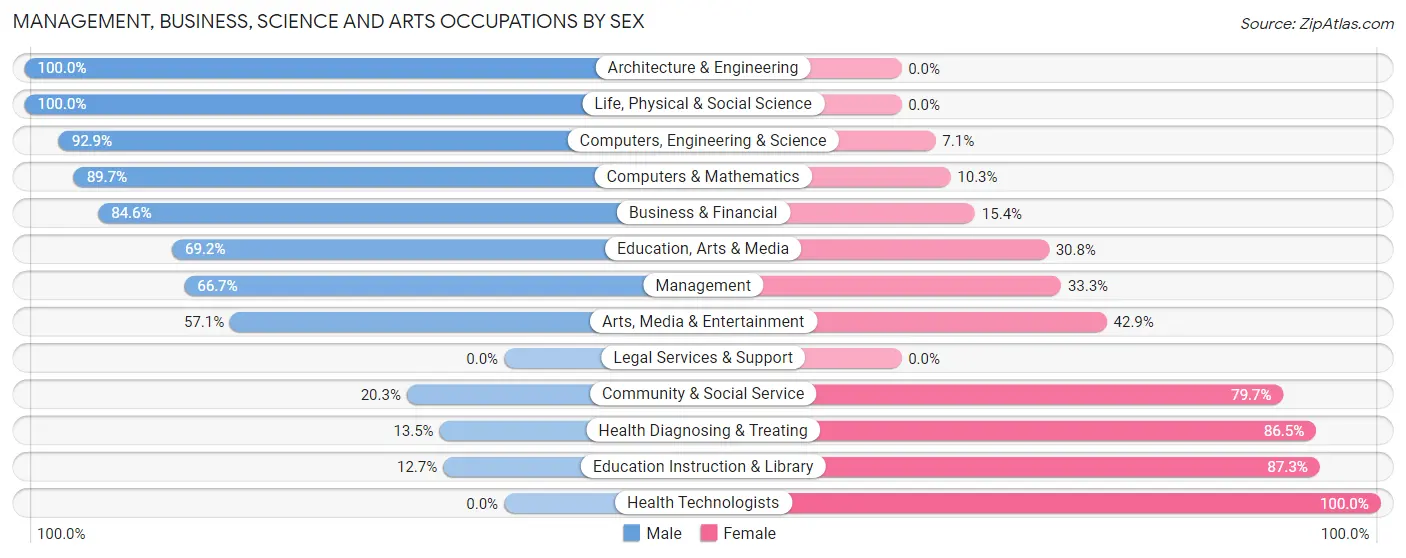
| Occupation | Male | Female |
| Management | 62 (66.7%) | 31 (33.3%) |
| Business & Financial | 33 (84.6%) | 6 (15.4%) |
| Computers, Engineering & Science | 52 (92.9%) | 4 (7.1%) |
| Computers & Mathematics | 35 (89.7%) | 4 (10.3%) |
| Architecture & Engineering | 4 (100.0%) | 0 (0.0%) |
| Life, Physical & Social Science | 13 (100.0%) | 0 (0.0%) |
| Community & Social Service | 28 (20.3%) | 110 (79.7%) |
| Education, Arts & Media | 9 (69.2%) | 4 (30.8%) |
| Legal Services & Support | 0 (0.0%) | 0 (0.0%) |
| Education Instruction & Library | 15 (12.7%) | 103 (87.3%) |
| Arts, Media & Entertainment | 4 (57.1%) | 3 (42.9%) |
| Health Diagnosing & Treating | 21 (13.5%) | 135 (86.5%) |
| Health Technologists | 0 (0.0%) | 123 (100.0%) |
| Total (Category) | 196 (40.7%) | 286 (59.3%) |
| Total (Overall) | 833 (54.4%) | 699 (45.6%) |
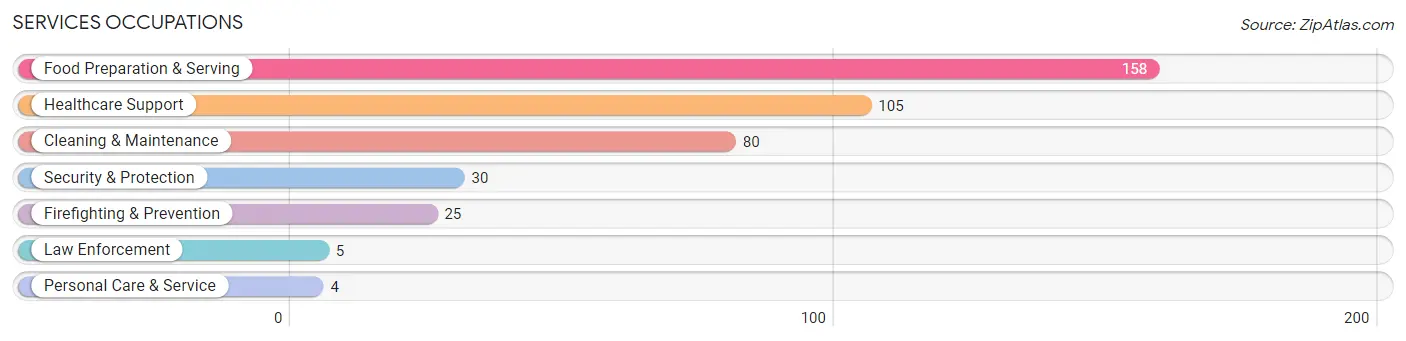
Services Occupations
The most common Services occupations in Pottsville are Food Preparation & Serving (158 | 10.3%), Healthcare Support (105 | 6.9%), Cleaning & Maintenance (80 | 5.2%), Security & Protection (30 | 2.0%), and Firefighting & Prevention (25 | 1.6%).
Services Occupations by Sex
Within the Services occupations in Pottsville, the most male-oriented occupations are Law Enforcement (100.0%), Security & Protection (76.7%), and Firefighting & Prevention (72.0%), while the most female-oriented occupations are Personal Care & Service (100.0%), Food Preparation & Serving (54.4%), and Healthcare Support (46.7%).
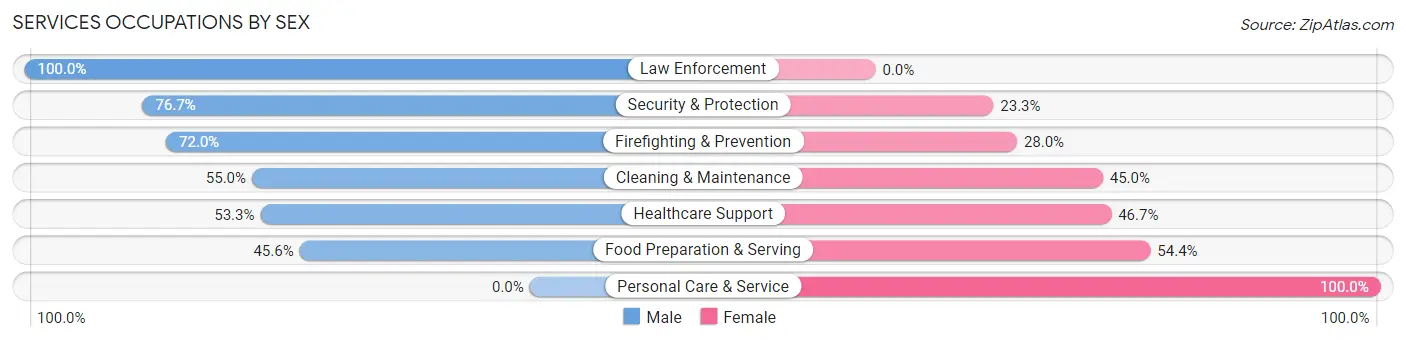
| Occupation | Male | Female |
| Healthcare Support | 56 (53.3%) | 49 (46.7%) |
| Security & Protection | 23 (76.7%) | 7 (23.3%) |
| Firefighting & Prevention | 18 (72.0%) | 7 (28.0%) |
| Law Enforcement | 5 (100.0%) | 0 (0.0%) |
| Food Preparation & Serving | 72 (45.6%) | 86 (54.4%) |
| Cleaning & Maintenance | 44 (55.0%) | 36 (45.0%) |
| Personal Care & Service | 0 (0.0%) | 4 (100.0%) |
| Total (Category) | 195 (51.7%) | 182 (48.3%) |
| Total (Overall) | 833 (54.4%) | 699 (45.6%) |
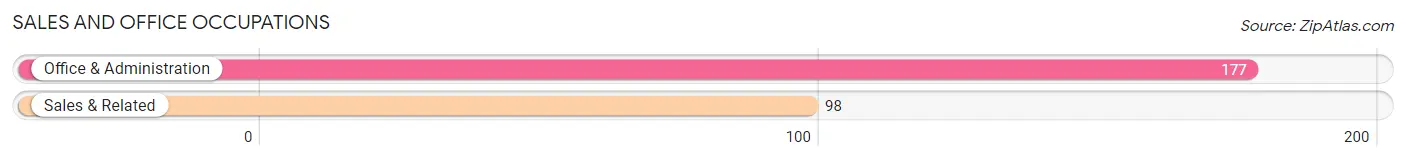
Sales and Office Occupations
The most common Sales and Office occupations in Pottsville are Office & Administration (177 | 11.6%), and Sales & Related (98 | 6.4%).
Sales and Office Occupations by Sex
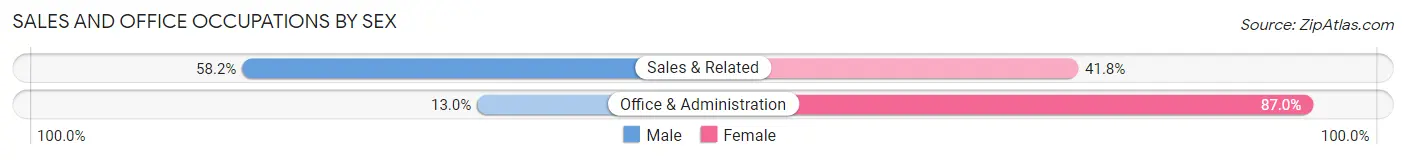
| Occupation | Male | Female |
| Sales & Related | 57 (58.2%) | 41 (41.8%) |
| Office & Administration | 23 (13.0%) | 154 (87.0%) |
| Total (Category) | 80 (29.1%) | 195 (70.9%) |
| Total (Overall) | 833 (54.4%) | 699 (45.6%) |
Natural Resources, Construction and Maintenance Occupations
The most common Natural Resources, Construction and Maintenance occupations in Pottsville are Installation, Maintenance & Repair (61 | 4.0%), Construction & Extraction (28 | 1.8%), and Farming, Fishing & Forestry (7 | 0.5%).
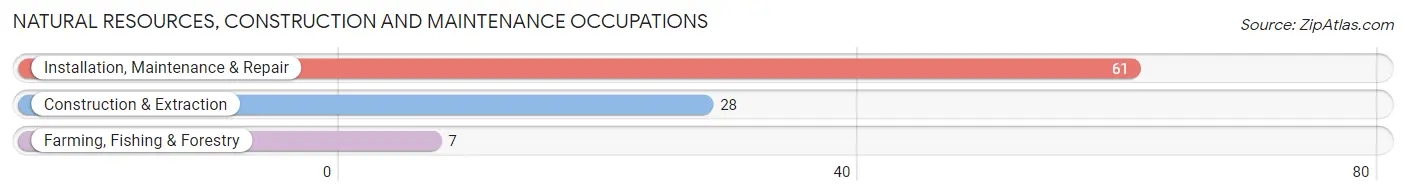
Natural Resources, Construction and Maintenance Occupations by Sex
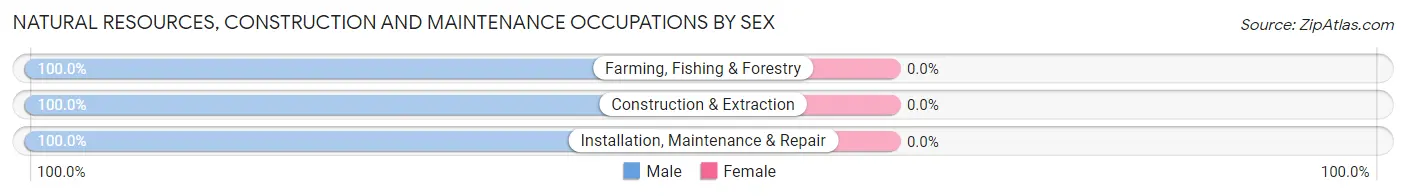
| Occupation | Male | Female |
| Farming, Fishing & Forestry | 7 (100.0%) | 0 (0.0%) |
| Construction & Extraction | 28 (100.0%) | 0 (0.0%) |
| Installation, Maintenance & Repair | 61 (100.0%) | 0 (0.0%) |
| Total (Category) | 96 (100.0%) | 0 (0.0%) |
| Total (Overall) | 833 (54.4%) | 699 (45.6%) |
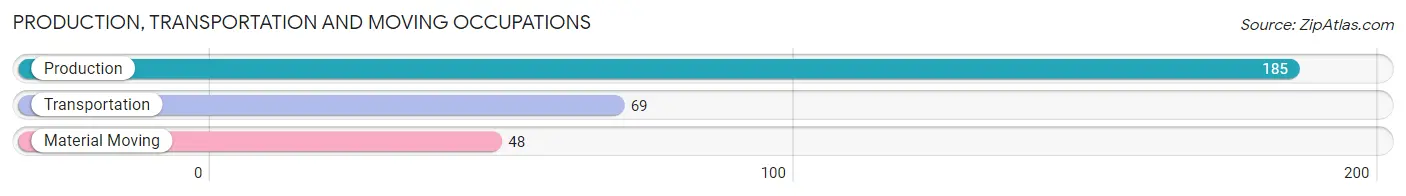
Production, Transportation and Moving Occupations
The most common Production, Transportation and Moving occupations in Pottsville are Production (185 | 12.1%), Transportation (69 | 4.5%), and Material Moving (48 | 3.1%).
Production, Transportation and Moving Occupations by Sex
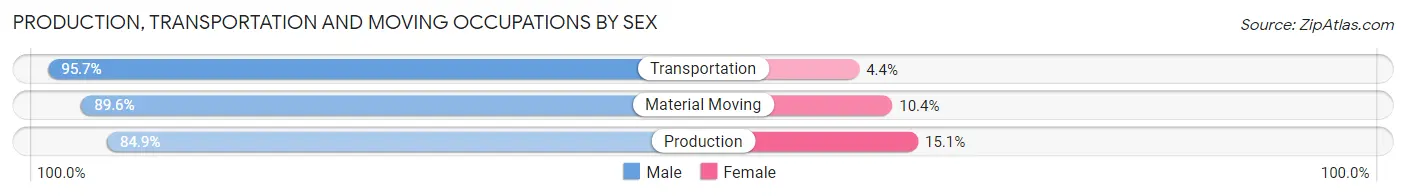
| Occupation | Male | Female |
| Production | 157 (84.9%) | 28 (15.1%) |
| Transportation | 66 (95.7%) | 3 (4.3%) |
| Material Moving | 43 (89.6%) | 5 (10.4%) |
| Total (Category) | 266 (88.1%) | 36 (11.9%) |
| Total (Overall) | 833 (54.4%) | 699 (45.6%) |
Employment Industries by Sex in Pottsville
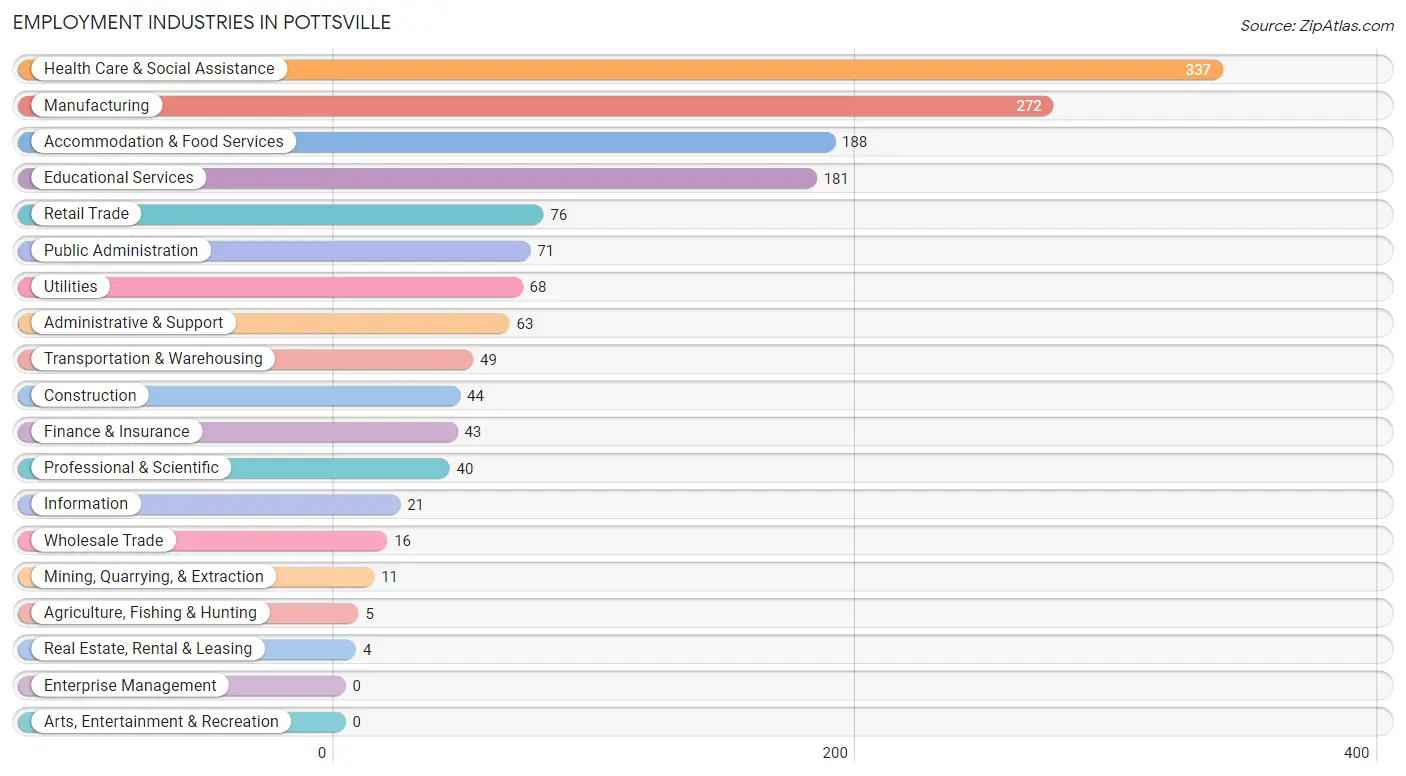
Employment Industries in Pottsville
The major employment industries in Pottsville include Health Care & Social Assistance (337 | 22.0%), Manufacturing (272 | 17.7%), Accommodation & Food Services (188 | 12.3%), Educational Services (181 | 11.8%), and Retail Trade (76 | 5.0%).
Employment Industries by Sex in Pottsville
The Pottsville industries that see more men than women are Agriculture, Fishing & Hunting (100.0%), Mining, Quarrying, & Extraction (100.0%), and Transportation & Warehousing (100.0%), whereas the industries that tend to have a higher number of women are Educational Services (89.5%), Health Care & Social Assistance (68.8%), and Accommodation & Food Services (54.8%).
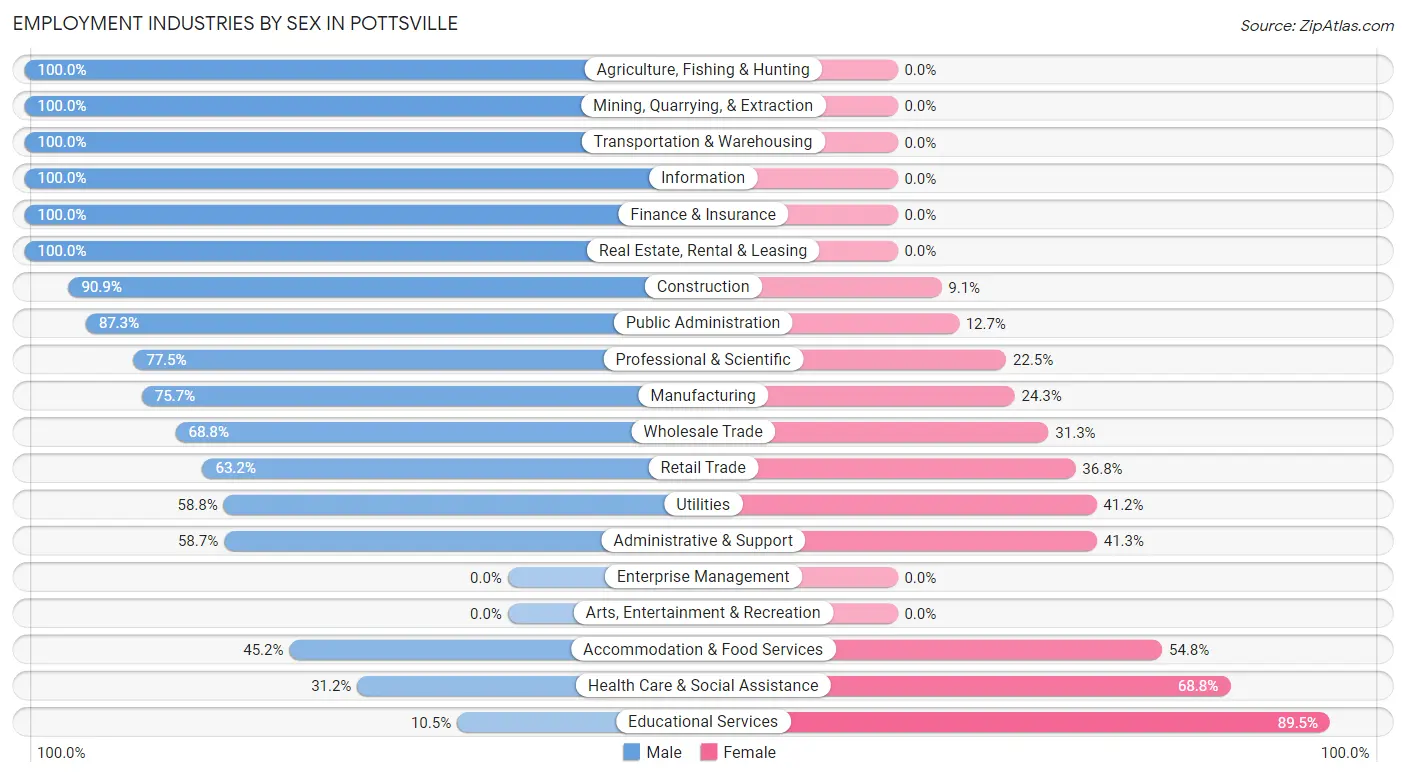
| Industry | Male | Female |
| Agriculture, Fishing & Hunting | 5 (100.0%) | 0 (0.0%) |
| Mining, Quarrying, & Extraction | 11 (100.0%) | 0 (0.0%) |
| Construction | 40 (90.9%) | 4 (9.1%) |
| Manufacturing | 206 (75.7%) | 66 (24.3%) |
| Wholesale Trade | 11 (68.8%) | 5 (31.2%) |
| Retail Trade | 48 (63.2%) | 28 (36.8%) |
| Transportation & Warehousing | 49 (100.0%) | 0 (0.0%) |
| Utilities | 40 (58.8%) | 28 (41.2%) |
| Information | 21 (100.0%) | 0 (0.0%) |
| Finance & Insurance | 43 (100.0%) | 0 (0.0%) |
| Real Estate, Rental & Leasing | 4 (100.0%) | 0 (0.0%) |
| Professional & Scientific | 31 (77.5%) | 9 (22.5%) |
| Enterprise Management | 0 (0.0%) | 0 (0.0%) |
| Administrative & Support | 37 (58.7%) | 26 (41.3%) |
| Educational Services | 19 (10.5%) | 162 (89.5%) |
| Health Care & Social Assistance | 105 (31.2%) | 232 (68.8%) |
| Arts, Entertainment & Recreation | 0 (0.0%) | 0 (0.0%) |
| Accommodation & Food Services | 85 (45.2%) | 103 (54.8%) |
| Public Administration | 62 (87.3%) | 9 (12.7%) |
| Total | 833 (54.4%) | 699 (45.6%) |
Education in Pottsville
School Enrollment in Pottsville
The most common levels of schooling among the 882 students in Pottsville are elementary school (246 | 27.9%), high school (227 | 25.7%), and middle school (195 | 22.1%).
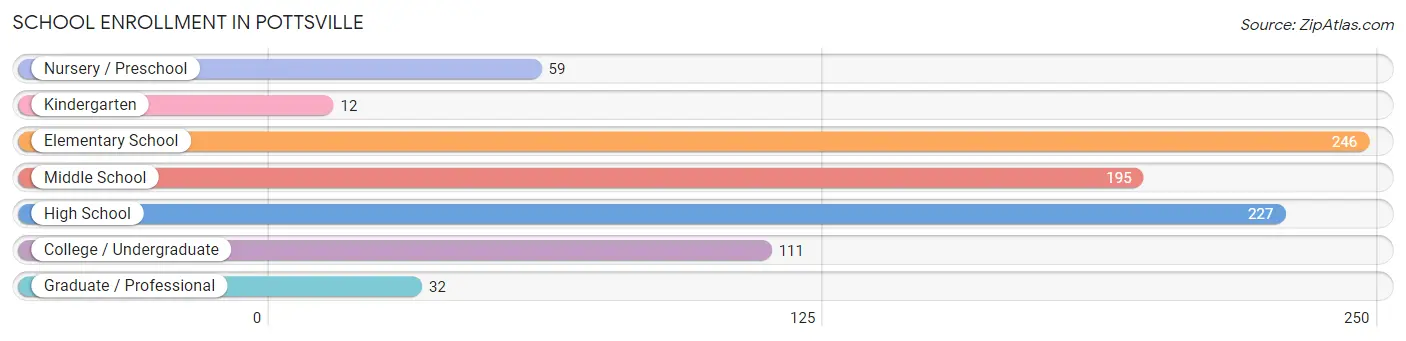
| School Level | # Students | % Students |
| Nursery / Preschool | 59 | 6.7% |
| Kindergarten | 12 | 1.4% |
| Elementary School | 246 | 27.9% |
| Middle School | 195 | 22.1% |
| High School | 227 | 25.7% |
| College / Undergraduate | 111 | 12.6% |
| Graduate / Professional | 32 | 3.6% |
| Total | 882 | 100.0% |
School Enrollment by Age by Funding Source in Pottsville
Out of a total of 882 students who are enrolled in schools in Pottsville, 42 (4.8%) attend a private institution, while the remaining 840 (95.2%) are enrolled in public schools. The age group of 3 to 4 year olds has the highest likelihood of being enrolled in private schools, with 13 (41.9% in the age bracket) enrolled. Conversely, the age group of 18 to 19 year olds has the lowest likelihood of being enrolled in a private school, with 55 (100.0% in the age bracket) attending a public institution.
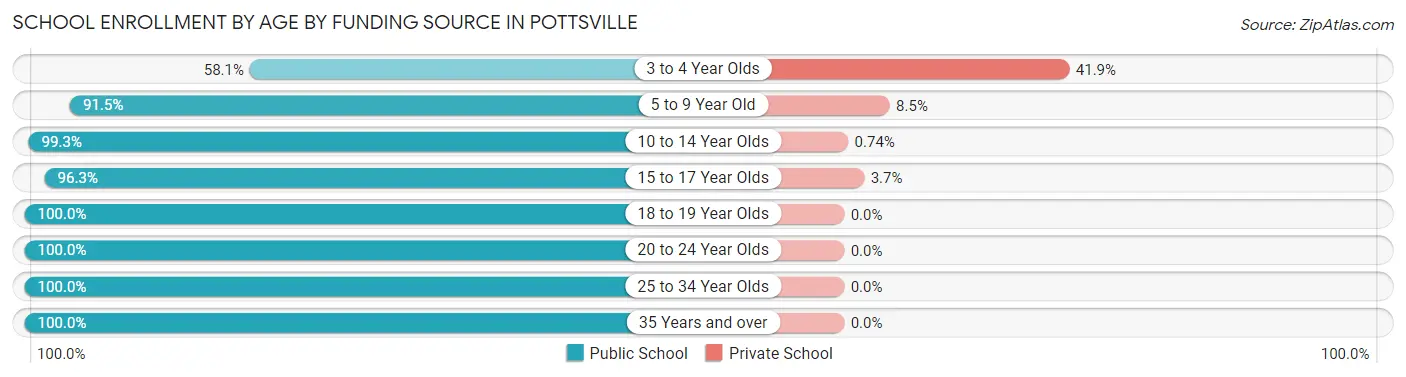
| Age Bracket | Public School | Private School |
| 3 to 4 Year Olds | 18 (58.1%) | 13 (41.9%) |
| 5 to 9 Year Old | 227 (91.5%) | 21 (8.5%) |
| 10 to 14 Year Olds | 269 (99.3%) | 2 (0.7%) |
| 15 to 17 Year Olds | 155 (96.3%) | 6 (3.7%) |
| 18 to 19 Year Olds | 55 (100.0%) | 0 (0.0%) |
| 20 to 24 Year Olds | 55 (100.0%) | 0 (0.0%) |
| 25 to 34 Year Olds | 28 (100.0%) | 0 (0.0%) |
| 35 Years and over | 33 (100.0%) | 0 (0.0%) |
| Total | 840 (95.2%) | 42 (4.8%) |
Educational Attainment by Field of Study in Pottsville
Science & technology (121 | 23.9%), business (83 | 16.4%), education (56 | 11.1%), engineering (54 | 10.6%), and liberal arts & history (52 | 10.3%) are the most common fields of study among 507 individuals in Pottsville who have obtained a bachelor's degree or higher.
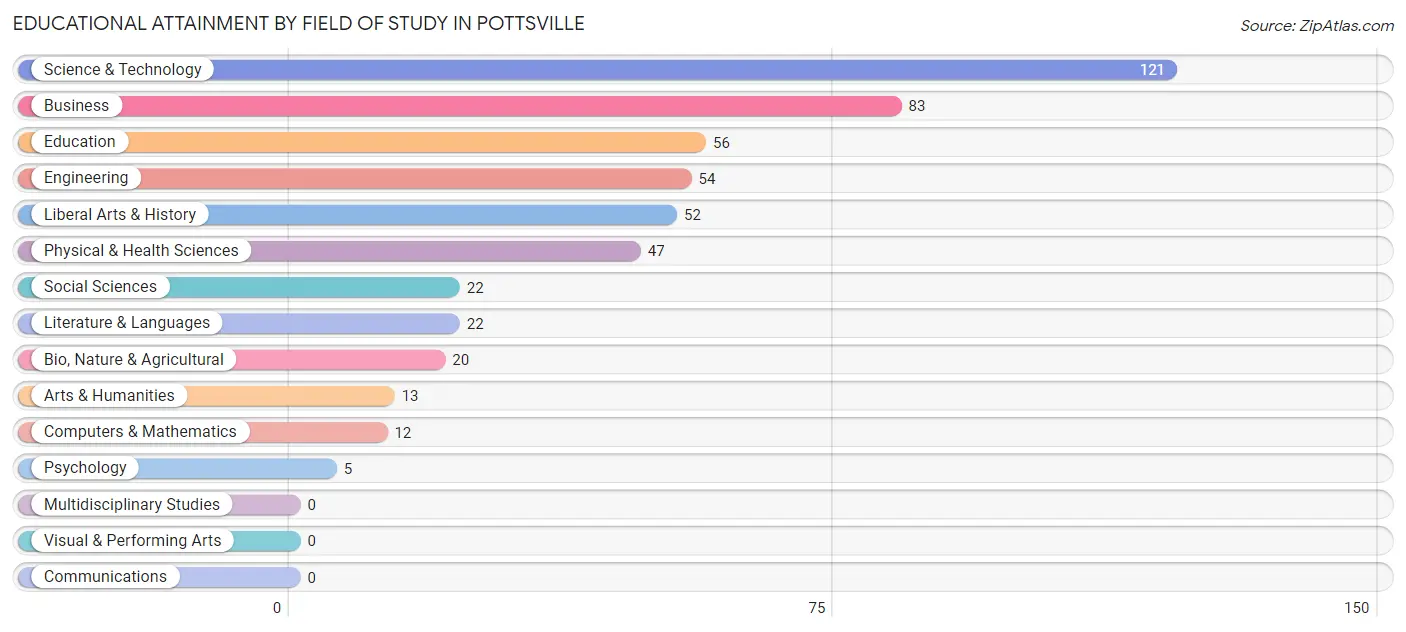
| Field of Study | # Graduates | % Graduates |
| Computers & Mathematics | 12 | 2.4% |
| Bio, Nature & Agricultural | 20 | 3.9% |
| Physical & Health Sciences | 47 | 9.3% |
| Psychology | 5 | 1.0% |
| Social Sciences | 22 | 4.3% |
| Engineering | 54 | 10.6% |
| Multidisciplinary Studies | 0 | 0.0% |
| Science & Technology | 121 | 23.9% |
| Business | 83 | 16.4% |
| Education | 56 | 11.1% |
| Literature & Languages | 22 | 4.3% |
| Liberal Arts & History | 52 | 10.3% |
| Visual & Performing Arts | 0 | 0.0% |
| Communications | 0 | 0.0% |
| Arts & Humanities | 13 | 2.6% |
| Total | 507 | 100.0% |
Transportation & Commute in Pottsville
Vehicle Availability by Sex in Pottsville
The most prevalent vehicle ownership categories in Pottsville are males with 2 vehicles (456, accounting for 55.3%) and females with 2 vehicles (325, making up 67.6%).
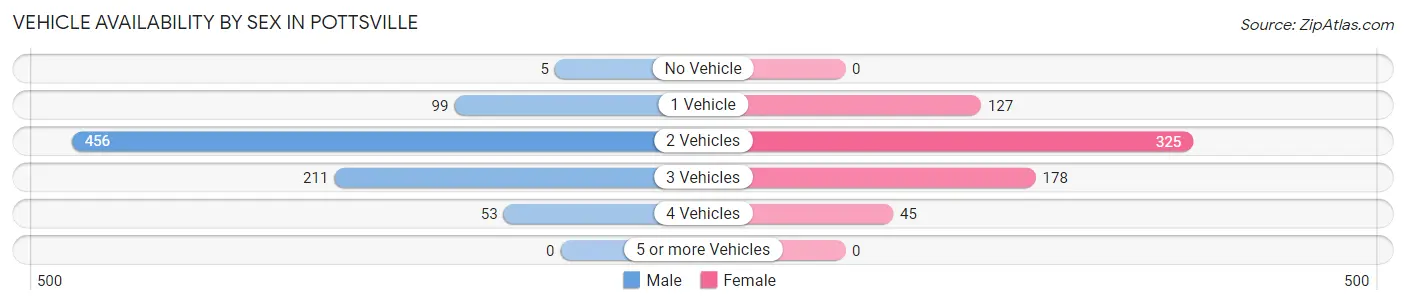
| Vehicles Available | Male | Female |
| No Vehicle | 5 (0.6%) | 0 (0.0%) |
| 1 Vehicle | 99 (12.0%) | 127 (18.8%) |
| 2 Vehicles | 456 (55.3%) | 325 (48.1%) |
| 3 Vehicles | 211 (25.6%) | 178 (26.4%) |
| 4 Vehicles | 53 (6.4%) | 45 (6.7%) |
| 5 or more Vehicles | 0 (0.0%) | 0 (0.0%) |
| Total | 824 (100.0%) | 675 (100.0%) |
Commute Time in Pottsville
The most frequently occuring commute durations in Pottsville are 15 to 19 minutes (399 commuters, 26.9%), 10 to 14 minutes (328 commuters, 22.1%), and 20 to 24 minutes (211 commuters, 14.2%).
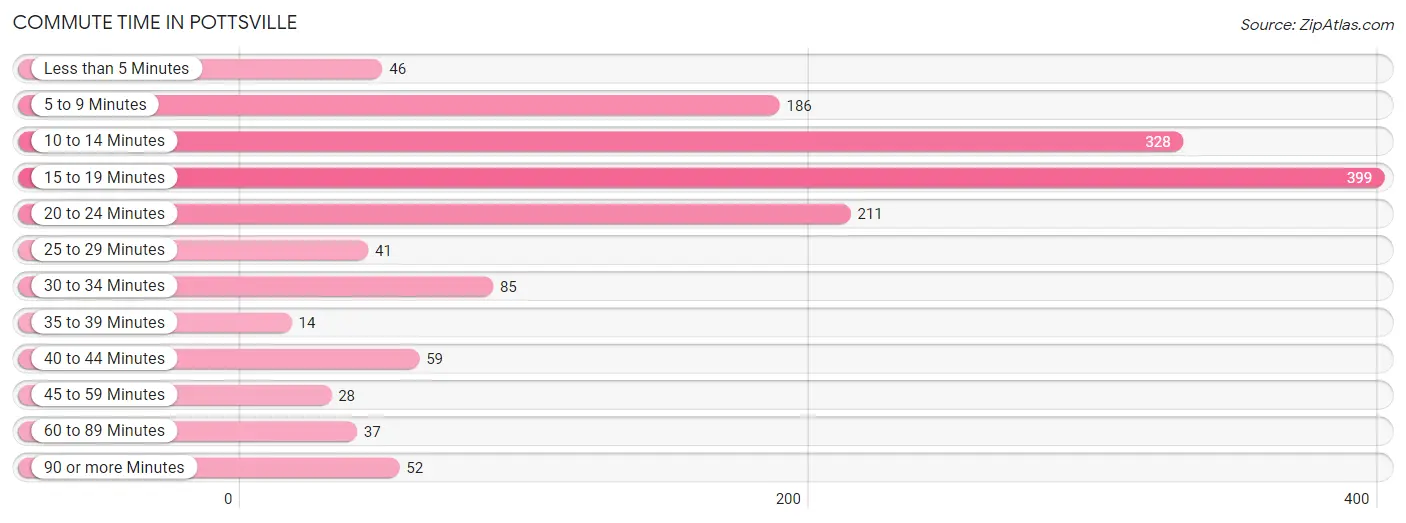
| Commute Time | # Commuters | % Commuters |
| Less than 5 Minutes | 46 | 3.1% |
| 5 to 9 Minutes | 186 | 12.5% |
| 10 to 14 Minutes | 328 | 22.1% |
| 15 to 19 Minutes | 399 | 26.9% |
| 20 to 24 Minutes | 211 | 14.2% |
| 25 to 29 Minutes | 41 | 2.8% |
| 30 to 34 Minutes | 85 | 5.7% |
| 35 to 39 Minutes | 14 | 0.9% |
| 40 to 44 Minutes | 59 | 4.0% |
| 45 to 59 Minutes | 28 | 1.9% |
| 60 to 89 Minutes | 37 | 2.5% |
| 90 or more Minutes | 52 | 3.5% |
Commute Time by Sex in Pottsville
The most common commute times in Pottsville are 15 to 19 minutes (210 commuters, 25.7%) for males and 15 to 19 minutes (189 commuters, 28.2%) for females.
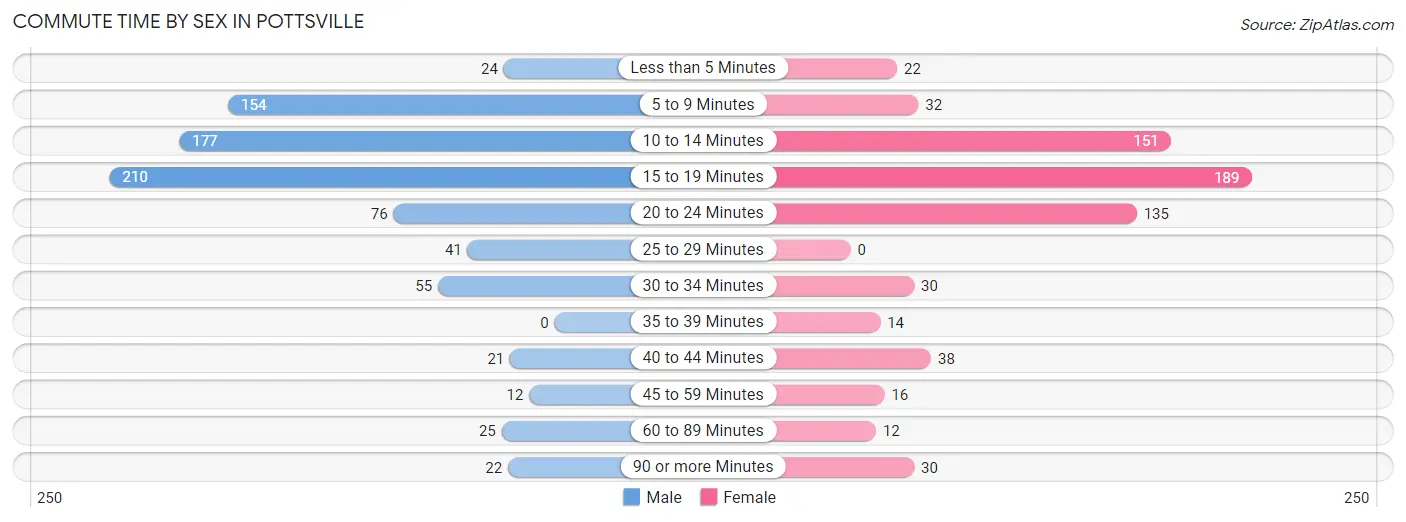
| Commute Time | Male | Female |
| Less than 5 Minutes | 24 (2.9%) | 22 (3.3%) |
| 5 to 9 Minutes | 154 (18.9%) | 32 (4.8%) |
| 10 to 14 Minutes | 177 (21.7%) | 151 (22.6%) |
| 15 to 19 Minutes | 210 (25.7%) | 189 (28.2%) |
| 20 to 24 Minutes | 76 (9.3%) | 135 (20.2%) |
| 25 to 29 Minutes | 41 (5.0%) | 0 (0.0%) |
| 30 to 34 Minutes | 55 (6.7%) | 30 (4.5%) |
| 35 to 39 Minutes | 0 (0.0%) | 14 (2.1%) |
| 40 to 44 Minutes | 21 (2.6%) | 38 (5.7%) |
| 45 to 59 Minutes | 12 (1.5%) | 16 (2.4%) |
| 60 to 89 Minutes | 25 (3.1%) | 12 (1.8%) |
| 90 or more Minutes | 22 (2.7%) | 30 (4.5%) |
Time of Departure to Work by Sex in Pottsville
The most frequent times of departure to work in Pottsville are 7:30 AM to 7:59 AM (157, 19.2%) for males and 7:00 AM to 7:29 AM (122, 18.2%) for females.
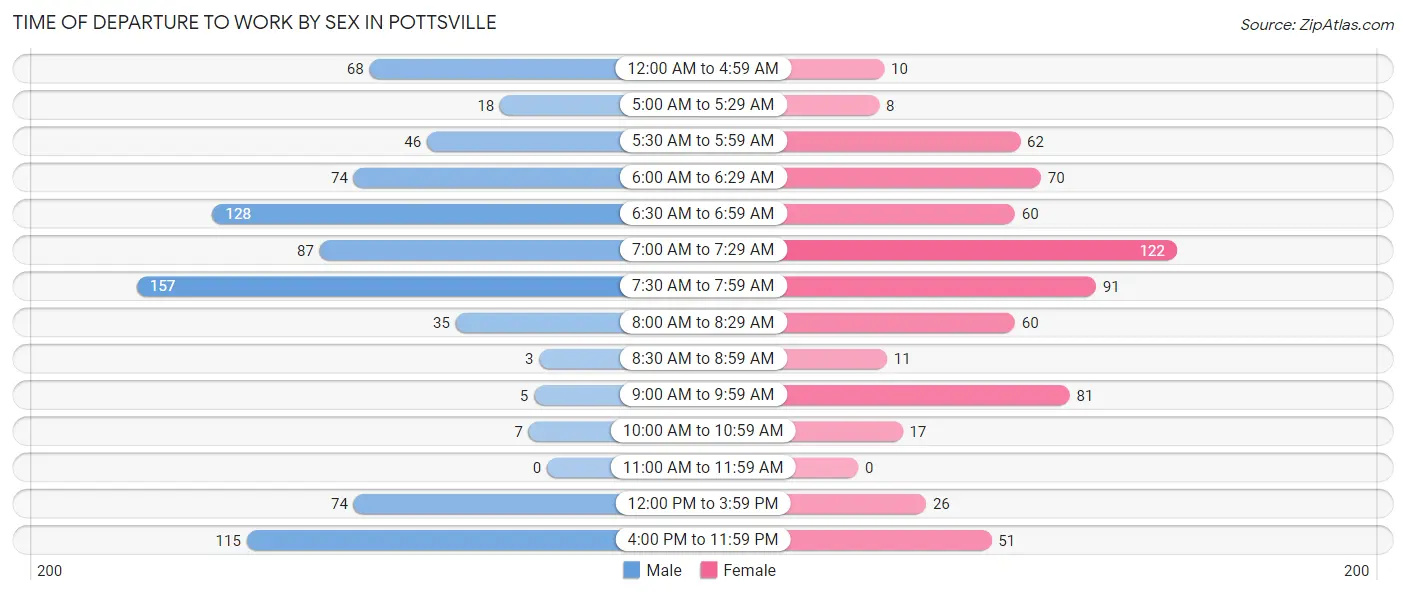
| Time of Departure | Male | Female |
| 12:00 AM to 4:59 AM | 68 (8.3%) | 10 (1.5%) |
| 5:00 AM to 5:29 AM | 18 (2.2%) | 8 (1.2%) |
| 5:30 AM to 5:59 AM | 46 (5.6%) | 62 (9.3%) |
| 6:00 AM to 6:29 AM | 74 (9.1%) | 70 (10.5%) |
| 6:30 AM to 6:59 AM | 128 (15.7%) | 60 (9.0%) |
| 7:00 AM to 7:29 AM | 87 (10.6%) | 122 (18.2%) |
| 7:30 AM to 7:59 AM | 157 (19.2%) | 91 (13.6%) |
| 8:00 AM to 8:29 AM | 35 (4.3%) | 60 (9.0%) |
| 8:30 AM to 8:59 AM | 3 (0.4%) | 11 (1.6%) |
| 9:00 AM to 9:59 AM | 5 (0.6%) | 81 (12.1%) |
| 10:00 AM to 10:59 AM | 7 (0.9%) | 17 (2.5%) |
| 11:00 AM to 11:59 AM | 0 (0.0%) | 0 (0.0%) |
| 12:00 PM to 3:59 PM | 74 (9.1%) | 26 (3.9%) |
| 4:00 PM to 11:59 PM | 115 (14.1%) | 51 (7.6%) |
| Total | 817 (100.0%) | 669 (100.0%) |
Housing Occupancy in Pottsville
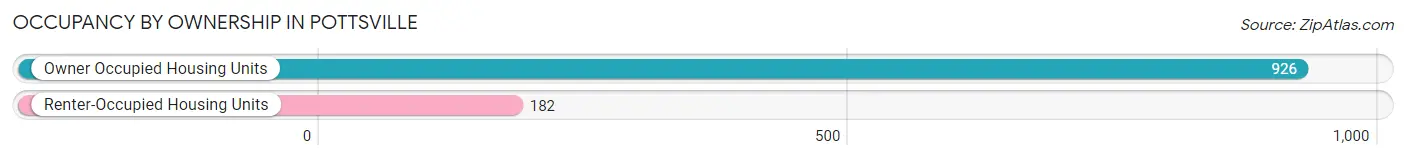
Occupancy by Ownership in Pottsville
Of the total 1,108 dwellings in Pottsville, owner-occupied units account for 926 (83.6%), while renter-occupied units make up 182 (16.4%).
| Occupancy | # Housing Units | % Housing Units |
| Owner Occupied Housing Units | 926 | 83.6% |
| Renter-Occupied Housing Units | 182 | 16.4% |
| Total Occupied Housing Units | 1,108 | 100.0% |
Occupancy by Household Size in Pottsville
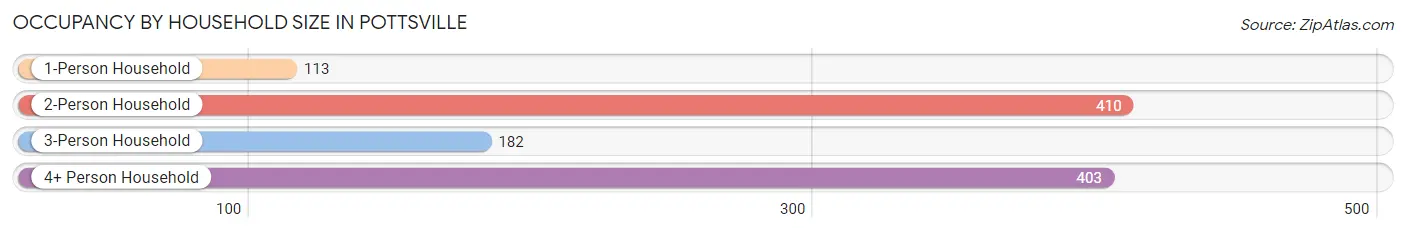
| Household Size | # Housing Units | % Housing Units |
| 1-Person Household | 113 | 10.2% |
| 2-Person Household | 410 | 37.0% |
| 3-Person Household | 182 | 16.4% |
| 4+ Person Household | 403 | 36.4% |
| Total Housing Units | 1,108 | 100.0% |
Occupancy by Ownership by Household Size in Pottsville
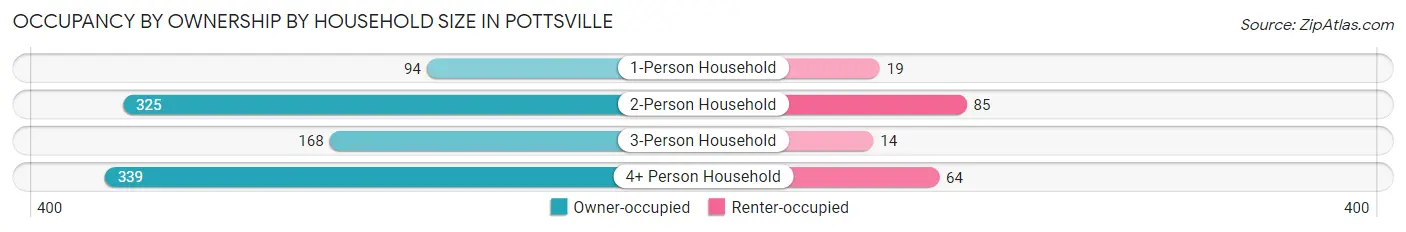
| Household Size | Owner-occupied | Renter-occupied |
| 1-Person Household | 94 (83.2%) | 19 (16.8%) |
| 2-Person Household | 325 (79.3%) | 85 (20.7%) |
| 3-Person Household | 168 (92.3%) | 14 (7.7%) |
| 4+ Person Household | 339 (84.1%) | 64 (15.9%) |
| Total Housing Units | 926 (83.6%) | 182 (16.4%) |
Occupancy by Educational Attainment in Pottsville
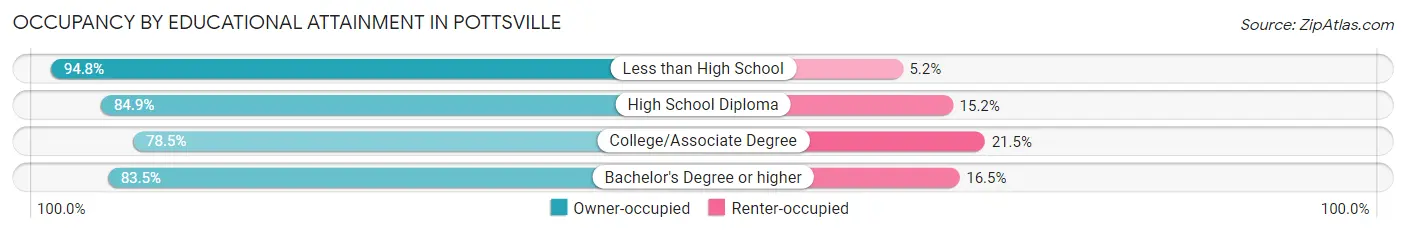
| Household Size | Owner-occupied | Renter-occupied |
| Less than High School | 91 (94.8%) | 5 (5.2%) |
| High School Diploma | 364 (84.9%) | 65 (15.1%) |
| College/Associate Degree | 248 (78.5%) | 68 (21.5%) |
| Bachelor's Degree or higher | 223 (83.5%) | 44 (16.5%) |
Occupancy by Age of Householder in Pottsville
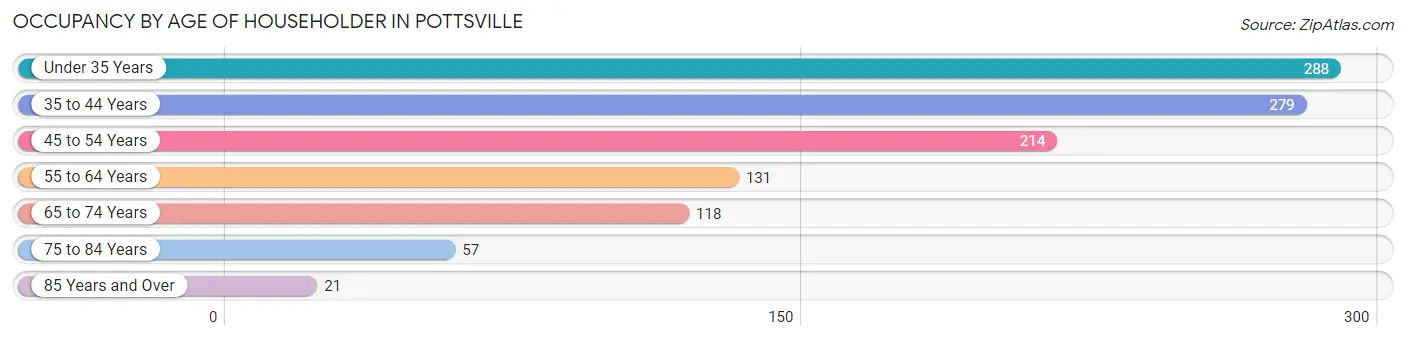
| Age Bracket | # Households | % Households |
| Under 35 Years | 288 | 26.0% |
| 35 to 44 Years | 279 | 25.2% |
| 45 to 54 Years | 214 | 19.3% |
| 55 to 64 Years | 131 | 11.8% |
| 65 to 74 Years | 118 | 10.6% |
| 75 to 84 Years | 57 | 5.1% |
| 85 Years and Over | 21 | 1.9% |
| Total | 1,108 | 100.0% |
Housing Finances in Pottsville
Median Income by Occupancy in Pottsville
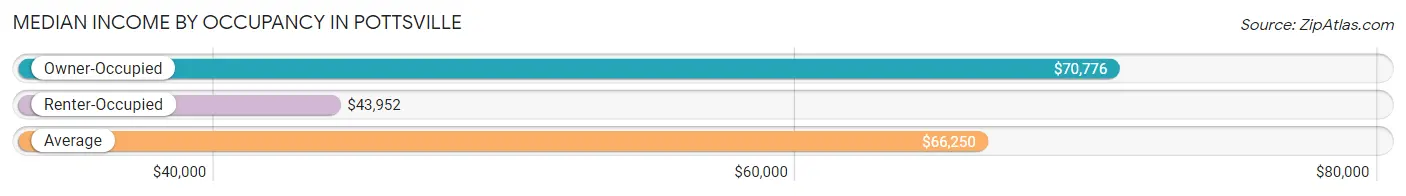
| Occupancy Type | # Households | Median Income |
| Owner-Occupied | 926 (83.6%) | $70,776 |
| Renter-Occupied | 182 (16.4%) | $43,952 |
| Average | 1,108 (100.0%) | $66,250 |
Occupancy by Householder Income Bracket in Pottsville
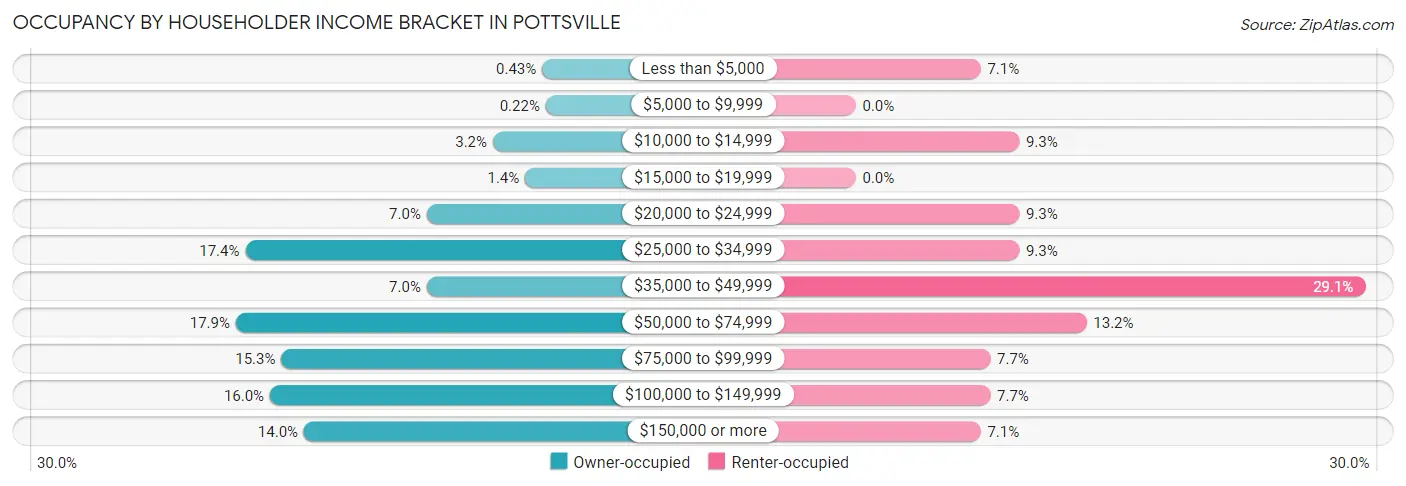
| Income Bracket | Owner-occupied | Renter-occupied |
| Less than $5,000 | 4 (0.4%) | 13 (7.1%) |
| $5,000 to $9,999 | 2 (0.2%) | 0 (0.0%) |
| $10,000 to $14,999 | 30 (3.2%) | 17 (9.3%) |
| $15,000 to $19,999 | 13 (1.4%) | 0 (0.0%) |
| $20,000 to $24,999 | 65 (7.0%) | 17 (9.3%) |
| $25,000 to $34,999 | 161 (17.4%) | 17 (9.3%) |
| $35,000 to $49,999 | 65 (7.0%) | 53 (29.1%) |
| $50,000 to $74,999 | 166 (17.9%) | 24 (13.2%) |
| $75,000 to $99,999 | 142 (15.3%) | 14 (7.7%) |
| $100,000 to $149,999 | 148 (16.0%) | 14 (7.7%) |
| $150,000 or more | 130 (14.0%) | 13 (7.1%) |
| Total | 926 (100.0%) | 182 (100.0%) |
Monthly Housing Cost Tiers in Pottsville
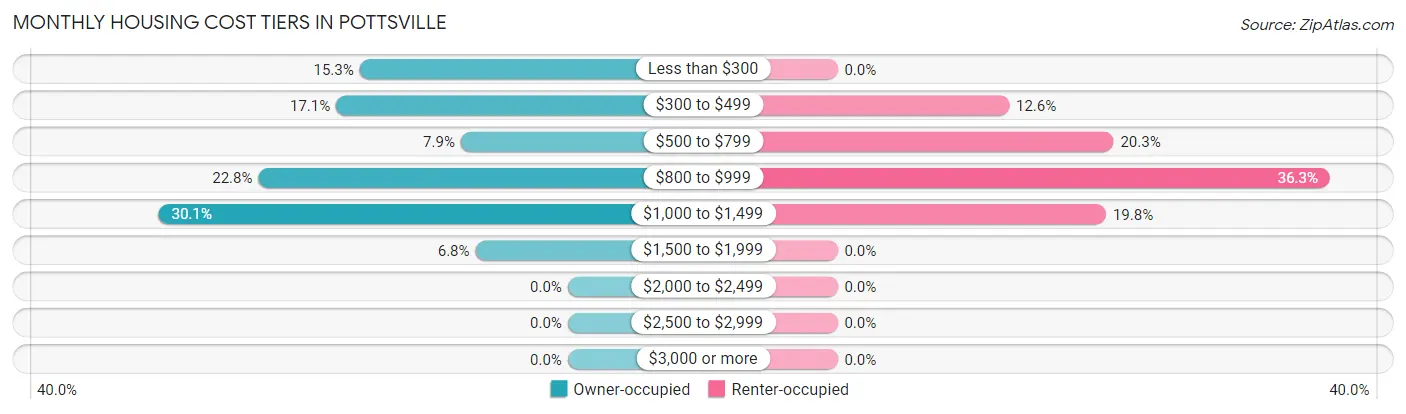
| Monthly Cost | Owner-occupied | Renter-occupied |
| Less than $300 | 142 (15.3%) | 0 (0.0%) |
| $300 to $499 | 158 (17.1%) | 23 (12.6%) |
| $500 to $799 | 73 (7.9%) | 37 (20.3%) |
| $800 to $999 | 211 (22.8%) | 66 (36.3%) |
| $1,000 to $1,499 | 279 (30.1%) | 36 (19.8%) |
| $1,500 to $1,999 | 63 (6.8%) | 0 (0.0%) |
| $2,000 to $2,499 | 0 (0.0%) | 0 (0.0%) |
| $2,500 to $2,999 | 0 (0.0%) | 0 (0.0%) |
| $3,000 or more | 0 (0.0%) | 0 (0.0%) |
| Total | 926 (100.0%) | 182 (100.0%) |
Physical Housing Characteristics in Pottsville
Housing Structures in Pottsville
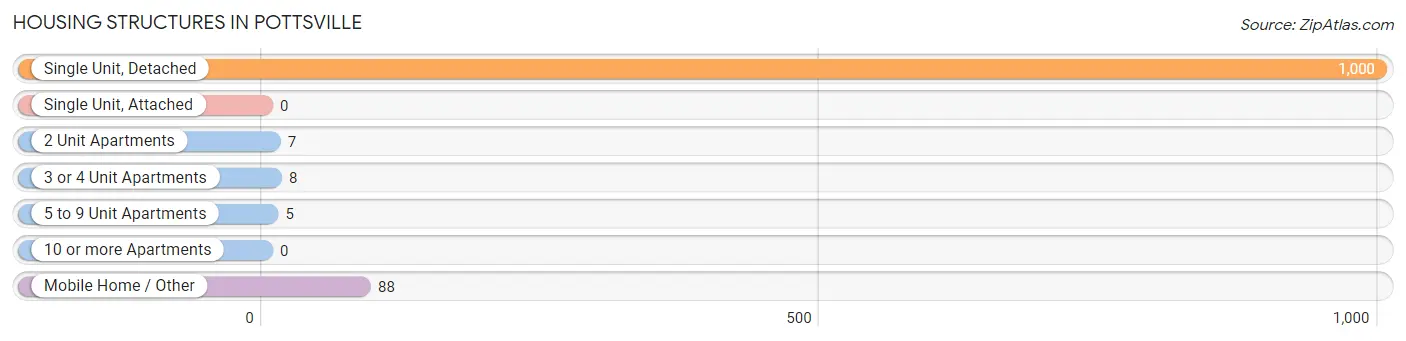
| Structure Type | # Housing Units | % Housing Units |
| Single Unit, Detached | 1,000 | 90.2% |
| Single Unit, Attached | 0 | 0.0% |
| 2 Unit Apartments | 7 | 0.6% |
| 3 or 4 Unit Apartments | 8 | 0.7% |
| 5 to 9 Unit Apartments | 5 | 0.4% |
| 10 or more Apartments | 0 | 0.0% |
| Mobile Home / Other | 88 | 7.9% |
| Total | 1,108 | 100.0% |
Housing Structures by Occupancy in Pottsville
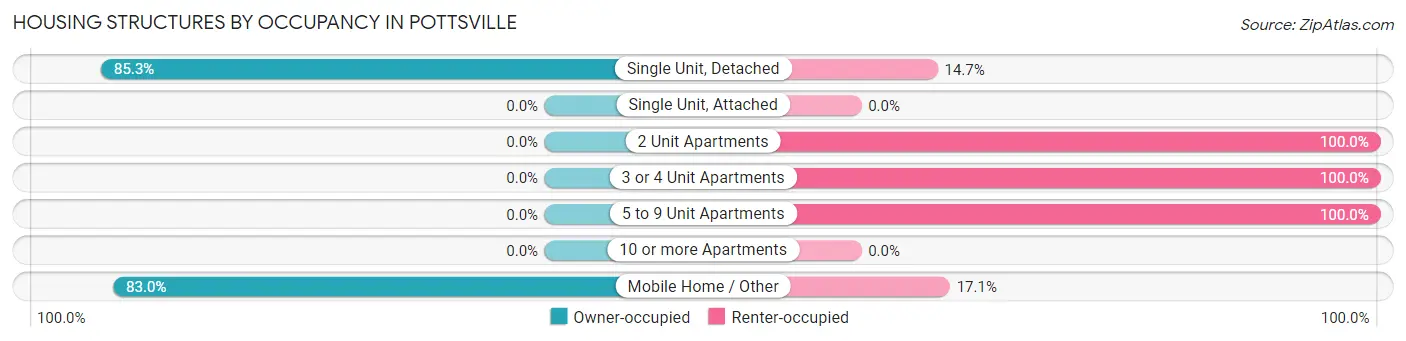
| Structure Type | Owner-occupied | Renter-occupied |
| Single Unit, Detached | 853 (85.3%) | 147 (14.7%) |
| Single Unit, Attached | 0 (0.0%) | 0 (0.0%) |
| 2 Unit Apartments | 0 (0.0%) | 7 (100.0%) |
| 3 or 4 Unit Apartments | 0 (0.0%) | 8 (100.0%) |
| 5 to 9 Unit Apartments | 0 (0.0%) | 5 (100.0%) |
| 10 or more Apartments | 0 (0.0%) | 0 (0.0%) |
| Mobile Home / Other | 73 (83.0%) | 15 (17.1%) |
| Total | 926 (83.6%) | 182 (16.4%) |
Housing Structures by Number of Rooms in Pottsville
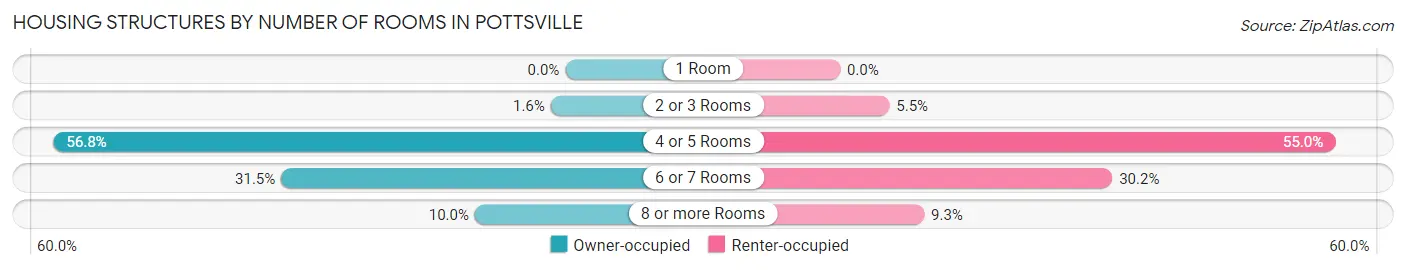
| Number of Rooms | Owner-occupied | Renter-occupied |
| 1 Room | 0 (0.0%) | 0 (0.0%) |
| 2 or 3 Rooms | 15 (1.6%) | 10 (5.5%) |
| 4 or 5 Rooms | 526 (56.8%) | 100 (54.9%) |
| 6 or 7 Rooms | 292 (31.5%) | 55 (30.2%) |
| 8 or more Rooms | 93 (10.0%) | 17 (9.3%) |
| Total | 926 (100.0%) | 182 (100.0%) |
Housing Structure by Heating Type in Pottsville
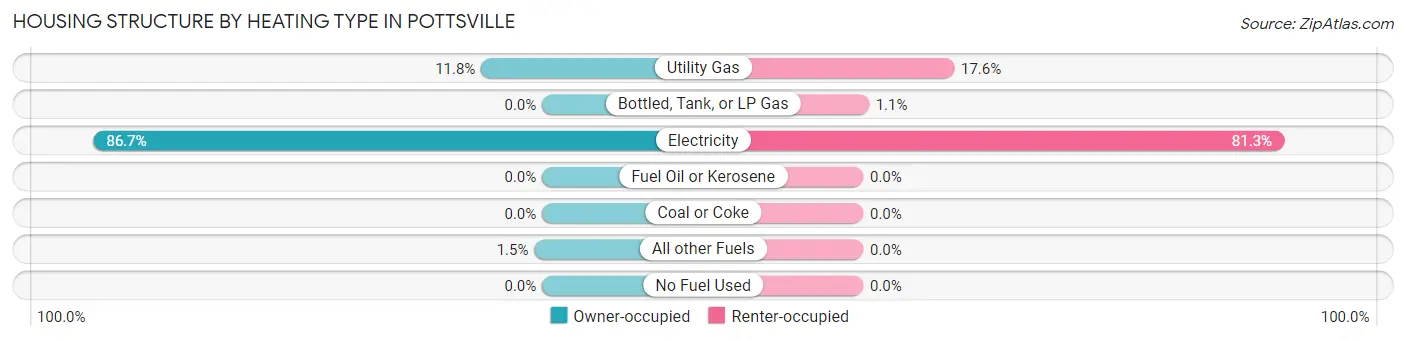
| Heating Type | Owner-occupied | Renter-occupied |
| Utility Gas | 109 (11.8%) | 32 (17.6%) |
| Bottled, Tank, or LP Gas | 0 (0.0%) | 2 (1.1%) |
| Electricity | 803 (86.7%) | 148 (81.3%) |
| Fuel Oil or Kerosene | 0 (0.0%) | 0 (0.0%) |
| Coal or Coke | 0 (0.0%) | 0 (0.0%) |
| All other Fuels | 14 (1.5%) | 0 (0.0%) |
| No Fuel Used | 0 (0.0%) | 0 (0.0%) |
| Total | 926 (100.0%) | 182 (100.0%) |
Household Vehicle Usage in Pottsville
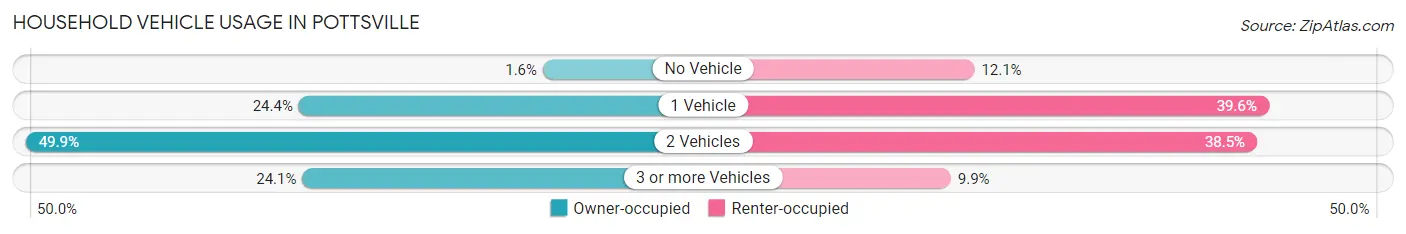
| Vehicles per Household | Owner-occupied | Renter-occupied |
| No Vehicle | 15 (1.6%) | 22 (12.1%) |
| 1 Vehicle | 226 (24.4%) | 72 (39.6%) |
| 2 Vehicles | 462 (49.9%) | 70 (38.5%) |
| 3 or more Vehicles | 223 (24.1%) | 18 (9.9%) |
| Total | 926 (100.0%) | 182 (100.0%) |
Real Estate & Mortgages in Pottsville
Real Estate and Mortgage Overview in Pottsville
| Characteristic | Without Mortgage | With Mortgage |
| Housing Units | 309 | 617 |
| Median Property Value | $125,900 | $164,200 |
| Median Household Income | $52,054 | $116 |
| Monthly Housing Costs | $318 | $0 |
| Real Estate Taxes | $664 | $4 |
Property Value by Mortgage Status in Pottsville
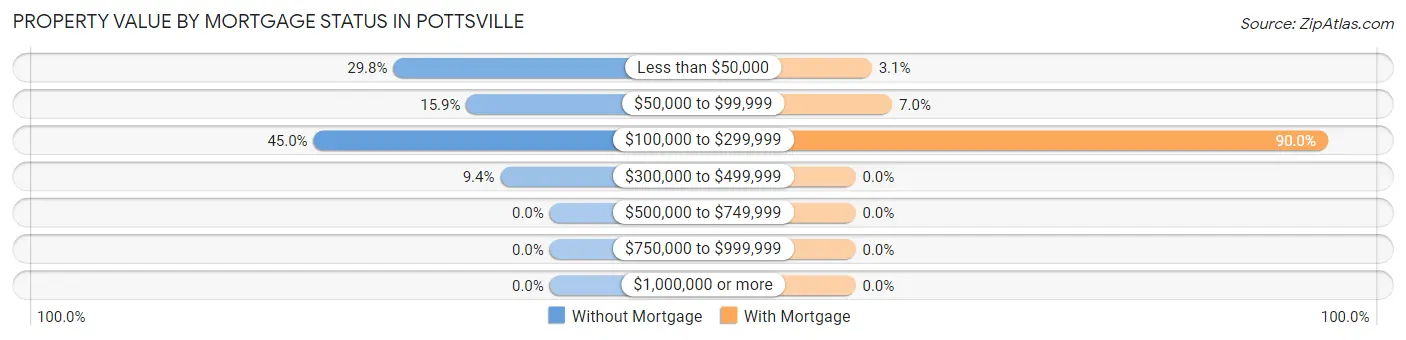
| Property Value | Without Mortgage | With Mortgage |
| Less than $50,000 | 92 (29.8%) | 19 (3.1%) |
| $50,000 to $99,999 | 49 (15.9%) | 43 (7.0%) |
| $100,000 to $299,999 | 139 (45.0%) | 555 (89.9%) |
| $300,000 to $499,999 | 29 (9.4%) | 0 (0.0%) |
| $500,000 to $749,999 | 0 (0.0%) | 0 (0.0%) |
| $750,000 to $999,999 | 0 (0.0%) | 0 (0.0%) |
| $1,000,000 or more | 0 (0.0%) | 0 (0.0%) |
| Total | 309 (100.0%) | 617 (100.0%) |
Household Income by Mortgage Status in Pottsville
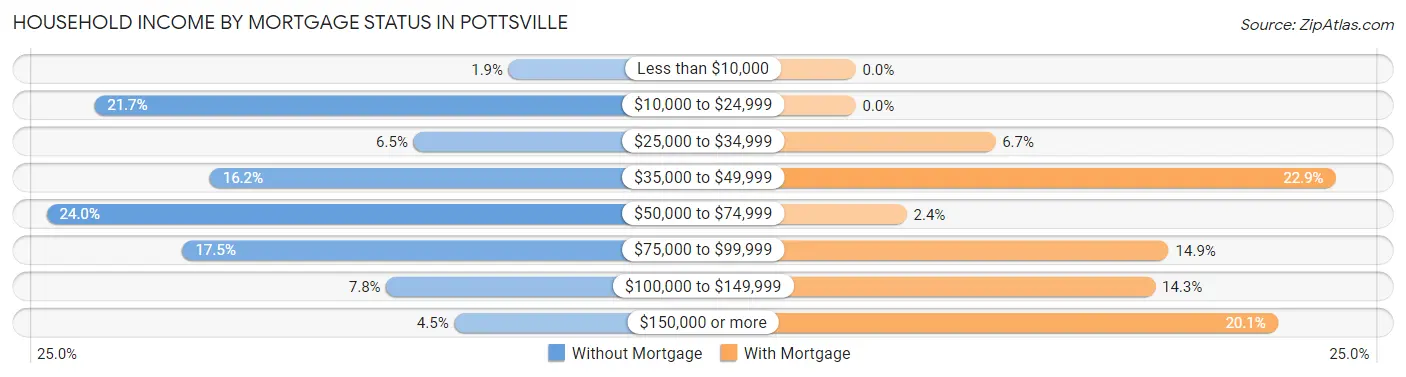
| Household Income | Without Mortgage | With Mortgage |
| Less than $10,000 | 6 (1.9%) | 0 (0.0%) |
| $10,000 to $24,999 | 67 (21.7%) | 0 (0.0%) |
| $25,000 to $34,999 | 20 (6.5%) | 41 (6.7%) |
| $35,000 to $49,999 | 50 (16.2%) | 141 (22.9%) |
| $50,000 to $74,999 | 74 (23.9%) | 15 (2.4%) |
| $75,000 to $99,999 | 54 (17.5%) | 92 (14.9%) |
| $100,000 to $149,999 | 24 (7.8%) | 88 (14.3%) |
| $150,000 or more | 14 (4.5%) | 124 (20.1%) |
| Total | 309 (100.0%) | 617 (100.0%) |
Property Value to Household Income Ratio in Pottsville
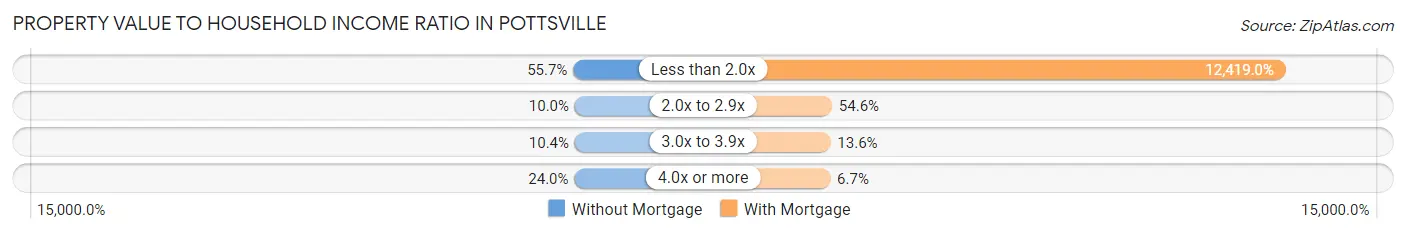
| Value-to-Income Ratio | Without Mortgage | With Mortgage |
| Less than 2.0x | 172 (55.7%) | 76,625 (12,419.0%) |
| 2.0x to 2.9x | 31 (10.0%) | 337 (54.6%) |
| 3.0x to 3.9x | 32 (10.4%) | 84 (13.6%) |
| 4.0x or more | 74 (23.9%) | 41 (6.7%) |
| Total | 309 (100.0%) | 617 (100.0%) |
Real Estate Taxes by Mortgage Status in Pottsville
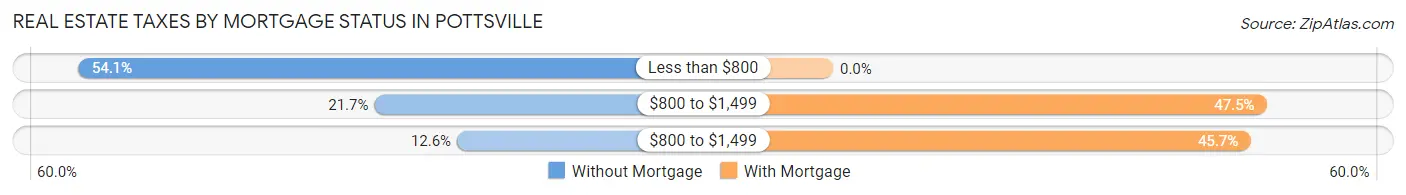
| Property Taxes | Without Mortgage | With Mortgage |
| Less than $800 | 167 (54.0%) | 0 (0.0%) |
| $800 to $1,499 | 67 (21.7%) | 293 (47.5%) |
| $800 to $1,499 | 39 (12.6%) | 282 (45.7%) |
| Total | 309 (100.0%) | 617 (100.0%) |
Health & Disability in Pottsville
Health Insurance Coverage by Age in Pottsville
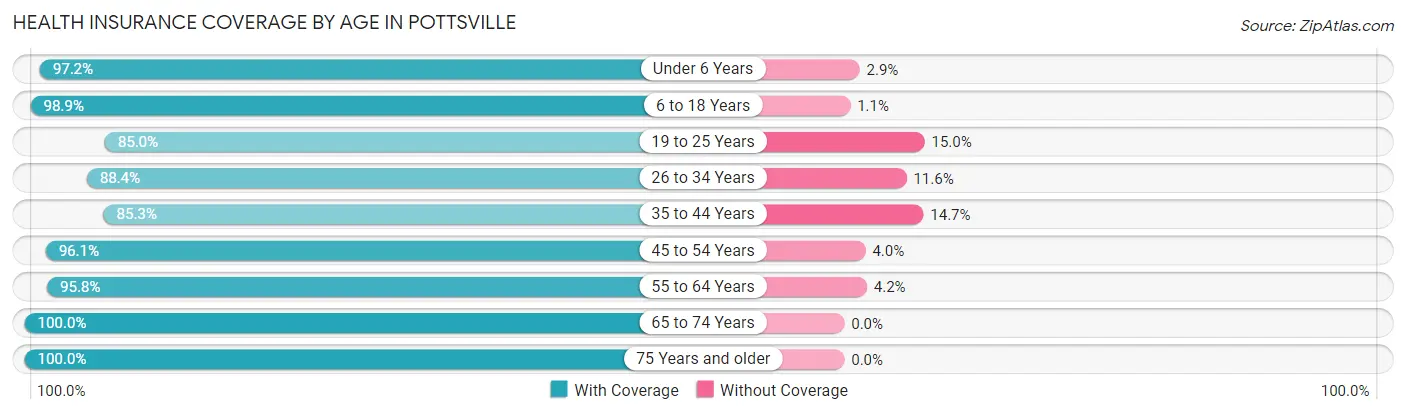
| Age Bracket | With Coverage | Without Coverage |
| Under 6 Years | 239 (97.2%) | 7 (2.9%) |
| 6 to 18 Years | 713 (98.9%) | 8 (1.1%) |
| 19 to 25 Years | 250 (85.0%) | 44 (15.0%) |
| 26 to 34 Years | 404 (88.4%) | 53 (11.6%) |
| 35 to 44 Years | 399 (85.3%) | 69 (14.7%) |
| 45 to 54 Years | 340 (96.1%) | 14 (4.0%) |
| 55 to 64 Years | 251 (95.8%) | 11 (4.2%) |
| 65 to 74 Years | 203 (100.0%) | 0 (0.0%) |
| 75 Years and older | 136 (100.0%) | 0 (0.0%) |
| Total | 2,935 (93.4%) | 206 (6.6%) |
Health Insurance Coverage by Citizenship Status in Pottsville
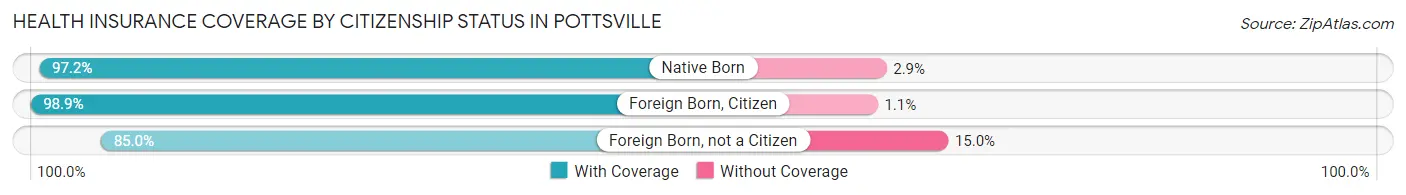
| Citizenship Status | With Coverage | Without Coverage |
| Native Born | 239 (97.2%) | 7 (2.9%) |
| Foreign Born, Citizen | 713 (98.9%) | 8 (1.1%) |
| Foreign Born, not a Citizen | 250 (85.0%) | 44 (15.0%) |
Health Insurance Coverage by Household Income in Pottsville
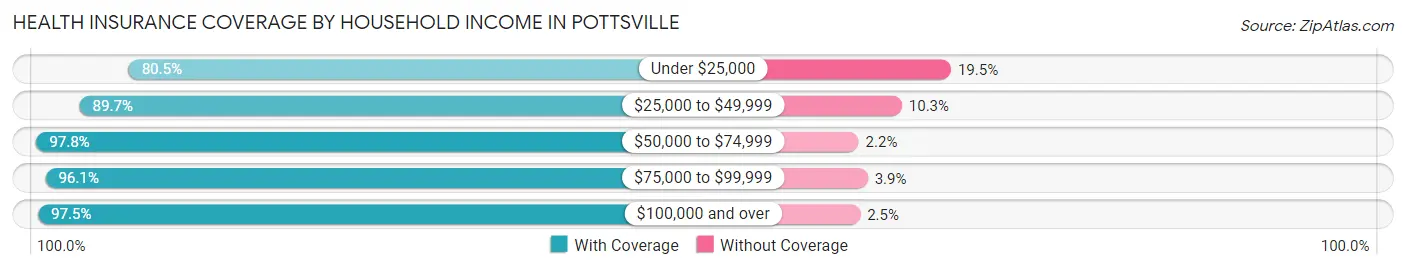
| Household Income | With Coverage | Without Coverage |
| Under $25,000 | 334 (80.5%) | 81 (19.5%) |
| $25,000 to $49,999 | 582 (89.7%) | 67 (10.3%) |
| $50,000 to $74,999 | 484 (97.8%) | 11 (2.2%) |
| $75,000 to $99,999 | 490 (96.1%) | 20 (3.9%) |
| $100,000 and over | 1,045 (97.5%) | 27 (2.5%) |
Public vs Private Health Insurance Coverage by Age in Pottsville
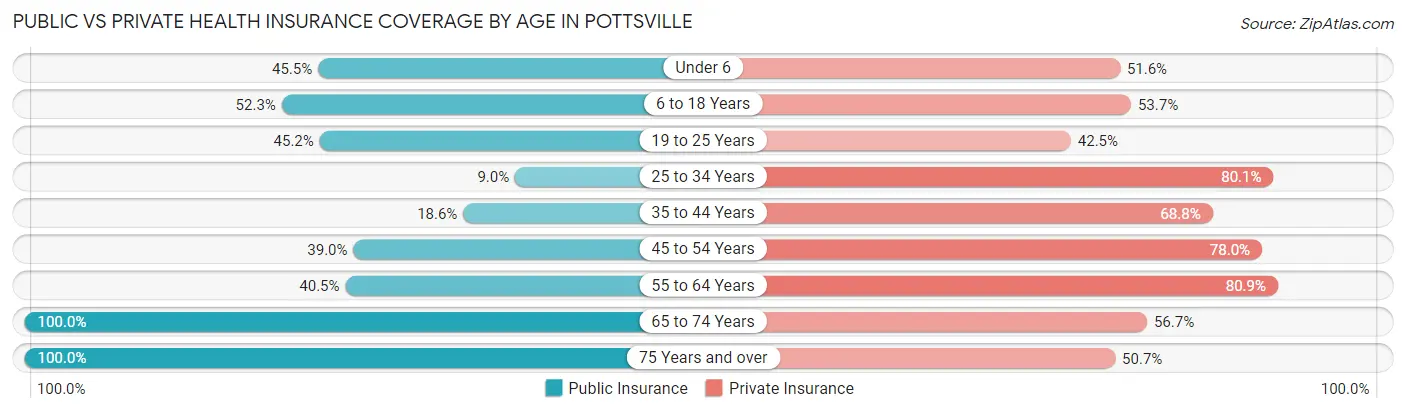
| Age Bracket | Public Insurance | Private Insurance |
| Under 6 | 112 (45.5%) | 127 (51.6%) |
| 6 to 18 Years | 377 (52.3%) | 387 (53.7%) |
| 19 to 25 Years | 133 (45.2%) | 125 (42.5%) |
| 25 to 34 Years | 41 (9.0%) | 366 (80.1%) |
| 35 to 44 Years | 87 (18.6%) | 322 (68.8%) |
| 45 to 54 Years | 138 (39.0%) | 276 (78.0%) |
| 55 to 64 Years | 106 (40.5%) | 212 (80.9%) |
| 65 to 74 Years | 203 (100.0%) | 115 (56.7%) |
| 75 Years and over | 136 (100.0%) | 69 (50.7%) |
| Total | 1,333 (42.4%) | 1,999 (63.6%) |
Disability Status by Sex by Age in Pottsville
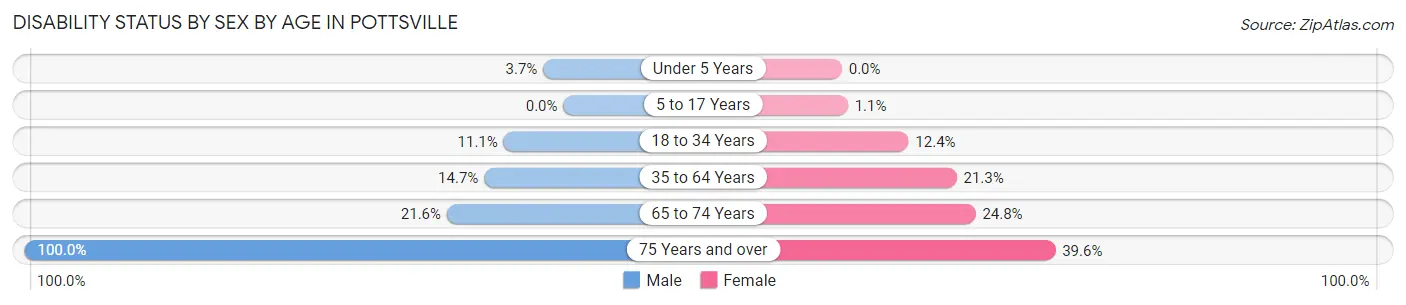
| Age Bracket | Male | Female |
| Under 5 Years | 4 (3.7%) | 0 (0.0%) |
| 5 to 17 Years | 0 (0.0%) | 5 (1.1%) |
| 18 to 34 Years | 49 (11.1%) | 44 (12.4%) |
| 35 to 64 Years | 71 (14.7%) | 128 (21.3%) |
| 65 to 74 Years | 16 (21.6%) | 32 (24.8%) |
| 75 Years and over | 83 (100.0%) | 21 (39.6%) |
Disability Class by Sex by Age in Pottsville
Disability Class: Hearing Difficulty
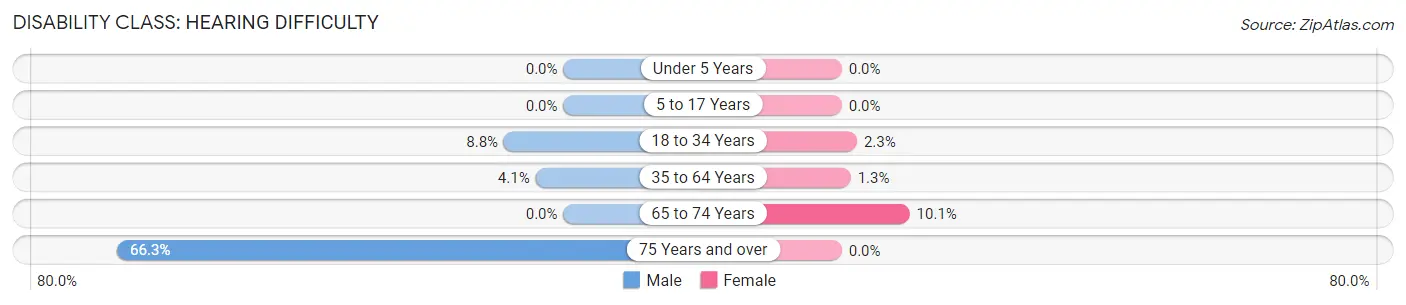
| Age Bracket | Male | Female |
| Under 5 Years | 0 (0.0%) | 0 (0.0%) |
| 5 to 17 Years | 0 (0.0%) | 0 (0.0%) |
| 18 to 34 Years | 39 (8.8%) | 8 (2.2%) |
| 35 to 64 Years | 20 (4.1%) | 8 (1.3%) |
| 65 to 74 Years | 0 (0.0%) | 13 (10.1%) |
| 75 Years and over | 55 (66.3%) | 0 (0.0%) |
Disability Class: Vision Difficulty
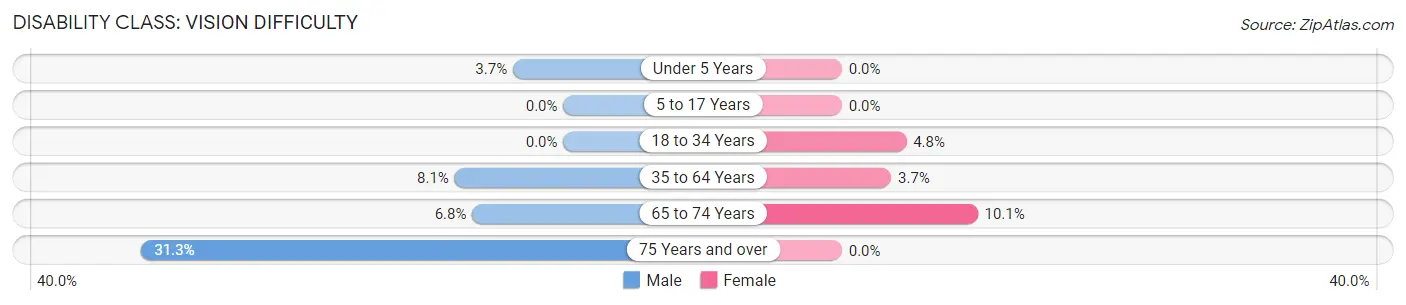
| Age Bracket | Male | Female |
| Under 5 Years | 4 (3.7%) | 0 (0.0%) |
| 5 to 17 Years | 0 (0.0%) | 0 (0.0%) |
| 18 to 34 Years | 0 (0.0%) | 17 (4.8%) |
| 35 to 64 Years | 39 (8.1%) | 22 (3.7%) |
| 65 to 74 Years | 5 (6.8%) | 13 (10.1%) |
| 75 Years and over | 26 (31.3%) | 0 (0.0%) |
Disability Class: Cognitive Difficulty
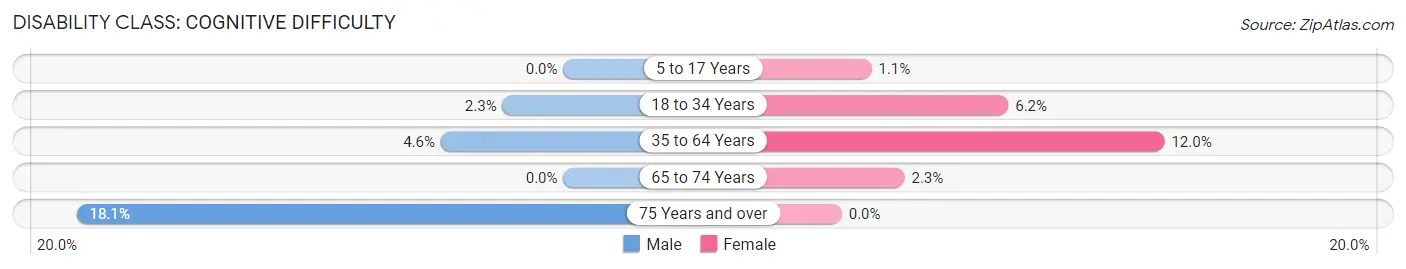
| Age Bracket | Male | Female |
| 5 to 17 Years | 0 (0.0%) | 5 (1.1%) |
| 18 to 34 Years | 10 (2.3%) | 22 (6.2%) |
| 35 to 64 Years | 22 (4.5%) | 72 (12.0%) |
| 65 to 74 Years | 0 (0.0%) | 3 (2.3%) |
| 75 Years and over | 15 (18.1%) | 0 (0.0%) |
Disability Class: Ambulatory Difficulty
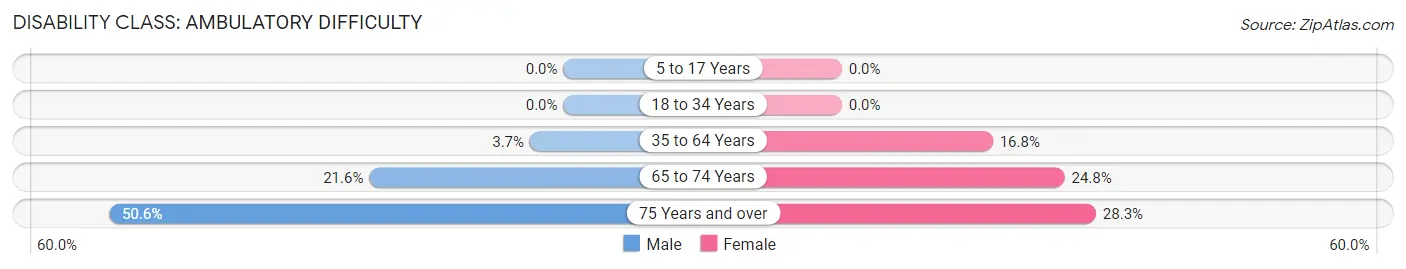
| Age Bracket | Male | Female |
| 5 to 17 Years | 0 (0.0%) | 0 (0.0%) |
| 18 to 34 Years | 0 (0.0%) | 0 (0.0%) |
| 35 to 64 Years | 18 (3.7%) | 101 (16.8%) |
| 65 to 74 Years | 16 (21.6%) | 32 (24.8%) |
| 75 Years and over | 42 (50.6%) | 15 (28.3%) |
Disability Class: Self-Care Difficulty
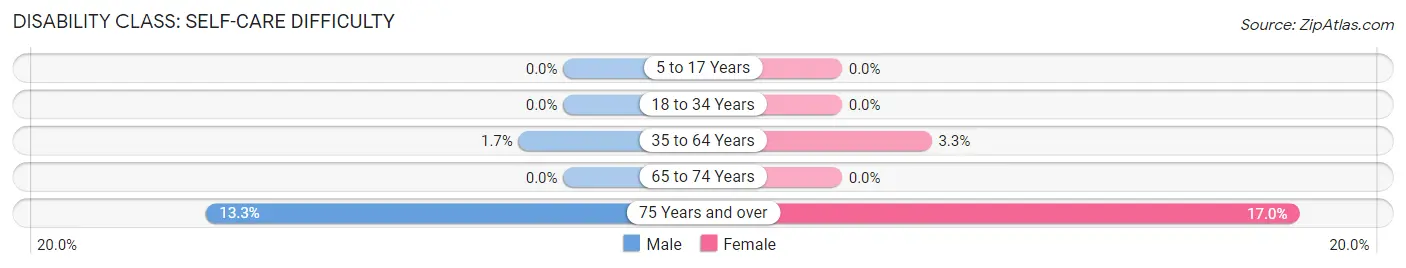
| Age Bracket | Male | Female |
| 5 to 17 Years | 0 (0.0%) | 0 (0.0%) |
| 18 to 34 Years | 0 (0.0%) | 0 (0.0%) |
| 35 to 64 Years | 8 (1.7%) | 20 (3.3%) |
| 65 to 74 Years | 0 (0.0%) | 0 (0.0%) |
| 75 Years and over | 11 (13.3%) | 9 (17.0%) |
Technology Access in Pottsville
Computing Device Access in Pottsville
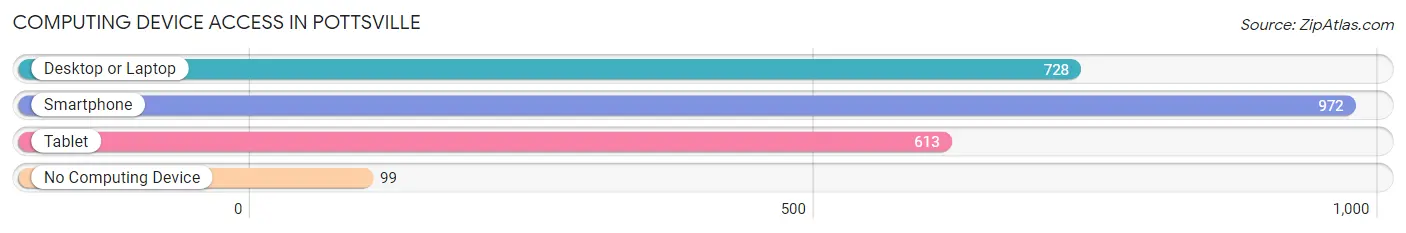
| Device Type | # Households | % Households |
| Desktop or Laptop | 728 | 65.7% |
| Smartphone | 972 | 87.7% |
| Tablet | 613 | 55.3% |
| No Computing Device | 99 | 8.9% |
| Total | 1,108 | 100.0% |
Internet Access in Pottsville
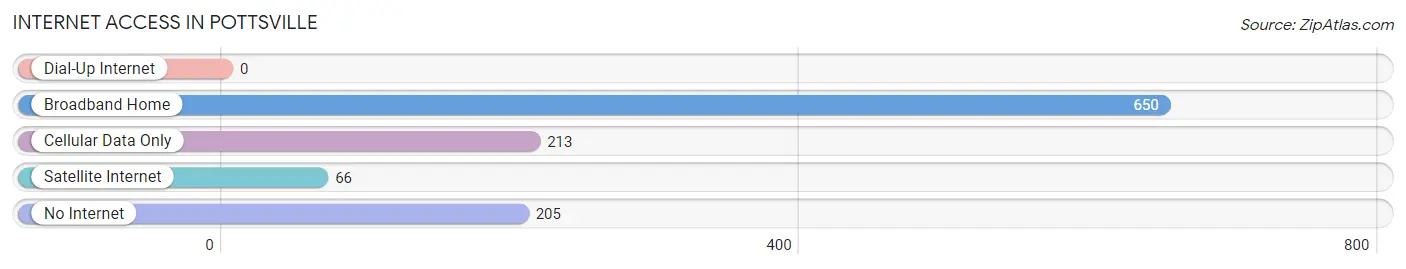
| Internet Type | # Households | % Households |
| Dial-Up Internet | 0 | 0.0% |
| Broadband Home | 650 | 58.7% |
| Cellular Data Only | 213 | 19.2% |
| Satellite Internet | 66 | 6.0% |
| No Internet | 205 | 18.5% |
| Total | 1,108 | 100.0% |
Pottsville Summary
Pottsville, Arkansas is a small town located in Pope County in the northwest corner of the state. It is situated on the banks of the Arkansas River and is part of the Little Rock-North Little Rock-Conway Metropolitan Statistical Area. The town has a population of 1,845 as of the 2010 census.
History
Pottsville was founded in 1856 by William Potts, a settler from Tennessee. He named the town after himself and it quickly became a thriving community. The town was incorporated in 1872 and was the county seat of Pope County until 1883 when it was moved to Russellville.
The town was a major stop on the St. Louis, Iron Mountain and Southern Railway, which ran through the town from 1873 to the early 1900s. The railroad brought many new people to the area and helped to spur economic growth.
The town was also home to a number of businesses, including a cotton gin, a grist mill, a sawmill, and a brickyard. The town also had a number of churches, including the First Baptist Church, which was founded in 1872.
Geography
Pottsville is located in the northwest corner of Pope County, Arkansas. It is situated on the banks of the Arkansas River and is part of the Little Rock-North Little Rock-Conway Metropolitan Statistical Area. The town has a total area of 1.3 square miles, all of which is land.
The town is located in the Arkansas River Valley, which is known for its rolling hills and fertile soil. The climate is humid subtropical, with hot summers and mild winters.
Economy
The economy of Pottsville is largely based on agriculture. The town is home to a number of farms, which produce a variety of crops, including corn, soybeans, cotton, and wheat. The town is also home to a number of small businesses, including restaurants, retail stores, and service providers.
The town is also home to a number of manufacturing companies, including a furniture factory, a plastics factory, and a metal fabrication plant. The town is also home to a number of trucking companies, which provide transportation services to the surrounding area.
Demographics
As of the 2010 census, the population of Pottsville was 1,845. The racial makeup of the town was 95.3% White, 0.7% African American, 0.3% Native American, 0.2% Asian, 0.1% Pacific Islander, and 3.4% from other races. The median household income was $35,938 and the median family income was $41,250.
The town is home to a number of churches, including the First Baptist Church, which was founded in 1872. The town is also home to a number of schools, including Pottsville Elementary School, Pottsville Middle School, and Pottsville High School.
Conclusion
Pottsville, Arkansas is a small town located in Pope County in the northwest corner of the state. It is situated on the banks of the Arkansas River and is part of the Little Rock-North Little Rock-Conway Metropolitan Statistical Area. The town has a population of 1,845 as of the 2010 census. The town was founded in 1856 and was a major stop on the St. Louis, Iron Mountain and Southern Railway. The economy of Pottsville is largely based on agriculture and the town is home to a number of small businesses. The racial makeup of the town is 95.3% White, 0.7% African American, 0.3% Native American, 0.2% Asian, 0.1% Pacific Islander, and 3.4% from other races. The median household income was $35,938 and the median family income was $41,250. The town is home to a number of churches and schools.
Common Questions
What is Per Capita Income in Pottsville?
Per Capita income in Pottsville is $35,994.
What is the Median Family Income in Pottsville?
Median Family Income in Pottsville is $70,774.
What is the Median Household income in Pottsville?
Median Household Income in Pottsville is $66,250.
What is Income or Wage Gap in Pottsville?
Income or Wage Gap in Pottsville is 49.5%.
Women in Pottsville earn 50.5 cents for every dollar earned by a man.
What is Inequality or Gini Index in Pottsville?
Inequality or Gini Index in Pottsville is 0.62.
What is the Total Population of Pottsville?
Total Population of Pottsville is 3,141.
What is the Total Male Population of Pottsville?
Total Male Population of Pottsville is 1,445.
What is the Total Female Population of Pottsville?
Total Female Population of Pottsville is 1,696.
What is the Ratio of Males per 100 Females in Pottsville?
There are 85.20 Males per 100 Females in Pottsville.
What is the Ratio of Females per 100 Males in Pottsville?
There are 117.37 Females per 100 Males in Pottsville.
What is the Median Population Age in Pottsville?
Median Population Age in Pottsville is 33.8 Years.
What is the Average Family Size in Pottsville
Average Family Size in Pottsville is 3.0 People.
What is the Average Household Size in Pottsville
Average Household Size in Pottsville is 2.8 People.
How Large is the Labor Force in Pottsville?
There are 1,554 People in the Labor Forcein in Pottsville.
What is the Percentage of People in the Labor Force in Pottsville?
66.6% of People are in the Labor Force in Pottsville.
What is the Unemployment Rate in Pottsville?
Unemployment Rate in Pottsville is 1.4%.