Zip Codes with the Highest Percentage of Population Employed in Computer, Engineering & Science in Rhode Island
RELATED REPORTS & OPTIONS
Computer, Engineering & Science
Rhode Island
Compare Zip Codes
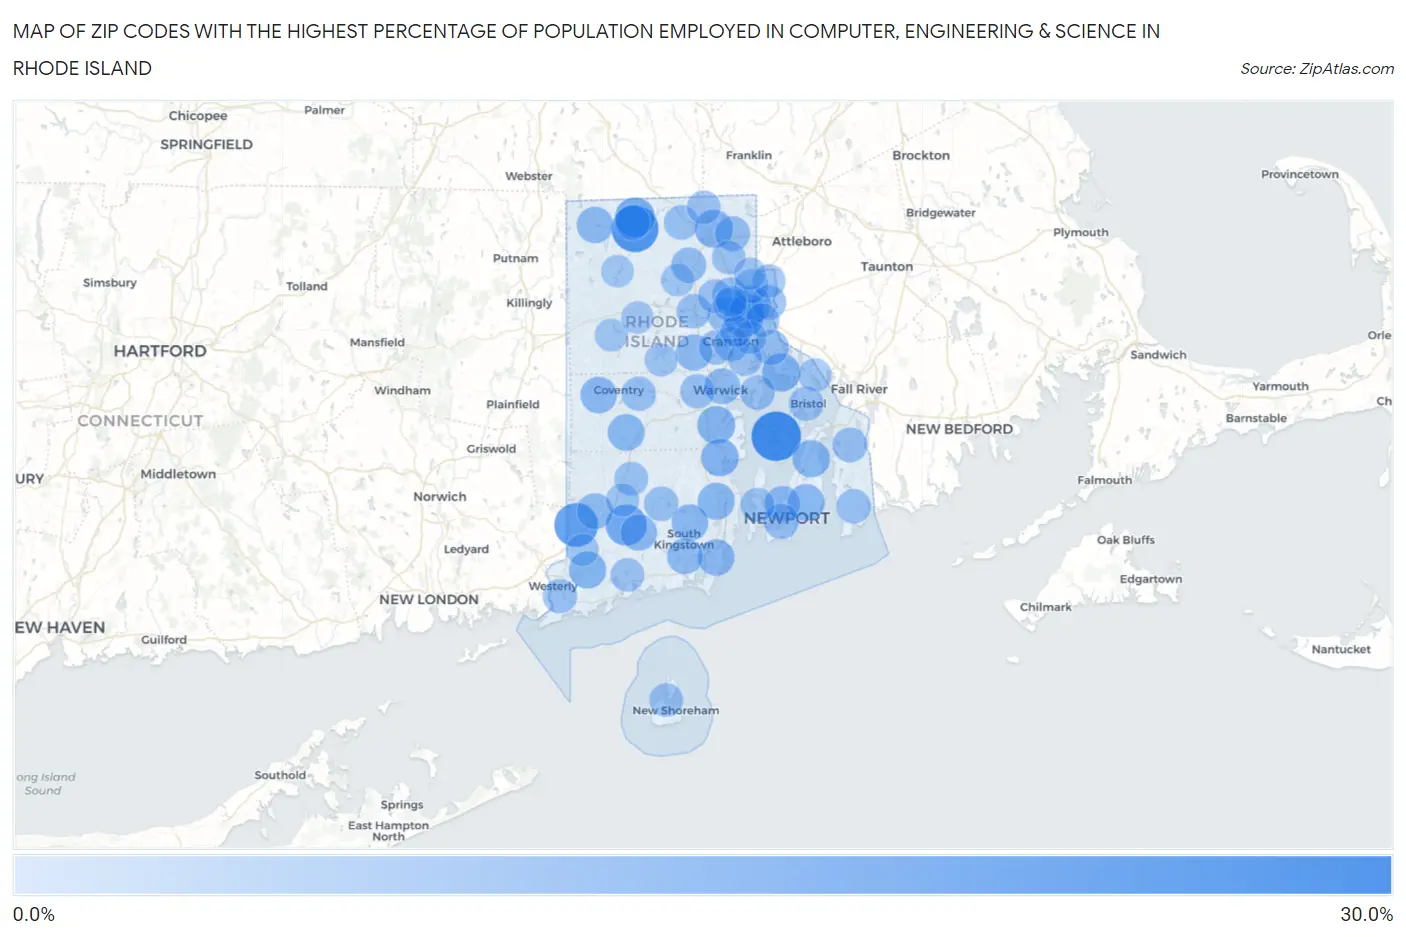
Map of Zip Codes with the Highest Percentage of Population Employed in Computer, Engineering & Science in Rhode Island
0.0%
30.0%
Zip Codes with the Highest Percentage of Population Employed in Computer, Engineering & Science in Rhode Island
| Zip Code | % Employed | vs State | vs National | |
| 1. | 02872 | 27.8% | 6.6%(+21.1)#1 | 6.8%(+21.0)#217 |
| 2. | 02858 | 23.8% | 6.6%(+17.2)#2 | 6.8%(+17.1)#305 |
| 3. | 02833 | 19.3% | 6.6%(+12.7)#3 | 6.8%(+12.6)#567 |
| 4. | 02812 | 15.4% | 6.6%(+8.74)#4 | 6.8%(+8.62)#1,048 |
| 5. | 02826 | 14.0% | 6.6%(+7.33)#5 | 6.8%(+7.21)#1,347 |
| 6. | 02903 | 13.1% | 6.6%(+6.46)#6 | 6.8%(+6.34)#1,603 |
| 7. | 02906 | 12.0% | 6.6%(+5.40)#7 | 6.8%(+5.28)#2,020 |
| 8. | 02806 | 11.5% | 6.6%(+4.81)#8 | 6.8%(+4.69)#2,320 |
| 9. | 02838 | 10.9% | 6.6%(+4.29)#9 | 6.8%(+4.17)#2,617 |
| 10. | 02818 | 10.8% | 6.6%(+4.15)#10 | 6.8%(+4.03)#2,682 |
| 11. | 02852 | 10.4% | 6.6%(+3.79)#11 | 6.8%(+3.67)#2,907 |
| 12. | 02871 | 10.2% | 6.6%(+3.55)#12 | 6.8%(+3.43)#3,082 |
| 13. | 02808 | 10.0% | 6.6%(+3.35)#13 | 6.8%(+3.24)#3,212 |
| 14. | 02874 | 9.7% | 6.6%(+3.02)#14 | 6.8%(+2.90)#3,473 |
| 15. | 02842 | 9.5% | 6.6%(+2.84)#15 | 6.8%(+2.72)#3,614 |
| 16. | 02817 | 9.4% | 6.6%(+2.76)#16 | 6.8%(+2.64)#3,688 |
| 17. | 02882 | 9.0% | 6.6%(+2.38)#17 | 6.8%(+2.26)#4,036 |
| 18. | 02881 | 9.0% | 6.6%(+2.37)#18 | 6.8%(+2.25)#4,055 |
| 19. | 02827 | 9.0% | 6.6%(+2.34)#19 | 6.8%(+2.22)#4,079 |
| 20. | 02875 | 8.9% | 6.6%(+2.22)#20 | 6.8%(+2.10)#4,207 |
| 21. | 02859 | 8.8% | 6.6%(+2.19)#21 | 6.8%(+2.08)#4,222 |
| 22. | 02921 | 8.4% | 6.6%(+1.79)#22 | 6.8%(+1.67)#4,686 |
| 23. | 02832 | 8.3% | 6.6%(+1.64)#23 | 6.8%(+1.52)#4,896 |
| 24. | 02886 | 8.1% | 6.6%(+1.47)#24 | 6.8%(+1.35)#5,110 |
| 25. | 02879 | 7.9% | 6.6%(+1.29)#25 | 6.8%(+1.17)#5,356 |
| 26. | 02841 | 7.5% | 6.6%(+0.808)#26 | 6.8%(+0.689)#6,068 |
| 27. | 02840 | 7.2% | 6.6%(+0.529)#27 | 6.8%(+0.409)#6,495 |
| 28. | 02864 | 7.1% | 6.6%(+0.457)#28 | 6.8%(+0.338)#6,628 |
| 29. | 02909 | 7.0% | 6.6%(+0.318)#29 | 6.8%(+0.198)#6,864 |
| 30. | 02830 | 6.9% | 6.6%(+0.288)#30 | 6.8%(+0.168)#6,908 |
| 31. | 02915 | 6.9% | 6.6%(+0.286)#31 | 6.8%(+0.167)#6,910 |
| 32. | 02904 | 6.9% | 6.6%(+0.233)#32 | 6.8%(+0.113)#7,014 |
| 33. | 02917 | 6.9% | 6.6%(+0.231)#33 | 6.8%(+0.111)#7,017 |
| 34. | 02912 | 6.9% | 6.6%(+0.226)#34 | 6.8%(+0.107)#7,027 |
| 35. | 02878 | 6.5% | 6.6%(-0.165)#35 | 6.8%(-0.285)#7,777 |
| 36. | 02916 | 6.4% | 6.6%(-0.210)#36 | 6.8%(-0.329)#7,861 |
| 37. | 02920 | 6.4% | 6.6%(-0.225)#37 | 6.8%(-0.345)#7,894 |
| 38. | 02910 | 6.3% | 6.6%(-0.336)#38 | 6.8%(-0.456)#8,111 |
| 39. | 02896 | 6.3% | 6.6%(-0.388)#39 | 6.8%(-0.508)#8,221 |
| 40. | 02889 | 6.2% | 6.6%(-0.412)#40 | 6.8%(-0.532)#8,266 |
| 41. | 02809 | 6.2% | 6.6%(-0.482)#41 | 6.8%(-0.602)#8,433 |
| 42. | 02893 | 6.2% | 6.6%(-0.490)#42 | 6.8%(-0.609)#8,448 |
| 43. | 02892 | 6.1% | 6.6%(-0.496)#43 | 6.8%(-0.616)#8,464 |
| 44. | 02837 | 6.1% | 6.6%(-0.584)#44 | 6.8%(-0.704)#8,679 |
| 45. | 02919 | 6.0% | 6.6%(-0.654)#45 | 6.8%(-0.774)#8,859 |
| 46. | 02891 | 6.0% | 6.6%(-0.691)#46 | 6.8%(-0.811)#8,943 |
| 47. | 02888 | 5.9% | 6.6%(-0.734)#47 | 6.8%(-0.854)#9,043 |
| 48. | 02816 | 5.8% | 6.6%(-0.819)#48 | 6.8%(-0.938)#9,242 |
| 49. | 02860 | 5.5% | 6.6%(-1.12)#49 | 6.8%(-1.24)#10,008 |
| 50. | 02835 | 5.5% | 6.6%(-1.12)#50 | 6.8%(-1.24)#10,011 |
| 51. | 02911 | 5.4% | 6.6%(-1.22)#51 | 6.8%(-1.34)#10,260 |
| 52. | 02908 | 5.3% | 6.6%(-1.33)#52 | 6.8%(-1.45)#10,527 |
| 53. | 02822 | 5.3% | 6.6%(-1.36)#53 | 6.8%(-1.48)#10,608 |
| 54. | 02807 | 5.2% | 6.6%(-1.46)#54 | 6.8%(-1.58)#10,867 |
| 55. | 02895 | 5.0% | 6.6%(-1.63)#55 | 6.8%(-1.75)#11,311 |
| 56. | 02865 | 4.9% | 6.6%(-1.75)#56 | 6.8%(-1.87)#11,678 |
| 57. | 02813 | 4.9% | 6.6%(-1.78)#57 | 6.8%(-1.90)#11,755 |
| 58. | 02914 | 4.8% | 6.6%(-1.89)#58 | 6.8%(-2.01)#12,058 |
| 59. | 02861 | 4.6% | 6.6%(-2.04)#59 | 6.8%(-2.16)#12,489 |
| 60. | 02905 | 4.6% | 6.6%(-2.07)#60 | 6.8%(-2.18)#12,561 |
| 61. | 02898 | 4.3% | 6.6%(-2.34)#61 | 6.8%(-2.46)#13,496 |
| 62. | 02885 | 4.2% | 6.6%(-2.41)#62 | 6.8%(-2.53)#13,716 |
| 63. | 02831 | 4.2% | 6.6%(-2.43)#63 | 6.8%(-2.55)#13,816 |
| 64. | 02825 | 4.1% | 6.6%(-2.59)#64 | 6.8%(-2.71)#14,305 |
| 65. | 02828 | 4.0% | 6.6%(-2.69)#65 | 6.8%(-2.81)#14,617 |
| 66. | 02814 | 3.6% | 6.6%(-3.06)#66 | 6.8%(-3.18)#15,949 |
| 67. | 02857 | 3.5% | 6.6%(-3.13)#67 | 6.8%(-3.25)#16,208 |
| 68. | 02804 | 3.5% | 6.6%(-3.17)#68 | 6.8%(-3.29)#16,388 |
| 69. | 02863 | 3.1% | 6.6%(-3.57)#69 | 6.8%(-3.69)#17,830 |
| 70. | 02907 | 2.5% | 6.6%(-4.11)#70 | 6.8%(-4.23)#19,900 |
| 71. | 02918 | 1.9% | 6.6%(-4.78)#71 | 6.8%(-4.90)#22,367 |
1
Common Questions
What are the Top 10 Zip Codes with the Highest Percentage of Population Employed in Computer, Engineering & Science in Rhode Island?
Top 10 Zip Codes with the Highest Percentage of Population Employed in Computer, Engineering & Science in Rhode Island are:
What zip code has the Highest Percentage of Population Employed in Computer, Engineering & Science in Rhode Island?
02872 has the Highest Percentage of Population Employed in Computer, Engineering & Science in Rhode Island with 27.8%.
What is the Percentage of Population Employed in Computer, Engineering & Science in the State of Rhode Island?
Percentage of Population Employed in Computer, Engineering & Science in Rhode Island is 6.6%.
What is the Percentage of Population Employed in Computer, Engineering & Science in the United States?
Percentage of Population Employed in Computer, Engineering & Science in the United States is 6.8%.