Zip Codes with the Highest Percentage of Population Employed in Computer, Engineering & Science in Idaho
RELATED REPORTS & OPTIONS
Computer, Engineering & Science
Idaho
Compare Zip Codes
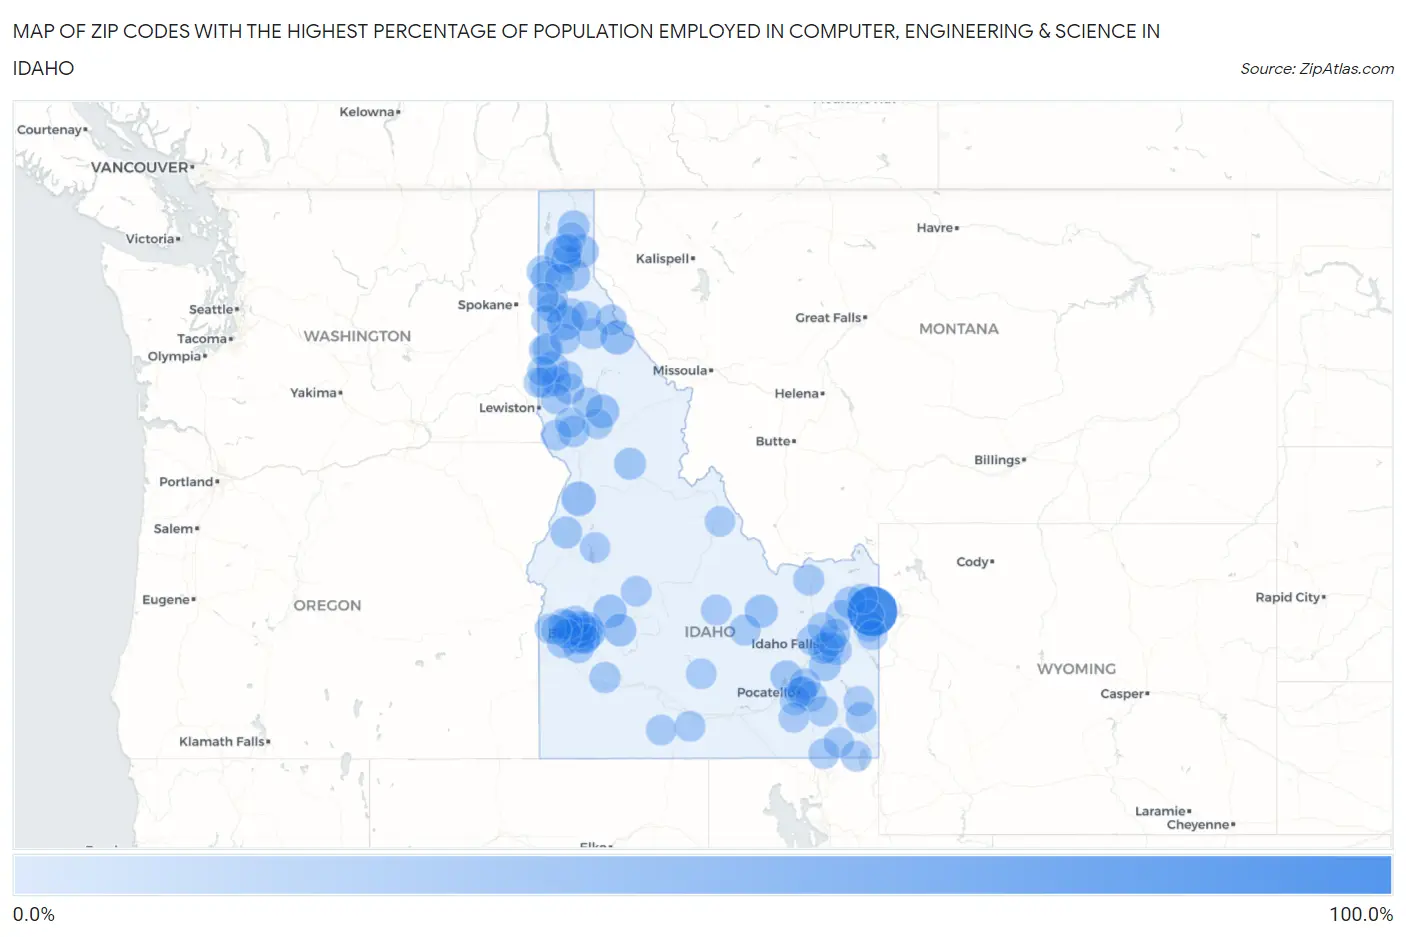
Map of Zip Codes with the Highest Percentage of Population Employed in Computer, Engineering & Science in Idaho
0.0%
100.0%
Zip Codes with the Highest Percentage of Population Employed in Computer, Engineering & Science in Idaho
| Zip Code | % Employed | vs State | vs National | |
| 1. | 83424 | 100.0% | 5.8%(+94.2)#1 | 6.8%(+93.2)#4 |
| 2. | 83825 | 33.3% | 5.8%(+27.5)#2 | 6.8%(+26.6)#144 |
| 3. | 83842 | 28.6% | 5.8%(+22.7)#3 | 6.8%(+21.8)#195 |
| 4. | 83547 | 23.8% | 5.8%(+18.0)#4 | 6.8%(+17.0)#307 |
| 5. | 83802 | 23.0% | 5.8%(+17.1)#5 | 6.8%(+16.2)#348 |
| 6. | 83553 | 19.7% | 5.8%(+13.9)#6 | 6.8%(+13.0)#527 |
| 7. | 83631 | 18.1% | 5.8%(+12.2)#7 | 6.8%(+11.3)#674 |
| 8. | 83244 | 18.0% | 5.8%(+12.1)#8 | 6.8%(+11.2)#684 |
| 9. | 83716 | 16.0% | 5.8%(+10.1)#9 | 6.8%(+9.19)#965 |
| 10. | 83836 | 15.8% | 5.8%(+9.95)#10 | 6.8%(+9.04)#991 |
| 11. | 83803 | 15.3% | 5.8%(+9.45)#11 | 6.8%(+8.53)#1,071 |
| 12. | 83706 | 13.6% | 5.8%(+7.78)#12 | 6.8%(+6.86)#1,450 |
| 13. | 83857 | 13.1% | 5.8%(+7.24)#13 | 6.8%(+6.32)#1,613 |
| 14. | 83612 | 12.3% | 5.8%(+6.47)#14 | 6.8%(+5.55)#1,889 |
| 15. | 83525 | 12.2% | 5.8%(+6.35)#15 | 6.8%(+5.43)#1,947 |
| 16. | 83236 | 12.0% | 5.8%(+6.18)#16 | 6.8%(+5.26)#2,024 |
| 17. | 83847 | 11.9% | 5.8%(+6.01)#17 | 6.8%(+5.09)#2,108 |
| 18. | 83277 | 11.4% | 5.8%(+5.54)#18 | 6.8%(+4.63)#2,359 |
| 19. | 83824 | 11.3% | 5.8%(+5.45)#19 | 6.8%(+4.53)#2,410 |
| 20. | 83421 | 10.8% | 5.8%(+4.93)#20 | 6.8%(+4.01)#2,691 |
| 21. | 83804 | 10.6% | 5.8%(+4.79)#21 | 6.8%(+3.87)#2,771 |
| 22. | 83702 | 10.6% | 5.8%(+4.79)#22 | 6.8%(+3.87)#2,776 |
| 23. | 83526 | 10.6% | 5.8%(+4.71)#23 | 6.8%(+3.80)#2,825 |
| 24. | 83703 | 10.5% | 5.8%(+4.69)#24 | 6.8%(+3.77)#2,842 |
| 25. | 83642 | 10.2% | 5.8%(+4.39)#25 | 6.8%(+3.47)#3,042 |
| 26. | 83712 | 9.8% | 5.8%(+3.92)#26 | 6.8%(+3.01)#3,386 |
| 27. | 83869 | 9.2% | 5.8%(+3.35)#27 | 6.8%(+2.44)#3,858 |
| 28. | 83213 | 8.9% | 5.8%(+3.02)#28 | 6.8%(+2.10)#4,199 |
| 29. | 83843 | 8.5% | 5.8%(+2.67)#29 | 6.8%(+1.76)#4,588 |
| 30. | 83406 | 8.5% | 5.8%(+2.66)#30 | 6.8%(+1.74)#4,599 |
| 31. | 83209 | 8.4% | 5.8%(+2.59)#31 | 6.8%(+1.68)#4,670 |
| 32. | 83648 | 8.4% | 5.8%(+2.54)#32 | 6.8%(+1.63)#4,722 |
| 33. | 83709 | 8.4% | 5.8%(+2.50)#33 | 6.8%(+1.59)#4,769 |
| 34. | 83634 | 8.2% | 5.8%(+2.40)#34 | 6.8%(+1.48)#4,939 |
| 35. | 83423 | 8.2% | 5.8%(+2.37)#35 | 6.8%(+1.46)#4,963 |
| 36. | 83427 | 8.0% | 5.8%(+2.13)#36 | 6.8%(+1.22)#5,290 |
| 37. | 83713 | 8.0% | 5.8%(+2.11)#37 | 6.8%(+1.20)#5,320 |
| 38. | 83537 | 7.9% | 5.8%(+2.06)#38 | 6.8%(+1.14)#5,398 |
| 39. | 83422 | 7.9% | 5.8%(+2.03)#39 | 6.8%(+1.11)#5,432 |
| 40. | 83239 | 7.9% | 5.8%(+2.01)#40 | 6.8%(+1.09)#5,470 |
| 41. | 83646 | 7.9% | 5.8%(+2.00)#41 | 6.8%(+1.09)#5,477 |
| 42. | 83404 | 7.7% | 5.8%(+1.88)#42 | 6.8%(+0.966)#5,645 |
| 43. | 83704 | 7.7% | 5.8%(+1.87)#43 | 6.8%(+0.958)#5,658 |
| 44. | 83452 | 7.6% | 5.8%(+1.78)#44 | 6.8%(+0.866)#5,789 |
| 45. | 83202 | 7.6% | 5.8%(+1.78)#45 | 6.8%(+0.861)#5,795 |
| 46. | 83686 | 7.5% | 5.8%(+1.63)#46 | 6.8%(+0.714)#6,023 |
| 47. | 83846 | 7.4% | 5.8%(+1.59)#47 | 6.8%(+0.670)#6,101 |
| 48. | 83402 | 7.0% | 5.8%(+1.18)#48 | 6.8%(+0.264)#6,749 |
| 49. | 83287 | 7.0% | 5.8%(+1.17)#49 | 6.8%(+0.253)#6,767 |
| 50. | 83714 | 7.0% | 5.8%(+1.16)#50 | 6.8%(+0.248)#6,775 |
| 51. | 83448 | 7.0% | 5.8%(+1.13)#51 | 6.8%(+0.219)#6,825 |
| 52. | 83810 | 7.0% | 5.8%(+1.11)#52 | 6.8%(+0.195)#6,869 |
| 53. | 83637 | 6.9% | 5.8%(+1.05)#53 | 6.8%(+0.132)#6,976 |
| 54. | 83341 | 6.8% | 5.8%(+0.944)#54 | 6.8%(+0.029)#7,162 |
| 55. | 83616 | 6.7% | 5.8%(+0.810)#55 | 6.8%(-0.106)#7,434 |
| 56. | 83555 | 6.6% | 5.8%(+0.720)#56 | 6.8%(-0.195)#7,598 |
| 57. | 83245 | 6.6% | 5.8%(+0.717)#57 | 6.8%(-0.199)#7,609 |
| 58. | 83644 | 6.5% | 5.8%(+0.692)#58 | 6.8%(-0.223)#7,661 |
| 59. | 83808 | 6.5% | 5.8%(+0.602)#59 | 6.8%(-0.313)#7,838 |
| 60. | 83251 | 6.2% | 5.8%(+0.401)#60 | 6.8%(-0.515)#8,234 |
| 61. | 83860 | 6.2% | 5.8%(+0.324)#61 | 6.8%(-0.591)#8,414 |
| 62. | 83286 | 6.2% | 5.8%(+0.315)#62 | 6.8%(-0.600)#8,431 |
| 63. | 83705 | 6.1% | 5.8%(+0.272)#63 | 6.8%(-0.643)#8,537 |
| 64. | 83204 | 6.1% | 5.8%(+0.242)#64 | 6.8%(-0.673)#8,610 |
| 65. | 83815 | 6.1% | 5.8%(+0.206)#65 | 6.8%(-0.709)#8,699 |
| 66. | 83823 | 6.0% | 5.8%(+0.193)#66 | 6.8%(-0.722)#8,729 |
| 67. | 83871 | 5.9% | 5.8%(+0.045)#67 | 6.8%(-0.871)#9,079 |
| 68. | 83321 | 5.9% | 5.8%(+0.004)#68 | 6.8%(-0.911)#9,182 |
| 69. | 83535 | 5.8% | 5.8%(-0.043)#69 | 6.8%(-0.958)#9,286 |
| 70. | 83201 | 5.8% | 5.8%(-0.070)#70 | 6.8%(-0.986)#9,348 |
| 71. | 83615 | 5.8% | 5.8%(-0.080)#71 | 6.8%(-0.995)#9,366 |
| 72. | 83868 | 5.6% | 5.8%(-0.218)#72 | 6.8%(-1.13)#9,722 |
| 73. | 83246 | 5.6% | 5.8%(-0.225)#73 | 6.8%(-1.14)#9,742 |
| 74. | 83349 | 5.6% | 5.8%(-0.259)#74 | 6.8%(-1.17)#9,829 |
| 75. | 83870 | 5.6% | 5.8%(-0.294)#75 | 6.8%(-1.21)#9,922 |
| 76. | 83263 | 5.5% | 5.8%(-0.321)#76 | 6.8%(-1.24)#9,989 |
| 77. | 83814 | 5.5% | 5.8%(-0.383)#77 | 6.8%(-1.30)#10,147 |
| 78. | 83536 | 5.4% | 5.8%(-0.407)#78 | 6.8%(-1.32)#10,208 |
| 79. | 83861 | 5.4% | 5.8%(-0.477)#79 | 6.8%(-1.39)#10,404 |
| 80. | 83420 | 5.3% | 5.8%(-0.512)#80 | 6.8%(-1.43)#10,488 |
| 81. | 83669 | 5.3% | 5.8%(-0.517)#81 | 6.8%(-1.43)#10,502 |
| 82. | 83523 | 5.2% | 5.8%(-0.677)#82 | 6.8%(-1.59)#10,891 |
| 83. | 83401 | 5.0% | 5.8%(-0.841)#83 | 6.8%(-1.76)#11,357 |
| 84. | 83844 | 5.0% | 5.8%(-0.855)#84 | 6.8%(-1.77)#11,396 |
| 85. | 83626 | 4.9% | 5.8%(-0.907)#85 | 6.8%(-1.82)#11,545 |
| 86. | 83431 | 4.9% | 5.8%(-0.958)#86 | 6.8%(-1.87)#11,682 |
| 87. | 83872 | 4.8% | 5.8%(-1.07)#87 | 6.8%(-1.99)#12,012 |
| 88. | 83544 | 4.7% | 5.8%(-1.10)#88 | 6.8%(-2.02)#12,093 |
| 89. | 83276 | 4.7% | 5.8%(-1.14)#89 | 6.8%(-2.06)#12,180 |
| 90. | 83442 | 4.7% | 5.8%(-1.14)#90 | 6.8%(-2.06)#12,183 |
| 91. | 83801 | 4.7% | 5.8%(-1.16)#91 | 6.8%(-2.07)#12,223 |
| 92. | 83212 | 4.6% | 5.8%(-1.21)#92 | 6.8%(-2.13)#12,387 |
| 93. | 83864 | 4.6% | 5.8%(-1.25)#93 | 6.8%(-2.17)#12,506 |
| 94. | 83854 | 4.6% | 5.8%(-1.27)#94 | 6.8%(-2.18)#12,556 |
| 95. | 83687 | 4.5% | 5.8%(-1.31)#95 | 6.8%(-2.22)#12,688 |
| 96. | 83467 | 4.4% | 5.8%(-1.40)#96 | 6.8%(-2.32)#12,999 |
| 97. | 83607 | 4.4% | 5.8%(-1.43)#97 | 6.8%(-2.34)#13,098 |
| 98. | 83876 | 4.4% | 5.8%(-1.46)#98 | 6.8%(-2.38)#13,209 |
| 99. | 83455 | 4.4% | 5.8%(-1.46)#99 | 6.8%(-2.38)#13,232 |
| 100. | 83840 | 4.4% | 5.8%(-1.47)#100 | 6.8%(-2.38)#13,238 |
Common Questions
What are the Top 10 Zip Codes with the Highest Percentage of Population Employed in Computer, Engineering & Science in Idaho?
Top 10 Zip Codes with the Highest Percentage of Population Employed in Computer, Engineering & Science in Idaho are:
What zip code has the Highest Percentage of Population Employed in Computer, Engineering & Science in Idaho?
83424 has the Highest Percentage of Population Employed in Computer, Engineering & Science in Idaho with 100.0%.
What is the Percentage of Population Employed in Computer, Engineering & Science in the State of Idaho?
Percentage of Population Employed in Computer, Engineering & Science in Idaho is 5.8%.
What is the Percentage of Population Employed in Computer, Engineering & Science in the United States?
Percentage of Population Employed in Computer, Engineering & Science in the United States is 6.8%.