Zip Codes with the Highest Percentage of Population Employed in Computer, Engineering & Science in Ohio
RELATED REPORTS & OPTIONS
Computer, Engineering & Science
Ohio
Compare Zip Codes
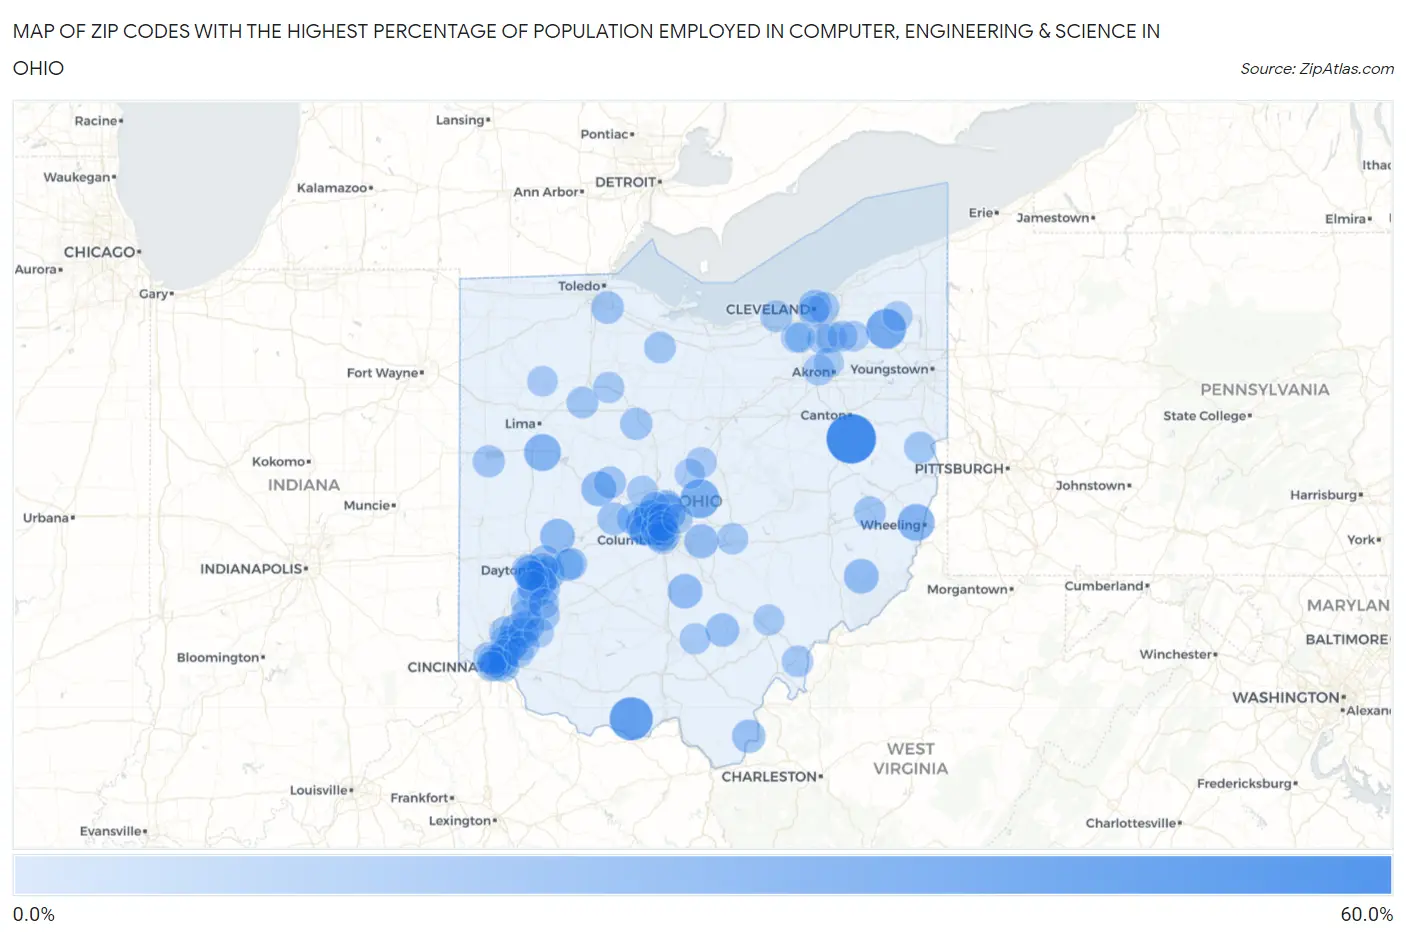
Map of Zip Codes with the Highest Percentage of Population Employed in Computer, Engineering & Science in Ohio
0.0%
60.0%
Zip Codes with the Highest Percentage of Population Employed in Computer, Engineering & Science in Ohio
| Zip Code | % Employed | vs State | vs National | |
| 1. | 44671 | 51.3% | 6.1%(+45.2)#1 | 6.8%(+44.5)#37 |
| 2. | 45616 | 37.2% | 6.1%(+31.2)#2 | 6.8%(+30.5)#109 |
| 3. | 43002 | 30.5% | 6.1%(+24.5)#3 | 6.8%(+23.8)#173 |
| 4. | 44080 | 30.0% | 6.1%(+23.9)#4 | 6.8%(+23.2)#178 |
| 5. | 43013 | 28.2% | 6.1%(+22.2)#5 | 6.8%(+21.5)#203 |
| 6. | 43934 | 23.8% | 6.1%(+17.7)#6 | 6.8%(+17.0)#309 |
| 7. | 45884 | 23.7% | 6.1%(+17.6)#7 | 6.8%(+16.9)#316 |
| 8. | 43240 | 23.6% | 6.1%(+17.6)#8 | 6.8%(+16.9)#319 |
| 9. | 43319 | 19.7% | 6.1%(+13.6)#9 | 6.8%(+12.9)#535 |
| 10. | 45349 | 19.5% | 6.1%(+13.4)#10 | 6.8%(+12.7)#556 |
| 11. | 43786 | 19.0% | 6.1%(+13.0)#11 | 6.8%(+12.3)#586 |
| 12. | 43154 | 18.7% | 6.1%(+12.7)#12 | 6.8%(+12.0)#617 |
| 13. | 45469 | 18.6% | 6.1%(+12.6)#13 | 6.8%(+11.9)#624 |
| 14. | 45434 | 18.3% | 6.1%(+12.2)#14 | 6.8%(+11.5)#654 |
| 15. | 43018 | 17.8% | 6.1%(+11.7)#15 | 6.8%(+11.0)#711 |
| 16. | 45040 | 17.2% | 6.1%(+11.2)#16 | 6.8%(+10.5)#792 |
| 17. | 43016 | 16.6% | 6.1%(+10.5)#17 | 6.8%(+9.83)#872 |
| 18. | 45622 | 16.4% | 6.1%(+10.3)#18 | 6.8%(+9.64)#901 |
| 19. | 45623 | 16.2% | 6.1%(+10.2)#19 | 6.8%(+9.47)#921 |
| 20. | 45430 | 16.0% | 6.1%(+9.91)#20 | 6.8%(+9.21)#961 |
| 21. | 44114 | 15.1% | 6.1%(+9.06)#21 | 6.8%(+8.36)#1,102 |
| 22. | 45249 | 15.1% | 6.1%(+9.00)#22 | 6.8%(+8.30)#1,111 |
| 23. | 45065 | 14.9% | 6.1%(+8.84)#23 | 6.8%(+8.14)#1,136 |
| 24. | 43463 | 14.7% | 6.1%(+8.61)#24 | 6.8%(+7.91)#1,183 |
| 25. | 43029 | 14.6% | 6.1%(+8.53)#25 | 6.8%(+7.83)#1,202 |
| 26. | 43035 | 14.3% | 6.1%(+8.25)#26 | 6.8%(+7.55)#1,261 |
| 27. | 43323 | 13.9% | 6.1%(+7.87)#27 | 6.8%(+7.17)#1,359 |
| 28. | 43017 | 13.9% | 6.1%(+7.83)#28 | 6.8%(+7.13)#1,375 |
| 29. | 45305 | 13.7% | 6.1%(+7.62)#29 | 6.8%(+6.92)#1,435 |
| 30. | 45866 | 13.6% | 6.1%(+7.57)#30 | 6.8%(+6.87)#1,447 |
| 31. | 43067 | 13.5% | 6.1%(+7.47)#31 | 6.8%(+6.77)#1,467 |
| 32. | 45433 | 13.4% | 6.1%(+7.37)#32 | 6.8%(+6.67)#1,500 |
| 33. | 43983 | 13.3% | 6.1%(+7.27)#33 | 6.8%(+6.57)#1,525 |
| 34. | 45202 | 13.3% | 6.1%(+7.21)#34 | 6.8%(+6.51)#1,548 |
| 35. | 43220 | 12.9% | 6.1%(+6.85)#35 | 6.8%(+6.15)#1,670 |
| 36. | 43930 | 12.9% | 6.1%(+6.85)#36 | 6.8%(+6.15)#1,671 |
| 37. | 45387 | 12.9% | 6.1%(+6.79)#37 | 6.8%(+6.09)#1,697 |
| 38. | 45054 | 12.8% | 6.1%(+6.72)#38 | 6.8%(+6.02)#1,719 |
| 39. | 44836 | 12.6% | 6.1%(+6.57)#39 | 6.8%(+5.87)#1,772 |
| 40. | 44011 | 12.6% | 6.1%(+6.57)#40 | 6.8%(+5.87)#1,777 |
| 41. | 45316 | 12.6% | 6.1%(+6.56)#41 | 6.8%(+5.86)#1,785 |
| 42. | 45841 | 12.5% | 6.1%(+6.41)#42 | 6.8%(+5.71)#1,838 |
| 43. | 45241 | 12.4% | 6.1%(+6.30)#43 | 6.8%(+5.60)#1,875 |
| 44. | 45242 | 12.2% | 6.1%(+6.10)#44 | 6.8%(+5.40)#1,961 |
| 45. | 45772 | 12.1% | 6.1%(+6.02)#45 | 6.8%(+5.33)#1,996 |
| 46. | 43064 | 12.1% | 6.1%(+6.02)#46 | 6.8%(+5.32)#1,999 |
| 47. | 45069 | 12.0% | 6.1%(+5.96)#47 | 6.8%(+5.26)#2,025 |
| 48. | 45431 | 12.0% | 6.1%(+5.92)#48 | 6.8%(+5.22)#2,044 |
| 49. | 43026 | 12.0% | 6.1%(+5.91)#49 | 6.8%(+5.21)#2,047 |
| 50. | 43030 | 11.9% | 6.1%(+5.86)#50 | 6.8%(+5.16)#2,069 |
| 51. | 45458 | 11.9% | 6.1%(+5.84)#51 | 6.8%(+5.14)#2,080 |
| 52. | 45209 | 11.8% | 6.1%(+5.78)#52 | 6.8%(+5.08)#2,111 |
| 53. | 43235 | 11.7% | 6.1%(+5.68)#53 | 6.8%(+4.98)#2,154 |
| 54. | 45236 | 11.7% | 6.1%(+5.67)#54 | 6.8%(+4.97)#2,161 |
| 55. | 44106 | 11.7% | 6.1%(+5.61)#55 | 6.8%(+4.91)#2,193 |
| 56. | 45208 | 11.6% | 6.1%(+5.57)#56 | 6.8%(+4.87)#2,216 |
| 57. | 45890 | 11.5% | 6.1%(+5.48)#57 | 6.8%(+4.78)#2,271 |
| 58. | 45402 | 11.5% | 6.1%(+5.39)#58 | 6.8%(+4.69)#2,321 |
| 59. | 45223 | 11.4% | 6.1%(+5.34)#59 | 6.8%(+4.64)#2,351 |
| 60. | 44113 | 11.4% | 6.1%(+5.34)#60 | 6.8%(+4.64)#2,353 |
| 61. | 43065 | 11.3% | 6.1%(+5.28)#61 | 6.8%(+4.58)#2,377 |
| 62. | 45213 | 11.3% | 6.1%(+5.26)#62 | 6.8%(+4.56)#2,394 |
| 63. | 43221 | 11.3% | 6.1%(+5.25)#63 | 6.8%(+4.55)#2,400 |
| 64. | 45761 | 11.2% | 6.1%(+5.18)#64 | 6.8%(+4.48)#2,441 |
| 65. | 44321 | 11.2% | 6.1%(+5.15)#65 | 6.8%(+4.45)#2,451 |
| 66. | 45647 | 11.2% | 6.1%(+5.11)#66 | 6.8%(+4.41)#2,470 |
| 67. | 45066 | 11.2% | 6.1%(+5.11)#67 | 6.8%(+4.41)#2,472 |
| 68. | 45226 | 11.2% | 6.1%(+5.10)#68 | 6.8%(+4.40)#2,481 |
| 69. | 45039 | 11.1% | 6.1%(+5.06)#69 | 6.8%(+4.36)#2,497 |
| 70. | 43061 | 11.1% | 6.1%(+5.00)#70 | 6.8%(+4.30)#2,531 |
| 71. | 43201 | 11.0% | 6.1%(+4.96)#71 | 6.8%(+4.26)#2,554 |
| 72. | 44067 | 10.8% | 6.1%(+4.75)#72 | 6.8%(+4.05)#2,670 |
| 73. | 43085 | 10.7% | 6.1%(+4.67)#73 | 6.8%(+3.97)#2,711 |
| 74. | 45440 | 10.6% | 6.1%(+4.57)#74 | 6.8%(+3.87)#2,775 |
| 75. | 43317 | 10.6% | 6.1%(+4.54)#75 | 6.8%(+3.84)#2,796 |
| 76. | 45206 | 10.6% | 6.1%(+4.52)#76 | 6.8%(+3.82)#2,805 |
| 77. | 45419 | 10.6% | 6.1%(+4.51)#77 | 6.8%(+3.81)#2,815 |
| 78. | 45459 | 10.5% | 6.1%(+4.47)#78 | 6.8%(+3.77)#2,845 |
| 79. | 45140 | 10.5% | 6.1%(+4.44)#79 | 6.8%(+3.74)#2,862 |
| 80. | 45848 | 10.4% | 6.1%(+4.35)#80 | 6.8%(+3.65)#2,922 |
| 81. | 45036 | 10.4% | 6.1%(+4.34)#81 | 6.8%(+3.64)#2,925 |
| 82. | 43215 | 10.3% | 6.1%(+4.25)#82 | 6.8%(+3.55)#2,979 |
| 83. | 44141 | 10.3% | 6.1%(+4.23)#83 | 6.8%(+3.53)#2,999 |
| 84. | 44202 | 10.2% | 6.1%(+4.18)#84 | 6.8%(+3.48)#3,036 |
| 85. | 45068 | 10.2% | 6.1%(+4.18)#85 | 6.8%(+3.48)#3,037 |
| 86. | 43202 | 10.2% | 6.1%(+4.17)#86 | 6.8%(+3.47)#3,043 |
| 87. | 44087 | 10.2% | 6.1%(+4.16)#87 | 6.8%(+3.46)#3,047 |
| 88. | 43212 | 10.2% | 6.1%(+4.13)#88 | 6.8%(+3.43)#3,080 |
| 89. | 43334 | 10.2% | 6.1%(+4.09)#89 | 6.8%(+3.39)#3,105 |
| 90. | 45220 | 10.1% | 6.1%(+3.99)#90 | 6.8%(+3.29)#3,176 |
| 91. | 44149 | 10.0% | 6.1%(+3.93)#91 | 6.8%(+3.23)#3,224 |
| 92. | 45409 | 10.0% | 6.1%(+3.93)#92 | 6.8%(+3.23)#3,226 |
| 93. | 45111 | 9.9% | 6.1%(+3.88)#93 | 6.8%(+3.18)#3,265 |
| 94. | 45203 | 9.8% | 6.1%(+3.77)#94 | 6.8%(+3.07)#3,340 |
| 95. | 43214 | 9.8% | 6.1%(+3.76)#95 | 6.8%(+3.06)#3,349 |
| 96. | 45152 | 9.7% | 6.1%(+3.64)#96 | 6.8%(+2.94)#3,438 |
| 97. | 44136 | 9.6% | 6.1%(+3.58)#97 | 6.8%(+2.88)#3,493 |
| 98. | 44313 | 9.6% | 6.1%(+3.52)#98 | 6.8%(+2.82)#3,540 |
| 99. | 43081 | 9.6% | 6.1%(+3.50)#99 | 6.8%(+2.80)#3,551 |
| 100. | 44439 | 9.5% | 6.1%(+3.48)#100 | 6.8%(+2.78)#3,560 |
Common Questions
What are the Top 10 Zip Codes with the Highest Percentage of Population Employed in Computer, Engineering & Science in Ohio?
Top 10 Zip Codes with the Highest Percentage of Population Employed in Computer, Engineering & Science in Ohio are:
What zip code has the Highest Percentage of Population Employed in Computer, Engineering & Science in Ohio?
44671 has the Highest Percentage of Population Employed in Computer, Engineering & Science in Ohio with 51.3%.
What is the Percentage of Population Employed in Computer, Engineering & Science in the State of Ohio?
Percentage of Population Employed in Computer, Engineering & Science in Ohio is 6.1%.
What is the Percentage of Population Employed in Computer, Engineering & Science in the United States?
Percentage of Population Employed in Computer, Engineering & Science in the United States is 6.8%.