Zip Codes with the Highest Percentage of Population Employed in Computer, Engineering & Science in Virginia
RELATED REPORTS & OPTIONS
Computer, Engineering & Science
Virginia
Compare Zip Codes
Map of Zip Codes with the Highest Percentage of Population Employed in Computer, Engineering & Science in Virginia
10.0%
50.0%
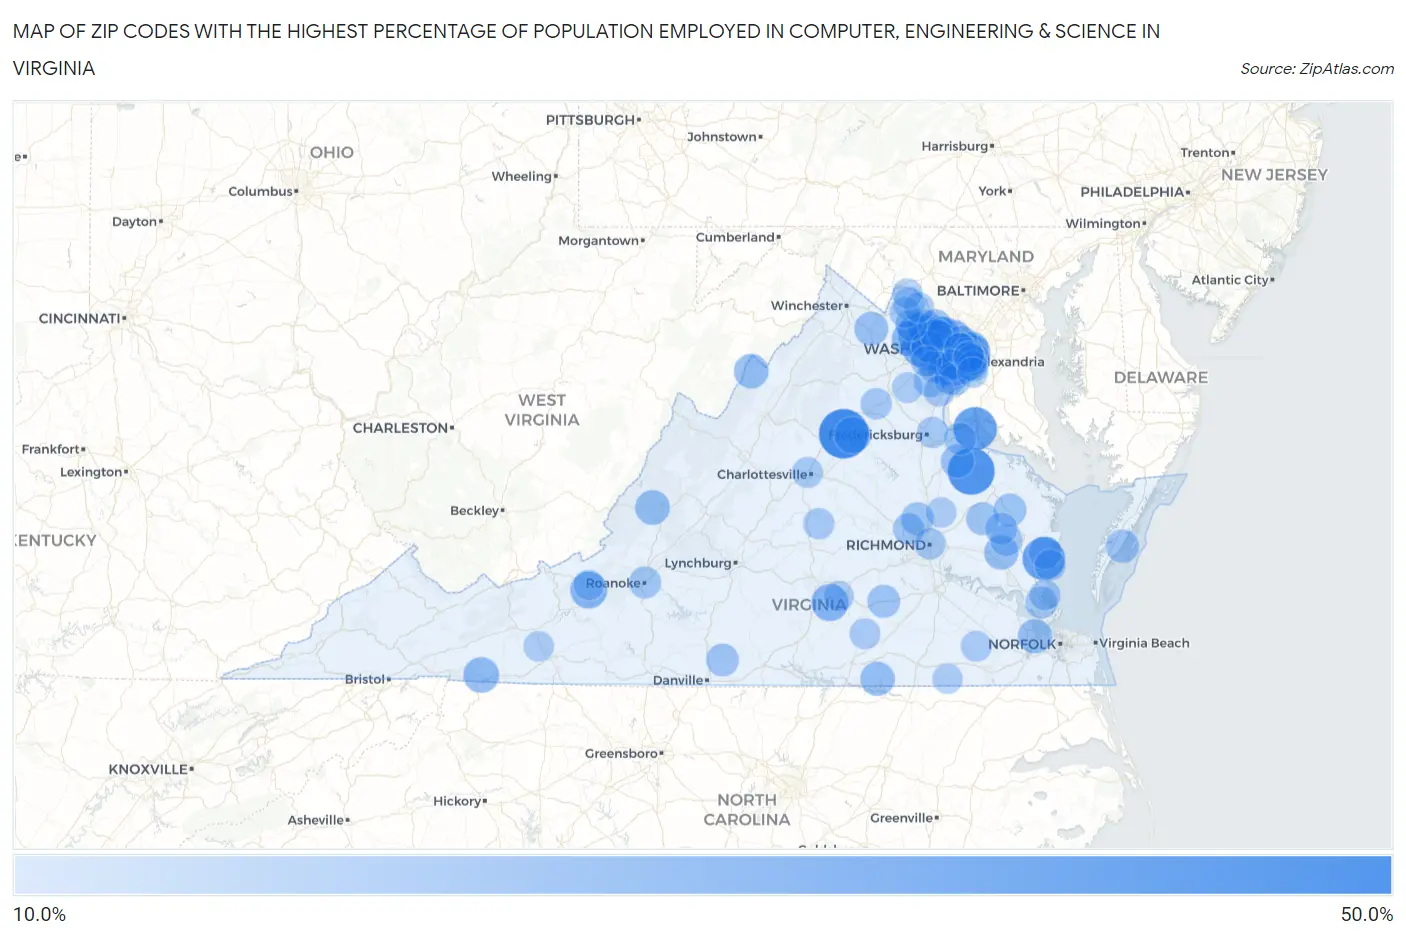
Zip Codes with the Highest Percentage of Population Employed in Computer, Engineering & Science in Virginia
| Zip Code | % Employed | vs State | vs National | |
| 1. | 22732 | 42.6% | 9.8% (+32.7)#1 | 6.8% (+35.8)#64 |
| 2. | 22476 | 38.5% | 9.8% (+28.6)#2 | 6.8% (+31.7)#91 |
| 3. | 22448 | 32.9% | 9.8% (+23.1)#3 | 6.8% (+26.1)#147 |
| 4. | 23128 | 31.9% | 9.8% (+22.1)#4 | 6.8% (+25.2)#157 |
| 5. | 20148 | 30.1% | 9.8% (+20.2)#5 | 6.8% (+23.3)#175 |
| 6. | 20171 | 26.9% | 9.8% (+17.0)#6 | 6.8% (+20.1)#234 |
| 7. | 20152 | 25.9% | 9.8% (+16.0)#7 | 6.8% (+19.1)#256 |
| 8. | 22102 | 24.8% | 9.8% (+15.0)#8 | 6.8% (+18.1)#282 |
| 9. | 20166 | 23.4% | 9.8% (+13.6)#9 | 6.8% (+16.7)#326 |
| 10. | 23942 | 23.4% | 9.8% (+13.6)#10 | 6.8% (+16.6)#328 |
| 11. | 20194 | 23.1% | 9.8% (+13.3)#11 | 6.8% (+16.3)#339 |
| 12. | 24061 | 22.9% | 9.8% (+13.1)#12 | 6.8% (+16.1)#352 |
| 13. | 22989 | 22.6% | 9.8% (+12.8)#13 | 6.8% (+15.9)#367 |
| 14. | 22033 | 22.1% | 9.8% (+12.3)#14 | 6.8% (+15.4)#384 |
| 15. | 20105 | 22.1% | 9.8% (+12.2)#15 | 6.8% (+15.3)#387 |
| 16. | 22203 | 21.9% | 9.8% (+12.1)#16 | 6.8% (+15.2)#394 |
| 17. | 22202 | 21.4% | 9.8% (+11.5)#17 | 6.8% (+14.6)#417 |
| 18. | 22180 | 21.3% | 9.8% (+11.4)#18 | 6.8% (+14.5)#426 |
| 19. | 24363 | 21.1% | 9.8% (+11.3)#19 | 6.8% (+14.3)#433 |
| 20. | 20190 | 20.9% | 9.8% (+11.0)#20 | 6.8% (+14.1)#450 |
| 21. | 22182 | 20.7% | 9.8% (+10.9)#21 | 6.8% (+13.9)#458 |
| 22. | 22181 | 20.6% | 9.8% (+10.8)#22 | 6.8% (+13.9)#462 |
| 23. | 22201 | 20.1% | 9.8% (+10.3)#23 | 6.8% (+13.3)#502 |
| 24. | 20147 | 20.0% | 9.8% (+10.1)#24 | 6.8% (+13.2)#517 |
| 25. | 22031 | 20.0% | 9.8% (+10.1)#25 | 6.8% (+13.2)#518 |
| 26. | 22027 | 19.9% | 9.8% (+10.1)#26 | 6.8% (+13.2)#521 |
| 27. | 24457 | 19.7% | 9.8% (+9.84)#27 | 6.8% (+12.9)#537 |
| 28. | 22209 | 19.5% | 9.8% (+9.69)#28 | 6.8% (+12.7)#552 |
| 29. | 22301 | 19.5% | 9.8% (+9.68)#29 | 6.8% (+12.7)#555 |
| 30. | 22820 | 19.4% | 9.8% (+9.57)#30 | 6.8% (+12.6)#563 |
| 31. | 20191 | 19.3% | 9.8% (+9.48)#31 | 6.8% (+12.5)#570 |
| 32. | 22043 | 19.2% | 9.8% (+9.42)#32 | 6.8% (+12.5)#574 |
| 33. | 23011 | 19.0% | 9.8% (+9.16)#33 | 6.8% (+12.2)#595 |
| 34. | 23436 | 19.0% | 9.8% (+9.14)#34 | 6.8% (+12.2)#596 |
| 35. | 23857 | 18.9% | 9.8% (+9.05)#35 | 6.8% (+12.1)#604 |
| 36. | 22030 | 18.7% | 9.8% (+8.90)#36 | 6.8% (+11.9)#620 |
| 37. | 20165 | 18.6% | 9.8% (+8.75)#37 | 6.8% (+11.8)#629 |
| 38. | 20130 | 18.3% | 9.8% (+8.49)#38 | 6.8% (+11.5)#647 |
| 39. | 20120 | 18.1% | 9.8% (+8.26)#39 | 6.8% (+11.3)#673 |
| 40. | 22101 | 17.9% | 9.8% (+8.09)#40 | 6.8% (+11.1)#691 |
| 41. | 22310 | 17.8% | 9.8% (+7.93)#41 | 6.8% (+11.0)#717 |
| 42. | 22032 | 17.7% | 9.8% (+7.93)#42 | 6.8% (+11.0)#718 |
| 43. | 22535 | 17.7% | 9.8% (+7.92)#43 | 6.8% (+11.0)#722 |
| 44. | 22315 | 17.7% | 9.8% (+7.91)#44 | 6.8% (+11.0)#724 |
| 45. | 22124 | 17.7% | 9.8% (+7.87)#45 | 6.8% (+10.9)#727 |
| 46. | 23423 | 17.4% | 9.8% (+7.61)#46 | 6.8% (+10.7)#759 |
| 47. | 22046 | 17.3% | 9.8% (+7.49)#47 | 6.8% (+10.5)#780 |
| 48. | 22153 | 17.2% | 9.8% (+7.40)#48 | 6.8% (+10.5)#791 |
| 49. | 22015 | 17.1% | 9.8% (+7.31)#49 | 6.8% (+10.4)#798 |
| 50. | 23050 | 17.1% | 9.8% (+7.28)#50 | 6.8% (+10.3)#799 |
| 51. | 23894 | 17.0% | 9.8% (+7.16)#51 | 6.8% (+10.2)#815 |
| 52. | 22504 | 16.9% | 9.8% (+7.08)#52 | 6.8% (+10.1)#827 |
| 53. | 22039 | 16.9% | 9.8% (+7.05)#53 | 6.8% (+10.1)#833 |
| 54. | 23059 | 16.9% | 9.8% (+7.03)#54 | 6.8% (+10.1)#836 |
| 55. | 23177 | 16.8% | 9.8% (+6.95)#55 | 6.8% (+10.0)#845 |
| 56. | 24566 | 16.5% | 9.8% (+6.72)#56 | 6.8% (+9.77)#880 |
| 57. | 22303 | 16.5% | 9.8% (+6.64)#57 | 6.8% (+9.69)#897 |
| 58. | 20124 | 16.4% | 9.8% (+6.60)#58 | 6.8% (+9.65)#899 |
| 59. | 22204 | 16.2% | 9.8% (+6.38)#59 | 6.8% (+9.44)#924 |
| 60. | 23110 | 16.2% | 9.8% (+6.37)#60 | 6.8% (+9.43)#926 |
| 61. | 20151 | 16.1% | 9.8% (+6.24)#61 | 6.8% (+9.30)#948 |
| 62. | 24011 | 16.0% | 9.8% (+6.20)#62 | 6.8% (+9.25)#953 |
| 63. | 23091 | 15.8% | 9.8% (+6.01)#63 | 6.8% (+9.06)#985 |
| 64. | 22066 | 15.8% | 9.8% (+5.98)#64 | 6.8% (+9.04)#992 |
| 65. | 23693 | 15.8% | 9.8% (+5.95)#65 | 6.8% (+9.00)#998 |
| 66. | 22485 | 15.6% | 9.8% (+5.82)#66 | 6.8% (+8.88)#1,011 |
| 67. | 20170 | 15.5% | 9.8% (+5.68)#67 | 6.8% (+8.73)#1,027 |
| 68. | 20112 | 15.5% | 9.8% (+5.66)#68 | 6.8% (+8.72)#1,033 |
| 69. | 23233 | 15.3% | 9.8% (+5.49)#69 | 6.8% (+8.54)#1,070 |
| 70. | 20175 | 15.2% | 9.8% (+5.43)#70 | 6.8% (+8.48)#1,077 |
| 71. | 22125 | 15.2% | 9.8% (+5.42)#71 | 6.8% (+8.48)#1,079 |
| 72. | 22213 | 15.0% | 9.8% (+5.18)#72 | 6.8% (+8.23)#1,123 |
| 73. | 20197 | 14.9% | 9.8% (+5.10)#73 | 6.8% (+8.15)#1,134 |
| 74. | 23219 | 14.8% | 9.8% (+5.01)#74 | 6.8% (+8.06)#1,146 |
| 75. | 22206 | 14.7% | 9.8% (+4.87)#75 | 6.8% (+7.93)#1,180 |
| 76. | 22714 | 14.5% | 9.8% (+4.68)#76 | 6.8% (+7.73)#1,225 |
| 77. | 23056 | 14.4% | 9.8% (+4.60)#77 | 6.8% (+7.66)#1,238 |
| 78. | 22405 | 14.4% | 9.8% (+4.59)#78 | 6.8% (+7.65)#1,240 |
| 79. | 22314 | 14.4% | 9.8% (+4.58)#79 | 6.8% (+7.63)#1,244 |
| 80. | 23004 | 14.4% | 9.8% (+4.58)#80 | 6.8% (+7.63)#1,246 |
| 81. | 20158 | 14.0% | 9.8% (+4.21)#81 | 6.8% (+7.26)#1,329 |
| 82. | 22904 | 14.0% | 9.8% (+4.18)#82 | 6.8% (+7.24)#1,334 |
| 83. | 22079 | 14.0% | 9.8% (+4.18)#83 | 6.8% (+7.23)#1,336 |
| 84. | 23696 | 13.9% | 9.8% (+4.11)#84 | 6.8% (+7.16)#1,363 |
| 85. | 23878 | 13.9% | 9.8% (+4.06)#85 | 6.8% (+7.11)#1,381 |
| 86. | 22152 | 13.9% | 9.8% (+4.05)#86 | 6.8% (+7.10)#1,383 |
| 87. | 22025 | 13.8% | 9.8% (+3.99)#87 | 6.8% (+7.05)#1,395 |
| 88. | 20119 | 13.8% | 9.8% (+3.93)#88 | 6.8% (+6.99)#1,417 |
| 89. | 23938 | 13.8% | 9.8% (+3.93)#89 | 6.8% (+6.99)#1,419 |
| 90. | 20121 | 13.7% | 9.8% (+3.93)#90 | 6.8% (+6.98)#1,420 |
| 91. | 22307 | 13.7% | 9.8% (+3.84)#91 | 6.8% (+6.90)#1,440 |
| 92. | 22302 | 13.6% | 9.8% (+3.75)#92 | 6.8% (+6.80)#1,459 |
| 93. | 22308 | 13.5% | 9.8% (+3.65)#93 | 6.8% (+6.70)#1,485 |
| 94. | 20176 | 13.4% | 9.8% (+3.57)#94 | 6.8% (+6.62)#1,509 |
| 95. | 24312 | 13.3% | 9.8% (+3.47)#95 | 6.8% (+6.52)#1,543 |
| 96. | 23069 | 13.2% | 9.8% (+3.42)#96 | 6.8% (+6.47)#1,561 |
| 97. | 24060 | 13.2% | 9.8% (+3.41)#97 | 6.8% (+6.47)#1,562 |
| 98. | 20180 | 13.1% | 9.8% (+3.32)#98 | 6.8% (+6.37)#1,590 |
| 99. | 23922 | 13.1% | 9.8% (+3.30)#99 | 6.8% (+6.35)#1,595 |
| 100. | 23828 | 13.0% | 9.8% (+3.19)#100 | 6.8% (+6.24)#1,647 |
Common Questions
What are the Top 10 Zip Codes with the Highest Percentage of Population Employed in Computer, Engineering & Science in Virginia?
Top 10 Zip Codes with the Highest Percentage of Population Employed in Computer, Engineering & Science in Virginia are:
What zip code has the Highest Percentage of Population Employed in Computer, Engineering & Science in Virginia?
22732 has the Highest Percentage of Population Employed in Computer, Engineering & Science in Virginia with 42.6%.
What is the Percentage of Population Employed in Computer, Engineering & Science in the State of Virginia?
Percentage of Population Employed in Computer, Engineering & Science in Virginia is 9.8%.
What is the Percentage of Population Employed in Computer, Engineering & Science in the United States?
Percentage of Population Employed in Computer, Engineering & Science in the United States is 6.8%.