Zip Codes with the Highest Percentage of Population Employed in Computer, Engineering & Science in Hawaii
RELATED REPORTS & OPTIONS
Computer, Engineering & Science
Hawaii
Compare Zip Codes
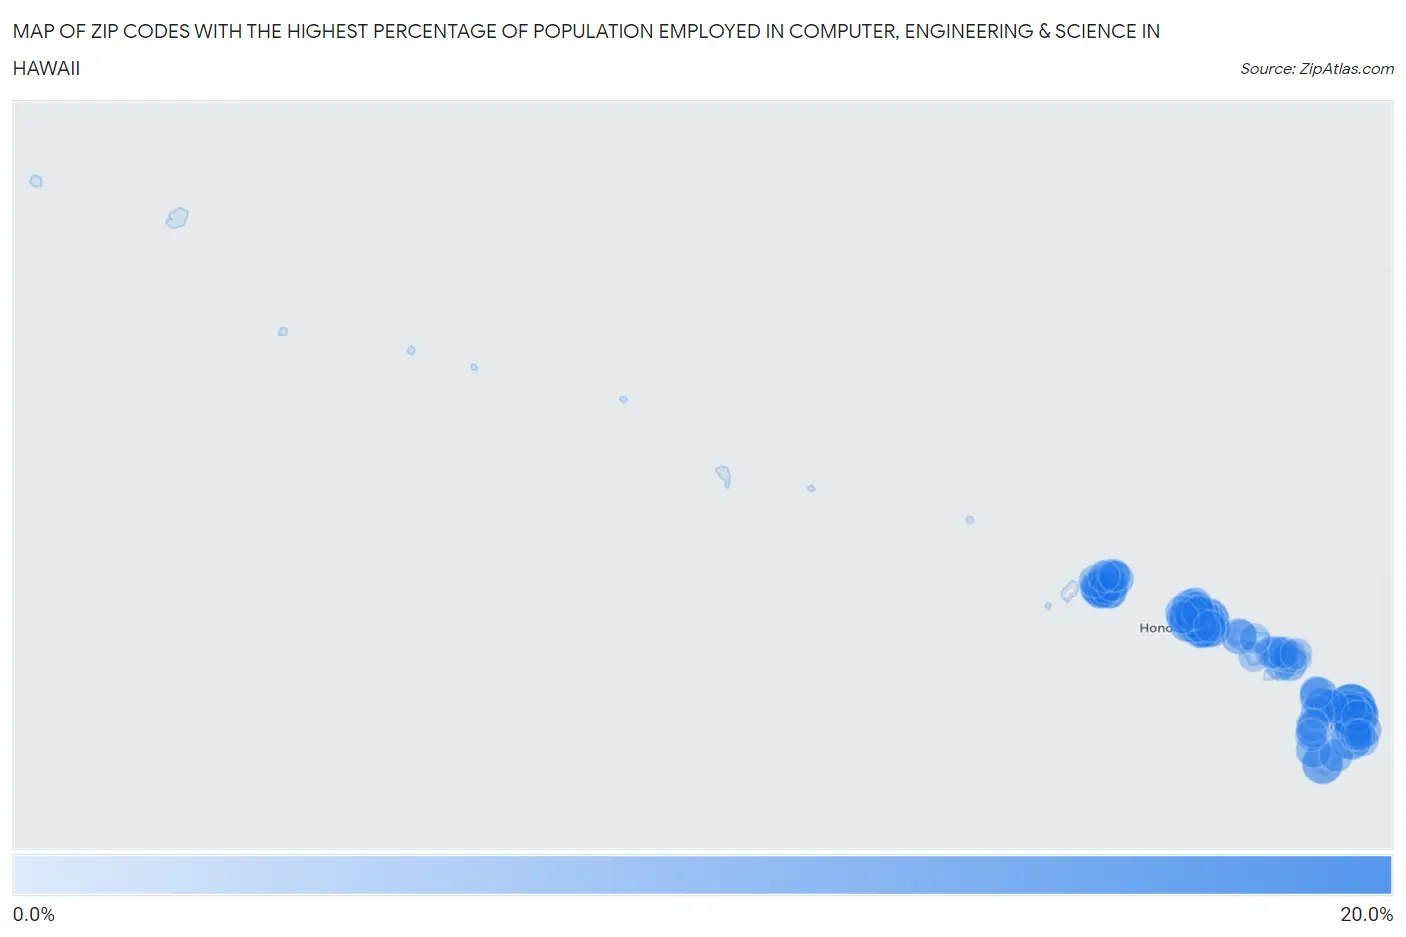
Map of Zip Codes with the Highest Percentage of Population Employed in Computer, Engineering & Science in Hawaii
0.0%
20.0%
Zip Codes with the Highest Percentage of Population Employed in Computer, Engineering & Science in Hawaii
| Zip Code | % Employed | vs State | vs National | |
| 1. | 96780 | 20.0% | 5.2%(+14.8)#1 | 6.8%(+13.2)#505 |
| 2. | 96728 | 14.4% | 5.2%(+9.18)#2 | 6.8%(+7.59)#1,253 |
| 3. | 96863 | 13.7% | 5.2%(+8.55)#3 | 6.8%(+6.96)#1,425 |
| 4. | 96710 | 11.5% | 5.2%(+6.31)#4 | 6.8%(+4.72)#2,304 |
| 5. | 96785 | 11.3% | 5.2%(+6.16)#5 | 6.8%(+4.58)#2,382 |
| 6. | 96772 | 10.4% | 5.2%(+5.22)#6 | 6.8%(+3.63)#2,933 |
| 7. | 96857 | 9.9% | 5.2%(+4.77)#7 | 6.8%(+3.18)#3,263 |
| 8. | 96813 | 9.5% | 5.2%(+4.34)#8 | 6.8%(+2.76)#3,583 |
| 9. | 96701 | 9.0% | 5.2%(+3.83)#9 | 6.8%(+2.25)#4,058 |
| 10. | 96814 | 8.9% | 5.2%(+3.75)#10 | 6.8%(+2.16)#4,141 |
| 11. | 96848 | 8.3% | 5.2%(+3.12)#11 | 6.8%(+1.54)#4,862 |
| 12. | 96822 | 7.9% | 5.2%(+2.75)#12 | 6.8%(+1.17)#5,364 |
| 13. | 96755 | 7.9% | 5.2%(+2.67)#13 | 6.8%(+1.09)#5,478 |
| 14. | 96744 | 7.7% | 5.2%(+2.50)#14 | 6.8%(+0.910)#5,716 |
| 15. | 96816 | 7.6% | 5.2%(+2.43)#15 | 6.8%(+0.845)#5,819 |
| 16. | 96765 | 7.1% | 5.2%(+1.91)#16 | 6.8%(+0.327)#6,645 |
| 17. | 96825 | 6.9% | 5.2%(+1.76)#17 | 6.8%(+0.178)#6,897 |
| 18. | 96821 | 6.9% | 5.2%(+1.67)#18 | 6.8%(+0.088)#7,058 |
| 19. | 96781 | 6.7% | 5.2%(+1.53)#19 | 6.8%(-0.053)#7,326 |
| 20. | 96789 | 6.4% | 5.2%(+1.20)#20 | 6.8%(-0.389)#7,968 |
| 21. | 96747 | 6.3% | 5.2%(+1.15)#21 | 6.8%(-0.440)#8,084 |
| 22. | 96769 | 6.2% | 5.2%(+0.975)#22 | 6.8%(-0.611)#8,457 |
| 23. | 96782 | 6.1% | 5.2%(+0.962)#23 | 6.8%(-0.623)#8,485 |
| 24. | 96720 | 6.1% | 5.2%(+0.925)#24 | 6.8%(-0.661)#8,587 |
| 25. | 96707 | 6.0% | 5.2%(+0.865)#25 | 6.8%(-0.720)#8,724 |
| 26. | 96815 | 6.0% | 5.2%(+0.818)#26 | 6.8%(-0.767)#8,849 |
| 27. | 96712 | 6.0% | 5.2%(+0.805)#27 | 6.8%(-0.781)#8,873 |
| 28. | 96734 | 5.9% | 5.2%(+0.748)#28 | 6.8%(-0.837)#9,007 |
| 29. | 96818 | 5.9% | 5.2%(+0.737)#29 | 6.8%(-0.849)#9,030 |
| 30. | 96826 | 5.6% | 5.2%(+0.418)#30 | 6.8%(-1.17)#9,808 |
| 31. | 96770 | 5.6% | 5.2%(+0.377)#31 | 6.8%(-1.21)#9,921 |
| 32. | 96706 | 5.5% | 5.2%(+0.320)#32 | 6.8%(-1.27)#10,076 |
| 33. | 96704 | 5.4% | 5.2%(+0.193)#33 | 6.8%(-1.39)#10,405 |
| 34. | 96725 | 5.3% | 5.2%(+0.169)#34 | 6.8%(-1.42)#10,464 |
| 35. | 96730 | 5.2% | 5.2%(+0.022)#35 | 6.8%(-1.56)#10,815 |
| 36. | 96796 | 5.0% | 5.2%(-0.194)#36 | 6.8%(-1.78)#11,422 |
| 37. | 96749 | 4.8% | 5.2%(-0.392)#37 | 6.8%(-1.98)#11,975 |
| 38. | 96746 | 4.6% | 5.2%(-0.550)#38 | 6.8%(-2.14)#12,410 |
| 39. | 96797 | 4.6% | 5.2%(-0.585)#39 | 6.8%(-2.17)#12,509 |
| 40. | 96731 | 4.5% | 5.2%(-0.646)#40 | 6.8%(-2.23)#12,723 |
| 41. | 96762 | 4.5% | 5.2%(-0.654)#41 | 6.8%(-2.24)#12,747 |
| 42. | 96716 | 4.5% | 5.2%(-0.672)#42 | 6.8%(-2.26)#12,804 |
| 43. | 96743 | 4.5% | 5.2%(-0.721)#43 | 6.8%(-2.31)#12,958 |
| 44. | 96790 | 4.3% | 5.2%(-0.924)#44 | 6.8%(-2.51)#13,657 |
| 45. | 96756 | 4.2% | 5.2%(-0.954)#45 | 6.8%(-2.54)#13,761 |
| 46. | 96817 | 4.1% | 5.2%(-1.06)#46 | 6.8%(-2.64)#14,092 |
| 47. | 96791 | 4.0% | 5.2%(-1.14)#47 | 6.8%(-2.73)#14,377 |
| 48. | 96764 | 3.9% | 5.2%(-1.31)#48 | 6.8%(-2.90)#14,923 |
| 49. | 96819 | 3.5% | 5.2%(-1.64)#49 | 6.8%(-3.23)#16,131 |
| 50. | 96786 | 3.5% | 5.2%(-1.66)#50 | 6.8%(-3.25)#16,192 |
| 51. | 96753 | 3.5% | 5.2%(-1.66)#51 | 6.8%(-3.25)#16,195 |
| 52. | 96722 | 3.5% | 5.2%(-1.69)#52 | 6.8%(-3.28)#16,321 |
| 53. | 96727 | 3.4% | 5.2%(-1.74)#53 | 6.8%(-3.33)#16,494 |
| 54. | 96777 | 3.3% | 5.2%(-1.87)#54 | 6.8%(-3.45)#16,967 |
| 55. | 96738 | 3.0% | 5.2%(-2.19)#55 | 6.8%(-3.78)#18,160 |
| 56. | 96732 | 2.8% | 5.2%(-2.41)#56 | 6.8%(-4.00)#18,985 |
| 57. | 96793 | 2.7% | 5.2%(-2.53)#57 | 6.8%(-4.11)#19,436 |
| 58. | 96717 | 2.6% | 5.2%(-2.57)#58 | 6.8%(-4.16)#19,632 |
| 59. | 96705 | 2.6% | 5.2%(-2.60)#59 | 6.8%(-4.19)#19,758 |
| 60. | 96768 | 2.5% | 5.2%(-2.64)#60 | 6.8%(-4.22)#19,880 |
| 61. | 96741 | 2.5% | 5.2%(-2.71)#61 | 6.8%(-4.30)#20,147 |
| 62. | 96792 | 2.2% | 5.2%(-2.96)#62 | 6.8%(-4.54)#21,017 |
| 63. | 96752 | 2.2% | 5.2%(-2.97)#63 | 6.8%(-4.55)#21,055 |
| 64. | 96740 | 2.2% | 5.2%(-3.02)#64 | 6.8%(-4.61)#21,236 |
| 65. | 96766 | 2.1% | 5.2%(-3.06)#65 | 6.8%(-4.65)#21,405 |
| 66. | 96719 | 2.1% | 5.2%(-3.07)#66 | 6.8%(-4.66)#21,456 |
| 67. | 96754 | 2.0% | 5.2%(-3.19)#67 | 6.8%(-4.77)#21,899 |
| 68. | 96761 | 1.8% | 5.2%(-3.41)#68 | 6.8%(-4.99)#22,673 |
| 69. | 96778 | 1.8% | 5.2%(-3.42)#69 | 6.8%(-5.01)#22,730 |
| 70. | 96750 | 1.5% | 5.2%(-3.65)#70 | 6.8%(-5.24)#23,523 |
| 71. | 96795 | 1.4% | 5.2%(-3.77)#71 | 6.8%(-5.35)#23,866 |
| 72. | 96783 | 1.4% | 5.2%(-3.80)#72 | 6.8%(-5.39)#23,961 |
| 73. | 96703 | 1.4% | 5.2%(-3.80)#73 | 6.8%(-5.39)#23,979 |
| 74. | 96714 | 1.3% | 5.2%(-3.90)#74 | 6.8%(-5.49)#24,274 |
| 75. | 96779 | 1.3% | 5.2%(-3.91)#75 | 6.8%(-5.50)#24,312 |
| 76. | 96771 | 1.2% | 5.2%(-3.95)#76 | 6.8%(-5.53)#24,413 |
| 77. | 96760 | 1.2% | 5.2%(-4.02)#77 | 6.8%(-5.61)#24,629 |
| 78. | 96708 | 1.0% | 5.2%(-4.14)#78 | 6.8%(-5.72)#24,944 |
| 79. | 96729 | 0.60% | 5.2%(-4.58)#79 | 6.8%(-6.16)#26,007 |
| 80. | 96763 | 0.59% | 5.2%(-4.59)#80 | 6.8%(-6.17)#26,037 |
| 81. | 96748 | 0.41% | 5.2%(-4.77)#81 | 6.8%(-6.35)#26,346 |
1
Common Questions
What are the Top 10 Zip Codes with the Highest Percentage of Population Employed in Computer, Engineering & Science in Hawaii?
Top 10 Zip Codes with the Highest Percentage of Population Employed in Computer, Engineering & Science in Hawaii are:
What zip code has the Highest Percentage of Population Employed in Computer, Engineering & Science in Hawaii?
96780 has the Highest Percentage of Population Employed in Computer, Engineering & Science in Hawaii with 20.0%.
What is the Percentage of Population Employed in Computer, Engineering & Science in the State of Hawaii?
Percentage of Population Employed in Computer, Engineering & Science in Hawaii is 5.2%.
What is the Percentage of Population Employed in Computer, Engineering & Science in the United States?
Percentage of Population Employed in Computer, Engineering & Science in the United States is 6.8%.