Zip Codes with the Highest Percentage of Population Employed in Computer, Engineering & Science in Oregon
RELATED REPORTS & OPTIONS
Computer, Engineering & Science
Oregon
Compare Zip Codes
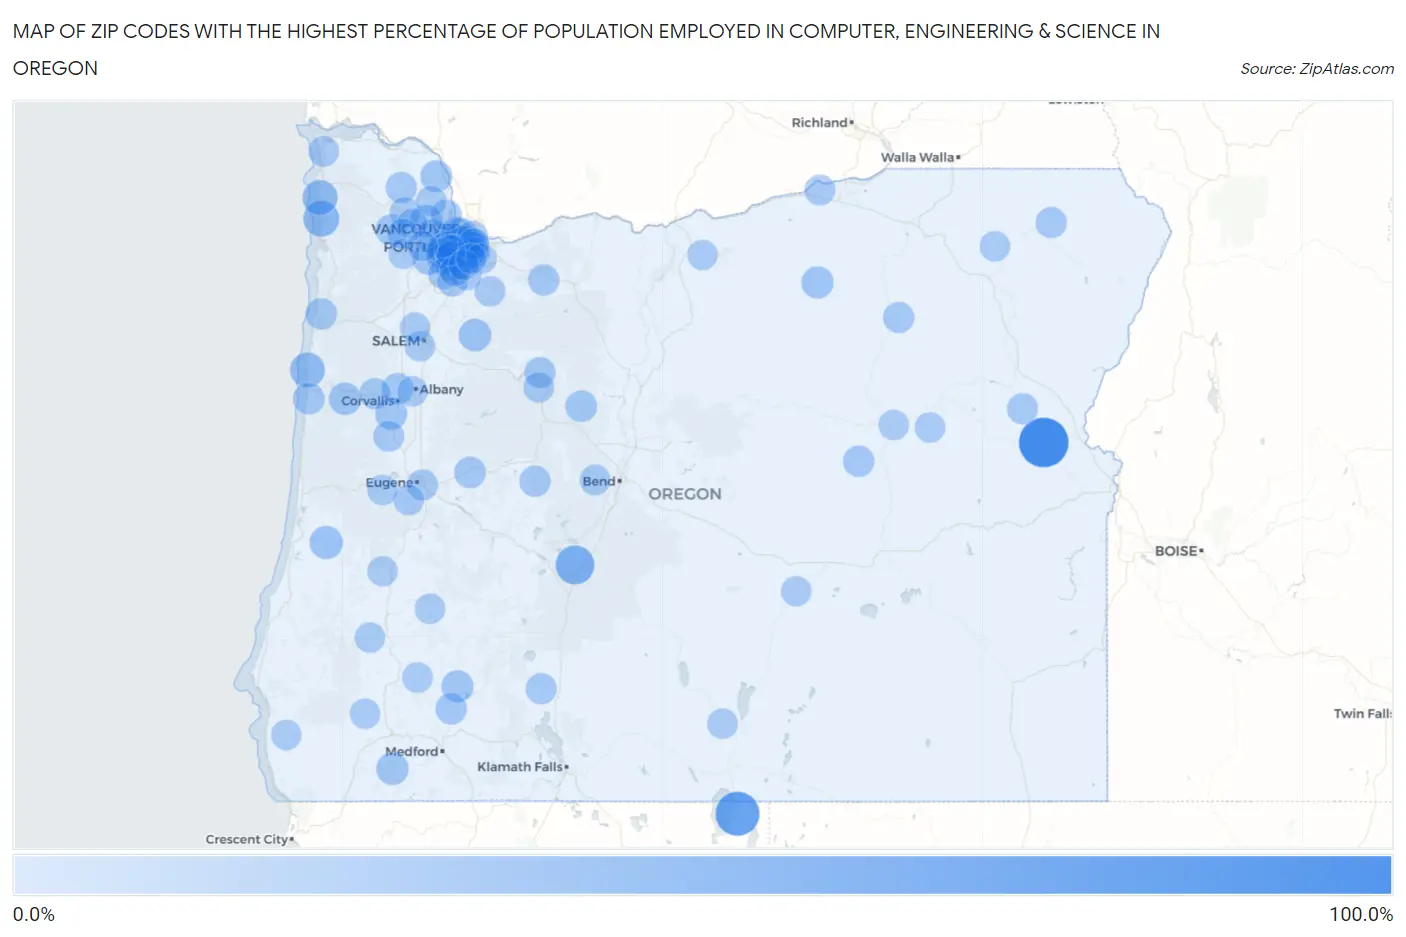
Map of Zip Codes with the Highest Percentage of Population Employed in Computer, Engineering & Science in Oregon
0.0%
100.0%
Zip Codes with the Highest Percentage of Population Employed in Computer, Engineering & Science in Oregon
| Zip Code | % Employed | vs State | vs National | |
| 1. | 97903 | 100.0% | 7.5%(+92.5)#1 | 6.8%(+93.2)#8 |
| 2. | 97635 | 72.2% | 7.5%(+64.6)#2 | 6.8%(+65.4)#16 |
| 3. | 97737 | 46.8% | 7.5%(+39.2)#3 | 6.8%(+40.0)#50 |
| 4. | 97130 | 33.3% | 7.5%(+25.8)#4 | 6.8%(+26.6)#142 |
| 5. | 97102 | 28.6% | 7.5%(+21.0)#5 | 6.8%(+21.8)#193 |
| 6. | 97369 | 27.8% | 7.5%(+20.2)#6 | 6.8%(+21.0)#215 |
| 7. | 97229 | 22.1% | 7.5%(+14.5)#7 | 6.8%(+15.3)#386 |
| 8. | 97473 | 20.8% | 7.5%(+13.2)#8 | 6.8%(+14.0)#455 |
| 9. | 97124 | 20.7% | 7.5%(+13.1)#9 | 6.8%(+13.9)#459 |
| 10. | 97006 | 18.5% | 7.5%(+11.0)#10 | 6.8%(+11.8)#632 |
| 11. | 97375 | 17.5% | 7.5%(+10.0)#11 | 6.8%(+10.8)#746 |
| 12. | 97133 | 17.3% | 7.5%(+9.79)#12 | 6.8%(+10.6)#770 |
| 13. | 97544 | 17.0% | 7.5%(+9.49)#13 | 6.8%(+10.3)#809 |
| 14. | 97205 | 16.6% | 7.5%(+9.07)#14 | 6.8%(+9.85)#869 |
| 15. | 97343 | 16.6% | 7.5%(+9.03)#15 | 6.8%(+9.81)#873 |
| 16. | 97836 | 15.5% | 7.5%(+7.97)#16 | 6.8%(+8.75)#1,025 |
| 17. | 97333 | 15.1% | 7.5%(+7.60)#17 | 6.8%(+8.38)#1,098 |
| 18. | 97541 | 14.9% | 7.5%(+7.32)#18 | 6.8%(+8.10)#1,140 |
| 19. | 97123 | 14.7% | 7.5%(+7.19)#19 | 6.8%(+7.97)#1,167 |
| 20. | 97212 | 14.5% | 7.5%(+6.98)#20 | 6.8%(+7.76)#1,215 |
| 21. | 97201 | 14.2% | 7.5%(+6.62)#21 | 6.8%(+7.40)#1,297 |
| 22. | 97221 | 14.1% | 7.5%(+6.54)#22 | 6.8%(+7.32)#1,312 |
| 23. | 97209 | 13.7% | 7.5%(+6.16)#23 | 6.8%(+6.94)#1,431 |
| 24. | 97054 | 13.5% | 7.5%(+5.98)#24 | 6.8%(+6.76)#1,471 |
| 25. | 97210 | 13.4% | 7.5%(+5.82)#25 | 6.8%(+6.60)#1,515 |
| 26. | 97003 | 13.3% | 7.5%(+5.71)#26 | 6.8%(+6.49)#1,554 |
| 27. | 97366 | 13.2% | 7.5%(+5.65)#27 | 6.8%(+6.44)#1,569 |
| 28. | 97035 | 13.1% | 7.5%(+5.53)#28 | 6.8%(+6.31)#1,622 |
| 29. | 97730 | 13.0% | 7.5%(+5.44)#29 | 6.8%(+6.22)#1,650 |
| 30. | 97489 | 12.8% | 7.5%(+5.30)#30 | 6.8%(+6.08)#1,700 |
| 31. | 97330 | 12.8% | 7.5%(+5.23)#31 | 6.8%(+6.01)#1,723 |
| 32. | 97007 | 12.8% | 7.5%(+5.22)#32 | 6.8%(+6.00)#1,725 |
| 33. | 97232 | 12.6% | 7.5%(+5.05)#33 | 6.8%(+5.83)#1,792 |
| 34. | 97214 | 12.4% | 7.5%(+4.87)#34 | 6.8%(+5.65)#1,860 |
| 35. | 97215 | 12.3% | 7.5%(+4.77)#35 | 6.8%(+5.55)#1,887 |
| 36. | 97539 | 12.2% | 7.5%(+4.69)#36 | 6.8%(+5.47)#1,930 |
| 37. | 97117 | 12.2% | 7.5%(+4.67)#37 | 6.8%(+5.45)#1,935 |
| 38. | 97224 | 12.1% | 7.5%(+4.54)#38 | 6.8%(+5.32)#1,998 |
| 39. | 97067 | 12.1% | 7.5%(+4.53)#39 | 6.8%(+5.31)#2,002 |
| 40. | 97149 | 12.0% | 7.5%(+4.50)#40 | 6.8%(+5.28)#2,018 |
| 41. | 97239 | 11.9% | 7.5%(+4.39)#41 | 6.8%(+5.17)#2,064 |
| 42. | 97820 | 11.9% | 7.5%(+4.33)#42 | 6.8%(+5.11)#2,098 |
| 43. | 97223 | 11.8% | 7.5%(+4.24)#43 | 6.8%(+5.02)#2,138 |
| 44. | 97217 | 11.7% | 7.5%(+4.18)#44 | 6.8%(+4.96)#2,162 |
| 45. | 97064 | 11.5% | 7.5%(+4.00)#45 | 6.8%(+4.78)#2,270 |
| 46. | 97219 | 11.4% | 7.5%(+3.87)#46 | 6.8%(+4.65)#2,350 |
| 47. | 97370 | 11.4% | 7.5%(+3.82)#47 | 6.8%(+4.60)#2,371 |
| 48. | 97202 | 11.0% | 7.5%(+3.43)#48 | 6.8%(+4.21)#2,584 |
| 49. | 97413 | 11.0% | 7.5%(+3.42)#49 | 6.8%(+4.20)#2,597 |
| 50. | 97203 | 10.7% | 7.5%(+3.12)#50 | 6.8%(+3.90)#2,747 |
| 51. | 97880 | 10.7% | 7.5%(+3.11)#51 | 6.8%(+3.89)#2,757 |
| 52. | 97206 | 10.5% | 7.5%(+2.95)#52 | 6.8%(+3.73)#2,871 |
| 53. | 97626 | 10.4% | 7.5%(+2.90)#53 | 6.8%(+3.68)#2,901 |
| 54. | 97403 | 10.4% | 7.5%(+2.82)#54 | 6.8%(+3.60)#2,959 |
| 55. | 97231 | 10.3% | 7.5%(+2.76)#55 | 6.8%(+3.54)#2,988 |
| 56. | 97211 | 10.3% | 7.5%(+2.76)#56 | 6.8%(+3.54)#2,991 |
| 57. | 97225 | 10.2% | 7.5%(+2.70)#57 | 6.8%(+3.48)#3,034 |
| 58. | 97078 | 10.2% | 7.5%(+2.66)#58 | 6.8%(+3.44)#3,068 |
| 59. | 97885 | 10.2% | 7.5%(+2.61)#59 | 6.8%(+3.39)#3,109 |
| 60. | 97342 | 10.0% | 7.5%(+2.45)#60 | 6.8%(+3.24)#3,219 |
| 61. | 97819 | 10.0% | 7.5%(+2.45)#61 | 6.8%(+3.24)#3,222 |
| 62. | 97008 | 10.0% | 7.5%(+2.41)#62 | 6.8%(+3.19)#3,258 |
| 63. | 97140 | 9.9% | 7.5%(+2.34)#63 | 6.8%(+3.12)#3,311 |
| 64. | 97456 | 9.7% | 7.5%(+2.18)#64 | 6.8%(+2.96)#3,420 |
| 65. | 97213 | 9.6% | 7.5%(+2.05)#65 | 6.8%(+2.83)#3,529 |
| 66. | 97109 | 9.1% | 7.5%(+1.58)#66 | 6.8%(+2.36)#3,942 |
| 67. | 97070 | 9.1% | 7.5%(+1.57)#67 | 6.8%(+2.35)#3,952 |
| 68. | 97350 | 9.1% | 7.5%(+1.55)#68 | 6.8%(+2.33)#3,974 |
| 69. | 97068 | 8.9% | 7.5%(+1.40)#69 | 6.8%(+2.18)#4,119 |
| 70. | 97005 | 8.8% | 7.5%(+1.30)#70 | 6.8%(+2.08)#4,220 |
| 71. | 97844 | 8.8% | 7.5%(+1.26)#71 | 6.8%(+2.04)#4,255 |
| 72. | 97086 | 8.7% | 7.5%(+1.18)#72 | 6.8%(+1.96)#4,333 |
| 73. | 97106 | 8.7% | 7.5%(+1.18)#73 | 6.8%(+1.96)#4,342 |
| 74. | 97703 | 8.6% | 7.5%(+1.06)#74 | 6.8%(+1.84)#4,478 |
| 75. | 97062 | 8.3% | 7.5%(+0.763)#75 | 6.8%(+1.54)#4,852 |
| 76. | 97119 | 8.2% | 7.5%(+0.648)#76 | 6.8%(+1.43)#5,003 |
| 77. | 97410 | 8.1% | 7.5%(+0.603)#77 | 6.8%(+1.38)#5,064 |
| 78. | 97146 | 8.1% | 7.5%(+0.595)#78 | 6.8%(+1.38)#5,072 |
| 79. | 97116 | 8.0% | 7.5%(+0.435)#79 | 6.8%(+1.22)#5,292 |
| 80. | 97405 | 8.0% | 7.5%(+0.418)#80 | 6.8%(+1.20)#5,318 |
| 81. | 97630 | 7.9% | 7.5%(+0.333)#81 | 6.8%(+1.11)#5,436 |
| 82. | 97056 | 7.8% | 7.5%(+0.282)#82 | 6.8%(+1.06)#5,512 |
| 83. | 97321 | 7.8% | 7.5%(+0.279)#83 | 6.8%(+1.06)#5,516 |
| 84. | 97034 | 7.7% | 7.5%(+0.185)#84 | 6.8%(+0.966)#5,646 |
| 85. | 97869 | 7.7% | 7.5%(+0.126)#85 | 6.8%(+0.907)#5,720 |
| 86. | 97444 | 7.7% | 7.5%(+0.105)#86 | 6.8%(+0.885)#5,755 |
| 87. | 97487 | 7.6% | 7.5%(+0.104)#87 | 6.8%(+0.884)#5,756 |
| 88. | 97222 | 7.6% | 7.5%(+0.075)#88 | 6.8%(+0.855)#5,804 |
| 89. | 97845 | 7.6% | 7.5%(+0.073)#89 | 6.8%(+0.853)#5,808 |
| 90. | 97876 | 7.5% | 7.5%(-0.003)#90 | 6.8%(+0.778)#5,926 |
| 91. | 97004 | 7.5% | 7.5%(-0.050)#91 | 6.8%(+0.730)#6,001 |
| 92. | 97462 | 7.4% | 7.5%(-0.098)#92 | 6.8%(+0.683)#6,081 |
| 93. | 97113 | 7.4% | 7.5%(-0.147)#93 | 6.8%(+0.633)#6,172 |
| 94. | 97443 | 7.4% | 7.5%(-0.169)#94 | 6.8%(+0.612)#6,218 |
| 95. | 97302 | 7.4% | 7.5%(-0.192)#95 | 6.8%(+0.588)#6,247 |
| 96. | 97496 | 7.3% | 7.5%(-0.236)#96 | 6.8%(+0.545)#6,296 |
| 97. | 97532 | 7.2% | 7.5%(-0.359)#97 | 6.8%(+0.421)#6,479 |
| 98. | 97039 | 7.1% | 7.5%(-0.402)#98 | 6.8%(+0.378)#6,554 |
| 99. | 97758 | 7.1% | 7.5%(-0.402)#99 | 6.8%(+0.378)#6,563 |
| 100. | 97304 | 7.0% | 7.5%(-0.537)#100 | 6.8%(+0.244)#6,783 |
Common Questions
What are the Top 10 Zip Codes with the Highest Percentage of Population Employed in Computer, Engineering & Science in Oregon?
Top 10 Zip Codes with the Highest Percentage of Population Employed in Computer, Engineering & Science in Oregon are:
What zip code has the Highest Percentage of Population Employed in Computer, Engineering & Science in Oregon?
97903 has the Highest Percentage of Population Employed in Computer, Engineering & Science in Oregon with 100.0%.
What is the Percentage of Population Employed in Computer, Engineering & Science in the State of Oregon?
Percentage of Population Employed in Computer, Engineering & Science in Oregon is 7.5%.
What is the Percentage of Population Employed in Computer, Engineering & Science in the United States?
Percentage of Population Employed in Computer, Engineering & Science in the United States is 6.8%.