Zip Codes with the Highest Percentage of Population Employed in Transportation & Warehousing in Bellingham, WA
RELATED REPORTS & OPTIONS
Transportation & Warehousing
Bellingham
Compare Zip Codes
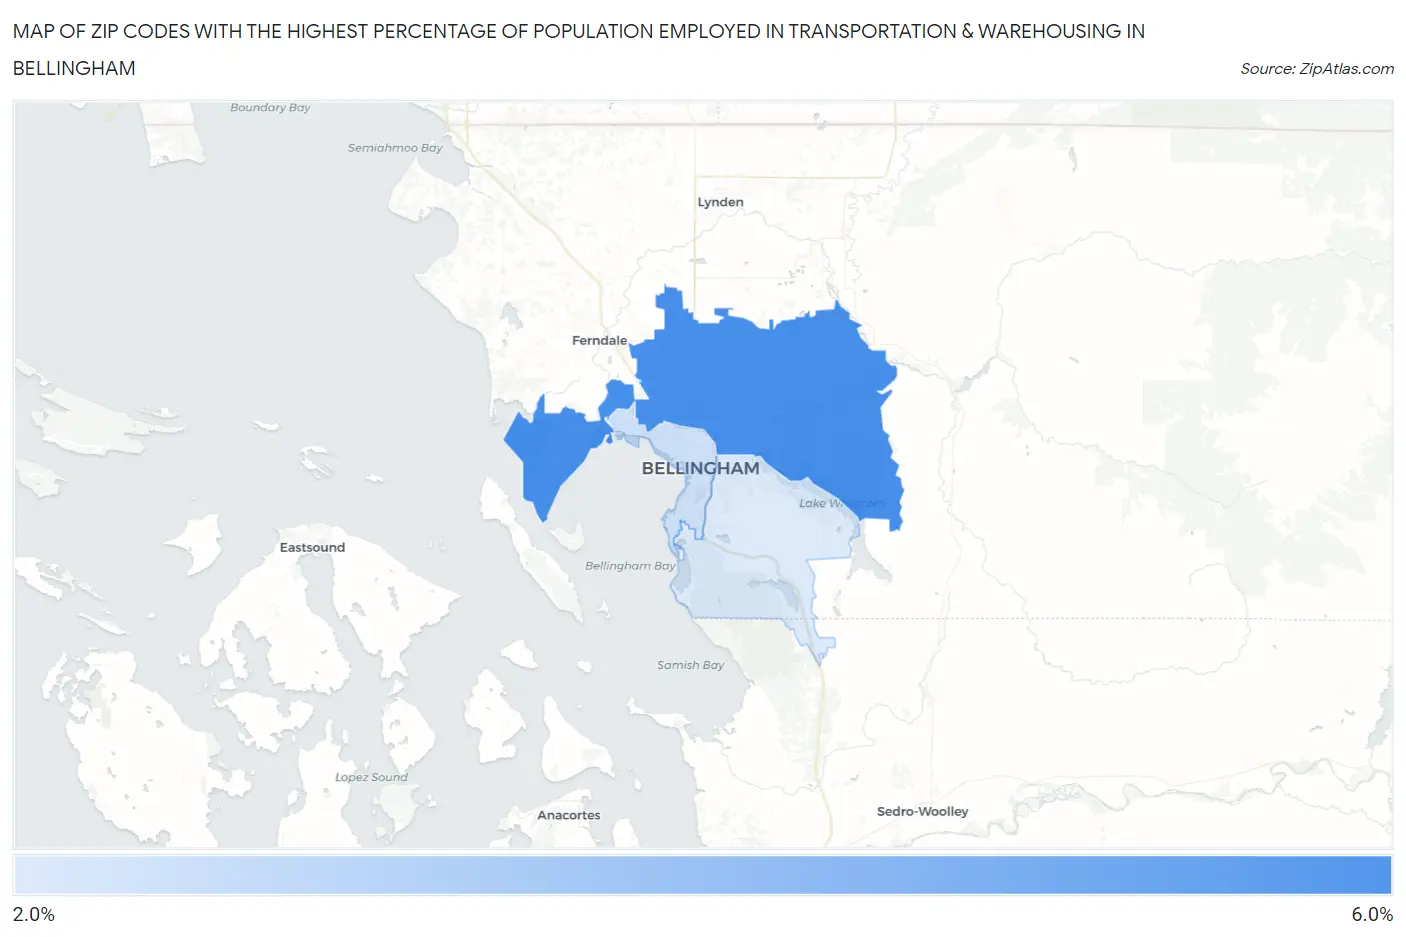
Map of Zip Codes with the Highest Percentage of Population Employed in Transportation & Warehousing in Bellingham
2.5%
5.2%
Zip Codes with the Highest Percentage of Population Employed in Transportation & Warehousing in Bellingham, WA
| Zip Code | % Employed | vs State | vs National | |
| 1. | 98226 | 5.2% | 4.9%(+0.296)#204 | 4.9%(+0.264)#11,205 |
| 2. | 98225 | 2.8% | 4.9%(-2.16)#377 | 4.9%(-2.19)#21,310 |
| 3. | 98229 | 2.5% | 4.9%(-2.40)#406 | 4.9%(-2.43)#22,349 |
1
Common Questions
What are the Top Zip Codes with the Highest Percentage of Population Employed in Transportation & Warehousing in Bellingham, WA?
Top Zip Codes with the Highest Percentage of Population Employed in Transportation & Warehousing in Bellingham, WA are:
What zip code has the Highest Percentage of Population Employed in Transportation & Warehousing in Bellingham, WA?
98226 has the Highest Percentage of Population Employed in Transportation & Warehousing in Bellingham, WA with 5.2%.
What is the Percentage of Population Employed in Transportation & Warehousing in Bellingham, WA?
Percentage of Population Employed in Transportation & Warehousing in Bellingham is 3.5%.
What is the Percentage of Population Employed in Transportation & Warehousing in Washington?
Percentage of Population Employed in Transportation & Warehousing in Washington is 4.9%.
What is the Percentage of Population Employed in Transportation & Warehousing in the United States?
Percentage of Population Employed in Transportation & Warehousing in the United States is 4.9%.