Zip Codes with the Highest Percentage of Population with a Degree in Computers and Mathematics in Bellingham, WA
RELATED REPORTS & OPTIONS
Computers and Mathematics
Bellingham
Compare Zip Codes
Map of Zip Codes with the Highest Percentage of Population with a Degree in Computers and Mathematics in Bellingham
3.1%
4.0%
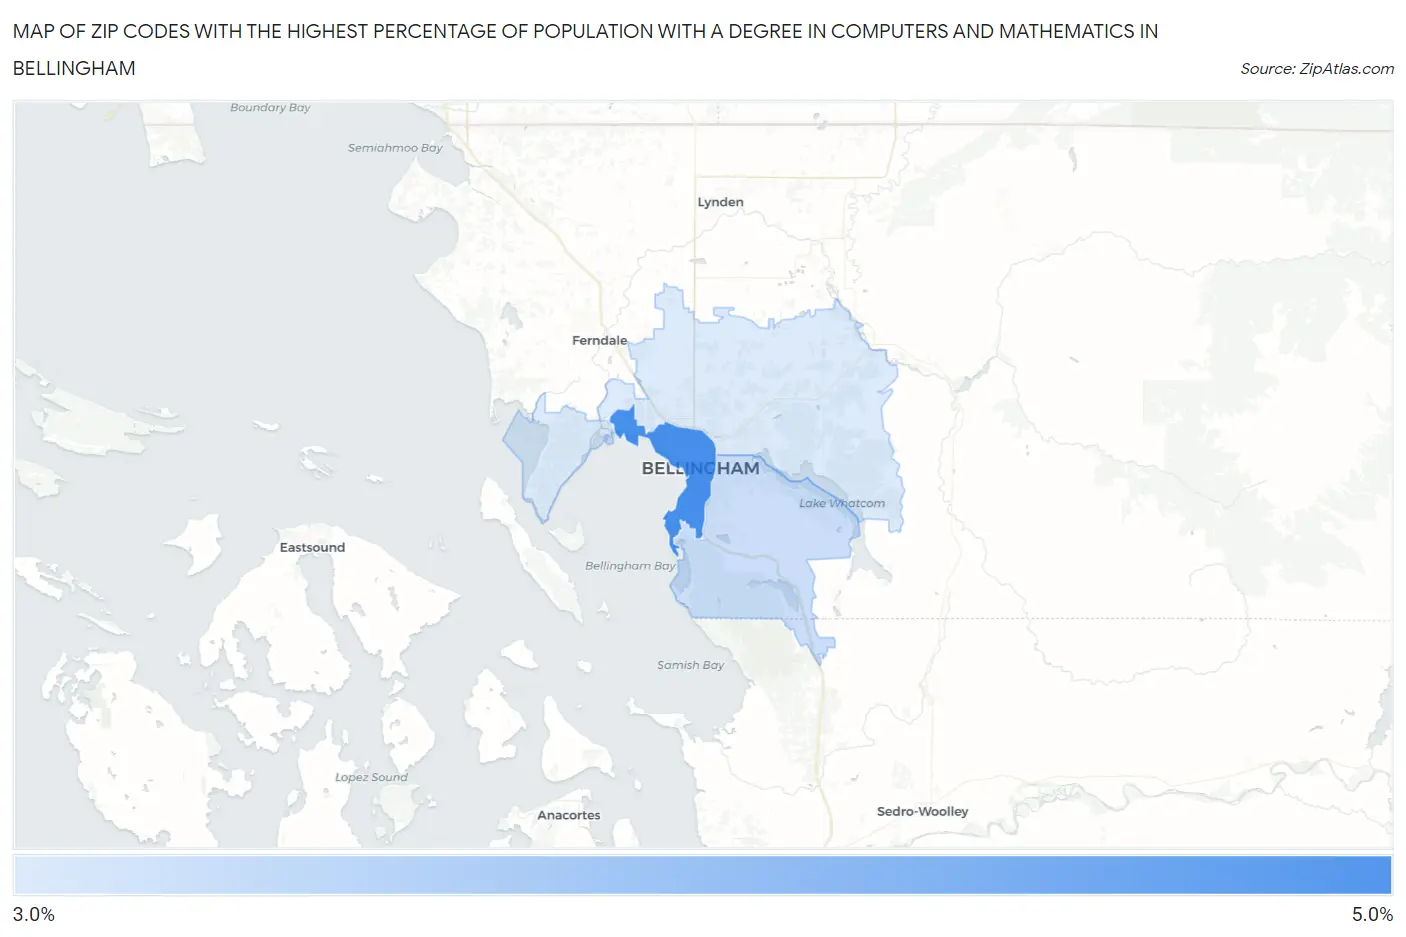
Zip Codes with the Highest Percentage of Population with a Degree in Computers and Mathematics in Bellingham, WA
| Zip Code | % Graduates | vs State | vs National | |
| 1. | 98225 | 4.0% | 7.0%(-2.94)#243 | 4.9%(-0.875)#10,408 |
| 2. | 98229 | 3.2% | 7.0%(-3.76)#296 | 4.9%(-1.69)#13,372 |
| 3. | 98226 | 3.1% | 7.0%(-3.88)#301 | 4.9%(-1.81)#13,773 |
1
Common Questions
What are the Top Zip Codes with the Highest Percentage of Population with a Degree in Computers and Mathematics in Bellingham, WA?
Top Zip Codes with the Highest Percentage of Population with a Degree in Computers and Mathematics in Bellingham, WA are:
What zip code has the Highest Percentage of Population with a Degree in Computers and Mathematics in Bellingham, WA?
98225 has the Highest Percentage of Population with a Degree in Computers and Mathematics in Bellingham, WA with 4.0%.
What is the Percentage of Population with a Degree in Computers and Mathematics in Bellingham, WA?
Percentage of Population with a Degree in Computers and Mathematics in Bellingham is 3.4%.
What is the Percentage of Population with a Degree in Computers and Mathematics in Washington?
Percentage of Population with a Degree in Computers and Mathematics in Washington is 7.0%.
What is the Percentage of Population with a Degree in Computers and Mathematics in the United States?
Percentage of Population with a Degree in Computers and Mathematics in the United States is 4.9%.