Zip Codes with the Highest Percentage of Population Employed in Business & Financial in Bellingham, WA
RELATED REPORTS & OPTIONS
Business & Financial
Bellingham
Compare Zip Codes
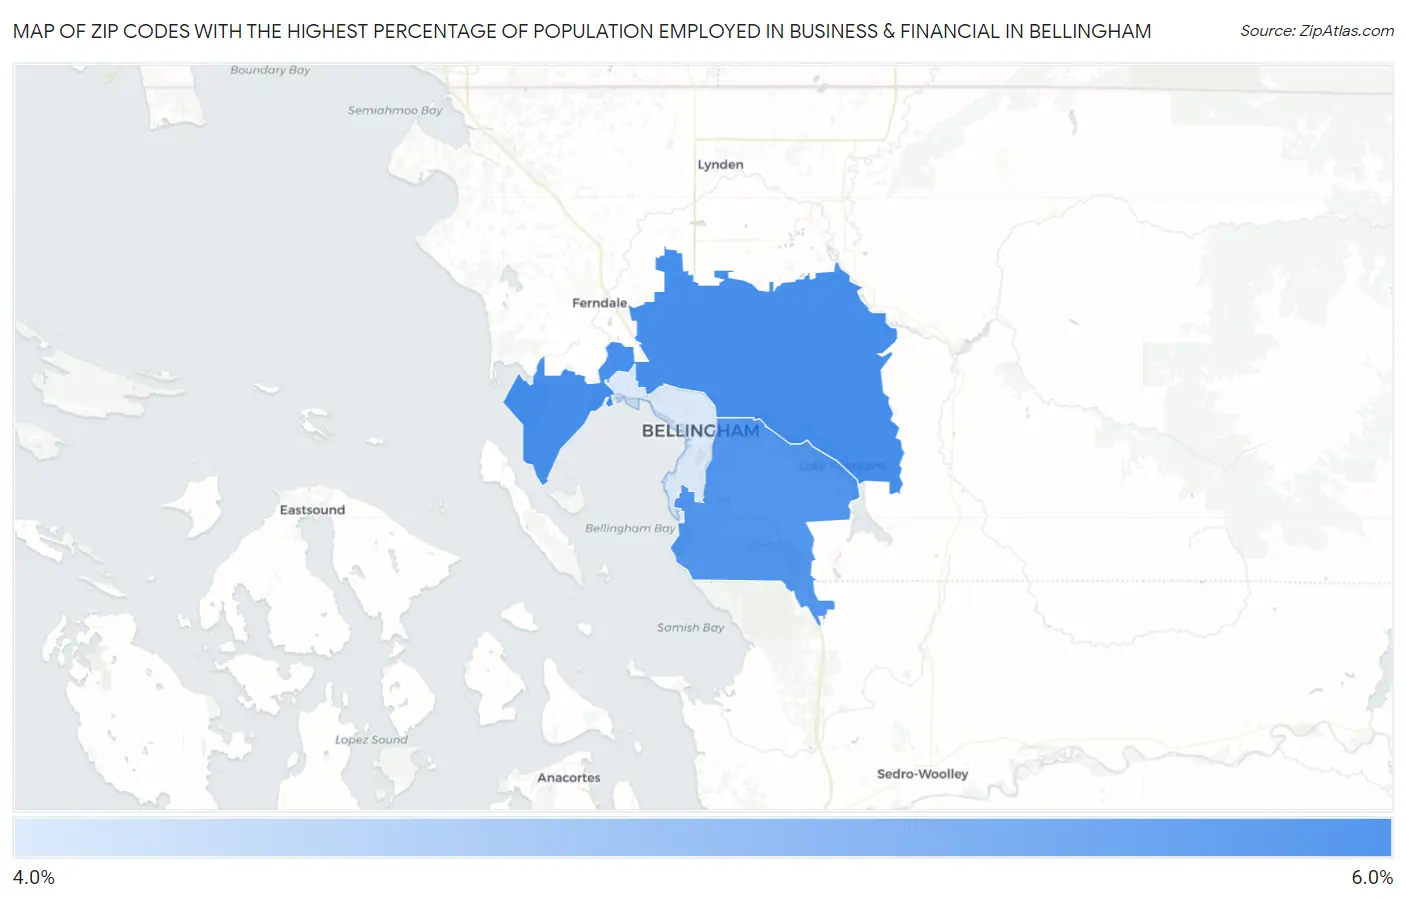
Map of Zip Codes with the Highest Percentage of Population Employed in Business & Financial in Bellingham
4.4%
5.8%
Zip Codes with the Highest Percentage of Population Employed in Business & Financial in Bellingham, WA
| Zip Code | % Employed | vs State | vs National | |
| 1. | 98226 | 5.8% | 5.9%(-0.137)#165 | 5.8%(+0.040)#8,301 |
| 2. | 98229 | 5.7% | 5.9%(-0.248)#174 | 5.8%(-0.071)#8,559 |
| 3. | 98225 | 4.4% | 5.9%(-1.49)#261 | 5.8%(-1.31)#12,259 |
1
Common Questions
What are the Top Zip Codes with the Highest Percentage of Population Employed in Business & Financial in Bellingham, WA?
Top Zip Codes with the Highest Percentage of Population Employed in Business & Financial in Bellingham, WA are:
What zip code has the Highest Percentage of Population Employed in Business & Financial in Bellingham, WA?
98226 has the Highest Percentage of Population Employed in Business & Financial in Bellingham, WA with 5.8%.
What is the Percentage of Population Employed in Business & Financial in Bellingham, WA?
Percentage of Population Employed in Business & Financial in Bellingham is 5.3%.
What is the Percentage of Population Employed in Business & Financial in Washington?
Percentage of Population Employed in Business & Financial in Washington is 5.9%.
What is the Percentage of Population Employed in Business & Financial in the United States?
Percentage of Population Employed in Business & Financial in the United States is 5.8%.