Zip Codes with the Highest Percentage of Population Employed in Accommodation & Food Services in Bellingham, WA
RELATED REPORTS & OPTIONS
Accommodation & Food Services
Bellingham
Compare Zip Codes
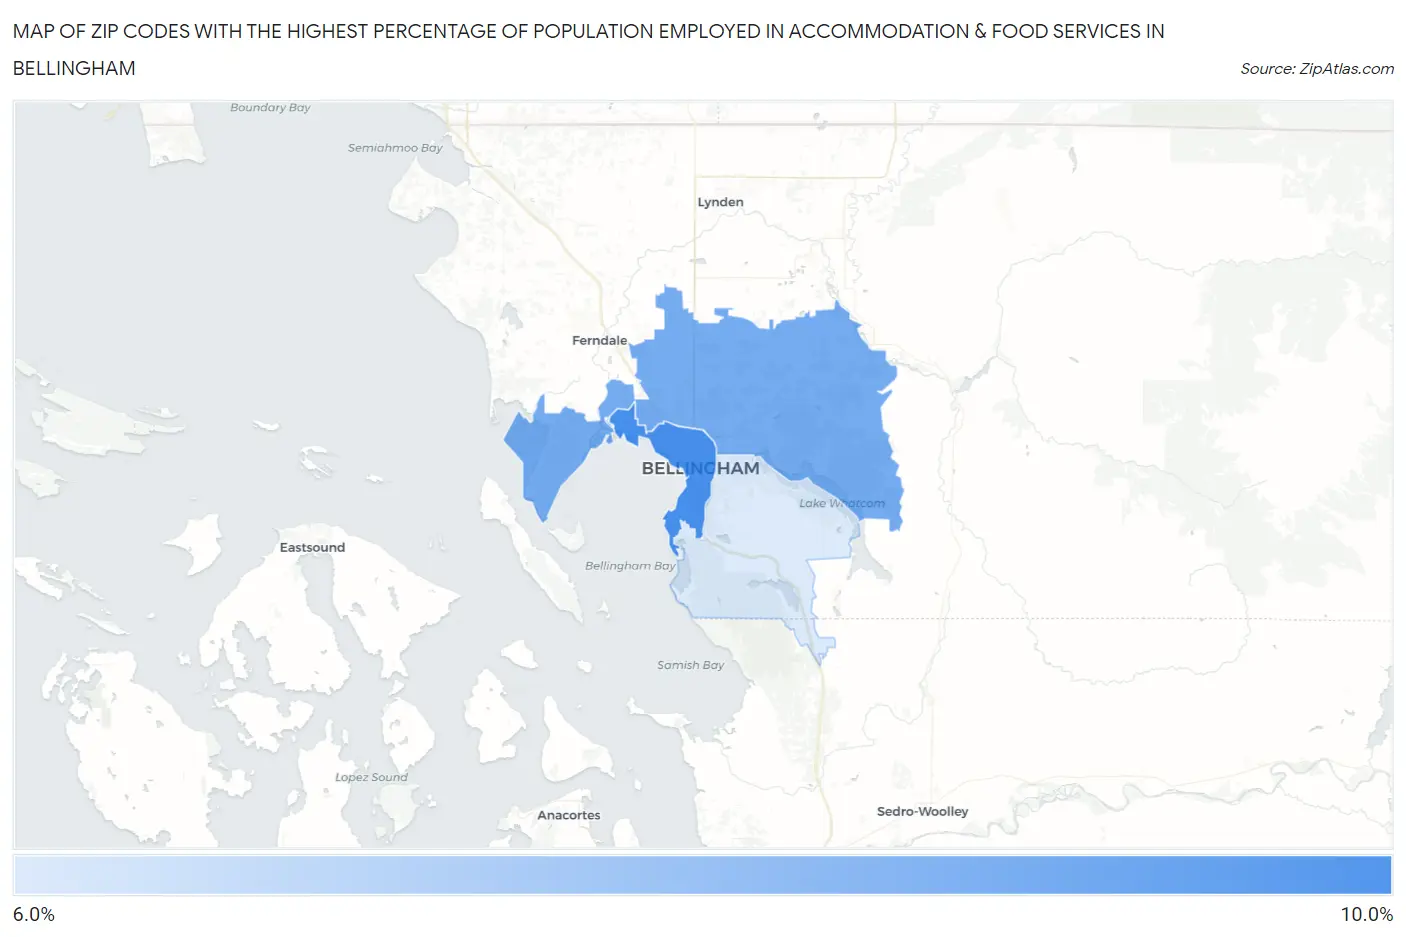
Map of Zip Codes with the Highest Percentage of Population Employed in Accommodation & Food Services in Bellingham
6.9%
9.7%
Zip Codes with the Highest Percentage of Population Employed in Accommodation & Food Services in Bellingham, WA
| Zip Code | % Employed | vs State | vs National | |
| 1. | 98225 | 9.7% | 6.5%(+3.20)#88 | 6.9%(+2.78)#4,978 |
| 2. | 98226 | 8.8% | 6.5%(+2.33)#109 | 6.9%(+1.91)#6,291 |
| 3. | 98229 | 6.9% | 6.5%(+0.387)#207 | 6.9%(-0.031)#10,723 |
1
Common Questions
What are the Top Zip Codes with the Highest Percentage of Population Employed in Accommodation & Food Services in Bellingham, WA?
Top Zip Codes with the Highest Percentage of Population Employed in Accommodation & Food Services in Bellingham, WA are:
What zip code has the Highest Percentage of Population Employed in Accommodation & Food Services in Bellingham, WA?
98225 has the Highest Percentage of Population Employed in Accommodation & Food Services in Bellingham, WA with 9.7%.
What is the Percentage of Population Employed in Accommodation & Food Services in Bellingham, WA?
Percentage of Population Employed in Accommodation & Food Services in Bellingham is 10.3%.
What is the Percentage of Population Employed in Accommodation & Food Services in Washington?
Percentage of Population Employed in Accommodation & Food Services in Washington is 6.5%.
What is the Percentage of Population Employed in Accommodation & Food Services in the United States?
Percentage of Population Employed in Accommodation & Food Services in the United States is 6.9%.