Zip Codes with the Highest Percentage of Population Employed in Administrative & Support Services in Bellingham, WA

RELATED REPORTS & OPTIONS

Administrative & Support Services
Population
Families and Households
Female Fertility
Female Fertility (Unmarried)
Race (Community Size)
Race (Percentage)
Ancestry (Community Size)
AfricanAlaska NativeAlbanianAleutAmericanArabArgentineanArmenianAustralianAustrianBelgianBhutaneseBlackfeetBolivianBrazilianBritishBurmeseCajunCanadianCentral AmericanCentral American IndianCherokeeChippewaChoctawColombianComancheCosta RicanCroatianCubanCzechCzechoslovakianDanishDutchEastern EuropeanEgyptianEnglishEthiopianEuropeanFilipinoFinnishFrenchFrench American IndianFrench CanadianGermanGreekGuamanian / ChamorroGuatemalanHonduranHungarianIcelanderIndian (Asian)InupiatIranianIrishItalianJamaicanJapaneseJordanianKoreanLatvianLebaneseLithuanianMexicanMexican American IndianMongolianNative HawaiianNavajoNicaraguanNorthern EuropeanNorwegianPakistaniPanamanianPennsylvania GermanPeruvianPolishPortuguesePuerto RicanPuget Sound SalishRomanianRussianSalvadoranSamoanScandinavianScotch-IrishScottishSerbianSiouxSlavicSlovakSloveneSouth AmericanSpaniardSpanishSri LankanSubsaharan AfricanSwedishSwissThaiTlingit-HaidaTonganUkrainianVenezuelanWelshYugoslavian
Ancestry (Percentage)
AfricanAlaska NativeAlbanianAleutAmericanArabArgentineanArmenianAustralianAustrianBelgianBhutaneseBlackfeetBolivianBrazilianBritishBurmeseCajunCanadianCentral AmericanCentral American IndianCherokeeChippewaChoctawColombianComancheCosta RicanCroatianCubanCzechCzechoslovakianDanishDutchEastern EuropeanEgyptianEnglishEthiopianEuropeanFilipinoFinnishFrenchFrench American IndianFrench CanadianGermanGreekGuamanian / ChamorroGuatemalanHonduranHungarianIcelanderIndian (Asian)InupiatIranianIrishItalianJamaicanJapaneseJordanianKoreanLatvianLebaneseLithuanianMexicanMexican American IndianMongolianNative HawaiianNavajoNicaraguanNorthern EuropeanNorwegianPakistaniPanamanianPennsylvania GermanPeruvianPolishPortuguesePuerto RicanPuget Sound SalishRomanianRussianSalvadoranSamoanScandinavianScotch-IrishScottishSerbianSiouxSlavicSlovakSloveneSouth AmericanSpaniardSpanishSri LankanSubsaharan AfricanSwedishSwissThaiTlingit-HaidaTonganUkrainianVenezuelanWelshYugoslavian
Immigrant Origin (Total)
Immigrant Origin (Percentage)
Income
Income (Families)
Income (Households)
Poverty
Poverty (Families)
Unemployment
Employment Occupations
Employment Industries
Employer Class
Commute Time
Commute Means
School Enrollment
Education by Degree Field
Occupancy
Finances
Physical Characteristics
Bellingham
Compare Zip Codes
Comparison Subject

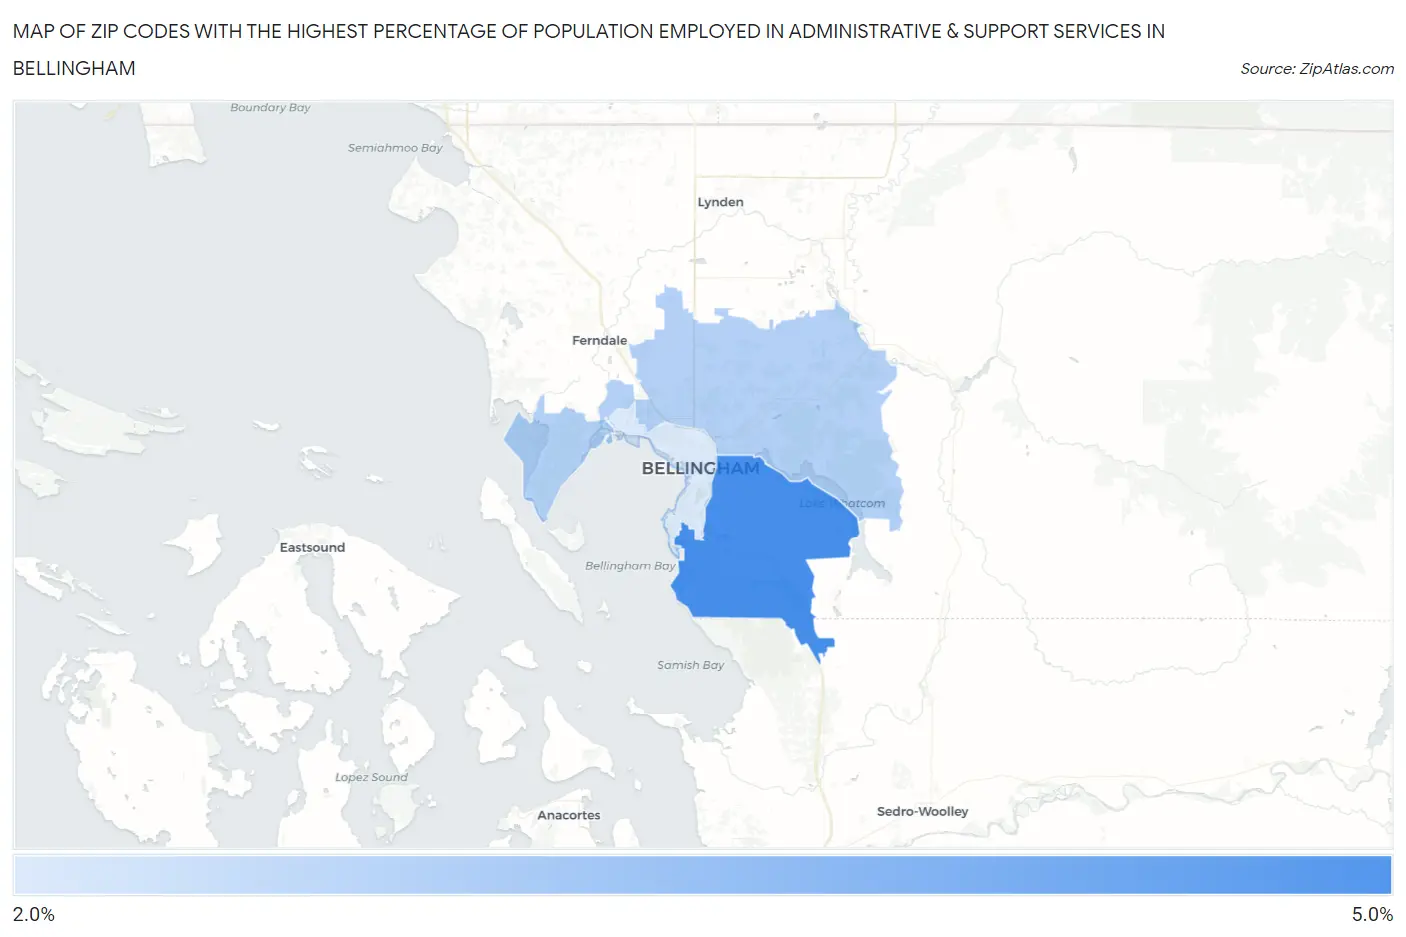
Map of Zip Codes with the Highest Percentage of Population Employed in Administrative & Support Services in Bellingham

0.0%
5.0%
Zip Codes with the Highest Percentage of Population Employed in Administrative & Support Services in Bellingham Map

Zip Codes with the Highest Percentage of Population Employed in Administrative & Support Services in Bellingham, WA

Zip Code % Employed vs State vs National
1.982294.4%3.8%(+0.613)#1524.1%(+0.229)#9,164
2.982262.9%3.8%(-0.858)#3144.1%(-1.24)#15,954
3.982252.4%3.8%(-1.41)#3784.1%(-1.80)#18,918

Common Questions

What are the Top Zip Codes with the Highest Percentage of Population Employed in Administrative & Support Services in Bellingham, WA?
Top Zip Codes with the Highest Percentage of Population Employed in Administrative & Support Services in Bellingham, WA are:
#1
4.4%
#2
2.9%
#3
2.4%
What zip code has the Highest Percentage of Population Employed in Administrative & Support Services in Bellingham, WA?
98229 has the Highest Percentage of Population Employed in Administrative & Support Services in Bellingham, WA with 4.4%.
What is the Percentage of Population Employed in Administrative & Support Services in Bellingham, WA?
Percentage of Population Employed in Administrative & Support Services in Bellingham is 2.7%.
What is the Percentage of Population Employed in Administrative & Support Services in Washington?
Percentage of Population Employed in Administrative & Support Services in Washington is 3.8%.
What is the Percentage of Population Employed in Administrative & Support Services in the United States?
Percentage of Population Employed in Administrative & Support Services in the United States is 4.1%.