Zip Codes with the Highest Percentage of Population Employed in Agriculture, Fishing & Hunting in Bellingham, WA
RELATED REPORTS & OPTIONS
Agriculture, Fishing & Hunting
Bellingham
Compare Zip Codes
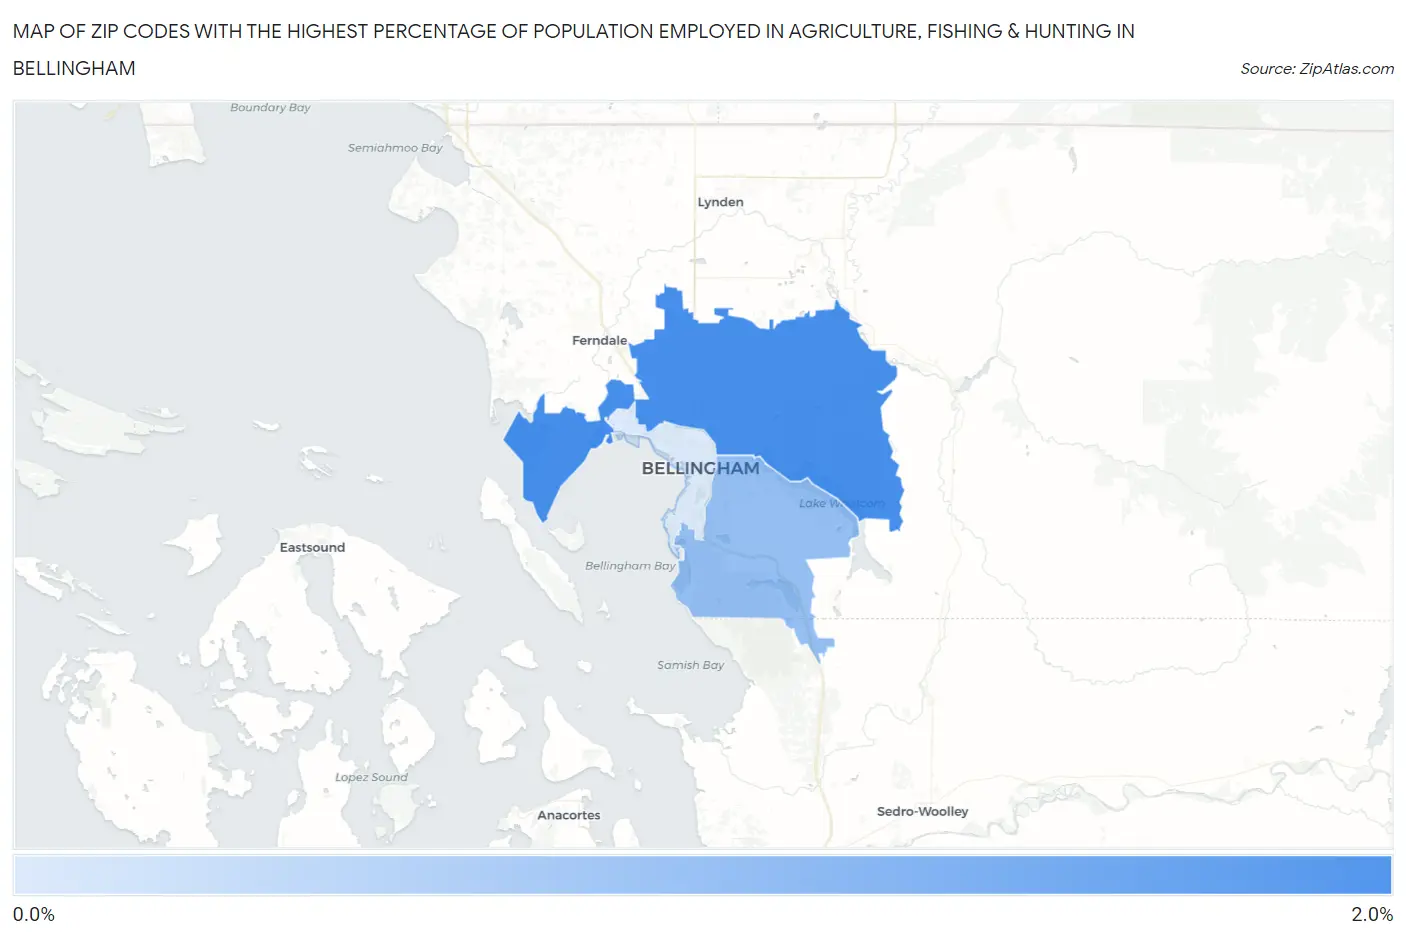
Map of Zip Codes with the Highest Percentage of Population Employed in Agriculture, Fishing & Hunting in Bellingham
0.67%
1.7%
Zip Codes with the Highest Percentage of Population Employed in Agriculture, Fishing & Hunting in Bellingham, WA
| Zip Code | % Employed | vs State | vs National | |
| 1. | 98226 | 1.7% | 2.4%(-0.728)#294 | 1.2%(+0.463)#13,763 |
| 2. | 98229 | 1.1% | 2.4%(-1.26)#331 | 1.2%(-0.065)#15,660 |
| 3. | 98225 | 0.67% | 2.4%(-1.72)#382 | 1.2%(-0.533)#18,042 |
1
Common Questions
What are the Top Zip Codes with the Highest Percentage of Population Employed in Agriculture, Fishing & Hunting in Bellingham, WA?
Top Zip Codes with the Highest Percentage of Population Employed in Agriculture, Fishing & Hunting in Bellingham, WA are:
What zip code has the Highest Percentage of Population Employed in Agriculture, Fishing & Hunting in Bellingham, WA?
98226 has the Highest Percentage of Population Employed in Agriculture, Fishing & Hunting in Bellingham, WA with 1.7%.
What is the Percentage of Population Employed in Agriculture, Fishing & Hunting in Bellingham, WA?
Percentage of Population Employed in Agriculture, Fishing & Hunting in Bellingham is 0.85%.
What is the Percentage of Population Employed in Agriculture, Fishing & Hunting in Washington?
Percentage of Population Employed in Agriculture, Fishing & Hunting in Washington is 2.4%.
What is the Percentage of Population Employed in Agriculture, Fishing & Hunting in the United States?
Percentage of Population Employed in Agriculture, Fishing & Hunting in the United States is 1.2%.