Zip Codes with the Highest Percentage of Population Employed in Office & Administration in Bellingham, WA
RELATED REPORTS & OPTIONS
Office & Administration
Bellingham
Compare Zip Codes
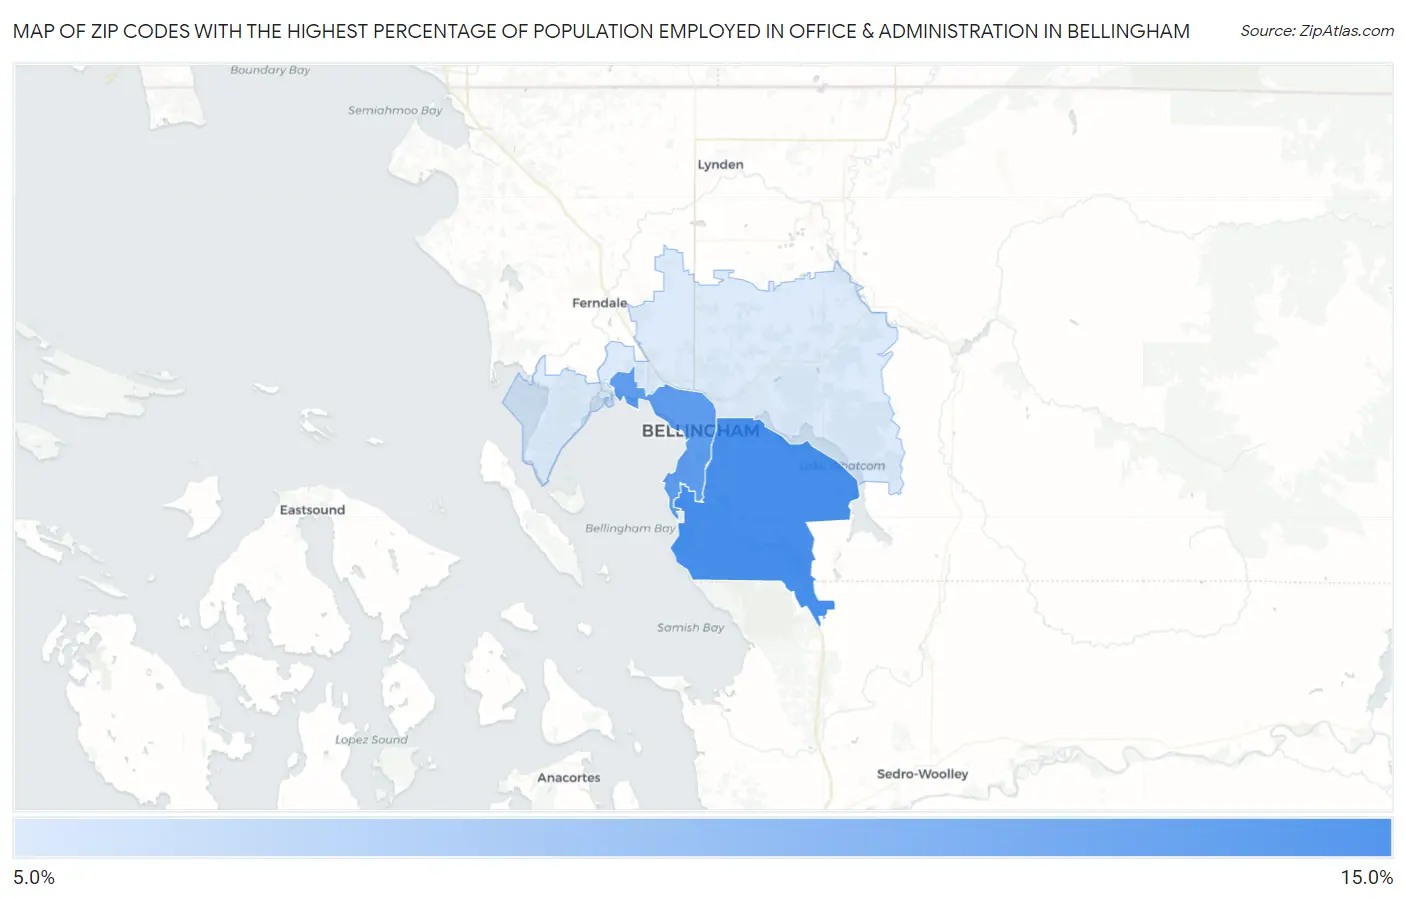
Map of Zip Codes with the Highest Percentage of Population Employed in Office & Administration in Bellingham
9.6%
10.6%
Zip Codes with the Highest Percentage of Population Employed in Office & Administration in Bellingham, WA
| Zip Code | % Employed | vs State | vs National | |
| 1. | 98229 | 10.6% | 9.8%(+0.786)#220 | 10.9%(-0.275)#15,197 |
| 2. | 98225 | 10.4% | 9.8%(+0.629)#231 | 10.9%(-0.432)#15,740 |
| 3. | 98226 | 9.6% | 9.8%(-0.198)#289 | 10.9%(-1.26)#18,423 |
1
Common Questions
What are the Top Zip Codes with the Highest Percentage of Population Employed in Office & Administration in Bellingham, WA?
Top Zip Codes with the Highest Percentage of Population Employed in Office & Administration in Bellingham, WA are:
What zip code has the Highest Percentage of Population Employed in Office & Administration in Bellingham, WA?
98229 has the Highest Percentage of Population Employed in Office & Administration in Bellingham, WA with 10.6%.
What is the Percentage of Population Employed in Office & Administration in Bellingham, WA?
Percentage of Population Employed in Office & Administration in Bellingham is 10.2%.
What is the Percentage of Population Employed in Office & Administration in Washington?
Percentage of Population Employed in Office & Administration in Washington is 9.8%.
What is the Percentage of Population Employed in Office & Administration in the United States?
Percentage of Population Employed in Office & Administration in the United States is 10.9%.