Zip Codes with the Highest Percentage of Population Employed in Arts, Media & Entertainment in Bellingham, WA
RELATED REPORTS & OPTIONS
Arts, Media & Entertainment
Bellingham
Compare Zip Codes
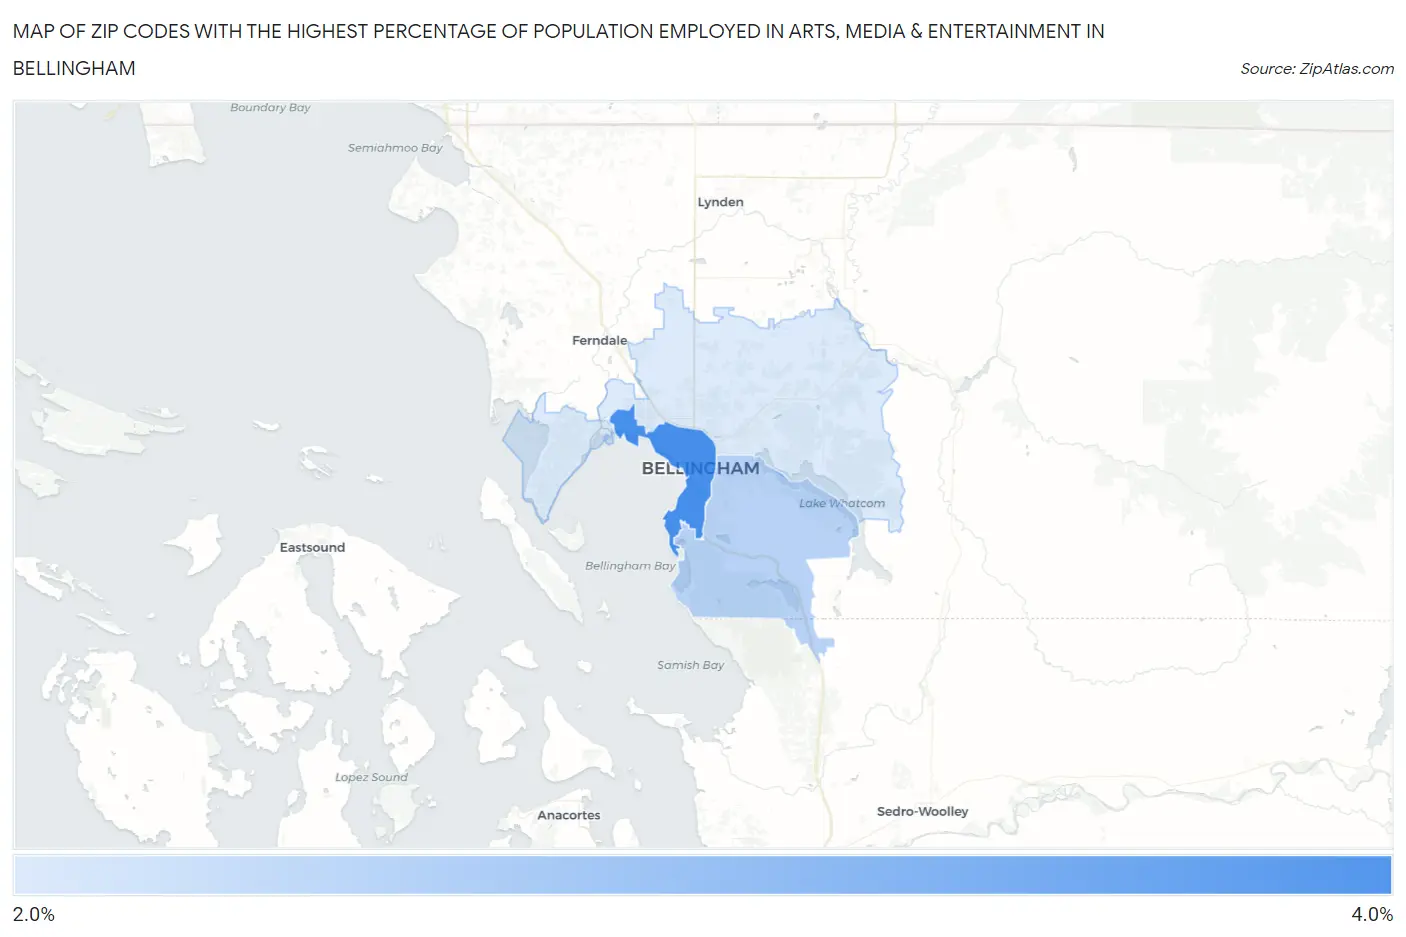
Map of Zip Codes with the Highest Percentage of Population Employed in Arts, Media & Entertainment in Bellingham
2.3%
3.0%
Zip Codes with the Highest Percentage of Population Employed in Arts, Media & Entertainment in Bellingham, WA
| Zip Code | % Employed | vs State | vs National | |
| 1. | 98225 | 3.0% | 2.1%(+0.929)#92 | 2.1%(+0.951)#4,048 |
| 2. | 98229 | 2.5% | 2.1%(+0.430)#121 | 2.1%(+0.452)#5,513 |
| 3. | 98226 | 2.3% | 2.1%(+0.262)#141 | 2.1%(+0.284)#6,165 |
1
Common Questions
What are the Top Zip Codes with the Highest Percentage of Population Employed in Arts, Media & Entertainment in Bellingham, WA?
Top Zip Codes with the Highest Percentage of Population Employed in Arts, Media & Entertainment in Bellingham, WA are:
What zip code has the Highest Percentage of Population Employed in Arts, Media & Entertainment in Bellingham, WA?
98225 has the Highest Percentage of Population Employed in Arts, Media & Entertainment in Bellingham, WA with 3.0%.
What is the Percentage of Population Employed in Arts, Media & Entertainment in Bellingham, WA?
Percentage of Population Employed in Arts, Media & Entertainment in Bellingham is 2.7%.
What is the Percentage of Population Employed in Arts, Media & Entertainment in Washington?
Percentage of Population Employed in Arts, Media & Entertainment in Washington is 2.1%.
What is the Percentage of Population Employed in Arts, Media & Entertainment in the United States?
Percentage of Population Employed in Arts, Media & Entertainment in the United States is 2.1%.